Function Points Project Tracking
31
Role 2 - 1 Project Tracking Project Tracking Using Functional Using Functional Size Measurement Size Measurement “Without objective data you are just another person with an opinion” Presented by : Pam Morris TOTAL METRICS 7th Australian Management Performance Symposium Canberra February 2003
-
Upload
sudhakarasoorna -
Category
Documents
-
view
219 -
download
0
Transcript of Function Points Project Tracking

8/8/2019 Function Points Project Tracking
http://slidepdf.com/reader/full/function-points-project-tracking 1/31
Role 2 - 1
Project TrackingProject Tracking
Using FunctionalUsing Functional
Size MeasurementSize Measurement
“Without objective data you are just another person with an opinion”
Presented by : Pam Morris
TOTAL METRICS
7th Australian Management Performance Symposium
Canberra February 2003

8/8/2019 Function Points Project Tracking
http://slidepdf.com/reader/full/function-points-project-tracking 2/31
Role 2 - 2
AgendaFunctionality Based Software
Tracking ModelProduct tracking model
Overview of Functional SizeMeasurement technique
Tracking Project ProgressReporting Project Progress
Benefits and Limitations

8/8/2019 Function Points Project Tracking
http://slidepdf.com/reader/full/function-points-project-tracking 3/31

8/8/2019 Function Points Project Tracking
http://slidepdf.com/reader/full/function-points-project-tracking 4/31Role 2 - 4
Process Based
Tracking
Measures project progress by thecompletion of processes
Project Work items tracked = tasks andactivities
Project Costs, Effort and Schedule are
allocated to activities based on phased breakdown

8/8/2019 Function Points Project Tracking
http://slidepdf.com/reader/full/function-points-project-tracking 5/31Role 2 - 5
Product Based TrackingMeasures project progress by completeness
of individual software product components Project work items tracked = functional
requirements
Work items may be equivalent to:
Functional modules
Requirements statementsUse Cases
Base Functional Components(as defined in ISO/IEC 14143-1)

8/8/2019 Function Points Project Tracking
http://slidepdf.com/reader/full/function-points-project-tracking 6/31Role 2 - 6
ISO/IEC 14143-1
Functional SizeMeasurement
Functional User Requirements“ A sub-set of the user requirements. TheFunctional User Requirements represent theuser practices and procedures that the softwaremust perform to fulfil the users’ needs. They exclude Quality Requirements and any
Technical Requirements.”
Base F unctional C omponent ( BFC )“ An elementary unit of functional user
requirements defined by and used by an FSM
Method for measurement purposes.”

8/8/2019 Function Points Project Tracking
http://slidepdf.com/reader/full/function-points-project-tracking 7/31Role 2 - 7
ISO/IEC 14143-1
Functional SizeMeasurement
ISO/IEC approved methods for FSM :
ISO/IEC 20926 - IFPUG Function Point Method ISOIEC 20968 - MKII Function Point Method
ISO IEC 19761 - COSMIC-FFP Functional Size
Method
F unctional S ize M easurement M ethod “FSM Method: A specific implementation of FSM
defined by a set of rules, which conforms to the
mandatory features of this part of ISO/IEC 14143”

8/8/2019 Function Points Project Tracking
http://slidepdf.com/reader/full/function-points-project-tracking 8/31Role 2 - 8
Functional Size Based
Tracking Each Base Functional Unit is measured for
size in function points Project Effort is allocated to each Base
Functional Unit based its functional size andthe assigned productivity rate
Tracking compares actual effort consumed fothat BFC to earned effort based on function
points completed
Project scope changes can be quantitativelytracked and measured in function pointsimpacted
Project estimates can be made at functionalrequirements stage based on functional size

8/8/2019 Function Points Project Tracking
http://slidepdf.com/reader/full/function-points-project-tracking 9/31
8/8/2019 Function Points Project Tracking
http://slidepdf.com/reader/full/function-points-project-tracking 10/31
Role 2 - 10
Origins of Functional
Size Measurement Developed late 1970’s by Alan
Albrecht at IBM
Needed a measure of size which was
independent of language, tools,techniques and technology
Size = functions delivered to the
user
Allowed comparative measures of
productivity ISO standard 14143 :1998
Ch t i ti f

8/8/2019 Function Points Project Tracking
http://slidepdf.com/reader/full/function-points-project-tracking 11/31
Role 2 - 11
Characteristics of
Functional SizeMeasurement
Measures Functional User Requirements
external ‘User ’ view
applied any time in SDLC
derived in terms understood by users
derived without reference to:
effort
methods used
physical or technical components

8/8/2019 Function Points Project Tracking
http://slidepdf.com/reader/full/function-points-project-tracking 12/31
Role 2 - 12
IFPUG
Base Functional Components
Processes
eg. Modify Job Details
Enquire Job Details
Report Job Allocations
Data
eg. Job Details
Employee Data
IFPUG FSM Method

8/8/2019 Function Points Project Tracking
http://slidepdf.com/reader/full/function-points-project-tracking 13/31
Role 2 - 13
IFPUG FSM Method
Measured components
Data
INPUT
to Store
Information
Extracted
as OUTPUT
ENQUIRY
on stored
Data
PAYROLL
APPLICATION
PERSONNEL
APPLICATION
EXTERNAL
Referenced Data
INTERNAL
Stored Data
Points are
allocated to each
Transaction andData File based
on the type and
complexity of
the function.
St i P d t T ki

8/8/2019 Function Points Project Tracking
http://slidepdf.com/reader/full/function-points-project-tracking 14/31
Role 2 - 14
Steps in Product Tracking Decompose Product into Base Functional Components
(IFPUG method groups BFCs by: Transactions
Data Groups)
Measure Function Size of each BFC in function points
(FPs) Determine Productivity Rate to deliver a function point
Map Project Phase to Completeness Indicator
Calculate Project Resource Estimates using FPs Predict total Effort Hours
Predict total Elapsed time (duration)
Predict total Costs
Assign Predicted Effort hours to each function
Record Project Metrics Effort expended against each function
Completion Status of each function
Report Completion status of Project

8/8/2019 Function Points Project Tracking
http://slidepdf.com/reader/full/function-points-project-tracking 15/31
1. Decompose Product
Transaction BFCs
Data Group BFCs
8/8/2019 Function Points Project Tracking
http://slidepdf.com/reader/full/function-points-project-tracking 16/31
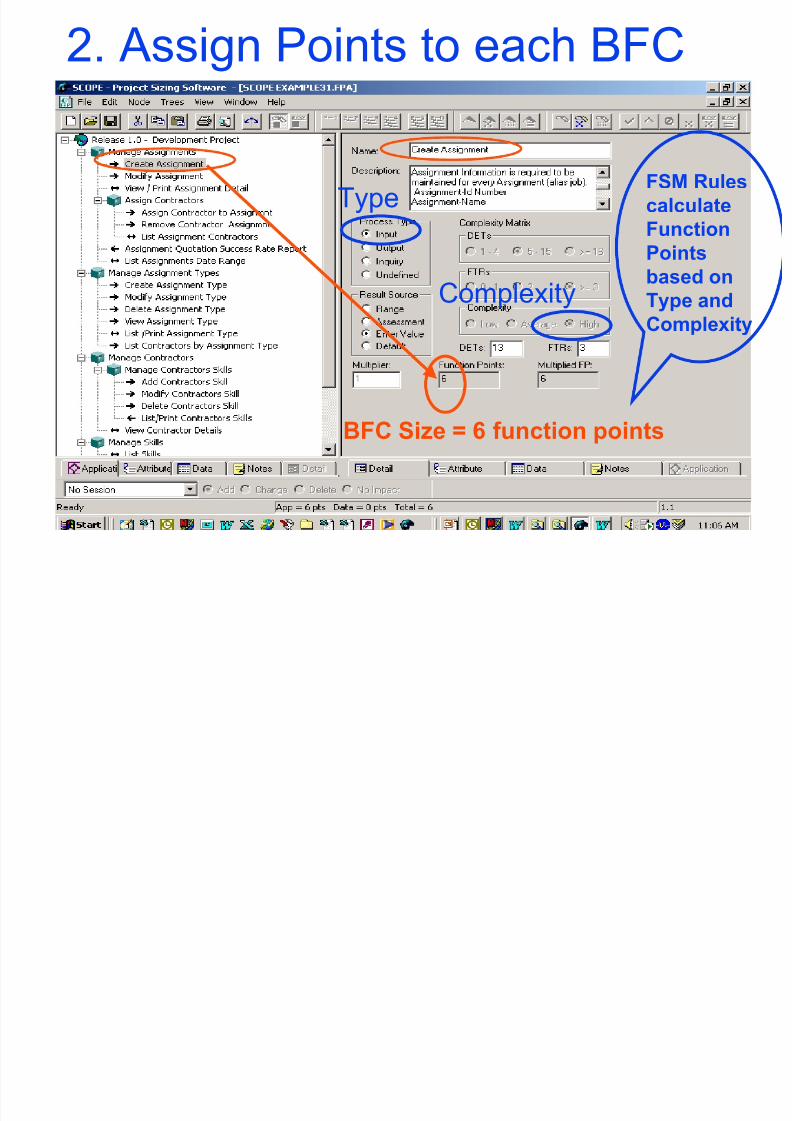
2. Assign Points to each BFC
FSM Rulescalculate
Function
Points
based onType and
Complexity
BFC Size = 6 function points
Complexity
Type

8/8/2019 Function Points Project Tracking
http://slidepdf.com/reader/full/function-points-project-tracking 17/31

8/8/2019 Function Points Project Tracking
http://slidepdf.com/reader/full/function-points-project-tracking 18/31
BFC size = 7
function points 7
2. Assign Points to each BFC

8/8/2019 Function Points Project Tracking
http://slidepdf.com/reader/full/function-points-project-tracking 19/31
Role 2 - 19
Productivity rate
= effort hours / function point of productdelivered
Use Industry based figures
International Software Benchmarking Group
(ISBSG) - Publicly Available Data based onFunctional Size measurement
Release 8, February 2003
>2000 projects>20 Countries
Over 70 programming languages
2. Determine Productivity
Rate

8/8/2019 Function Points Project Tracking
http://slidepdf.com/reader/full/function-points-project-tracking 20/31
Role 2 - 20
Productivity Factors
Team Size Context
Organisation type, business area
Development PlatformLanguage, DBMS, type of computer
Team Skills
Reference “Soft” Factors and Software Productivity – Which OnesMatter Chris Lokan, University of NSW, 2002

8/8/2019 Function Points Project Tracking
http://slidepdf.com/reader/full/function-points-project-tracking 21/31
Platform Options
Median PDR
hours / fp
(ISBSG -
Release 7)
Predicted
Total Effort
Hours
Predicted
Total
Cost per fp
(@ $120/hr
Predicted
Total Cost
Microsoft
Access 2.4 286 $288/fp $34,272
Visual Basic 7.5 893 $900/fp $107,100
Oracle 10.3 1226 $1236/fp $147,084
Customised
Package 9.8 1166 $1176/fp $139,944
Java 19.6 2332 $2332.4/fp $279,888
Typical Productivity Rates
Π
Ο
ΠΠ
Ο
PDR = product delivery rate
= hours per function point
4 M BFC

8/8/2019 Function Points Project Tracking
http://slidepdf.com/reader/full/function-points-project-tracking 22/31
Role 2 - 22
Percentage Total Effort by Phase
Plan
6% Specifiy20%
Build48%
Implement
9%
Test
17%
Plan
Specifiy
BuildTest
Implement
International Software Benchmarking Standards Group- ISBSG – The Software Metrics Compendium - 2002
4. Map BFC
Completeness to Phase
4 M BFC

8/8/2019 Function Points Project Tracking
http://slidepdf.com/reader/full/function-points-project-tracking 23/31
Role 2 - 23
4. Map BFC
Completeness to Phase Function % completeness determined when BFC has
completed each milestone.
Percent Complete for Each Stage
26%
74%
91%
100%
6%
0%
10%
20%
30%
40%
50%
60%
70%
80%
90%
100%
Project Stage
F u n
c t i o n
P e r c e n t C o m p l e t e
Planned
Specified
Built
Tested
Implemente

8/8/2019 Function Points Project Tracking
http://slidepdf.com/reader/full/function-points-project-tracking 24/31
Role 2 - 24
5. Calculate Project
Resource Estimates Productivity Rate = 2.4 hours / fp
Size = 119 fps Maximum Team Size = 2 Effort Costs = $120 /hour Total Predicted Effort = 286 hours = (119*2.4)
Cost rate = $288 / fp Total Predicted Cost = $34,272 Project Start Date = 1st March 2002 ++ Predicted End Date = 1st July 2002
++Project Duration (months) =
Constant*SizeE1*Maximum Team SizeE2
= 3.9 Calendar Months
++ ISBSG Estimation Workbook

8/8/2019 Function Points Project Tracking
http://slidepdf.com/reader/full/function-points-project-tracking 25/31

8/8/2019 Function Points Project Tracking
http://slidepdf.com/reader/full/function-points-project-tracking 26/31
8. Progress Reportingstart 01-Mar-02 Week Number
8today 25-Apr-02 Actual Original Plan
1.8 2.4
58.1 46.5
105.9 132.8
178.2 161.8
10.5 9.6
07-Jul-02 01-Jul-02
PDR
Actual Value Calculation based
on:
Hours consumed for FPs delivered
Function Points Delivered
Effort Hours Consumed
Recorded by team for work against a
function
FPs by Percentage completion
Effort Hours Remaining
Predicted by Remaining hours
Relationship between Effort and
Duration
Total hours predicted minus hours
consumed
Weeks Remaining
Due Completion Date

8/8/2019 Function Points Project Tracking
http://slidepdf.com/reader/full/function-points-project-tracking 27/31
8. Progress Reportingstart 01-Mar-02 Week Number 8today 25-Apr-02 Actual Original Plan
48.9% 39.1%
40.2% 48.9%
45.1% 36.0%
% Effort Consumed
%Effort Consumed of total
compared to Effort predicted
to be consumed for FPs
delivered
%Schedule Consumed
%Schedule Consumed of
total compared to predicted to
be consumed for the effort
expended
% Product Delivered
%FPs Delivered of total
compared to that predicted to
be delivered for effort
consumed
Calculation based on:
Π
Π
Ο
8/8/2019 Function Points Project Tracking
http://slidepdf.com/reader/full/function-points-project-tracking 28/31
Role 2 - 28
Benefits Internationally Standardised method of breaking User requirements into Base Functional Components
Base Functional Components are individually objectivelysized (not assumed to be all equivalent)
Internationally standardised method of project sizing Publicly available Productivity data for estimating resources an
schedules based on Functional size Formalises and facilitates auditable and objective
Planning Estimating of schedule and effort Data collection Translation of effort to costs
Monitoring of impact of Scope creep Reporting progress to client
Early warning of project slippage Fits with southernSCOPE method contract management
methodology
Li it ti

8/8/2019 Function Points Project Tracking
http://slidepdf.com/reader/full/function-points-project-tracking 29/31
Role 2 - 29
Limitations Requires Skilled Resources to :
Select appropriate FSM Method perform the FSM sizing assess productivity criteria and select appropriate
PDR to selected functional areas Requires Committed staff to :
accurately record effort against functions maintain BFC size as requirements change
Difficulty in apportioning effort : to specific BFCs when working on ‘common use’
modules spent on “non-functional requirements”
Need for tools to integrate functional sizing and projecttracking Only trialled on smaller projects <200fps Most FSMs were designed to be used at a more Macro
level

8/8/2019 Function Points Project Tracking
http://slidepdf.com/reader/full/function-points-project-tracking 30/31
Role 2 - 30
Where to now
More trials with the technique on larger projects
Evaluate effectiveness of different FSMswith the tracking method
Integration with other trackingmethodologies and tools
Formalisation of the technique
FPs and ProjectFPs and Project

8/8/2019 Function Points Project Tracking
http://slidepdf.com/reader/full/function-points-project-tracking 31/31
Role 2 - 31
The End
“ To measure is to know!”
Total Metrics Pty Ltd
Suite 1, 667 Burke Road
Camberwell
Victoria 3124 Australia
Ph 61 (0) 3 9882 7611Fax 61 (0) 3 9882 7633
FPs and ProjectFPs and Project
TrackingTrackingDownload presentation from :
WWW.totalmetrics.com