FUNCTION ANALYSIS SYSTEM TECHNIQUE (FAST) COST MODELING
15
WELCOME YOU HAVE PURCHASED A FLEXIBLE AND USER CONFIGURABLE STATISTICAL ANALYSIS TOOL FROM SYNERGY VALUE SOLUTIONS, LLC (SVS). The SVS FAST Tool integrates function analysis, cost modeling, and decision analysis to analyze business process value as well as a variety of other uses. The SVS FAST Tool will help in the mining process to find Business Process opportunities for streamlining, cost reduction, and value improvements. Management typically does not know the exact INDIRECT COST of certain processes or where to look for business process improvements. The SVS FAST Tool can be used in connection with their performance measurement metrics and balanced scorecards. This SVS FAST Tool is primarily used by Value Specialists to examine the interfaces of Critical Path Functions from a Function Analysis System Technique (FAST) Diagram as related to organizational interface entities. However, there is substantial flexibility to use this tool for a variety of statistical applications from a wide array of other disciplines as follows: 1.) Quality Professionals 2.) Six Sigma Black Belts 3.) Statisticians 4.) Operations Research Analysts 5.) Strategic Analysts and Planners 6.) Project Managers This tool is also flexible to be used in conjunction with other flow modeling methods and tools. Synergy Value Solutions, LLC CONFIDENTIAL Page 1 Copyright©2002 SynergyValueSolutions, LLC All rights reserved REV. 9/4/02 FUNCTION ANALYSIS SYSTEM TECHNIQUE (FAST) COST MODELING MATRIX ANALYSIS TOOL USER GUIDE
Transcript of FUNCTION ANALYSIS SYSTEM TECHNIQUE (FAST) COST MODELING

WELCOME
YOU HAVE PURCHASED A FLEXIBLE AND USER CONFIGURABLE STATISTICAL ANALYSIS TOOL FROM SYNERGY VALUE SOLUTIONS, LLC (SVS).
The SVS FAST Tool integrates function analysis, cost modeling, and decision analysis to analyze business process value as well as a variety of other uses.
The SVS FAST Tool will help in the mining process to find Business Process opportunities for streamlining, cost reduction, and value improvements. Management typically does not know the exact INDIRECT COST of certain processes or where to look for business process improvements. The SVS FAST Tool can be used in connection with their performance measurement metrics and balanced scorecards.
This SVS FAST Tool is primarily used by Value Specialists to examine the interfaces of Critical Path Functions from a Function Analysis System Technique (FAST) Diagram as related to organizational interface entities. However, there is substantial flexibility to use this tool for a variety of statistical applications from a wide array of other disciplines as follows:
1.) Quality Professionals2.) Six Sigma Black Belts3.) Statisticians4.) Operations Research Analysts5.) Strategic Analysts and Planners6.) Project Managers
This tool is also flexible to be used in conjunction with other flow modeling methods and tools.
Synergy Value Solutions, LLC CONFIDENTIAL Page 1Copyright©2002 SynergyValueSolutions, LLC All rights reserved REV. 9/4/02
FUNCTION ANALYSIS SYSTEM TECHNIQUE (FAST) COST MODELING MATRIX ANALYSIS TOOL USER GUIDE

EXPLANATION OF SVS FAST TOOL
The SVS FAST Tool allows critical path functions from a level-one or level-two FAST Diagram to be placed on an X-axis across the top of the SVS FAST Tool. The Y-axis dimension interfaces organizational entities or resources and their cost in rate per hour (burdened or unburdened). At each X and Y interface, the time, duration, number of full time employees (FTE), function deliverable, and roles and responsibilities can be loaded.
The FAST Cost Modeling Matrix Analysis Tool does not create a FAST Diagram for you. Because each diagram is unique, there are technical challenges to dynamically interface the information. It will be necessary to create your own FAST diagram using whatever tools you want and manually load the SVS FAST Tool to build your organizational- function cost model.
Once the information is loaded from the process, each function has essentially been cost modeled. The software automatically totals cost by function and sets up a graph. The SVS FAST Tool gives an at-a-glance capability to look at the business process cost profile using Pareto’s Theory of the 80-20 rule which states that 80% of the costs is in 20% of the functions and parts, and where 80% of the improvements is in 20% of the functions. Modeling different improvement scenarios can then easily determine how much compression and optimization can be obtained.
Synergy Value Solutions, LLC CONFIDENTIAL Page 2Copyright©2002 SynergyValueSolutions, LLC All rights reserved REV. 9/4/02
This User Guide is designed as a step-by-step instruction to assist you as you begin to use the SVS FAST Tool. We suggest you print this User Guide for easy reference.
TO BEGIN LOADING SOFTWARE FROM THE DISK
To go to the site that manages registrations, click “Set-up” on your disk and enter your number. Follow any instructions you are prompted to perform.
TO BEGIN LOADING SOFTWARE FROM THE WEB
1. If you load software from the web site, you will not have to run a "Set-up” Program.
2. Place your order from the shopping cart. Fill out all the information on your order form including name, address, email address, and credit card number. (You will receive a confirmation email within 24 hours.)
TO BEGIN LOADING SOFTWARE FROM THE WEB CONT...
3. Once you have purchased the SVS FAST Tool, a screen will come up that says "Thank You for Your Purchase." Print a copy of that screen for your records as it contains the order and registration number code. (These are required when completing the download.)
4. Click on the "Click here" above the "OrderID number" and "Regis tration Code for the Tool Number" to download the SVS FAST Tool.
5. Enter your registration number code according to the Purchase Records.
6. Follow the instructions and select accordingly to download the SVS FAST Tool. Once the SVS FAST Tool has been downloaded, re-enter the registration number to start the program.
7. You should now have SVS FAST Tool on your computer. Nothing else is needed to begin using it. You're ready to go. To begin using the program, go to:
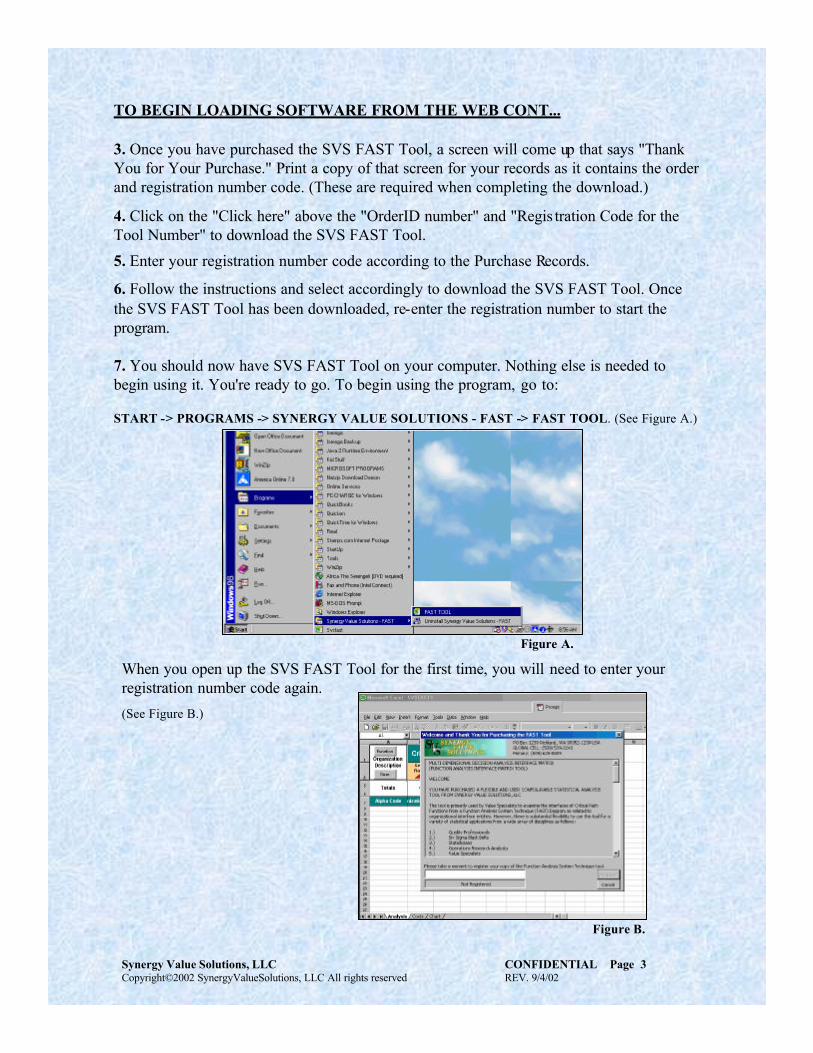
START -> PROGRAMS -> SYNERGY VALUE SOLUTIONS - FAST -> FAST TOOL. (See Figure A.)
Synergy Value Solutions, LLC CONFIDENTIAL Page 3Copyright©2002 SynergyValueSolutions, LLC All rights reserved REV. 9/4/02
When you open up the SVS FAST Tool for the first time, you will need to enter your registration number code again.
(See Figure B.)
Figure A.
Figure B.

You will automatically be in the first of the three worksheets (ANALYSIS) and you will have to enter two series of information, CRITICAL PATH FUNCTIONS and DESCRIPTION.
You must first complete the ANALYSIS worksheet before continuing. The SVS FAST Tool will not allow you to go any further until you have finished the information in CRITICAL PATH FUNCTIONS and DESCRIPTION. Once you have completed that part, you will be able to go back and edit information or move between the worksheets.
Once you populate the “ANALYSIS” worksheet with data, the “COST” and “CHART” worksheets automatically calculate accordingly. Use the "ADD DATA" function by right clicking at each interface once you have pre- loaded Critical Path Functions and the Organizational interfaces as described in the steps 1 and 2.
NOTE: Help is available in each field as you enter the data by right clicking on the cells within each interface.
Synergy Value Solutions, LLC CONFIDENTIAL Page 4Copyright©2002 SynergyValueSolutions, LLC All rights reserved REV. 9/4/02
1. CRITICAL PATH FUNCTIONS1.1 The first box to come up is "Add
Critical Path Functions.”(See Figure 1.A.)
Figure 1.A.
When you open the SVS FAST Tool, you will have a new file consis ting of three (3) worksheets: ANALYSIS, COST, and CHART. The tabs are labeled at the bottom left side of the screen. If prompted, you will need to enable macros. (See Figure C.)
Figure C.

1.2. The first field the system menu asks information on is "Add New Path" (i.e. Order Materials, Perform Work, etc.).
1.3. Enter this information, then click "Add.”(See Figure 1.B.)
Figure 1.B.
Synergy Value Solutions, LLC CONFIDENTIAL Page 5Copyright©2002 SynergyValueSolutions, LLC All rights reserved REV. 9/4/02
1.4. Click "Close" when you have completed entering all of the "Critical Path Function" information. (See Figure 1.C.)
1.5. These "Critical Path Functions"traverse and create the column cells for the X-axis interface.
1.6. After completion, if you need to add, modify, or edit entries, click the "Function" button. This is the first button in the upper left corner of the spreadsheet located above the “Description” button.
Figure 1.C.

2. DESCRIPTION
2.1. After completing the entry of the "Critical Path Function," the second box to come up is "Add Interface Description.”(See Figure 2.A.)
Figure 2.A.
Synergy Value Solutions, LLC CONFIDENTIAL Page 6Copyright©2002 SynergyValueSolutions, LLC All rights reserved REV. 9/4/02
2.2. There are two fields in which the system menu asks information to be entered: "Add New Interface" and "Cost." Enter the organizational interface data (i.e. Engineering, Quality Assurance, Administration, Procedures, etc.) and hourly rate cost for resources that will be interfacing
with the functions along the X-axis.
(See Figure 2.B.)
Figure 2.B.

2.3. This box will allow you to put the "Description" or the interfacing organizational entity data down the vertical Y-axis.
2.4. Click "Close" when you have completed entering all of the "Description" information.
2.5. After completion, if you need to add, modify, or edit entries, click the "Description" button. This button is located in the upper left corner of the spreadsheet below the "Functions"button. (See Figure 2.C.)
Figure 2.C.
Synergy Value Solutions, LLC CONFIDENTIAL Page 7Copyright©2002 SynergyValueSolutions, LLC All rights reserved REV. 9/4/02
3. LOADING INTERFACE DATA
After above Critical Path Function and Description are loaded, enter the data for each organizational - function interface.
3.1. Select an interface cell and right click to pull down the menu.
(See Figure 3.A.)
Figure 3.A.

Synergy Value Solutions, LLC CONFIDENTIAL Page 8Copyright©2002 SynergyValueSolutions, LLC All rights reserved REV. 9/4/02
3.3. Enter the following information to perform functions in the "Enter/Edit Interface Data" menu:
(See Figure 3.C.)
Figure 3.C.
3.2. Select the first item on the menu: "Add Data.”
(See Figure 3.B.)
Figure 3.B.
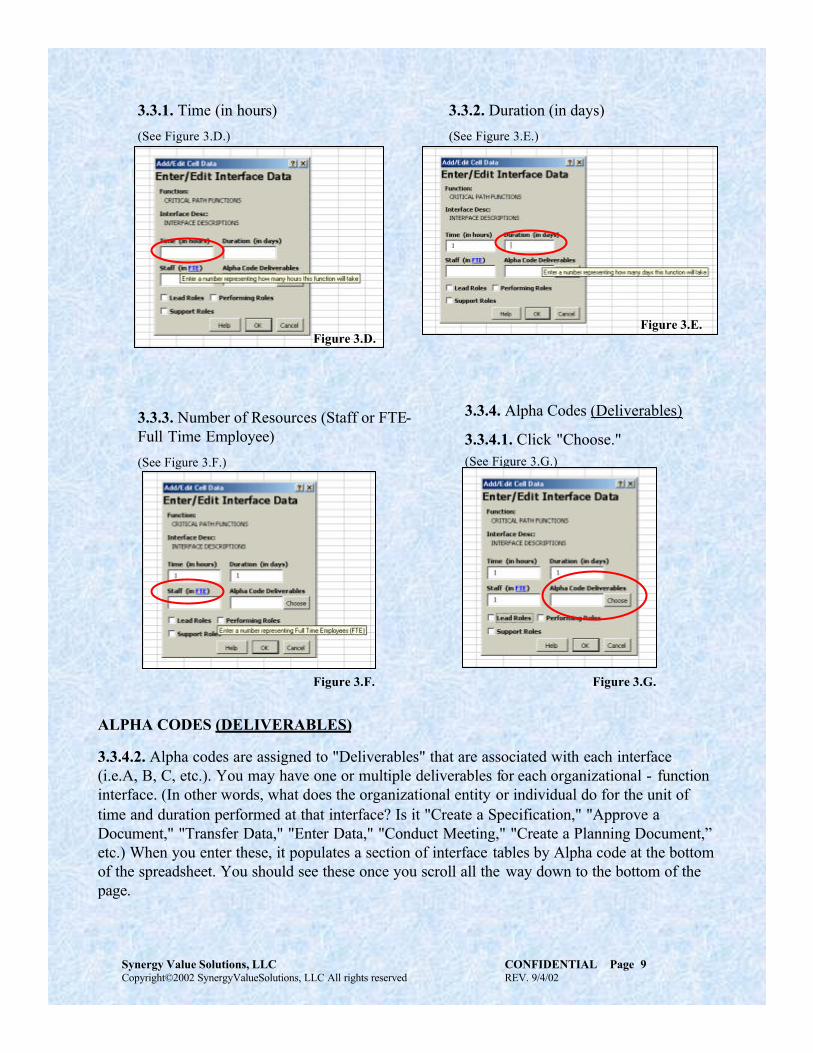
3.3.1. Time (in hours)
(See Figure 3.D.)
3.3.2. Duration (in days)
(See Figure 3.E.)
3.3.3. Number of Resources (Staff or FTE-Full Time Employee)
(See Figure 3.F.)
3.3.4. Alpha Codes (Deliverables)
3.3.4.1. Click "Choose."(See Figure 3.G.)
Figure 3.E.Figure 3.D.
Figure 3.G.Figure 3.F.
Synergy Value Solutions, LLC CONFIDENTIAL Page 9Copyright©2002 SynergyValueSolutions, LLC All rights reserved REV. 9/4/02
ALPHA CODES (DELIVERABLES)
3.3.4.2. Alpha codes are assigned to "Deliverables" that are associated with each interface (i.e.A, B, C, etc.). You may have one or multiple deliverables for each organizational - function interface. (In other words, what does the organizational entity or individual do for the unit of time and duration performed at that interface? Is it "Create a Specification," "Approve a Document," "Transfer Data," "Enter Data," "Conduct Meeting," "Create a Planning Document,” etc.) When you enter these, it populates a section of interface tables by Alpha code at the bottom of the spreadsheet. You should see these once you scroll all the way down to the bottom of the page.

Figure 3.H.
3.3.4.3. Click "New Alpha Code" (See Figure 3.H.) and type your "Deliverable." (See Figure 3.I.) 3.3.4.4. Click "OK."
(See Figure 3.J.)
Figure 3.I.
Synergy Value Solutions, LLC CONFIDENTIAL Page 10Copyright©2002 SynergyValueSolutions, LLC All rights reserved REV. 9/4/02
3.3.4.5. When you select another interface by column, the same Alpha codes are available for you to reuse. For instance, more than one organization may have to "Review and Approve" a document.
DELIVERABLE
Figure 3.J.

3.3.5. Next, by checking as many of the appropriate boxes that apply, select Lead, Performing, orSupport Roles.
(See Figure 3.L.)
3.3.5.1. Lead Role - the responsible entity accountable to ensure the function is performed.
3.3.5.2. Performing Role - the organizational entity performing the work. Sometimes organizations having a leading role might also be performing the work. It is okay to have more than one role per organization.
3.3.5.3. Support Role - a minor role that is less active than a Performing Role, but requires an organization to be involved in some capacity.
3.4. Click OK to populate the tables and spreadsheets.
Figure 3.L.
Synergy Value Solutions, LLC CONFIDENTIAL Page 11Copyright©2002 SynergyValueSolutions, LLC All rights reserved REV. 9/4/02
3.3.4.6. As you enter the alpha code deliverable information, little check boxes will pop up next to the item. Choose the Deliverable by marking the box next to it.
3.3.4.7. Select the check box accordingly, as those Deliverables are applicable to the organizational entity performing an interfacing function. 3.3.4.8. Click "Close."(See Figure 3.K.)
Figure 3.K.

4. The three worksheets are now populated with the information entered above. You can navigate from one to the other by selecting the appropriate tab at the bottom left of the worksheet which are labeled “ANALYSIS,” “COST,” and “CHART.”
4.1. ANALYSIS (Worksheet 1 )
(See Figure 4.A.)
4.1.1. The first worksheet is primarily a loaded Analysis summary of what you just entered except it does not display cost to function.
4.1.2. After your primary data is loaded, the symbols for the different "LEAD," "PERFORMING," and/or "SUPPORT" roles should display in the center of each function interface.
4.1.3. To better help you see who has fewer, equal, or greater roles accordingly, these roles are also summed at the far right of the spreadsheet.
Worksheet 1
Figure 4.A.
Synergy Value Solutions, LLC CONFIDENTIAL Page 12Copyright©2002 SynergyValueSolutions, LLC All rights reserved REV. 9/4/02
Worksheet 1Figure 4.A.a.
4.1.4. This is helpful for Organizational Development to analyze opportunities to improve efficiency by combining organizational roles and entities.
4.1.5. To edit any of the information on the sheet, Right Click above the information and select "Add Data.” (See Figure 4.A.a.)

Synergy Value Solutions, LLC CONFIDENTIAL Page 13Copyright©2002 SynergyValueSolutions, LLC All rights reserved REV. 9/4/02
4.2 COST (Worksheet 2)
(See Figure 4.B.)
4.2.1. The second worksheet shows the Total Costs by interfacing entitycost to function.
(See Figure 4.B.a.)
Worksheet 2
Figure 4.B.
Worksheet 2Figure 4.B.a.

Synergy Value Solutions, LLC CONFIDENTIAL Page 14Copyright©2002 SynergyValueSolutions, LLC All rights reserved REV. 9/4/02
4.3 CHART (Worksheet 3)
(See Figure 4.C.)
4.3.1. The third worksheet displays a cost graph by function.
Worksheet 3
Figure 4.C.

CASE STUDY SAMPLE PROJECT
A recent case study created and utilized a cost model of the Preventative Maintenance (PM) business process from “identification of need” through “work package closeout.”
This may sound simple. However, there were numerous secondary functions between the lower order input and higher output functions that add cost to the basic function.
The SVS FAST Tool quantified all aspects of the Work Management process, performing PM, Corrective Maintenance (CM), and calibrations.
Cost models were created for PM Recalls and for setting up a new PM.
General purpose types of facility PM’s and CM’s were modeled.
The project also examined special use facilities such as analytical laboratories and chemical plants.
Using the SVS FAST Tool, all direct and indirect costs per PM were identified. Most importantly, the SVS FAST Tool allowed identification of the ind irect costs leading up to the performance of work. Using commercial performance benchmarks, the team examined and verified the following:
1. The process was within acceptable benchmark performance range.
2. How opportunities to reduce cost, reduce time, and improve customer value might impact the cost model and business process model.
3. Quantify differences between the “As-Is” and “To-Be” opportunities for value improvement.
4. Provide a visual graphical representation of sensitive data, decision analysis data, and cost data which can be compared against a number of improvement scenarios.
This particular project included bargaining unit personnel as well as exempt resources involved in the business process.
The data end-results allowed comparisons to industry benchmarks.
In this particular case study project, the team identified a potential $30 million per year of quantified improvements in the form of hard and soft dollar value.
The annual maintenance budget for this case study example is $80 million per year. This equates to about 37.5% budgetary savings per year.
In this case, the customer desired to find innovative ways to re-allocate resources to perform other meaningful work in lieu of merely outplacement.
Synergy Value Solutions, LLC CONFIDENTIAL Page 15Copyright©2002 SynergyValueSolutions, LLC All rights reserved REV. 9/4/02