Full Year Results Presentation Year Ending September 2008
39
Private and Confidential www.TechnologyOneCorp.com November 2008 Full Year Results Presentation Year Ending September 2008 Adrian Di Marco Executive Chairman
Transcript of Full Year Results Presentation Year Ending September 2008

Private and Confidential
www.TechnologyOneCorp.com
November 2008
Full Year Results Presentation
Year Ending September 2008
Adrian Di Marco
Executive Chairman

2
TechnologyOne Overview
TechnologyOne develops, markets, sells,
implements and supports a new generation
enterprise solution specifically targeted at
seven vertical markets:
Local Government
Government (State, Central & Federal)
Education
Financial Services
Health, Community Services and Not for Profit
Utilities
Managed Services

3
TechnologyOne Overview
Our enterprise solution consists of the following products: TechnologyOne Financials
TechnologyOne Supply Chain
TechnologyOne Human Resource & Payroll
TechnologyOne Works & Assets
TechnologyOne Business Intelligence
TechnologyOne Performance Planning
TechnologyOne Enterprise Content Management (ECM)
TechnologyOne Budgeting
TechnologyOne Customer Relationship Management (CRM)
TechnologyOne Student Management
TechnologyOne Property & Rating
Offices in Australia, New Zealand, Asia and more recently United Kingdom

4
TechnologyOne Overview
Major supplier of enterprise applications in ANZ – 800+
major corporations, government departments & statutory
authorities
Growing business in the United Kingdom
Top 300 ASX publicly listed company
One of Australia’s largest software houses
5
Agenda
2008 Full Year Results
Summary
Analysis
Significant Achievements Last Six Months
Outlook
Our Strategy for Growth

6
2008 Full Year Results
Full Year Revenue $110m, up 41%
Net Profit Before Tax $23.1m, up 17%
Net Profit After Tax $17.2m, up 17%
Expenses excluding R&D $65.9m, up 47%
Extended executive & senior management team
New ‘House of Products’ business transformation completed
Added 180 additional staff (37%) over the last 12 months (677 staff)
R&D $21.2m, up 53% - represents 19% of Revenue
Significant investment that continues to drive our growth
R&D fully expensed as incurred

7
2008 Full Year Results
Continuing strong demand for our products: 23% increase in licence
fees
Resilience of our business model
Student Management licence fees were down $6m compared to last
year
Continued investments as follows:
To build our United Kingdom business ($1.3m)
Human Resource & Payroll ($1.7m)
CRM and New Technologies ($750k)
R&D increased to 19% of revenue vs more typical 18% of revenue –
impact of $1m approx in the full year
Extended executive & senior management team

8
2008 Full Year Results
Balance sheet strong
Cash & Equivalents*: $23.7m (vs $25.6m 30/9/07)
Debt/Equity: 4% (vs 3% 30/9/07)
Transparency of results – all R&D fully expensed
Dividend (full year) increased to 4.12 cents up 10%
Board target payout for full year is 70%, as we accumulate cash
for further acquisitions
Operating Cash Flow of $11.8m
Substantial improvement from half year figure of $1.1 million
Significant billings in August & September
Debtors management continues to improve
*Cash includes short term investments

9
2008 Full Year Results

10
2008 Full Year Results
Historical 10 year annual compound growth is as follows:
Revenue: 24% per annum compound
R&D: 24% per annum compound
Net Profit: 21% per annum compound
TechnologyOne has been doubling in size every 2 ½ years over the last 10 years

11
2008 Full Year Results
Total licence fees of $22.6m, up 23%
Annual licence fees of $36.3m, up 42%
Consulting services of $32.8m, up 59%
Project services revenue of $10.5m, up 17%
Other Revenue of $8.0m, up 8%
Technical services revenue of $3.2m, up 66%
Product modifications revenue of $3.1m, up 128%
Misc. revenue (interest, grants, etc) of $1.7m, up 12%
50+% of our revenues generated from existing clients

12
Product Analysis – Licence Fees
TechnologyOne Student Management licence fees down significantly 85%
($5.8m) to $1.1m - contract delays, discussed later
TechnologyOne ECM (newly acquired business) licence fees of $1.5m -
discussed later
TechnologyOne Human Resource & Payroll licence fees continued to
improve, up 60% ($371k) to $985k - continuing growth the next few years

13
Product Analysis
TechnologyOne Financials/Supply Chain licence fees up
37% ($2.1m) to $7.7m
TechnologyOne Business Intelligence licence fees up
strongly, 237% ($3.94m) to $5.6m
TechnologyOne Works & Assets licence fees up
strongly, 77% ($1.1m) to $2.6m
TechnologyOne Property & Rating licence fees up 38%
($780k) to $2.8m

14
Product Analysis
Continued to invest in following areas:
TechnologyOne CRM – exciting new offering
TechnologyOne Next Gen – next generation platform
15
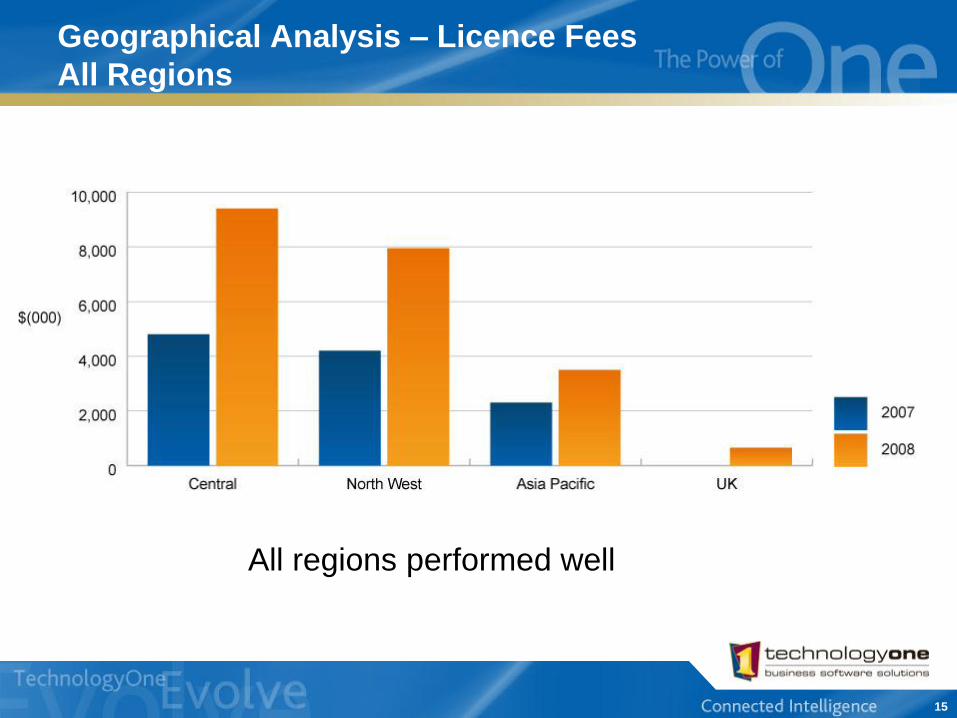
Geographical Analysis – Licence Fees
All Regions
All regions performed well

16
Geographical Analysis – Licence Fees
Central Region
Central region performed strongly, licence fees up 95%
(up $4.6m) to $9.4m
ACT licence fees up significantly ($2.9m) to $3.2m
NSW licence fees up 65% ($1.1m) to $2.7m
VIC licence fees up 23% ($649k) to $3.5m

17
Geographical Analysis – Licence Fees
North West Region
North West region performed strongly, licence fees up 89% (up $3.75m) to $7.95m QLD licence fees up 81% ($2.2m) to $4.9m
WA licence fees up substantially ($1.35m) to $1.45m
SA licence fees up slightly ($63k) to $900k
TAS licence fees up $271k to $711k

18
Geographical Analysis – Licence Fees
Asia Pacific
Asia Pacific licence fees up significantly ($1.2m) to $3.5m New Zealand licence fees down 18% ($421k) to $1.9m - action taken,
discussed later
PNG licence fees of $1.5m (versus nil last year)
Malaysia licence fees of $129k (versus $77k last year) - number of options being investigated

19
Geographical Analysis
United Kingdom licence fees up strongly to $651k
3 new significant high profile contracts signed • Royal Liverpool Children's NHS Trust
• Institute of Education, a college of University of London
• Strathclyde Partnership for Transport
Gaining traction - good pipeline of opportunities
Discussed later

20
Agenda
2008 Full Year Results
Summary
Analysis
Significant Achievements Last Six Months
Outlook
Our Strategy for Growth
21
Significant Achievements Last Six Months
Acquisitions Avand
Outcome Manager
House of Products Business Transformation Completed
New Vertical Market Program
Corporate Shared Services Completed
Continuing Momentum of Connected Intelligence series
Research & Development
Momentum in United Kingdom
Restructure of New Zealand
Student Management
22
Acquisition of Avand
Avand – Enterprise Content Management business
Avand company acquired for $7.0m
$9.1m consideration less $2.1m net tangible assets on the balance sheet
Avand as a standalone business contributed a profit of $498k
Turnaround from $700k loss in the half year
After consideration for notional cost of capital results are break even, as
expected
Business fully integrated into TechnologyOne
Common systems implemented, re-aligned business to our House of
Products business model, re-branding to TechnologyOne ECM
(Enterprise Content Management)

23
Acquisition of Avand
New General Manager & Consulting Manager appointed
to drive this business forward
Develop and implement a 5 year strategy
Refocus R&D, consulting & sales
Sales to be into our core markets & areas of competencies
Product Roadmap now being finalised
Core value alignment: Customer centric, Sales centric, People
centric
Expect substantial growth over the next few years

24
Acquisition of Outcome Manager
Outcome Manager – Performance Planning technology
Outcome Manager acquired for $1m
$500k up front and $500k earn out
Long term relationship before the acquisition
Strategically important technology
Significant applicability for Local, State & Federal Government
Complement our Business Intelligence / Enterprise Budgeting product
Develop and implement a 5 year strategy
Refocus R&D, consulting & sales
Sales to be into our core markets & areas of competencies
Product Roadmap now being finalised
Expect growth over the next few years

25
House of Products Business Transformation

26
House of Products Business Transformation
Now complete
Simplifies the management of TechnologyOne business
Platform for managing our future growth
Organisational restructure and change management now completed
General Managers appointed to drive each product
5 year strategies & KPIs now finalised
New KPIs & management reporting rolled out
Profitability by product and by region/state
Improved visibility of what is driving/not driving the business

27
New Vertical Market Program
Focus on seven vertical markets Local Government, Government (State/Central/Federal), Education,
Financial Services, Health/Community Services/Not for Profit, Utilities, Managed Services
Our products are the building blocks to deliver totally integrated enterprise solutions for each vertical market
Provide a superior experience & outstanding value proposition to our customers in each vertical market Aligning sales, marketing and R&D around each vertical market
Customer development managers for each vertical to drive sales & build relationships in each vertical
Deep industry experience & ‘best practice’ templates for each vertical
Certification of consultants & project managers for each vertical
Roadmaps for each vertical market

28
Corporate Shared Services Completed
Corporate Shared Services group created:
Finance, HR, Payroll, Internal Systems, Legal, Administration
Provide world class services to our business units
Facilitate fast integration of acquired businesses • Avand integration completed in 6 months
Operating Officer (OO) Corporate Services appointed
Mr Edward Chung – CFO Queensland Rail (QR)
Drive our significant investment in new systems & process over the next 3 years
New systems rolled out over the last 18 months:
Timesheet billing, Project Management, Profit Forecasting/Pipeline Management, CRM, Enterprise Budgeting, Business Intelligence, House of Products Financial Reporting etc.

29
Continuing Momentum of CI series
Connected Intelligence (Ci) is the new generation of our suite of
products
Significant competitive advantage over our competitors
Strong demand for our products, due to our new Ci series
Only enterprise vendor to release and successfully migrate customers
to a new generation product
800+ customers in total
80+% customers now live/in progress on Ci
Expect 98% of customers to migrate to Ci
Allow us to offer our customers more products & services over the next
few years
Continuing strong increase in revenue from existing customers

30
Research & Development
R&D running at $21.2m, representing 19% of revenue
Target is 18% of revenue, approximately $1m over target
Detailed Product Roadmaps developed for next 5 years
Finalising Ci migration of our products
Major new initiatives
Pipeline of licensable ‘add ons’ for each of our products over the coming years to drive further growth in existing customer base
TechnologyOne ECM and TechnologyOne Performance Planning to be moved to the Ci platform
Round out Ci migration for Student Management
Customer Relationship Management (CRM) – exciting new product
New Mobile computing platform – solutions for field workers
Next Gen platform for our next generation product

31
Momentum in United Kingdom
3 significant new high profile contracts signed • Royal Liverpool Children’s NHS Trust
• Institute of Education, a college of University of London
• Strathclyde Partnership for Transport (SPT)
• Total of 7 customers in the UK
Built a strong team in the United Kingdom
Country manger, sales & pre-sales (3), consulting manager, consultants (7)
Good pipeline of opportunities, focus on winning more business
UK reporting line changed to be same as ANZ
Under Operating Officer Sales/Marketing

32
Restructure of New Zealand
New Zealand has under performed over the last few
years
New Zealand now broken into 2 regions: Auckland & Wellington
2 Regional Managers appointed - focus and accountability on
each region
Will see a substantial improvement in profitability in 12/18
months

33
Student Management
Student Management new licence fees were down $6m
compared to last year
Student Management R&D also up significantly 89% (up
$2.25m)
New General Manager to be appointed
New strategy for Student Management to be developed
Focus on sales, marketing and better customer
engagement
Focus on getting first Student Management Ci sites live

34
Agenda
2008 Full Year Results
Summary
Analysis
Significant Achievements Last Six Months
Outlook
Our Strategy for Growth

35
Outlook – This Year
Organisations continue to look at streamlining their operations to reduce costs & improve efficiencies Integrated enterprise solutions are the key
Our vertical market focus will allow us to add significant value
Good pipeline of opportunities
Regions expected to continue to perform strongly Continued momentum in Central & North West regions
Continued momentum in the United Kingdom
Significant improvement in New Zealand
All products expected to grow licence fees, main challenge as follows Student Management
ECM
Human Resource & Payroll
Continuing licence fee growth from existing customers
R&D to reduce to 18% of revenue
Guidance of 10% to 15% profit growth for 2009

36
Outlook – This Year
Other Factors
Staff attraction and retention
Managing costs in line with revenue growth

37
Agenda
2008 Full Year Results
Summary
Analysis
Significant Achievements Last Six Months
Outlook
Our Strategy for Growth

38
Our Strategy for Growth
Our suite of enterprise products give us an unique position in the market
‘House of Product’ business model to bring focus and simplify our business
Leverage our large & expanding existing customer base Our trusted relationship status
Increase usage of existing products by our customers via new licensable ‘add ons’
Cross sell our other products into our customer base
The ‘Power of One’ puts us in a strong position to keep our customer base compared to our competitors
Acquire new customers Focus on seven vertical markets
Vertical Market Program to assemble our products & services into powerful enterprise solutions for each of our verticals, providing prospective customers with a compelling value proposition
Geographical expansion into the United Kingdom
R&D to build new products & increase our competitive advantage
Acquisition to expand our product range and customer base
Continue to look for new uncontested ‘blue oceans’

Private and Confidential
www.TechnologyOneCorp.com
November 2008
Full Year Results Presentation
Year Ending September 2008
Adrian Di Marco
Executive Chairman