
FULL YEAR RESULTS PRESENTATION 2013 - SThreeFULL YEAR RESULTS PRESENTATION 2013 RESULTS FOR THE YEAR...
67
FULL YEAR RESULTS PRESENTATION 2013 RESULTS FOR YEAR ENDED 1 DECEMBER 2013
Transcript of FULL YEAR RESULTS PRESENTATION 2013 - SThreeFULL YEAR RESULTS PRESENTATION 2013 RESULTS FOR THE YEAR...

FULL YEAR RESULTS PRESENTATION 2013RESULTS FOR YEAR ENDED 1 DECEMBER 2013

www.sthree.com | SThree plc 2
FULL YEAR RESULTSPRESENTATION 2013RESULTS FOR THE YEAR ENDED 1 DECEMBER 2013
INTRODUCTION & OVERVIEW
FULL YEAR RESULTSPRESENTATION 2013RESULTS FOR THE YEAR ENDED 1 DECEMBER 2013
www.sthree.com | SThree plc 3
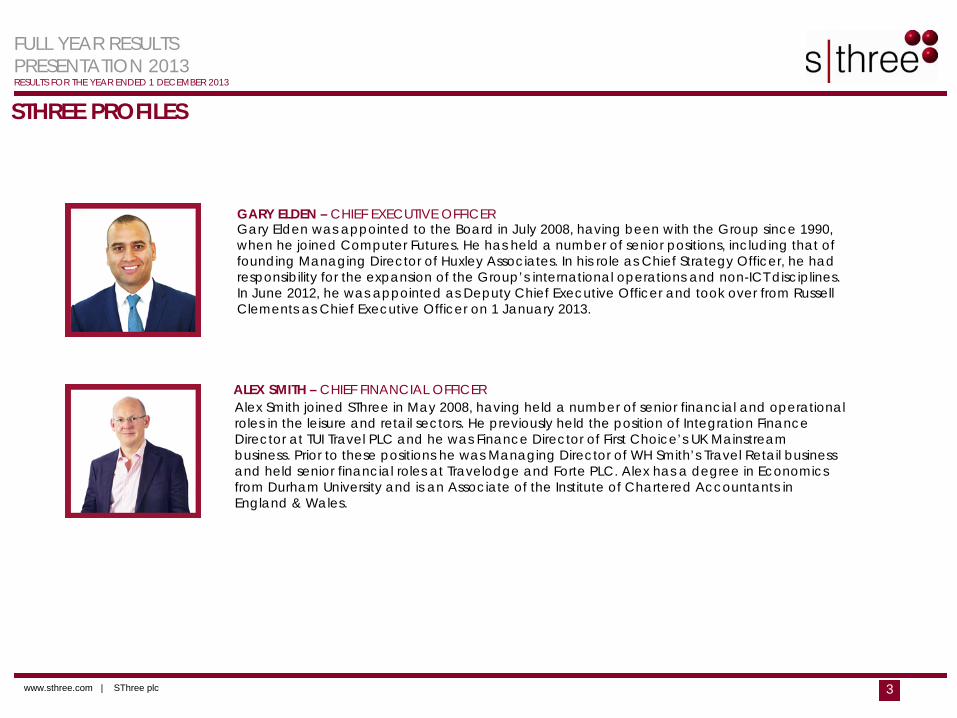
STHREE PROFILES
GARY ELDEN – CHIEF EXECUTIVE OFFICER
ALEX SMITH – CHIEF FINANCIAL OFFICER
Gary Elden was appointed to the Board in July 2008, having been with the Group since 1990, when he joined Computer Futures. He has held a number of senior positions, including that of founding Managing Director of Huxley Associates. In his role as Chief Strategy Officer, he had responsibility for the expansion of the Group’s international operations and non-ICT disciplines. In June 2012, he was appointed as Deputy Chief Executive Officer and took over from Russell Clements as Chief Executive Officer on 1 January 2013.
Alex Smith joined SThree in May 2008, having held a number of senior financial and operational roles in the leisure and retail sectors. He previously held the position of Integration Finance Director at TUI Travel PLC and he was Finance Director of First Choice’s UK Mainstream business. Prior to these positions he was Managing Director of WH Smith’s Travel Retail business and held senior financial roles at Travelodge and Forte PLC. Alex has a degree in Economics from Durham University and is an Associate of the Institute of Chartered Accountants in England & Wales.
FULL YEAR RESULTSPRESENTATION 2013RESULTS FOR THE YEAR ENDED 1 DECEMBER 2013
www.sthree.com | SThree plc 4
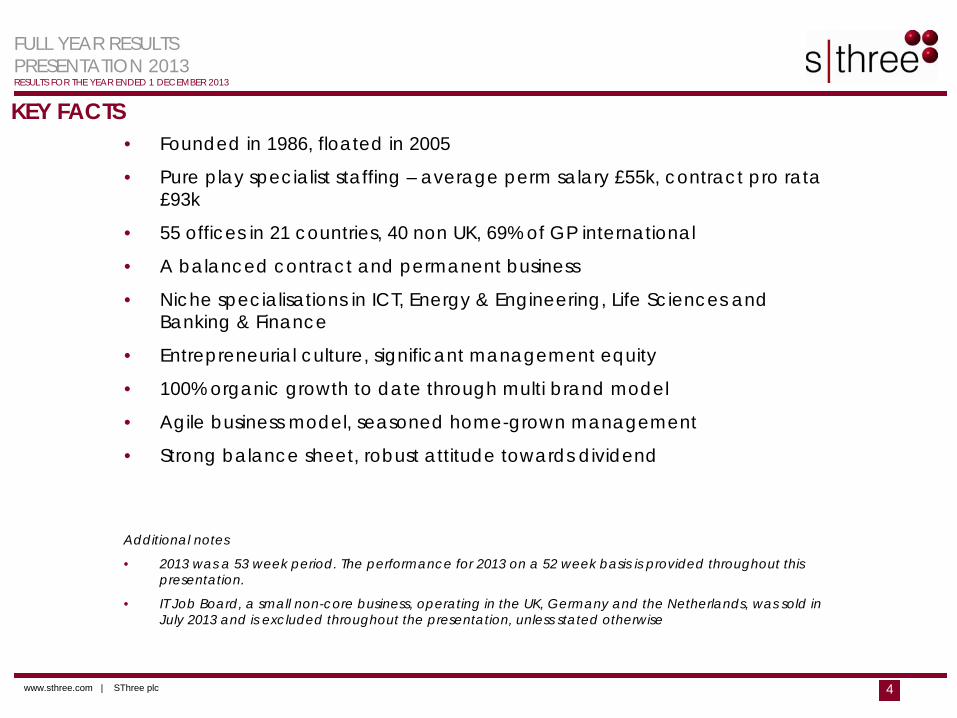
• Founded in 1986, floated in 2005
• Pure play specialist staffing – average perm salary £55k, contract pro rata £93k
• 55 offices in 21 countries, 40 non UK, 69% of GP international
• A balanced contract and permanent business
• Niche specialisations in ICT, Energy & Engineering, Life Sciences and Banking & Finance
• Entrepreneurial culture, significant management equity
• 100% organic growth to date through multi brand model
• Agile business model, seasoned home-grown management
• Strong balance sheet, robust attitude towards dividend
KEY FACTS
Additional notes
• 2013 was a 53 week period. The performance for 2013 on a 52 week basis is provided throughout this presentation.
• IT Job Board, a small non-core business, operating in the UK, Germany and the Netherlands, was sold in July 2013 and is excluded throughout the presentation, unless stated otherwise
FULL YEAR RESULTSPRESENTATION 2013RESULTS FOR THE YEAR ENDED 1 DECEMBER 2013
www.sthree.com | SThree plc 5
FY 2013: AN OVERVIEW
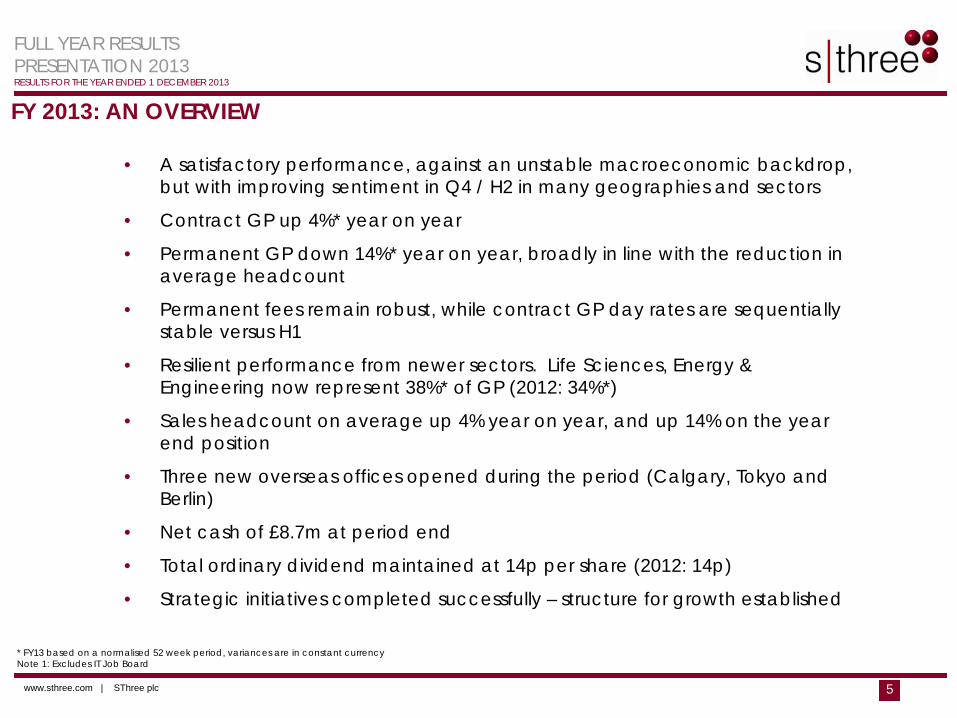
* FY13 based on a normalised 52 week period, variances are in constant currencyNote 1: Excludes IT Job Board
• A satisfactory performance, against an unstable macroeconomic backdrop, but with improving sentiment in Q4 / H2 in many geographies and sectors
• Contract GP up 4%* year on year
• Permanent GP down 14%* year on year, broadly in line with the reduction in average headcount
• Permanent fees remain robust, while contract GP day rates are sequentially stable versus H1
• Resilient performance from newer sectors. Life Sciences, Energy & Engineering now represent 38%* of GP (2012: 34%*)
• Sales headcount on average up 4% year on year, and up 14% on the year end position
• Three new overseas offices opened during the period (Calgary, Tokyo and Berlin)
• Net cash of £8.7m at period end
• Total ordinary dividend maintained at 14p per share (2012: 14p)
• Strategic initiatives completed successfully – structure for growth established
www.sthree.com | SThree plc 6
FULL YEAR RESULTSPRESENTATION 2013RESULTS FOR THE YEAR ENDED 1 DECEMBER 2013
FINANCIAL RESULTS
FULL YEAR RESULTSPRESENTATION 2013RESULTS FOR THE YEAR ENDED 1 DECEMBER 2013
www.sthree.com | SThree plc 7
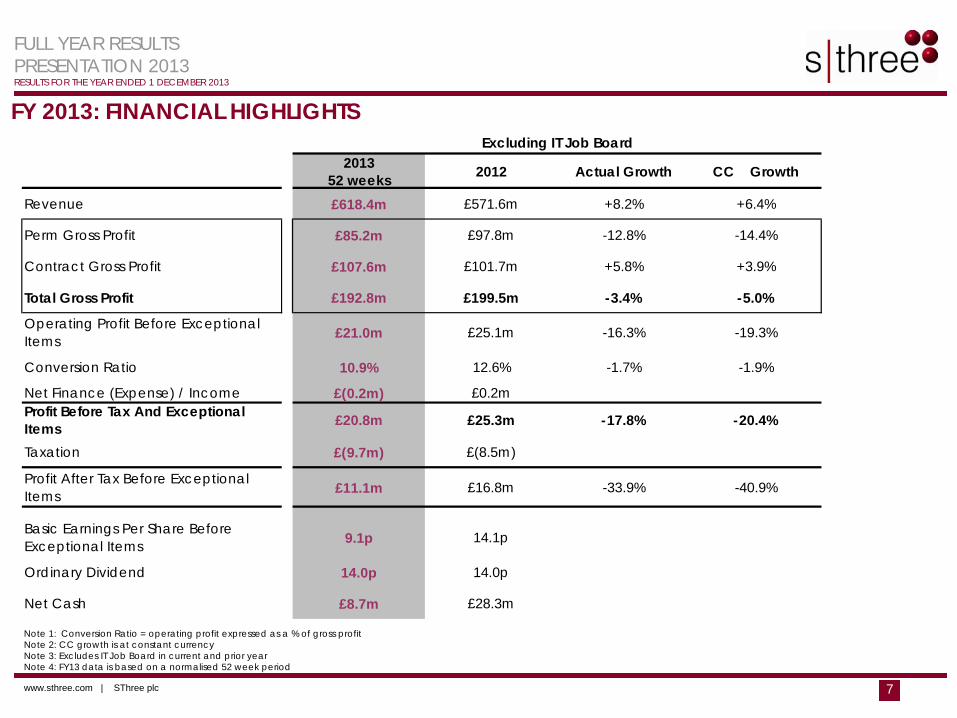
FY 2013: FINANCIAL HIGHLIGHTS
Note 1: Conversion Ratio = operating profit expressed as a % of gross profitNote 2: CC growth is at constant currencyNote 3: Excludes IT Job Board in current and prior yearNote 4: FY13 data is based on a normalised 52 week period
2013 52 weeks 2012 Actual Growth CC Growth
Revenue £618.4m £571.6m +8.2% +6.4%
Perm Gross Profit £85.2m £97.8m -12.8% -14.4%
Contract Gross Profit £107.6m £101.7m +5.8% +3.9%
Total Gross Profit £192.8m £199.5m -3.4% -5.0%
Operating Profit Before Exceptional Items £21.0m £25.1m -16.3% -19.3%
Conversion Ratio 10.9% 12.6% -1.7% -1.9%
Net Finance (Expense) / Income £(0.2m) £0.2mProfit Before Tax And Exceptional Items £20.8m £25.3m -17.8% -20.4%
Taxation £(9.7m) £(8.5m)
Profit After Tax Before Exceptional Items £11.1m £16.8m -33.9% -40.9%
Basic Earnings Per Share Before Exceptional Items 9.1p 14.1p
Ordinary Dividend 14.0p 14.0p
Net Cash £8.7m £28.3m
Excluding IT Job Board
FULL YEAR RESULTSPRESENTATION 2013RESULTS FOR THE YEAR ENDED 1 DECEMBER 2013
www.sthree.com | SThree plc 8
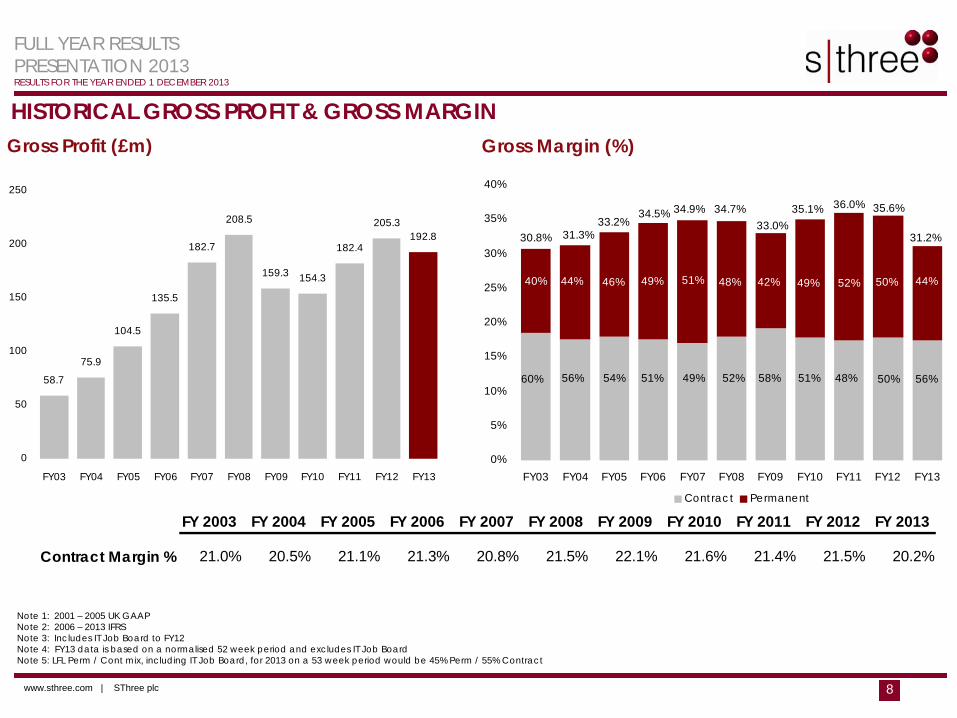
HISTORICAL GROSS PROFIT & GROSS MARGINGross Profit (£m) Gross Margin (%)
Note 1: 2001 – 2005 UK GAAPNote 2: 2006 – 2013 IFRSNote 3: Includes IT Job Board to FY12Note 4: FY13 data is based on a normalised 52 week period and excludes IT Job BoardNote 5: LFL Perm / Cont mix, including IT Job Board, for 2013 on a 53 week period would be 45% Perm / 55% Contract
FY 2003 FY 2004 FY 2005 FY 2006 FY 2007 FY 2008 FY 2009 FY 2010 FY 2011 FY 2012 FY 2013
Contract Margin % 21.0% 20.5% 21.1% 21.3% 20.8% 21.5% 22.1% 21.6% 21.4% 21.5% 20.2%
58.7
75.9
104.5
135.5
182.7
208.5
159.3 154.3
182.4
205.3192.8
0
50
100
150
200
250
FY03 FY04 FY05 FY06 FY07 FY08 FY09 FY10 FY11 FY12 FY130%
5%
10%
15%
20%
25%
30%
35%
40%
FY03 FY04 FY05 FY06 FY07 FY08 FY09 FY10 FY11 FY12 FY13
Contract Permanent
30.8% 31.3%33.2%
34.5% 34.7%33.0%
35.1% 36.0%
40% 44% 46% 49% 51% 48% 42% 49% 52%
48%51%58%51% 52%49%54%56%60%
50%
35.6%
50%
44%
56%
31.2%
34.9%
FULL YEAR RESULTSPRESENTATION 2013RESULTS FOR THE YEAR ENDED 1 DECEMBER 2013
www.sthree.com | SThree plc 9
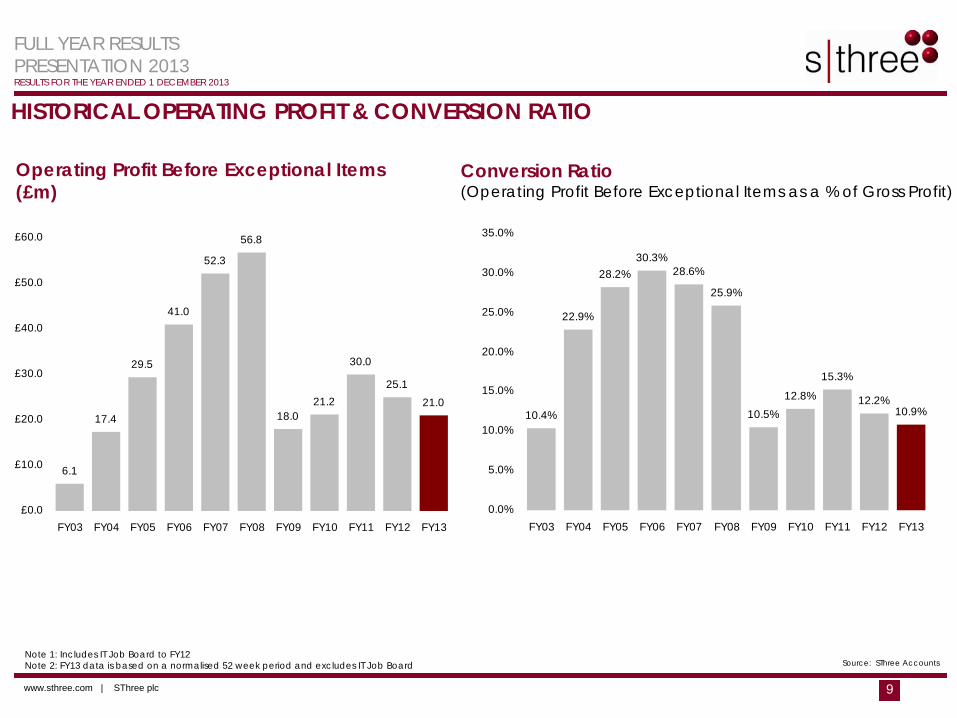
HISTORICAL OPERATING PROFIT & CONVERSION RATIO
Conversion Ratio (Operating Profit Before Exceptional Items as a % of Gross Profit)
Operating Profit Before Exceptional Items (£m)
Note 1: Includes IT Job Board to FY12Note 2: FY13 data is based on a normalised 52 week period and excludes IT Job Board Source: SThree Accounts
6.1
17.4
29.5
41.0
52.3
56.8
18.021.2
30.0
25.1
21.0
£0.0
£10.0
£20.0
£30.0
£40.0
£50.0
£60.0
FY03 FY04 FY05 FY06 FY07 FY08 FY09 FY10 FY11 FY12 FY13
10.4%
22.9%
28.2%30.3%
28.6%
25.9%
10.5%
12.8%
15.3%
12.2%10.9%
0.0%
5.0%
10.0%
15.0%
20.0%
25.0%
30.0%
35.0%
FY03 FY04 FY05 FY06 FY07 FY08 FY09 FY10 FY11 FY12 FY13
FULL YEAR RESULTSPRESENTATION 2013RESULTS FOR THE YEAR ENDED 1 DECEMBER 2013
www.sthree.com | SThree plc 10
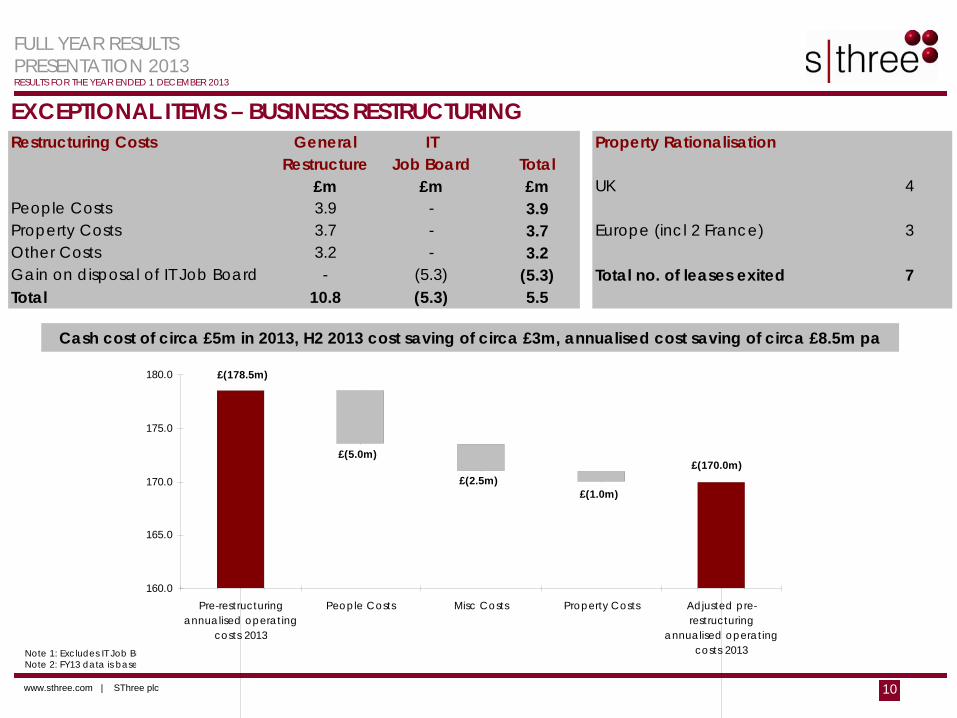
EXCEPTIONAL ITEMS – BUSINESS RESTRUCTURING
Cash cost of circa £5m in 2013, H2 2013 cost saving of circa £3m, annualised cost saving of circa £8.5m pa
£178.3m
£169.8m
Note 1: Excludes IT Job BoardNote 2: FY13 data is based on a 52 week period
Restructuring Costs General IT Property RationalisationRestructure Job Board Total
£m £m £m UK 4People Costs 3.9 - 3.9Property Costs 3.7 - 3.7 Europe (incl 2 France) 3Other Costs 3.2 - 3.2Gain on disposal of IT Job Board - (5.3) (5.3) Total no. of leases exited 7Total 10.8 (5.3) 5.5
160.0
165.0
170.0
175.0
180.0
Pre-restructuringannualised operating
costs 2013
People Costs Misc Costs Property Costs Adjusted pre-restructuring
annualised operatingcosts 2013
£(178.5m)
£(5.0m)
£(2.5m)£(1.0m)
£(170.0m)
FULL YEAR RESULTSPRESENTATION 2013RESULTS FOR THE YEAR ENDED 1 DECEMBER 2013
www.sthree.com | SThree plc 11
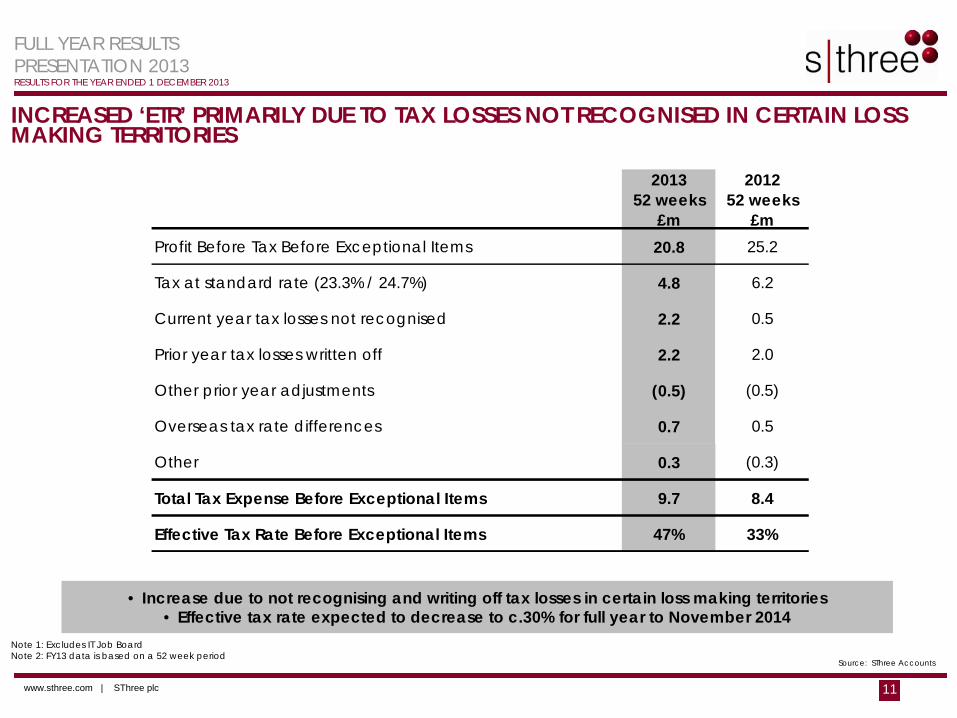
INCREASED ‘ETR’ PRIMARILY DUE TO TAX LOSSES NOT RECOGNISED IN CERTAIN LOSS MAKING TERRITORIES
Source: SThree Accounts
• Increase due to not recognising and writing off tax losses in certain loss making territories• Effective tax rate expected to decrease to c.30% for full year to November 2014
Note 1: Excludes IT Job BoardNote 2: FY13 data is based on a 52 week period
2013 52 weeks
£m
2012 52 weeks
£mProfit Before Tax Before Exceptional Items 20.8 25.2
Tax at standard rate (23.3% / 24.7%) 4.8 6.2
Current year tax losses not recognised 2.2 0.5
Prior year tax losses written off 2.2 2.0
Other prior year adjustments (0.5) (0.5)
Overseas tax rate differences 0.7 0.5
Other 0.3 (0.3)
Total Tax Expense Before Exceptional Items 9.7 8.4
Effective Tax Rate Before Exceptional Items 47% 33%
FULL YEAR RESULTSPRESENTATION 2013RESULTS FOR THE YEAR ENDED 1 DECEMBER 2013
www.sthree.com | SThree plc 12
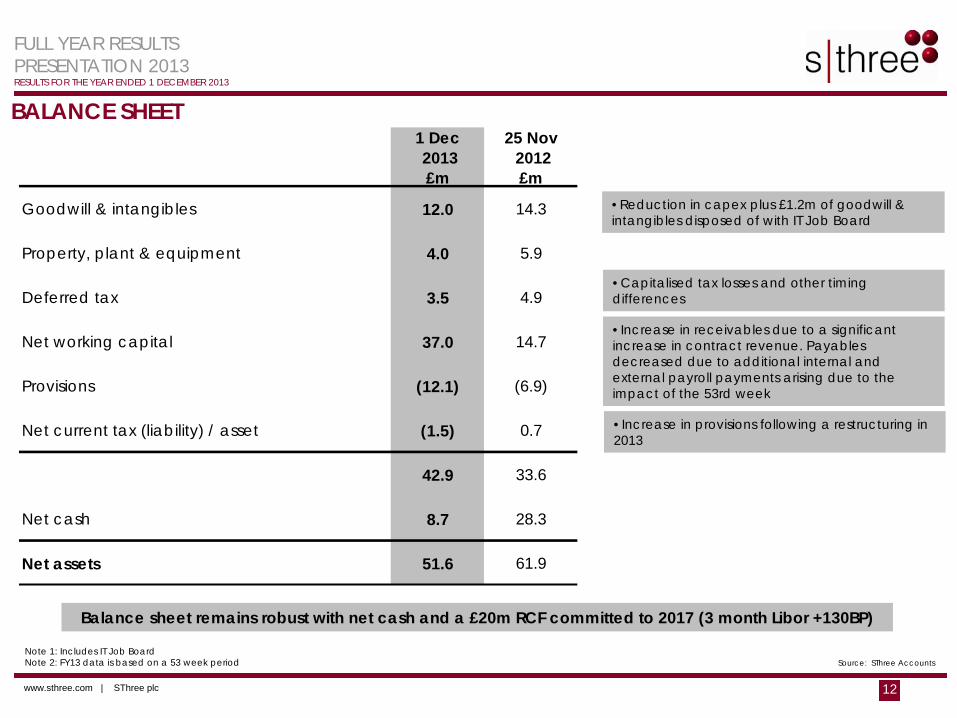
BALANCE SHEET
Source: SThree Accounts
Balance sheet remains robust with net cash and a £20m RCF committed to 2017 (3 month Libor +130BP)
Note 1: Includes IT Job BoardNote 2: FY13 data is based on a 53 week period
•Reduction in capex plus £1.2m of goodwill & intangibles disposed of with IT Job Board
•Capitalised tax losses and other timing differences
•Increase in receivables due to a significant increase in contract revenue. Payables decreased due to additional internal and external payroll payments arising due to the impact of the 53rd week
•Increase in provisions following a restructuring in 2013
1 Dec 2013 £m
25 Nov 2012 £m
Goodwill & intangibles 12.0 14.3
Property, plant & equipment 4.0 5.9
Deferred tax 3.5 4.9
Net working capital 37.0 14.7
Provisions (12.1) (6.9)
Net current tax (liability) / asset (1.5) 0.7
42.9 33.6
Net cash 8.7 28.3
Net assets 51.6 61.9
FULL YEAR RESULTSPRESENTATION 2013RESULTS FOR THE YEAR ENDED 1 DECEMBER 2013
www.sthree.com | SThree plc 13
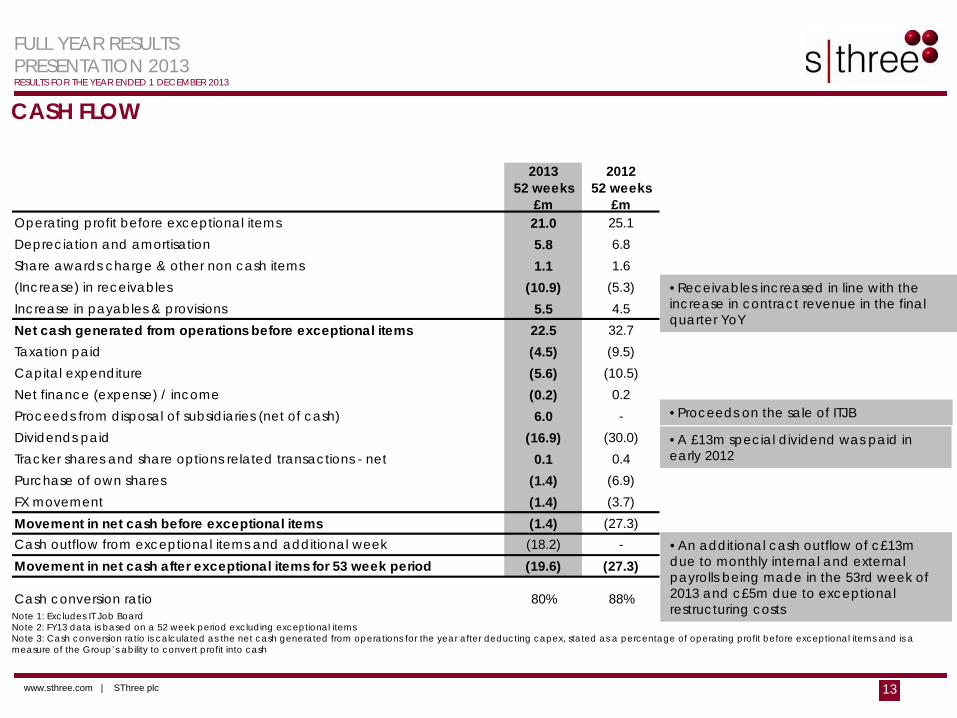
CASH FLOW
Note 1: Excludes IT Job BoardNote 2: FY13 data is based on a 52 week period excluding exceptional itemsNote 3: Cash conversion ratio is calculated as the net cash generated from operations for the year after deducting capex, stated as a percentage of operating profit before exceptional items and is a measure of the Group’s ability to convert profit into cash
•Proceeds on the sale of ITJB
•Receivables increased in line with the increase in contract revenue in the final quarter YoY
•An additional cash outflow of c£13m due to monthly internal and external payrolls being made in the 53rd week of 2013 and c£5m due to exceptional restructuring costs
•A £13m special dividend was paid in early 2012
2013 52 weeks
£m
2012 52 weeks
£mOperating profit before exceptional items 21.0 25.1Depreciation and amortisation 5.8 6.8Share awards charge & other non cash items 1.1 1.6(Increase) in receivables (10.9) (5.3)Increase in payables & provisions 5.5 4.5Net cash generated from operations before exceptional items 22.5 32.7Taxation paid (4.5) (9.5)Capital expenditure (5.6) (10.5)Net finance (expense) / income (0.2) 0.2Proceeds from disposal of subsidiaries (net of cash) 6.0 -Dividends paid (16.9) (30.0)Tracker shares and share options related transactions - net 0.1 0.4Purchase of own shares (1.4) (6.9)FX movement (1.4) (3.7)Movement in net cash before exceptional items (1.4) (27.3)Cash outflow from exceptional items and additional week (18.2) -Movement in net cash after exceptional items for 53 week period (19.6) (27.3)
Cash conversion ratio 80% 88%
FULL YEAR RESULTSPRESENTATION 2013RESULTS FOR THE YEAR ENDED 1 DECEMBER 2013
www.sthree.com | SThree plc 14
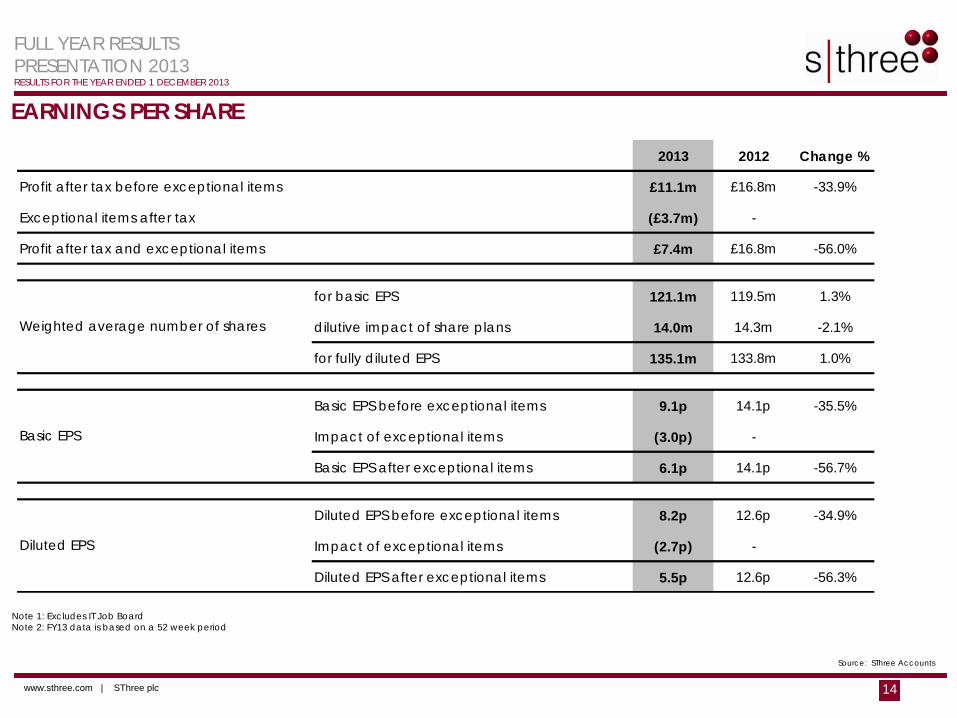
EARNINGS PER SHARE
Source: SThree Accounts
Note 1: Excludes IT Job BoardNote 2: FY13 data is based on a 52 week period
2013 2012 Change %
Profit after tax before exceptional items £11.1m £16.8m -33.9%
Exceptional items after tax (£3.7m) -
Profit after tax and exceptional items £7.4m £16.8m -56.0%
for basic EPS 121.1m 119.5m 1.3%
dilutive impact of share plans 14.0m 14.3m -2.1%
for fully diluted EPS 135.1m 133.8m 1.0%
Basic EPS before exceptional items 9.1p 14.1p -35.5%
Impact of exceptional items (3.0p) -
Basic EPS after exceptional items 6.1p 14.1p -56.7%
Diluted EPS before exceptional items 8.2p 12.6p -34.9%
Impact of exceptional items (2.7p) -
Diluted EPS after exceptional items 5.5p 12.6p -56.3%
Weighted average number of shares
Basic EPS
Diluted EPS
FULL YEAR RESULTSPRESENTATION 2013RESULTS FOR THE YEAR ENDED 1 DECEMBER 2013
www.sthree.com | SThree plc 15
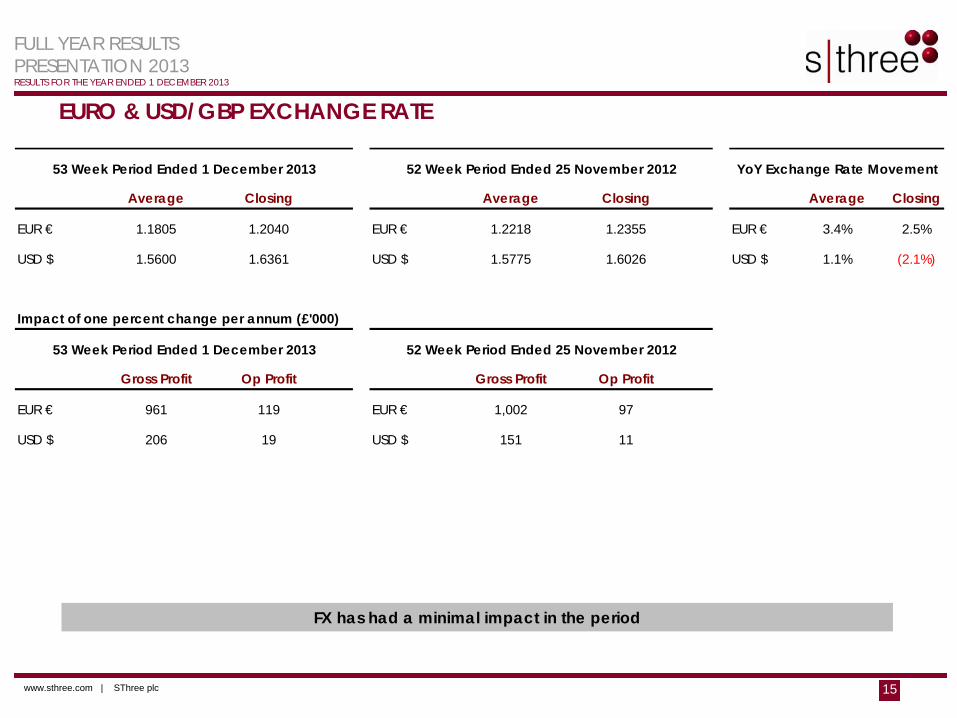
EURO & USD/GBP EXCHANGE RATE
FX has had a minimal impact in the period
Average Closing Average Closing Average Closing
EUR € 1.1805 1.2040 EUR € 1.2218 1.2355 EUR € 3.4% 2.5%
USD $ 1.5600 1.6361 USD $ 1.5775 1.6026 USD $ 1.1% (2.1%)
Impact of one percent change per annum (£'000)
Gross Profit Op Profit Gross Profit Op Profit
EUR € 961 119 EUR € 1,002 97
USD $ 206 19 USD $ 151 11
YoY Exchange Rate Movement53 Week Period Ended 1 December 2013 52 Week Period Ended 25 November 2012
52 Week Period Ended 25 November 201253 Week Period Ended 1 December 2013
www.sthree.com | SThree plc 16
FULL YEAR RESULTSPRESENTATION 2013RESULTS FOR THE YEAR ENDED 1 DECEMBER 2013
OPERATIONAL ANALYSIS
FULL YEAR RESULTSPRESENTATION 2013RESULTS FOR THE YEAR ENDED 1 DECEMBER 2013
www.sthree.com | SThree plc 17
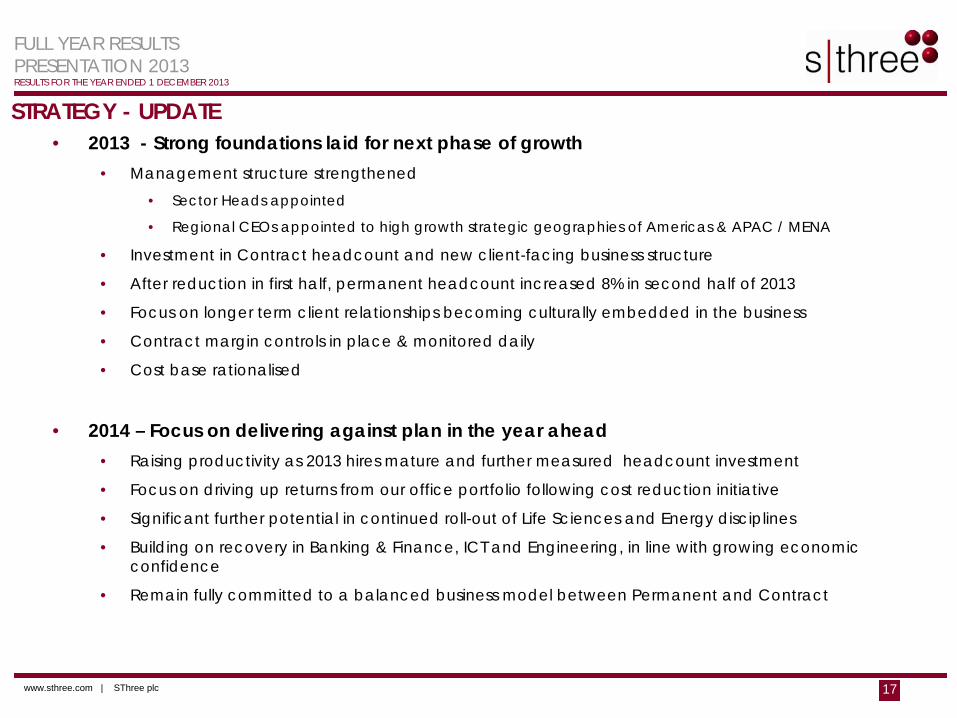
STRATEGY - UPDATE• 2013 - Strong foundations laid for next phase of growth
• Management structure strengthened• Sector Heads appointed
• Regional CEOs appointed to high growth strategic geographies of Americas & APAC / MENA
• Investment in Contract headcount and new client-facing business structure
• After reduction in first half, permanent headcount increased 8% in second half of 2013
• Focus on longer term client relationships becoming culturally embedded in the business
• Contract margin controls in place & monitored daily
• Cost base rationalised
• 2014 – Focus on delivering against plan in the year ahead• Raising productivity as 2013 hires mature and further measured headcount investment
• Focus on driving up returns from our office portfolio following cost reduction initiative
• Significant further potential in continued roll-out of Life Sciences and Energy disciplines
• Building on recovery in Banking & Finance, ICT and Engineering, in line with growing economic confidence
• Remain fully committed to a balanced business model between Permanent and Contract
FULL YEAR RESULTSPRESENTATION 2013RESULTS FOR THE YEAR ENDED 1 DECEMBER 2013
www.sthree.com | SThree plc 18
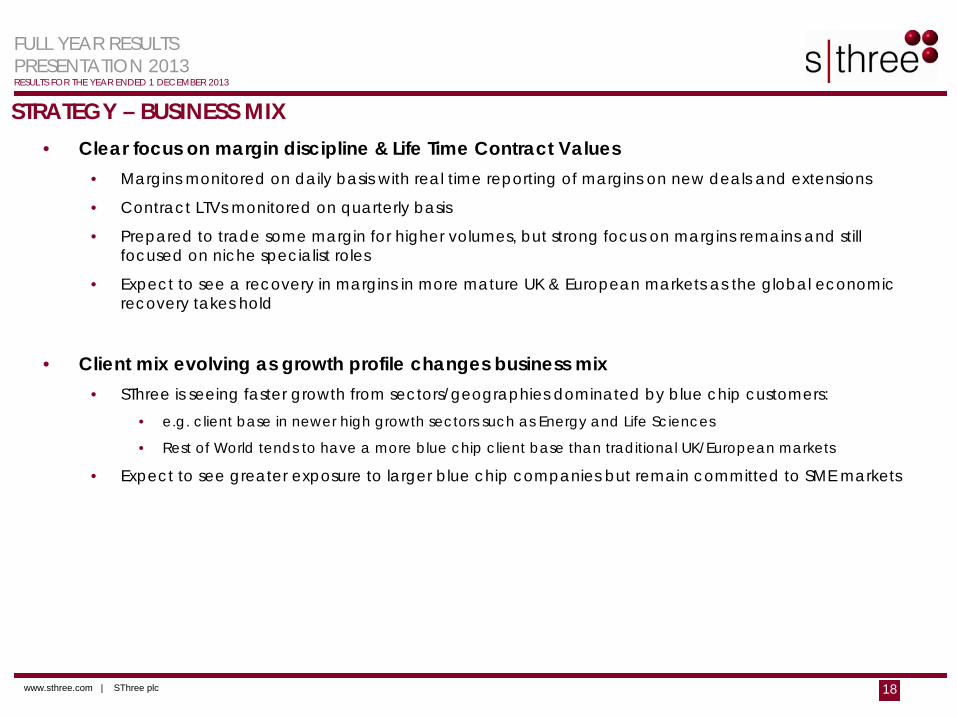
STRATEGY – BUSINESS MIX• Clear focus on margin discipline & Life Time Contract Values
• Margins monitored on daily basis with real time reporting of margins on new deals and extensions
• Contract LTVs monitored on quarterly basis
• Prepared to trade some margin for higher volumes, but strong focus on margins remains and still focused on niche specialist roles
• Expect to see a recovery in margins in more mature UK & European markets as the global economic recovery takes hold
• Client mix evolving as growth profile changes business mix • SThree is seeing faster growth from sectors/geographies dominated by blue chip customers:
• e.g. client base in newer high growth sectors such as Energy and Life Sciences
• Rest of World tends to have a more blue chip client base than traditional UK/European markets
• Expect to see greater exposure to larger blue chip companies but remain committed to SME markets
FULL YEAR RESULTSPRESENTATION 2013RESULTS FOR THE YEAR ENDED 1 DECEMBER 2013
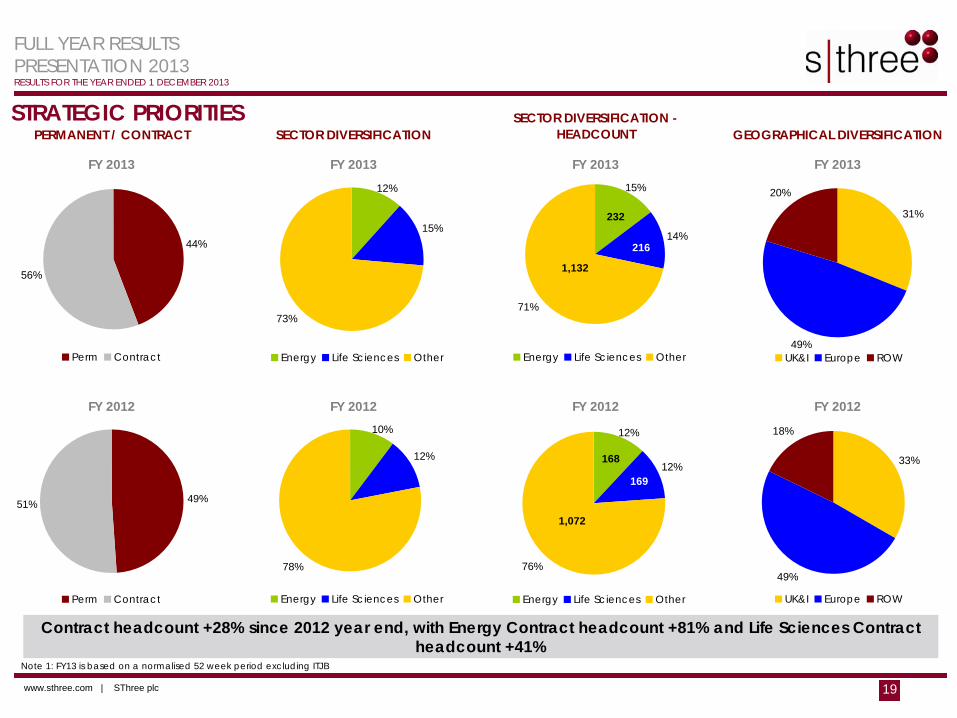
www.sthree.com | SThree plc 19
FY 2013
FY 2012FY 2012 FY 2012 FY 2012
GEOGRAPHICAL DIVERSIFICATIONSECTOR DIVERSIFICATIONPERMANENT / CONTRACT
FY 2013 FY 2013 FY 2013
SECTOR DIVERSIFICATION - HEADCOUNT
44%
56%
Perm Contract
15%
73%
12%
Energy Life Sciences Other
31%
49%
20%
UK&I Europe ROW
49%51%
Perm Contract
12%
78%
10%
Energy Life Sciences Other
33%
49%
18%
UK&I Europe ROW
14%
71%
15%
Energy Life Sciences Other
12%
76%
12%
Energy Life Sciences Other
STRATEGIC PRIORITIES
Note 1: FY13 is based on a normalised 52 week period excluding ITJB
Contract headcount +28% since 2012 year end, with Energy Contract headcount +81% and Life Sciences Contract headcount +41%
232
216
1,132
168
169
1,072
FULL YEAR RESULTSPRESENTATION 2013RESULTS FOR THE YEAR ENDED 1 DECEMBER 2013
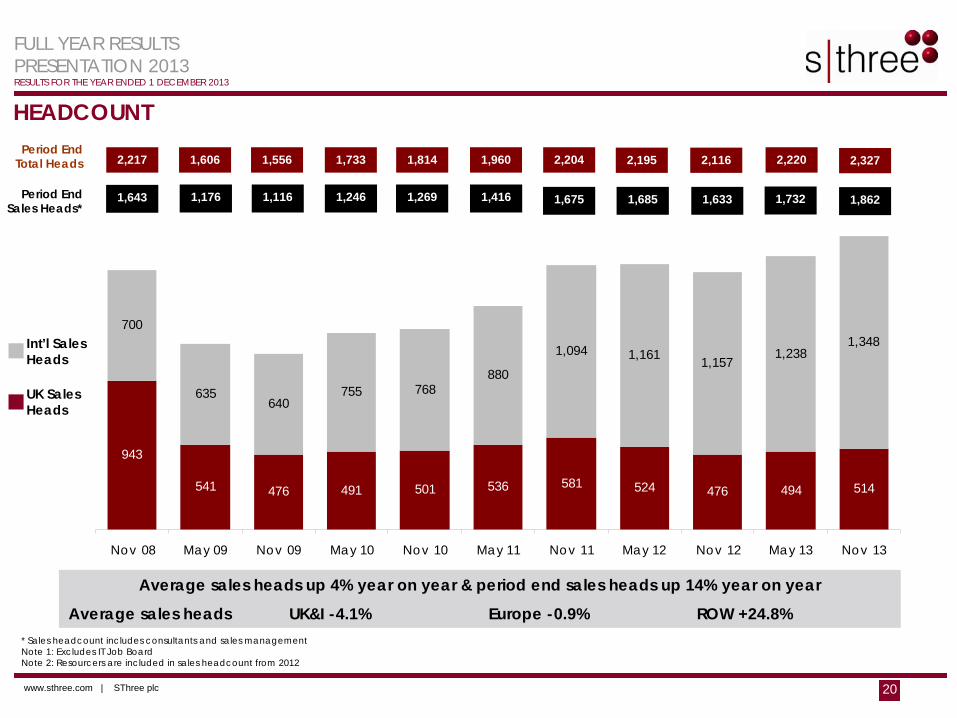
www.sthree.com | SThree plc 20
943
541 476 491 501 536 581 524 476 494 514
700
635640
755 768880
1,094 1,161 1,1571,238
1,348
Nov 08 May 09 Nov 09 May 10 Nov 10 May 11 Nov 11 May 12 Nov 12 May 13 Nov 13
HEADCOUNT
Average sales heads up 4% year on year & period end sales heads up 14% year on year
Average sales heads UK&I -4.1% Europe -0.9% ROW +24.8%
Int’l Sales Heads
UK Sales Heads
1,606 1,556 1,733 1,814 1,960 2,204 2,220
Period End Sales Heads*
1,176 1,116 1,246 1,269 1,416 1,675 1,732
2,195
1,685
2,116
1,633
Period End Total Heads
* Sales headcount includes consultants and sales managementNote 1: Excludes IT Job BoardNote 2: Resourcers are included in sales headcount from 2012
2,217
1,643
2,327
1,862
FULL YEAR RESULTSPRESENTATION 2013RESULTS FOR THE YEAR ENDED 1 DECEMBER 2013
www.sthree.com | SThree plc 21
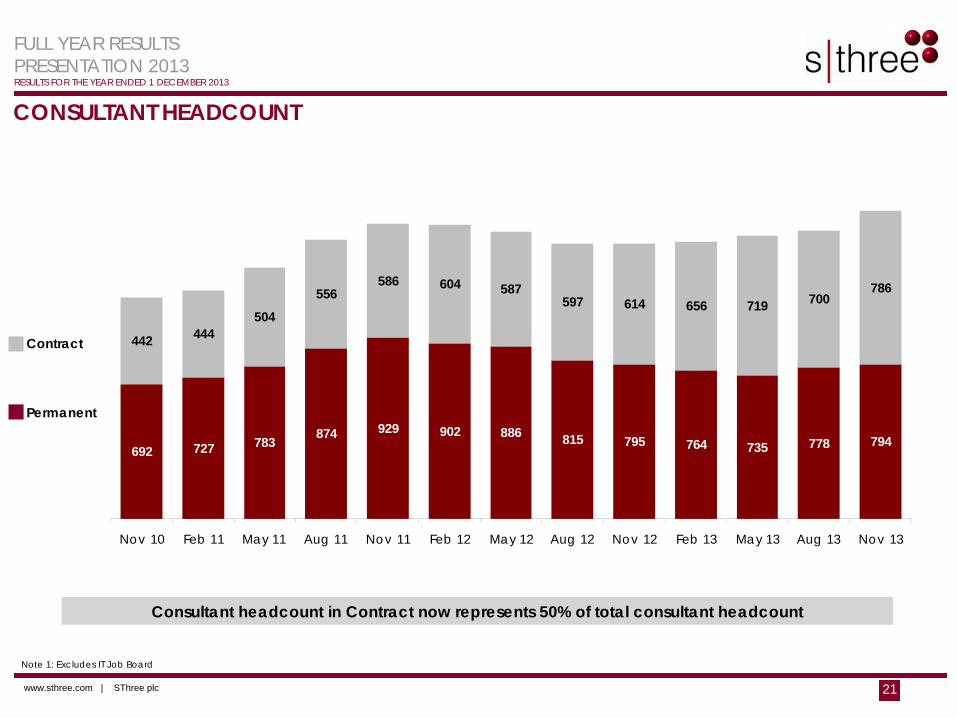
CONSULTANT HEADCOUNT
Contract
Permanent
Note 1: Excludes IT Job Board
692 727 783 874 929 902 886 815 795 764 735 778 794
442 444504
556586 604 587
597 614 656 719 700786
Nov 10 Feb 11 May 11 Aug 11 Nov 11 Feb 12 May 12 Aug 12 Nov 12 Feb 13 May 13 Aug 13 Nov 13
Consultant headcount in Contract now represents 50% of total consultant headcount
FULL YEAR RESULTSPRESENTATION 2013RESULTS FOR THE YEAR ENDED 1 DECEMBER 2013
www.sthree.com | SThree plc 22
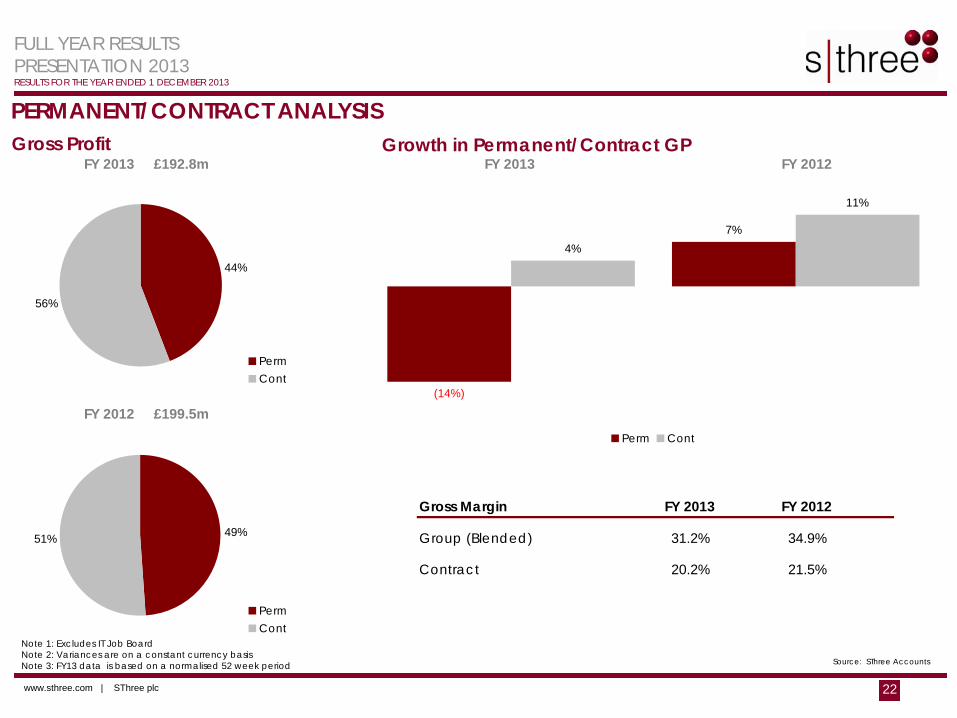
PERMANENT/CONTRACT ANALYSISGross Profit
Note 1: Excludes IT Job BoardNote 2: Variances are on a constant currency basisNote 3: FY13 data is based on a normalised 52 week period Source: SThree Accounts
Growth in Permanent/Contract GP
Gross Margin FY 2013 FY 2012
Group (Blended) 31.2% 34.9%
Contract 20.2% 21.5%
FY 2012 £199.5m
FY 2013 £192.8m FY 2012FY 2013
44%
56%
PermCont
49%51%
PermCont
(14%)
7%4%
11%
Perm Cont
FULL YEAR RESULTSPRESENTATION 2013RESULTS FOR THE YEAR ENDED 1 DECEMBER 2013
www.sthree.com | SThree plc 23
£8,084£9,252
£9,834
£11,383 £11,510£12,255 £12,715 £12,695
£0
£2,000
£4,000
£6,000
£8,000
£10,000
£12,000
£14,000
FY 2006 FY 2007 FY 2008 FY 2009 FY 2010 FY 2011 FY 2012 FY 2013
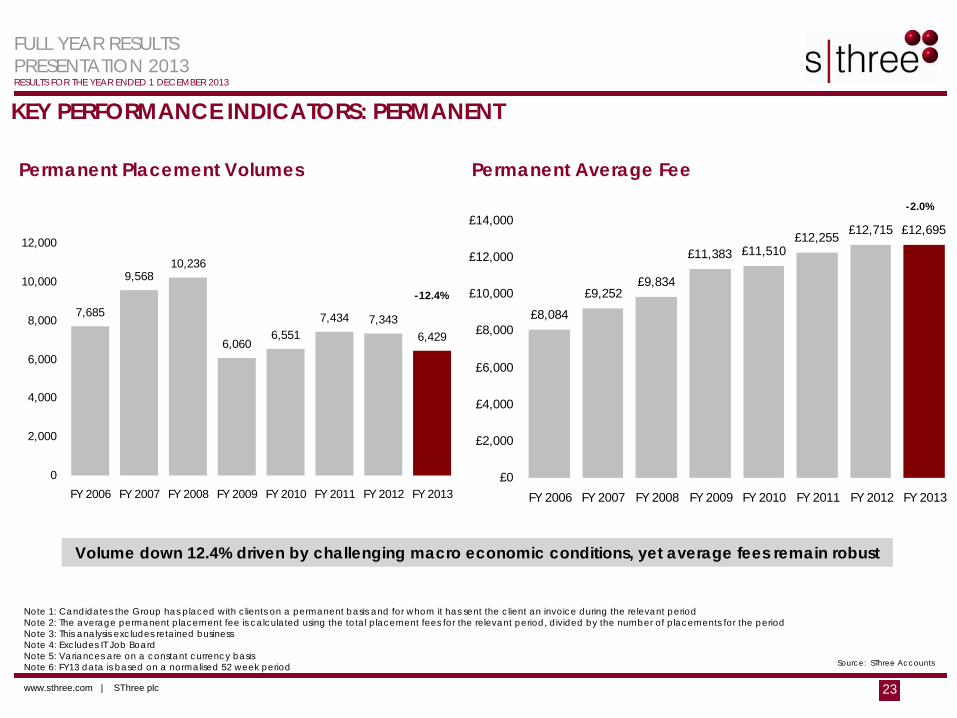
KEY PERFORMANCE INDICATORS: PERMANENT
Permanent Average Fee
Note 1: Candidates the Group has placed with clients on a permanent basis and for whom it has sent the client an invoice during the relevant periodNote 2: The average permanent placement fee is calculated using the total placement fees for the relevant period, divided by the number of placements for the period Note 3: This analysis excludes retained businessNote 4: Excludes IT Job BoardNote 5: Variances are on a constant currency basisNote 6: FY13 data is based on a normalised 52 week period Source: SThree Accounts
Permanent Placement Volumes
Volume down 12.4% driven by challenging macro economic conditions, yet average fees remain robust
7,685
9,56810,236
6,0606,551
7,434 7,3436,429
0
2,000
4,000
6,000
8,000
10,000
12,000
FY 2006 FY 2007 FY 2008 FY 2009 FY 2010 FY 2011 FY 2012 FY 2013
-12.4%
-2.0%
FULL YEAR RESULTSPRESENTATION 2013RESULTS FOR THE YEAR ENDED 1 DECEMBER 2013
www.sthree.com | SThree plc 24
4,719
5,662 5,745
4,157 4,3594,692
5,122
5,791
0
1,000
2,000
3,000
4,000
5,000
6,000
7,000
FY 2006 FY 2007 FY 2008 FY 2009 FY 2010 FY 2011 FY 2012 FY 2013
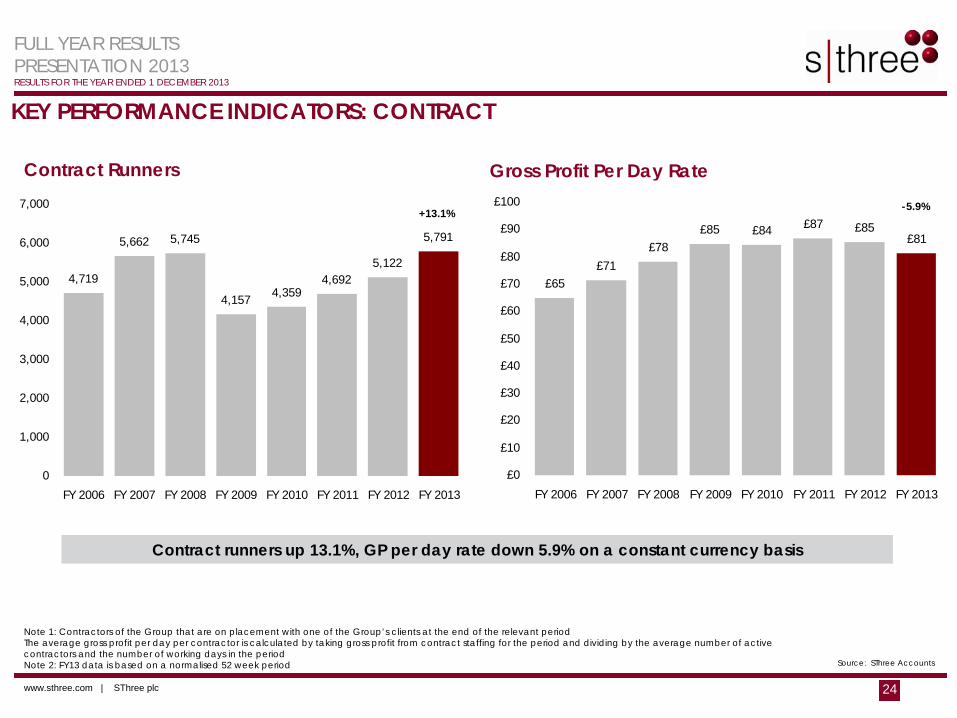
KEY PERFORMANCE INDICATORS: CONTRACT
Gross Profit Per Day Rate
Note 1: Contractors of the Group that are on placement with one of the Group’s clients at the end of the relevant periodThe average gross profit per day per contractor is calculated by taking gross profit from contract staffing for the period and dividing by the average number of active contractors and the number of working days in the periodNote 2: FY13 data is based on a normalised 52 week period
Contract Runners
Contract runners up 13.1%, GP per day rate down 5.9% on a constant currency basis
+13.1%
Source: SThree Accounts
-5.9%
£65£71
£78£85 £84 £87 £85
£81
£0
£10
£20
£30
£40
£50
£60
£70
£80
£90
£100
FY 2006 FY 2007 FY 2008 FY 2009 FY 2010 FY 2011 FY 2012 FY 2013
-5.9%
FULL YEAR RESULTSPRESENTATION 2013RESULTS FOR THE YEAR ENDED 1 DECEMBER 2013
www.sthree.com | SThree plc 25
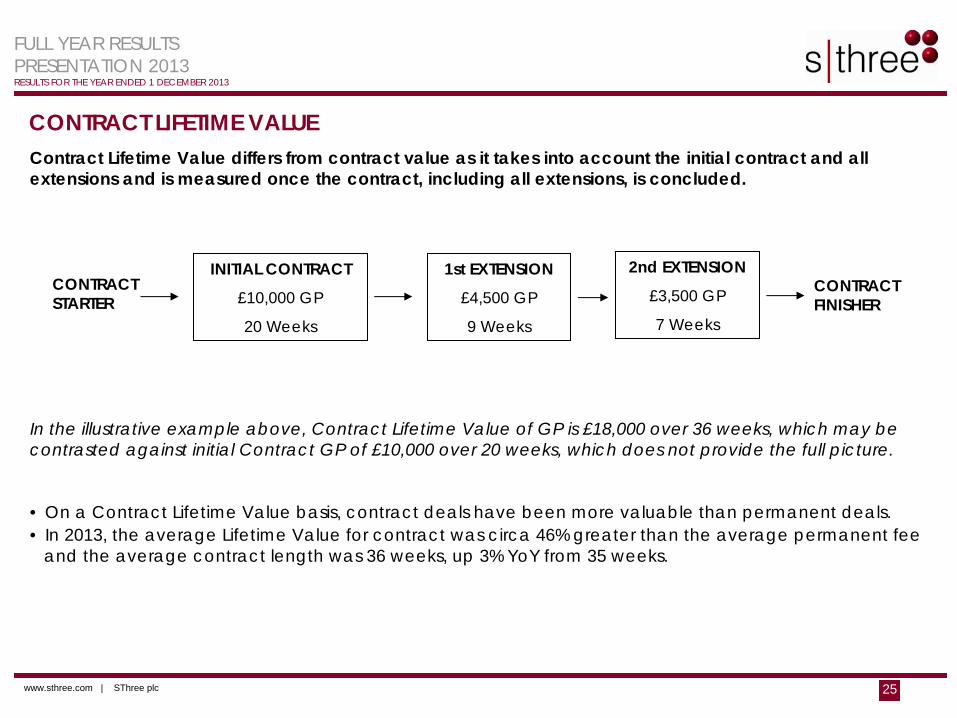
CONTRACT LIFETIME VALUEContract Lifetime Value differs from contract value as it takes into account the initial contract and all extensions and is measured once the contract, including all extensions, is concluded.
In the illustrative example above, Contract Lifetime Value of GP is £18,000 over 36 weeks, which may be contrasted against initial Contract GP of £10,000 over 20 weeks, which does not provide the full picture.
• On a Contract Lifetime Value basis, contract deals have been more valuable than permanent deals. • In 2013, the average Lifetime Value for contract was circa 46% greater than the average permanent fee
and the average contract length was 36 weeks, up 3% YoY from 35 weeks.
INITIAL CONTRACT
£10,000 GP
20 Weeks
1st EXTENSION
£4,500 GP
9 Weeks
2nd EXTENSION
£3,500 GP
7 Weeks
CONTRACT STARTER
CONTRACT FINISHER
FULL YEAR RESULTSPRESENTATION 2013RESULTS FOR THE YEAR ENDED 1 DECEMBER 2013
www.sthree.com | SThree plc 26
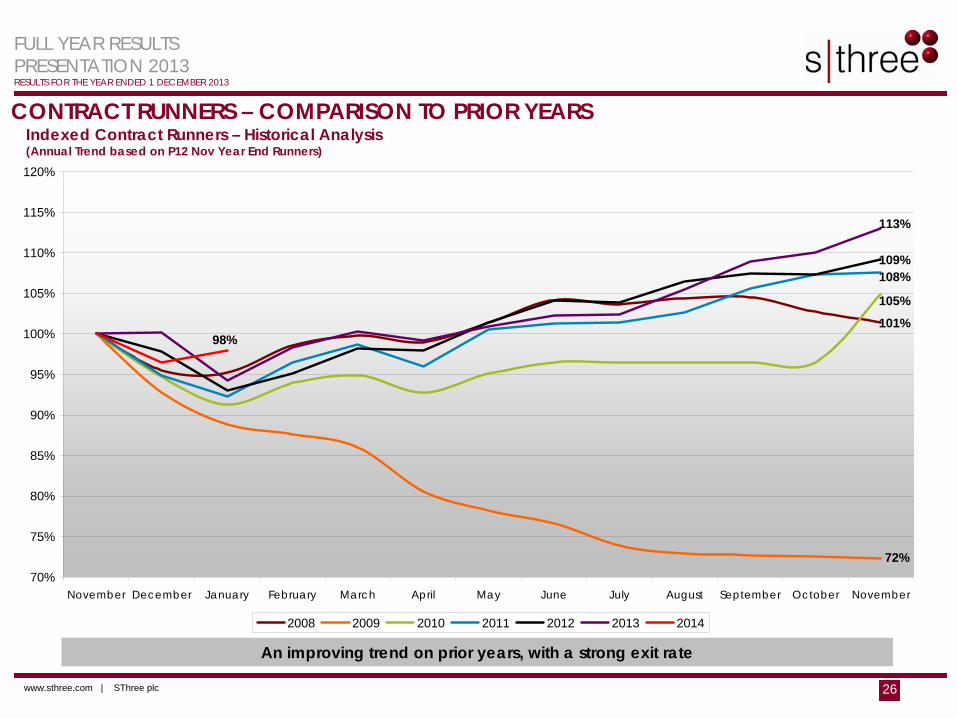
CONTRACT RUNNERS – COMPARISON TO PRIOR YEARS
An improving trend on prior years, with a strong exit rate
Indexed Contract Runners – Historical Analysis(Annual Trend based on P12 Nov Year End Runners)
101%
72%
105%
108%109%
113%
98%
70%
75%
80%
85%
90%
95%
100%
105%
110%
115%
120%
November December January February March April May June July August September October November
2008 2009 2010 2011 2012 2013 2014
FULL YEAR RESULTSPRESENTATION 2013RESULTS FOR THE YEAR ENDED 1 DECEMBER 2013
www.sthree.com | SThree plc 27
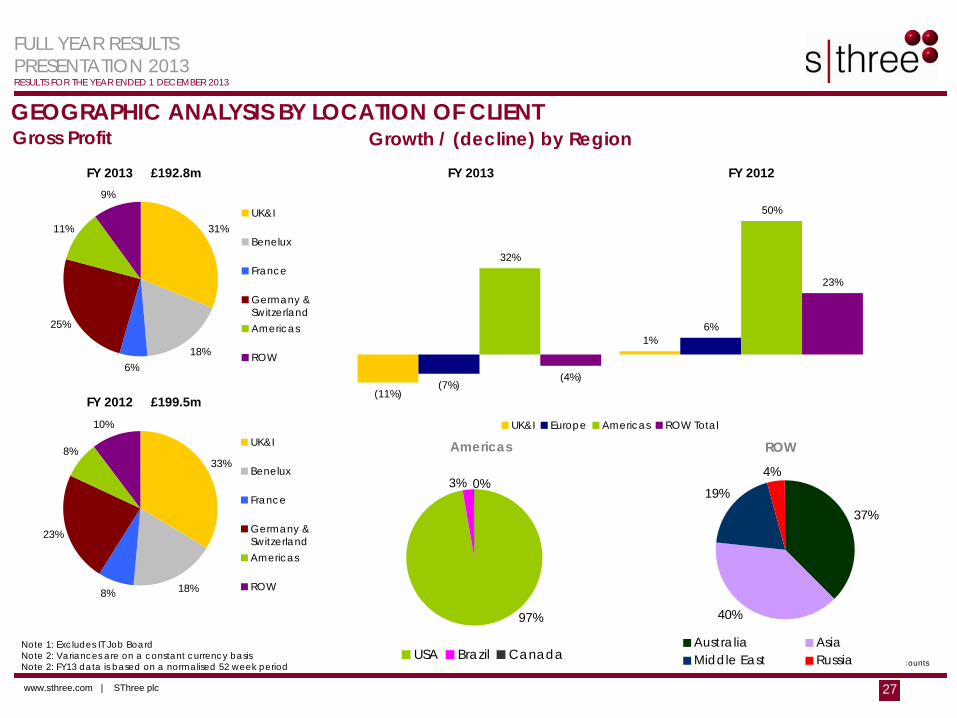
GEOGRAPHIC ANALYSIS BY LOCATION OF CLIENTGross Profit
Source: SThree Accounts
Growth / (decline) by Region
Note 1: Excludes IT Job BoardNote 2: Variances are on a constant currency basisNote 2: FY13 data is based on a normalised 52 week period
Americas
97%
0%3%
USA Brazil Canada
ROW
19%37%
4%
40%
Australia AsiaMiddle East Russia
FY 2013 £192.8m
FY 2012 £199.5m
FY 2012FY 2013
18%6%
25%
11%
9%
31%UK&I
Benelux
France
Germany &SwitzerlandAmericas
ROW
33%
18%8%
23%
8%
10%UK&I
Benelux
France
Germany &SwitzerlandAmericas
ROW
(11%)
1%
(7%)
6%
32%
50%
(4%)
23%
UK&I Europe Americas ROW Total
FULL YEAR RESULTSPRESENTATION 2013RESULTS FOR THE YEAR ENDED 1 DECEMBER 2013
www.sthree.com | SThree plc 28
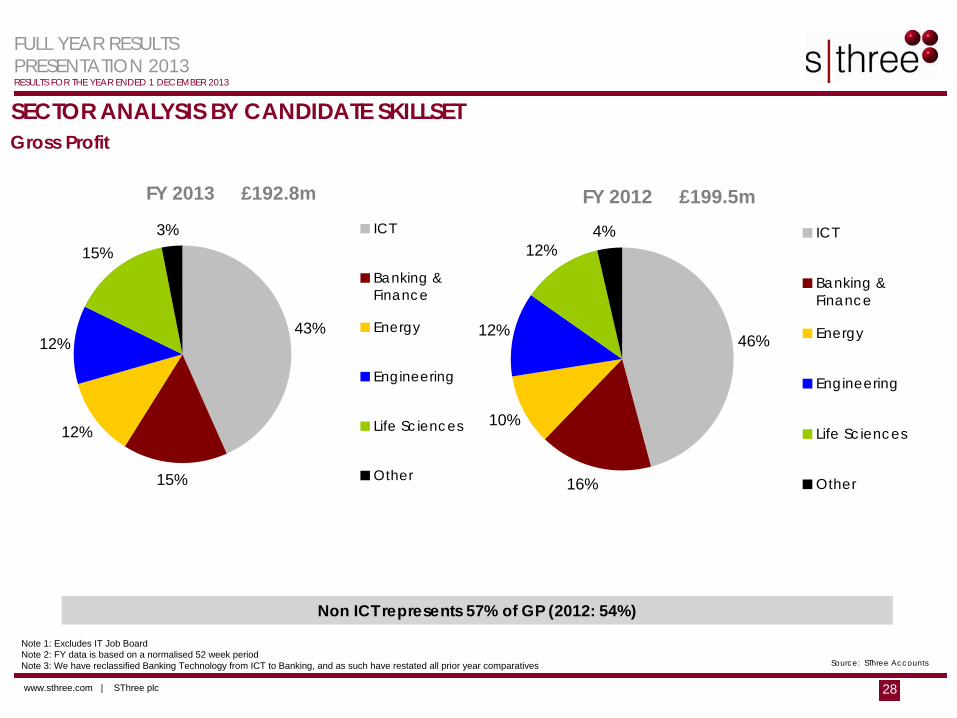
SECTOR ANALYSIS BY CANDIDATE SKILLSETGross Profit
Source: SThree Accounts
Note 1: Excludes IT Job BoardNote 2: FY data is based on a normalised 52 week periodNote 3: We have reclassified Banking Technology from ICT to Banking, and as such have restated all prior year comparatives
Non ICT represents 57% of GP (2012: 54%)
FY 2013 £192.8m
43%
15%
12%
12%
15%3% ICT
Banking &Finance
Energy
Engineering
Life Sciences
Other
FY 2012 £199.5m
46%
16%
10%
12%
12%4% ICT
Banking &Finance
Energy
Engineering
Life Sciences
Other
FULL YEAR RESULTSPRESENTATION 2013RESULTS FOR THE YEAR ENDED 1 DECEMBER 2013
www.sthree.com | SThree plc 29
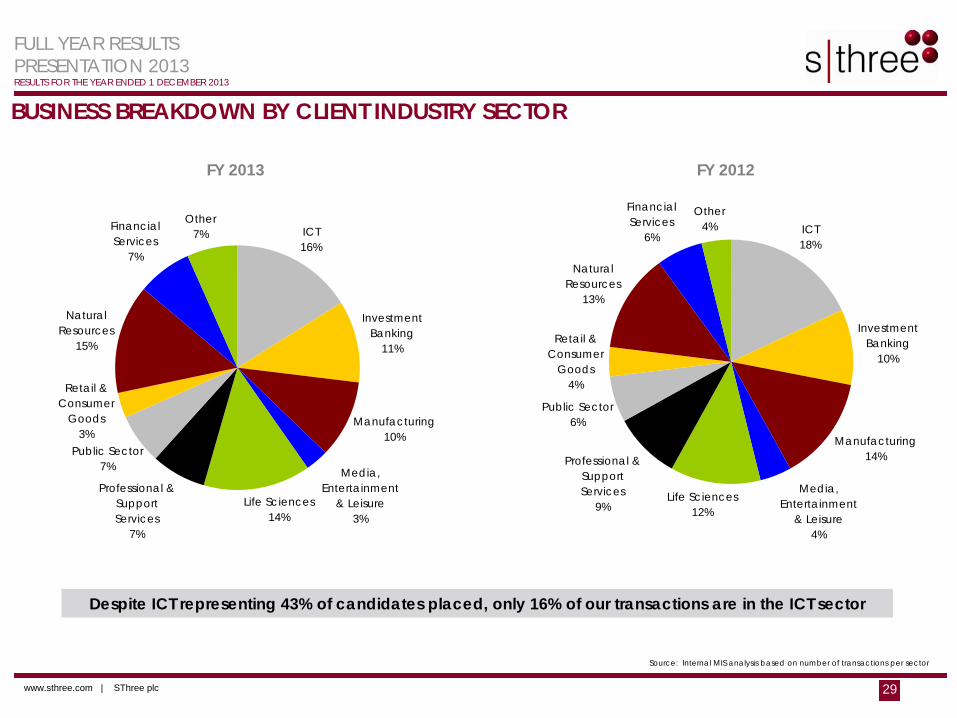
BUSINESS BREAKDOWN BY CLIENT INDUSTRY SECTOR
Despite ICT representing 43% of candidates placed, only 16% of our transactions are in the ICT sector
Source: Internal MIS analysis based on number of transactions per sector
FY 2013 FY 2012
ICT16%
Investment Banking
11%
Manufacturing10%
Media, Entertainment
& Leisure3%
Life Sciences14%
Professional & Support Services
7%
Other7%
Natural Resources
15%
Public Sector7%
Retail & Consumer
Goods3%
Financial Services
7%
ICT18%
Investment Banking
10%
Manufacturing14%
Media, Entertainment
& Leisure4%
Life Sciences12%
Professional & Support Services
9%
Other4%
Financial Services
6%
Retail & Consumer
Goods4%
Public Sector6%
Natural Resources
13%
FULL YEAR RESULTSPRESENTATION 2013RESULTS FOR THE YEAR ENDED 1 DECEMBER 2013
www.sthree.com | SThree plc 30
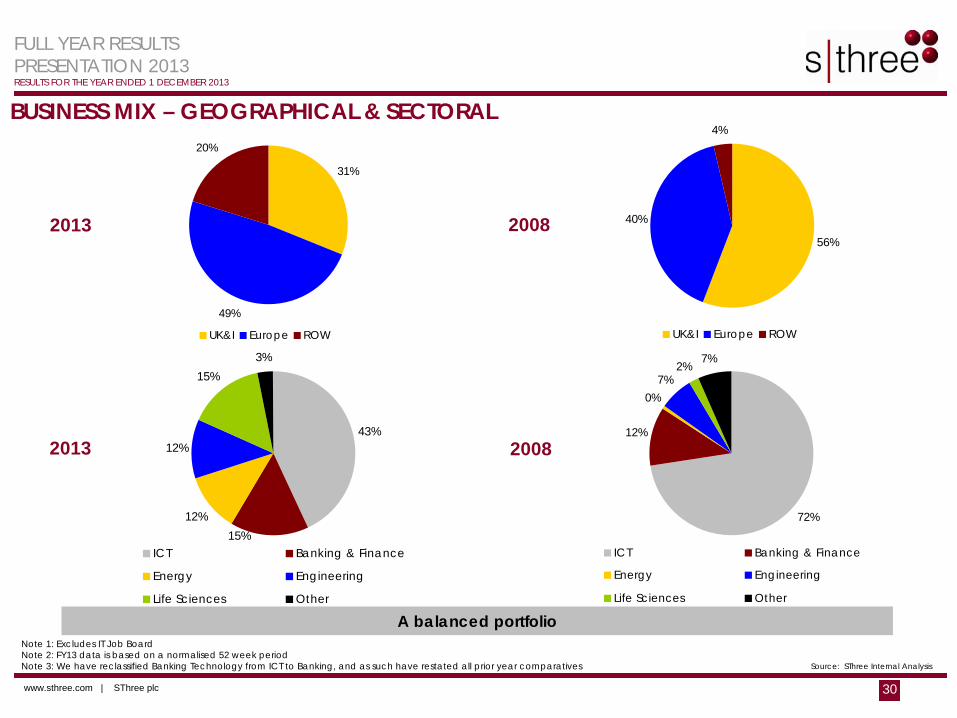
43%
12%
12%
15%3%
15%ICT Banking & Finance
Energy Engineering
Life Sciences Other
72%
12%
0%7%
2%7%
ICT Banking & Finance
Energy Engineering
Life Sciences Other
BUSINESS MIX – GEOGRAPHICAL & SECTORAL
A balanced portfolio
Source: SThree Internal Analysis
Note 1: Excludes IT Job BoardNote 2: FY13 data is based on a normalised 52 week periodNote 3: We have reclassified Banking Technology from ICT to Banking, and as such have restated all prior year comparatives
56%
40%
4%
UK&I Europe ROW
31%
49%
20%
UK&I Europe ROW
2013
2013 2008
2008
FULL YEAR RESULTSPRESENTATION 2013RESULTS FOR THE YEAR ENDED 1 DECEMBER 2013
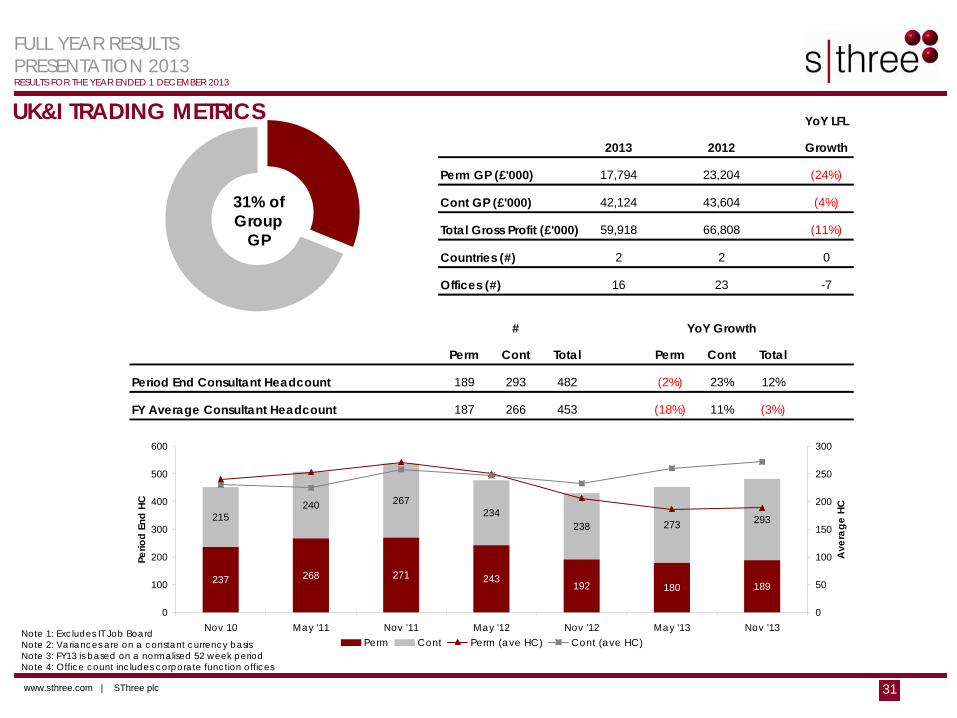
www.sthree.com | SThree plc 31
YoY LFL
2013 2012 Growth
Perm GP (£'000) 17,794 23,204 (24%)
Cont GP (£'000) 42,124 43,604 (4%)
Total Gross Profit (£'000) 59,918 66,808 (11%)
Countries (#) 2 2 0
Offices (#) 16 23 -7
Perm Cont Total Perm Cont Total
Period End Consultant Headcount 189 293 482 (2%) 23% 12%
FY Average Consultant Headcount 187 266 453 (18%) 11% (3%)
# YoY Growth
237 268 271 243192 180 189
215240 267
234238 273 293
0
100
200
300
400
500
600
Nov 10 May '11 Nov '11 May '12 Nov '12 May '13 Nov '13
Perio
d En
d HC
0
50
100
150
200
250
300
Ave
rage
HC
Perm Cont Perm (ave HC) Cont (ave HC)
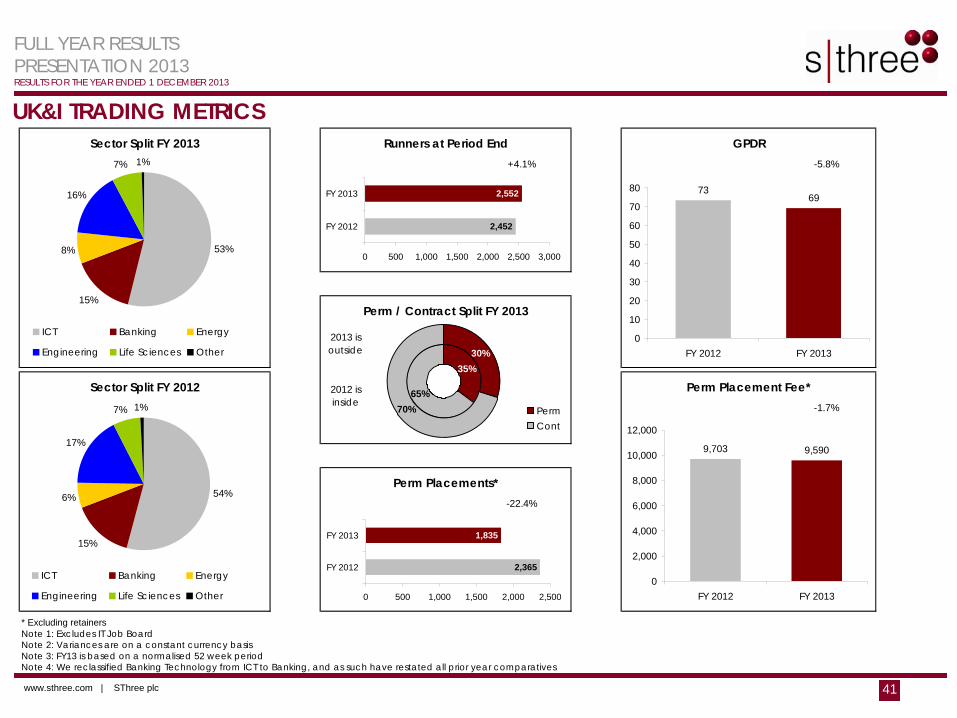
UK&I TRADING METRICS
31% of Group
GP
Note 1: Excludes IT Job BoardNote 2: Variances are on a constant currency basisNote 3: FY13 is based on a normalised 52 week periodNote 4: Office count includes corporate function offices
FULL YEAR RESULTSPRESENTATION 2013RESULTS FOR THE YEAR ENDED 1 DECEMBER 2013
www.sthree.com | SThree plc 32
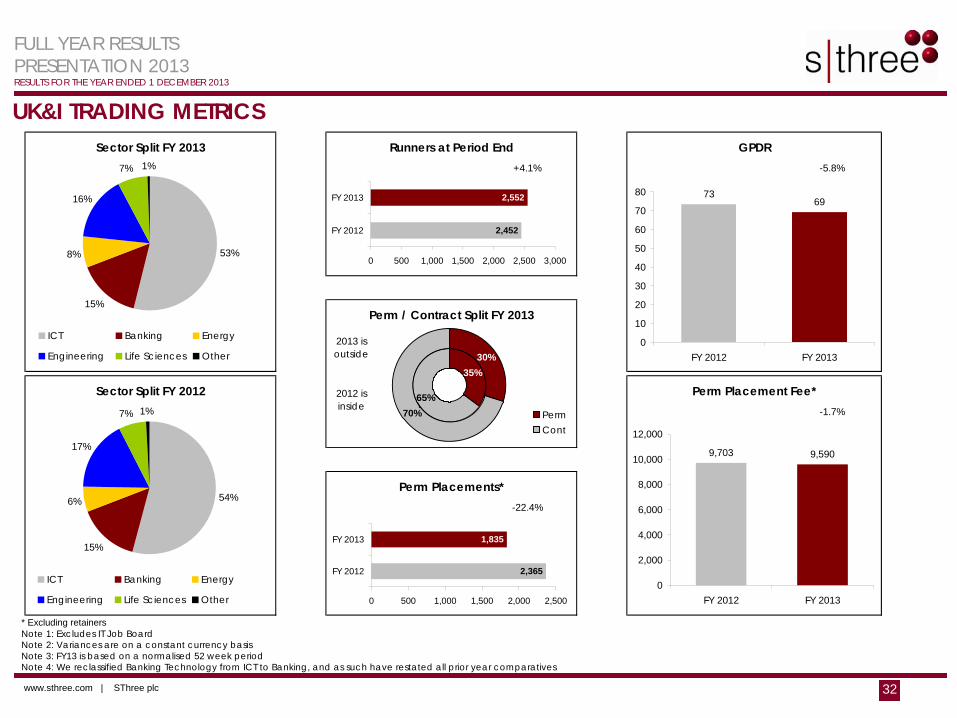
UK&I TRADING METRICS
* Excluding retainersNote 1: Excludes IT Job BoardNote 2: Variances are on a constant currency basisNote 3: FY13 is based on a normalised 52 week periodNote 4: We reclassified Banking Technology from ICT to Banking, and as such have restated all prior year comparatives
Runners at Period End+4.1%
GPDR-5.8%
Perm Placement Fee*-1.7%
Sector Split FY 2012
Sector Split FY 2013
Perm Placements*-22.4%
Perm / Contract Split FY 2013
2012 is inside
2013 is outside
2,452
2,552
0 500 1,000 1,500 2,000 2,500 3,000
FY 2012
FY 2013
2,365
1,835
0 500 1,000 1,500 2,000 2,500
FY 2012
FY 2013
7369
0
10
20
30
40
50
60
70
80
FY 2012 FY 2013
9,703 9,590
0
2,000
4,000
6,000
8,000
10,000
12,000
FY 2012 FY 2013
53%
15%
8%
16%
7% 1%
ICT Banking Energy
Engineering Life Sciences Other
54%
15%
6%
17%
7% 1%
ICT Banking Energy
Engineering Life Sciences Other
65%70%
35%30%
PermCont
FULL YEAR RESULTSPRESENTATION 2013RESULTS FOR THE YEAR ENDED 1 DECEMBER 2013
www.sthree.com | SThree plc 33
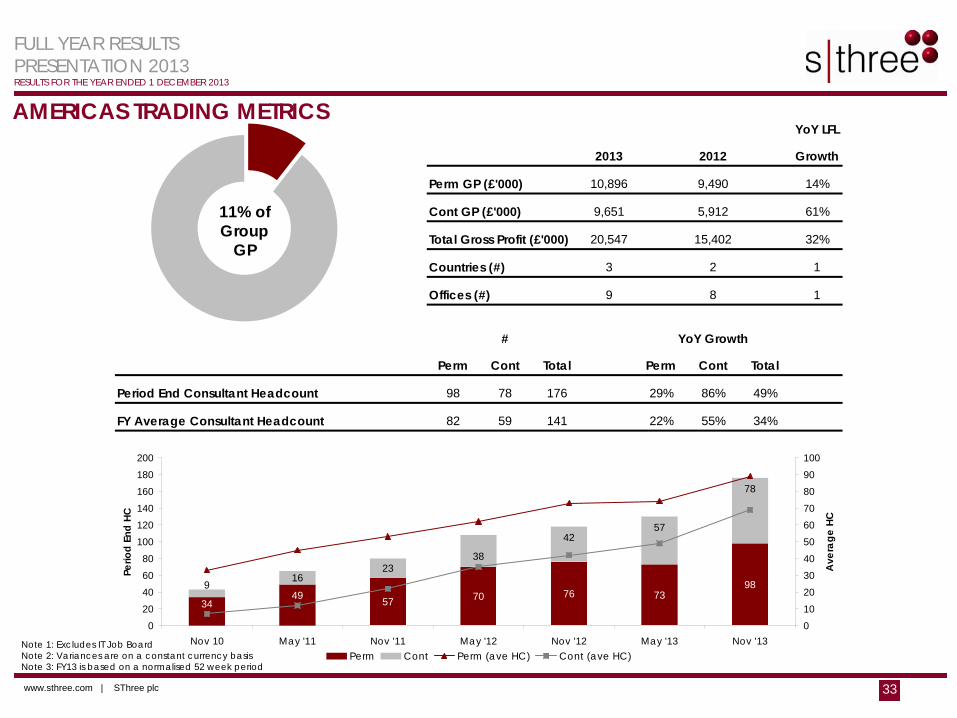
YoY LFL
2013 2012 Growth
Perm GP (£'000) 10,896 9,490 14%
Cont GP (£'000) 9,651 5,912 61%
Total Gross Profit (£'000) 20,547 15,402 32%
Countries (#) 3 2 1
Offices (#) 9 8 1
Perm Cont Total Perm Cont Total
Period End Consultant Headcount 98 78 176 29% 86% 49%
FY Average Consultant Headcount 82 59 141 22% 55% 34%
# YoY Growth
57 70 76 739816
3449
9
42
3823
57
78
020406080
100120140160180200
Nov 10 May '11 Nov '11 May '12 Nov '12 May '13 Nov '13
Perio
d En
d HC
0102030405060708090100
Ave
rage
HC
Perm Cont Perm (ave HC) Cont (ave HC)
AMERICAS TRADING METRICS
11% of Group
GP
Note 1: Excludes IT Job BoardNote 2: Variances are on a constant currency basisNote 3: FY13 is based on a normalised 52 week period

FULL YEAR RESULTSPRESENTATION 2013RESULTS FOR THE YEAR ENDED 1 DECEMBER 2013
www.sthree.com | SThree plc 34
AMERICAS TRADING METRICS
* Excluding retainersNote 1: Excludes IT Job BoardNote 2: Variances are on a constant currency basisNote 3: FY13 is based on a normalised 52 week periodNote 4: We reclassified Banking Technology from ICT to Banking, and as such have restated all prior year comparatives
Runners at Period End+91.5%
GPDR-13.5%
Perm Placement Fee*-2.4%
Sector Split FY 2012
Sector Split FY 2013
Perm Placements*+17.8%
Perm / Contract Split FY 2013
2013 is outside
2012 is inside
284
544
0 100 200 300 400 500 600
FY 2012
FY 2013
489
576
0 200 400 600 800
FY 2012
FY 2013
114100
0
20
40
60
80
100
120
140
FY 2012 FY 2013
18,421 18,114
02,0004,0006,0008,000
10,00012,00014,00016,00018,00020,000
FY 2012 FY 2013
1%
37%
26%
0%
36%
ICT Banking Energy
Engineering Life Sciences Other
1%
39%
26%
1%
33%
ICT Banking Energy
Engineering Life Sciences Other
47%38%
62%53%
PermCont
FULL YEAR RESULTSPRESENTATION 2013RESULTS FOR THE YEAR ENDED 1 DECEMBER 2013
www.sthree.com | SThree plc 35
SUMMARY & 2014 OUTLOOK
• Improving sentiment evident in some markets but overall picture remains mixed
• Demand in newer sectors such as Energy and Life Sciences remains resilient
• Contract headcount up by 28% since the start of last year, and expect to see the full benefit of this investment in 2014
• Permanent headcount issues addressed and consultant productivity beginning to build
• Organisational structure strengthened and focused
• Cost rationalisation initiative reduces our underlying annualised cost base by circa £8m
• Remain financially strong & agile and continue to invest for the long term
• Foundations for future growth established – focus on execution in 2014

www.sthree.com | SThree plc 36
FULL YEAR RESULTSPRESENTATION 2013RESULTS FOR THE YEAR ENDED 1 DECEMBER 2013
QUESTIONSThank you for listening, please feel free to ask any questions

www.sthree.com | SThree plc 37
FULL YEAR RESULTSPRESENTATION 2013RESULTS FOR THE YEAR ENDED 1 DECEMBER 2013
SUPPLEMENTARY MATERIAL
FULL YEAR RESULTSPRESENTATION 2013RESULTS FOR THE YEAR ENDED 1 DECEMBER 2013
www.sthree.com | SThree plc 38
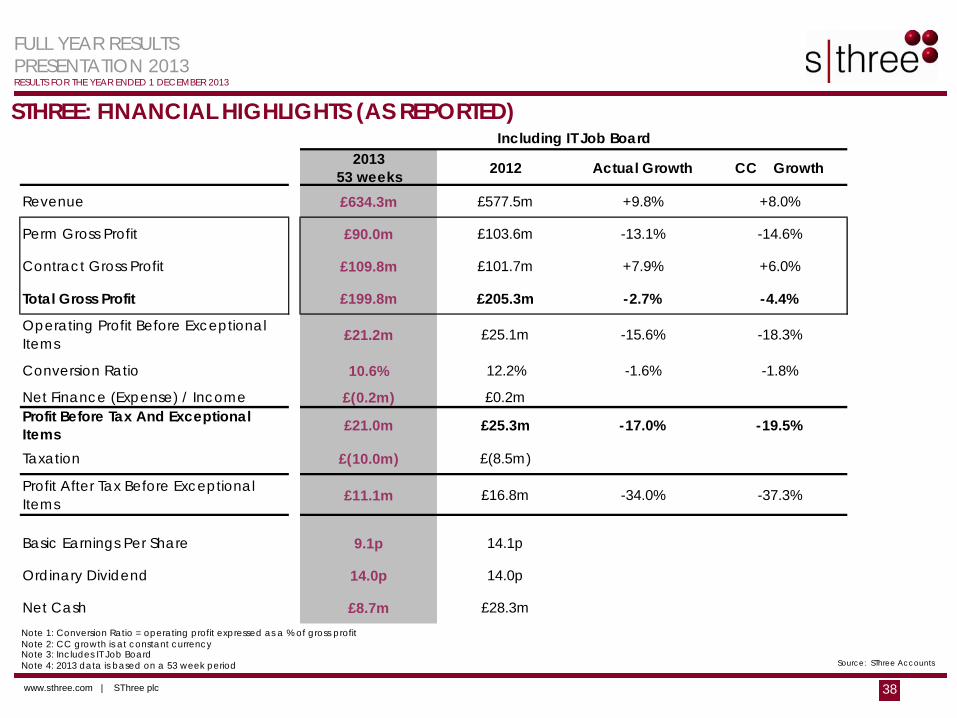
STHREE: FINANCIAL HIGHLIGHTS (AS REPORTED)
Note 1: Conversion Ratio = operating profit expressed as a % of gross profitNote 2: CC growth is at constant currencyNote 3: Includes IT Job BoardNote 4: 2013 data is based on a 53 week period Source: SThree Accounts
2013 53 weeks 2012 Actual Growth CC Growth
Revenue £634.3m £577.5m +9.8% +8.0%
Perm Gross Profit £90.0m £103.6m -13.1% -14.6%
Contract Gross Profit £109.8m £101.7m +7.9% +6.0%
Total Gross Profit £199.8m £205.3m -2.7% -4.4%
Operating Profit Before Exceptional Items £21.2m £25.1m -15.6% -18.3%
Conversion Ratio 10.6% 12.2% -1.6% -1.8%
Net Finance (Expense) / Income £(0.2m) £0.2mProfit Before Tax And Exceptional Items £21.0m £25.3m -17.0% -19.5%
Taxation £(10.0m) £(8.5m)
Profit After Tax Before Exceptional Items £11.1m £16.8m -34.0% -37.3%
Basic Earnings Per Share 9.1p 14.1p
Ordinary Dividend 14.0p 14.0p
Net Cash £8.7m £28.3m
Including IT Job Board
FULL YEAR RESULTSPRESENTATION 2013RESULTS FOR THE YEAR ENDED 1 DECEMBER 2013
www.sthree.com | SThree plc 39
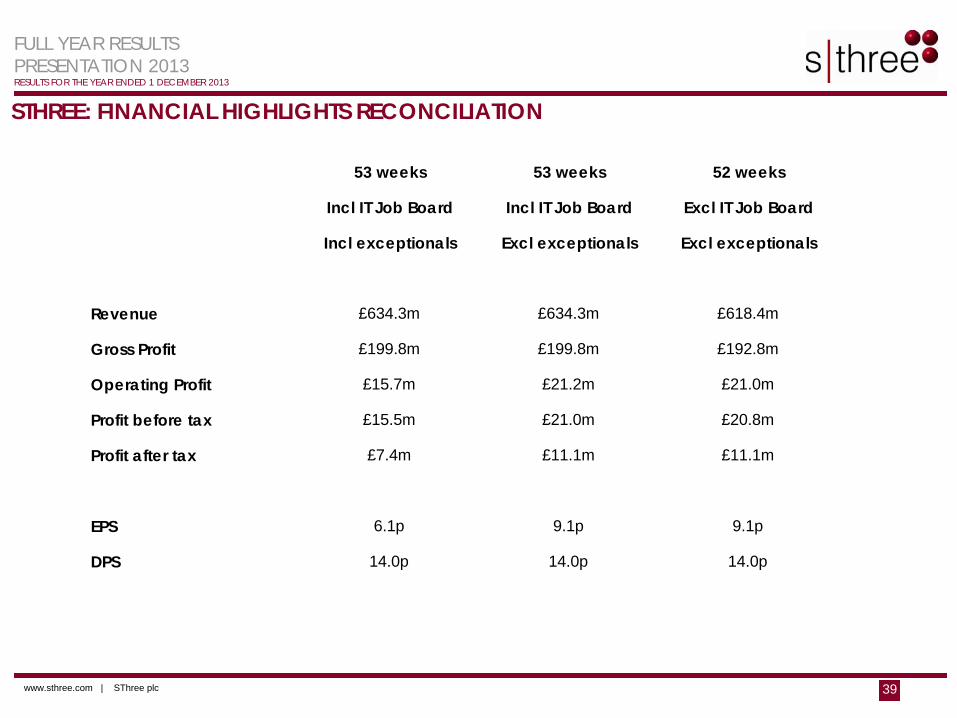
STHREE: FINANCIAL HIGHLIGHTS RECONCILIATION
53 weeks 53 weeks 52 weeks
Incl IT Job Board Incl IT Job Board Excl IT Job Board
Incl exceptionals Excl exceptionals Excl exceptionals
Revenue £634.3m £634.3m £618.4m
Gross Profit £199.8m £199.8m £192.8m
Operating Profit £15.7m £21.2m £21.0m
Profit before tax £15.5m £21.0m £20.8m
Profit after tax £7.4m £11.1m £11.1m
EPS 6.1p 9.1p 9.1p
DPS 14.0p 14.0p 14.0p

FULL YEAR RESULTSPRESENTATION 2013RESULTS FOR THE YEAR ENDED 1 DECEMBER 2013
www.sthree.com | SThree plc 40
YoY LFL
2013 2012 Growth
Perm GP (£'000) 17,794 23,204 (24%)
Cont GP (£'000) 42,124 43,604 (4%)
Total Gross Profit (£'000) 59,918 66,808 (11%)
Countries (#) 2 2 0
Offices (#) 16 23 -7
Perm Cont Total Perm Cont Total
Period End Consultant Headcount 189 293 482 (2%) 23% 12%
FY Average Consultant Headcount 187 266 453 (18%) 11% (3%)
# YoY Growth
237 268 271 243192 180 189
215240 267
234238 273 293
0
100
200
300
400
500
600
Nov 10 May '11 Nov '11 May '12 Nov '12 May '13 Nov '13
Perio
d En
d HC
0
50
100
150
200
250
300
Ave
rage
HC
Perm Cont Perm (ave HC) Cont (ave HC)
UK&I TRADING METRICS
31% of Group
GP
Note 1: Excludes IT Job BoardNote 2: Variances are on a constant currency basisNote 3: FY13 is based on a normalised 52 week periodNote 4: Office count includes corporate function offices
FULL YEAR RESULTSPRESENTATION 2013RESULTS FOR THE YEAR ENDED 1 DECEMBER 2013
www.sthree.com | SThree plc 41
UK&I TRADING METRICS
* Excluding retainersNote 1: Excludes IT Job BoardNote 2: Variances are on a constant currency basisNote 3: FY13 is based on a normalised 52 week periodNote 4: We reclassified Banking Technology from ICT to Banking, and as such have restated all prior year comparatives
Runners at Period End+4.1%
GPDR-5.8%
Perm Placement Fee*-1.7%
Sector Split FY 2012
Sector Split FY 2013
Perm Placements*-22.4%
Perm / Contract Split FY 2013
2012 is inside
2013 is outside
2,452
2,552
0 500 1,000 1,500 2,000 2,500 3,000
FY 2012
FY 2013
2,365
1,835
0 500 1,000 1,500 2,000 2,500
FY 2012
FY 2013
7369
0
10
20
30
40
50
60
70
80
FY 2012 FY 2013
9,703 9,590
0
2,000
4,000
6,000
8,000
10,000
12,000
FY 2012 FY 2013
53%
15%
8%
16%
7% 1%
ICT Banking Energy
Engineering Life Sciences Other
54%
15%
6%
17%
7% 1%
ICT Banking Energy
Engineering Life Sciences Other
65%70%
35%30%
PermCont
FULL YEAR RESULTSPRESENTATION 2013RESULTS FOR THE YEAR ENDED 1 DECEMBER 2013
www.sthree.com | SThree plc 42
YoY LFL
2013 2012 Growth
Perm GP (£'000) 11,757 14,457 (21%)
Cont GP (£'000) 22,265 20,953 3%
Total Gross Profit (£'000) 34,022 35,410 (7%)
Countries (#) 3 3 0
Offices (#) 7 9 -2
Perm Cont Total Perm Cont Total
Period End Consultant Headcount 121 139 260 3% 10% 7%
FY Average Consultant Headcount 113 136 249 (22%) 13% (6%)
# YoY Growth
140 153 174 151118 105 121
109
139
11498
126 144
116
0
50
100
150
200
250
300
350
Nov 10 May '11 Nov '11 May '12 Nov '12 May '13 Nov '13
Perio
d En
d HC
020406080100120140160180200
Ave
rage
HC
Perm Cont Perm (ave HC) Cont (ave HC)
BENELUX TRADING METRICS
18% of Group
GP
Note 1: Excludes IT Job BoardNote 2: Variances are on a constant currency basisNote 3: FY13 is based on a normalised 52 week period

FULL YEAR RESULTSPRESENTATION 2013RESULTS FOR THE YEAR ENDED 1 DECEMBER 2013
www.sthree.com | SThree plc 43
BENELUX TRADING METRICS
* Excluding retainersNote 1: Excludes IT Job BoardNote 2: Variances are on a constant currency basisNote 3: FY13 is based on a normalised 52 week periodNote 4: We reclassified Banking Technology from ICT to Banking, and as such have restated all prior year comparatives
Perm Placements*-20.1%
Perm / Contract Split FY 2013
2013 is outside
2012 is inside
Perm Placement Fee*-2.5%
Sector Split FY 2012
Sector Split FY 2013 Runners at Period End+11.7%
GPDR-5.9%
1,004
1,121
0 200 400 600 800 1,000 1,200
FY 2012
FY 2013
1,251
1,000
0 500 1,000 1,500
FY 2012
FY 2013
89 86
0102030405060708090
100
FY 2012 FY 2013
11,071 11,193
0
2,000
4,000
6,000
8,000
10,000
12,000
FY 2012 FY 2013
51%
10%
10%
11%
7%
11%
ICT Banking Energy
Engineering Life Sciences Other
52%
13%
7%
8%
6%
14%
ICT Banking Energy
Engineering Life Sciences Other
59%65%
41%35%
PermCont
FULL YEAR RESULTSPRESENTATION 2013RESULTS FOR THE YEAR ENDED 1 DECEMBER 2013
www.sthree.com | SThree plc 44
YoY LFL
2013 2012 Growth
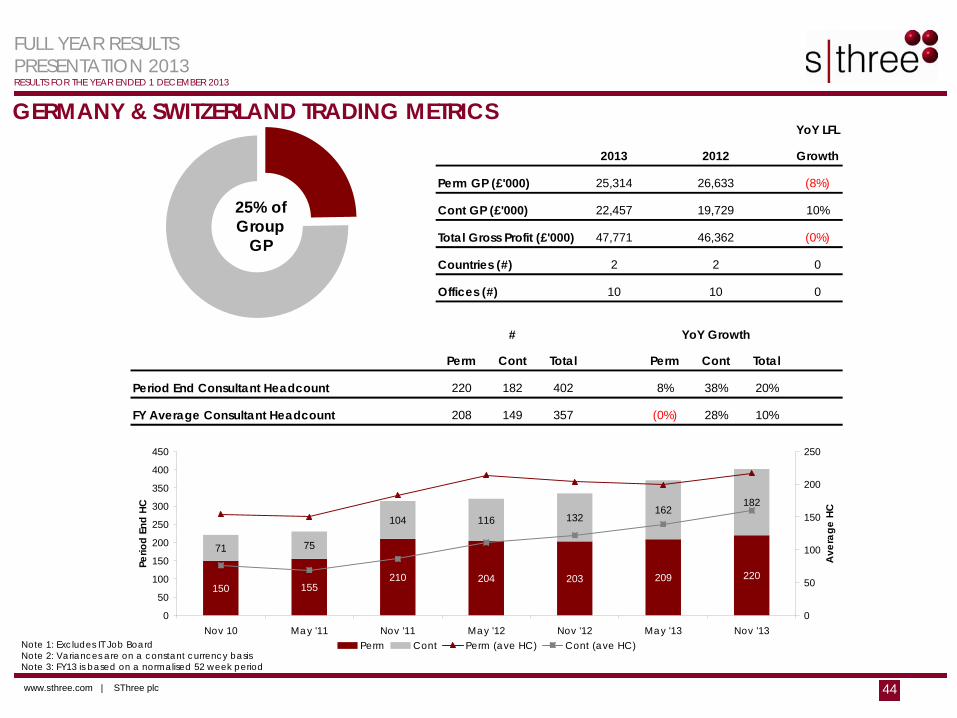
Perm GP (£'000) 25,314 26,633 (8%)
Cont GP (£'000) 22,457 19,729 10%
Total Gross Profit (£'000) 47,771 46,362 (0%)
Countries (#) 2 2 0
Offices (#) 10 10 0
Perm Cont Total Perm Cont Total
Period End Consultant Headcount 220 182 402 8% 38% 20%
FY Average Consultant Headcount 208 149 357 (0%) 28% 10%
# YoY Growth
150 155210 204 203 209 220
71 75
116
182132
162104
0
50
100
150
200
250
300
350
400
450
Nov 10 May '11 Nov '11 May '12 Nov '12 May '13 Nov '13
Perio
d En
d HC
0
50
100
150
200
250
Ave
rage
HC
Perm Cont Perm (ave HC) Cont (ave HC)
GERMANY & SWITZERLAND TRADING METRICS
25% of Group
GP
Note 1: Excludes IT Job BoardNote 2: Variances are on a constant currency basisNote 3: FY13 is based on a normalised 52 week period
FULL YEAR RESULTSPRESENTATION 2013RESULTS FOR THE YEAR ENDED 1 DECEMBER 2013
www.sthree.com | SThree plc 45
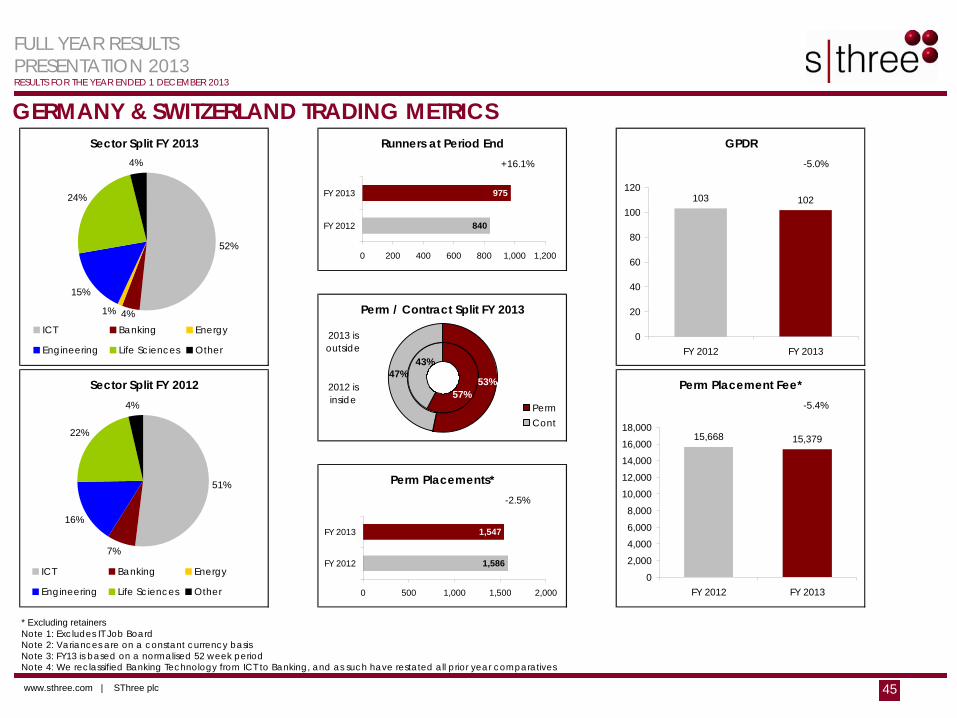
GERMANY & SWITZERLAND TRADING METRICS
* Excluding retainersNote 1: Excludes IT Job BoardNote 2: Variances are on a constant currency basisNote 3: FY13 is based on a normalised 52 week periodNote 4: We reclassified Banking Technology from ICT to Banking, and as such have restated all prior year comparatives
Sector Split FY 2012
Sector Split FY 2013 Runners at Period End+16.1%
GPDR-5.0%
2013 is outside
2012 is inside
Perm Placements*-2.5%
Perm / Contract Split FY 2013
Perm Placement Fee*-5.4%
840
975
0 200 400 600 800 1,000 1,200
FY 2012
FY 2013
1,586
1,547
0 500 1,000 1,500 2,000
FY 2012
FY 2013
103 102
0
20
40
60
80
100
120
FY 2012 FY 2013
15,668 15,379
02,0004,0006,0008,000
10,00012,00014,00016,00018,000
FY 2012 FY 2013
52%
15%
24%
4%
1% 4%ICT Banking Energy
Engineering Life Sciences Other
51%
16%
22%
4%
7%
ICT Banking Energy
Engineering Life Sciences Other
47%43%
57%53%
PermCont
FULL YEAR RESULTSPRESENTATION 2013RESULTS FOR THE YEAR ENDED 1 DECEMBER 2013
www.sthree.com | SThree plc 46
YoY LFL
2013 2012 Growth
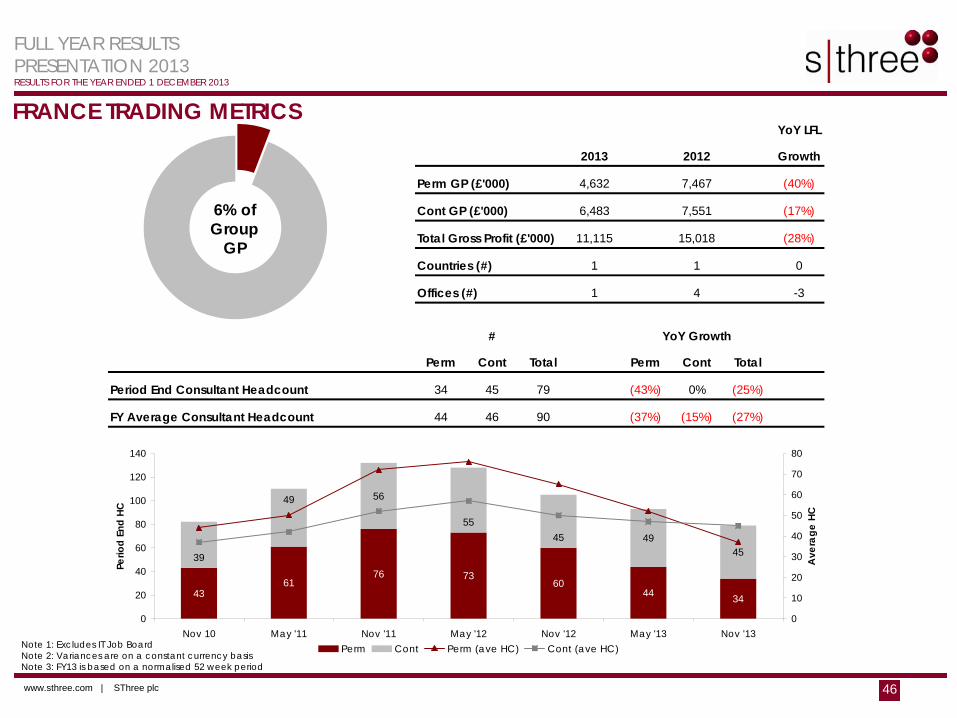
Perm GP (£'000) 4,632 7,467 (40%)
Cont GP (£'000) 6,483 7,551 (17%)
Total Gross Profit (£'000) 11,115 15,018 (28%)
Countries (#) 1 1 0
Offices (#) 1 4 -3
Perm Cont Total Perm Cont Total
Period End Consultant Headcount 34 45 79 (43%) 0% (25%)
FY Average Consultant Headcount 44 46 90 (37%) (15%) (27%)
# YoY Growth
4361
76 7360
44 34
45
56
4945
39
55
49
0
20
40
60
80
100
120
140
Nov 10 May '11 Nov '11 May '12 Nov '12 May '13 Nov '13
Perio
d En
d HC
0
10
20
30
40
50
60
70
80
Ave
rage
HC
Perm Cont Perm (ave HC) Cont (ave HC)
FRANCE TRADING METRICS
6% of Group
GP
Note 1: Excludes IT Job BoardNote 2: Variances are on a constant currency basisNote 3: FY13 is based on a normalised 52 week period
FULL YEAR RESULTSPRESENTATION 2013RESULTS FOR THE YEAR ENDED 1 DECEMBER 2013
www.sthree.com | SThree plc 47
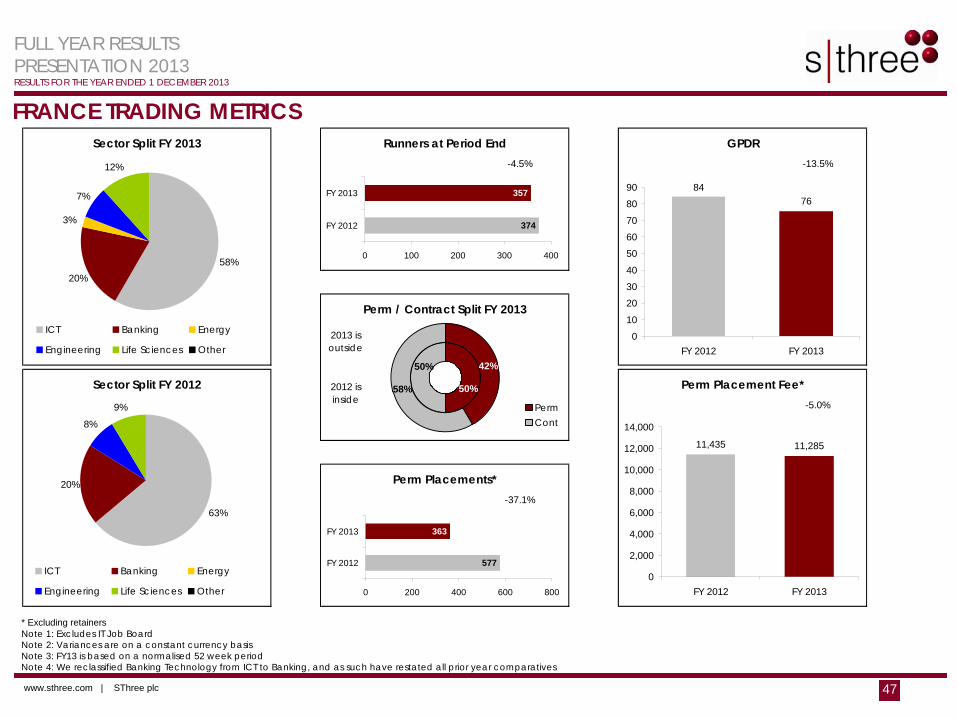
FRANCE TRADING METRICS
* Excluding retainersNote 1: Excludes IT Job BoardNote 2: Variances are on a constant currency basisNote 3: FY13 is based on a normalised 52 week periodNote 4: We reclassified Banking Technology from ICT to Banking, and as such have restated all prior year comparatives
Perm Placements*-37.1%
Perm / Contract Split FY 2013
Perm Placement Fee*-5.0%
Sector Split FY 2012
Sector Split FY 2013 Runners at Period End-4.5%
GPDR-13.5%
2013 is outside
2012 is inside
374
357
0 100 200 300 400
FY 2012
FY 2013
577
363
0 200 400 600 800
FY 2012
FY 2013
8476
0102030405060708090
FY 2012 FY 2013
11,435 11,285
0
2,000
4,000
6,000
8,000
10,000
12,000
14,000
FY 2012 FY 2013
58%
7%
12%
3%
20%
ICT Banking Energy
Engineering Life Sciences Other
63%
8%
9%
20%
ICT Banking Energy
Engineering Life Sciences Other
58%
50%
50%
42%
PermCont

FULL YEAR RESULTSPRESENTATION 2013RESULTS FOR THE YEAR ENDED 1 DECEMBER 2013
www.sthree.com | SThree plc 48
YoY LFL
2013 2012 Growth
Perm GP (£'000) 10,896 9,490 14%
Cont GP (£'000) 9,651 5,912 61%
Total Gross Profit (£'000) 20,547 15,402 32%
Countries (#) 3 2 1
Offices (#) 9 8 1
Perm Cont Total Perm Cont Total
Period End Consultant Headcount 98 78 176 29% 86% 49%
FY Average Consultant Headcount 82 59 141 22% 55% 34%
# YoY Growth
57 70 76 739816
3449
9
42
3823
57
78
020406080
100120140160180200
Nov 10 May '11 Nov '11 May '12 Nov '12 May '13 Nov '13
Perio
d En
d HC
0102030405060708090100
Ave
rage
HC
Perm Cont Perm (ave HC) Cont (ave HC)
AMERICAS TRADING METRICS
11% of Group
GP
Note 1: Excludes IT Job BoardNote 2: Variances are on a constant currency basisNote 3: FY13 is based on a normalised 52 week period

FULL YEAR RESULTSPRESENTATION 2013RESULTS FOR THE YEAR ENDED 1 DECEMBER 2013
www.sthree.com | SThree plc 49
AMERICAS TRADING METRICS
* Excluding retainersNote 1: Excludes IT Job BoardNote 2: Variances are on a constant currency basisNote 3: FY13 is based on a normalised 52 week periodNote 4: We reclassified Banking Technology from ICT to Banking, and as such have restated all prior year comparatives
Runners at Period End+91.5%
GPDR-13.5%
Perm Placement Fee*-2.4%
Sector Split FY 2012
Sector Split FY 2013
Perm Placements*+17.8%
Perm / Contract Split FY 2013
2013 is outside
2012 is inside
284
544
0 100 200 300 400 500 600
FY 2012
FY 2013
489
576
0 200 400 600 800
FY 2012
FY 2013
114100
0
20
40
60
80
100
120
140
FY 2012 FY 2013
18,421 18,114
02,0004,0006,0008,000
10,00012,00014,00016,00018,00020,000
FY 2012 FY 2013
1%
37%
26%
0%
36%
ICT Banking Energy
Engineering Life Sciences Other
1%
39%
26%
1%
33%
ICT Banking Energy
Engineering Life Sciences Other
47%38%
62%53%
PermCont
FULL YEAR RESULTSPRESENTATION 2013RESULTS FOR THE YEAR ENDED 1 DECEMBER 2013
www.sthree.com | SThree plc 50
YoY LFL
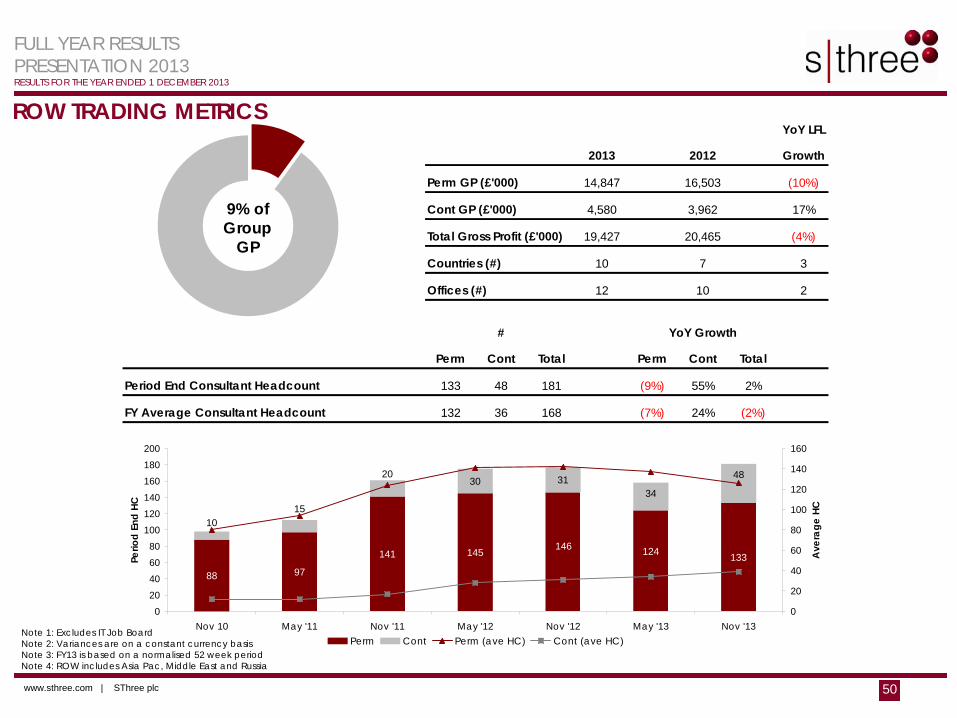
2013 2012 Growth
Perm GP (£'000) 14,847 16,503 (10%)
Cont GP (£'000) 4,580 3,962 17%
Total Gross Profit (£'000) 19,427 20,465 (4%)
Countries (#) 10 7 3
Offices (#) 12 10 2
Perm Cont Total Perm Cont Total
Period End Consultant Headcount 133 48 181 (9%) 55% 2%
FY Average Consultant Headcount 132 36 168 (7%) 24% (2%)
# YoY Growth
88 97
141 145 133
30 31
146 124
4820
3415
10
020406080
100120140160180200
Nov 10 May '11 Nov '11 May '12 Nov '12 May '13 Nov '13
Perio
d En
d HC
0
20
40
60
80
100
120
140
160
Ave
rage
HC
Perm Cont Perm (ave HC) Cont (ave HC)
ROW TRADING METRICS
9% of Group
GP
Note 1: Excludes IT Job BoardNote 2: Variances are on a constant currency basisNote 3: FY13 is based on a normalised 52 week periodNote 4: ROW includes Asia Pac, Middle East and Russia
FULL YEAR RESULTSPRESENTATION 2013RESULTS FOR THE YEAR ENDED 1 DECEMBER 2013
www.sthree.com | SThree plc 51
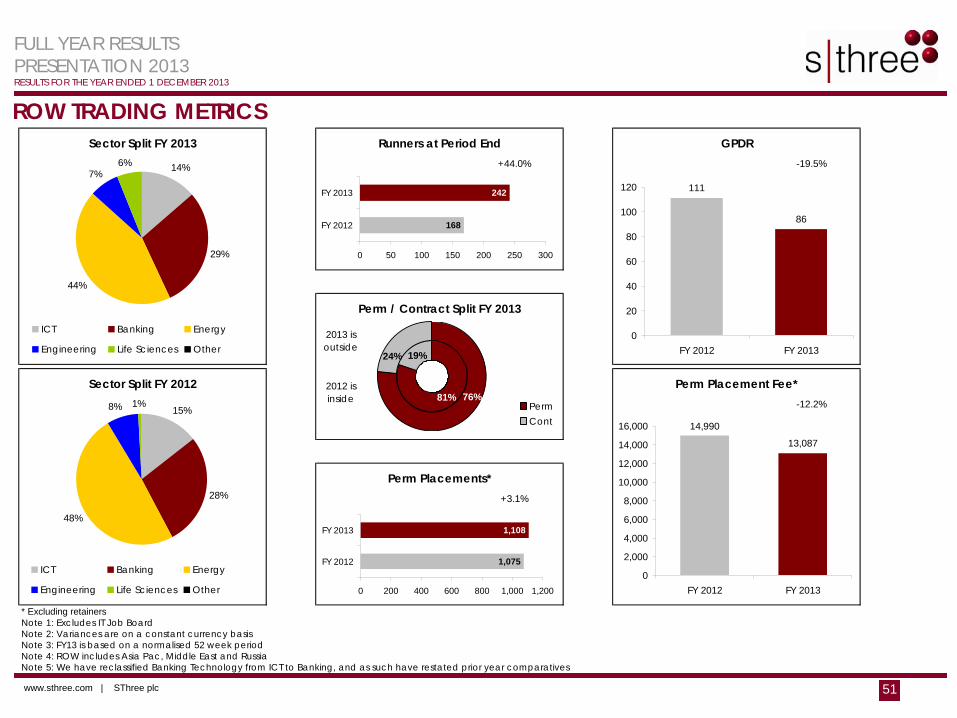
ROW TRADING METRICS
* Excluding retainersNote 1: Excludes IT Job BoardNote 2: Variances are on a constant currency basisNote 3: FY13 is based on a normalised 52 week periodNote 4: ROW includes Asia Pac, Middle East and RussiaNote 5: We have reclassified Banking Technology from ICT to Banking, and as such have restated prior year comparatives
Sector Split FY 2012
Sector Split FY 2013 Runners at Period End+44.0%
2012 is inside
Perm Placements*+3.1%
Perm / Contract Split FY 2013
Perm Placement Fee*-12.2%
GPDR-19.5%
2013 is outside
168
242
0 50 100 150 200 250 300
FY 2012
FY 2013
1,075
1,108
0 200 400 600 800 1,000 1,200
FY 2012
FY 2013
111
86
0
20
40
60
80
100
120
FY 2012 FY 2013
14,990
13,087
0
2,000
4,000
6,000
8,000
10,000
12,000
14,000
16,000
FY 2012 FY 2013
14%
29%
44%
7%6%
ICT Banking Energy
Engineering Life Sciences Other
15%
28%
48%
8% 1%
ICT Banking Energy
Engineering Life Sciences Other
19%
81%
24%
76%PermCont
FULL YEAR RESULTSPRESENTATION 2013RESULTS FOR THE YEAR ENDED 1 DECEMBER 2013
www.sthree.com | SThree plc 52
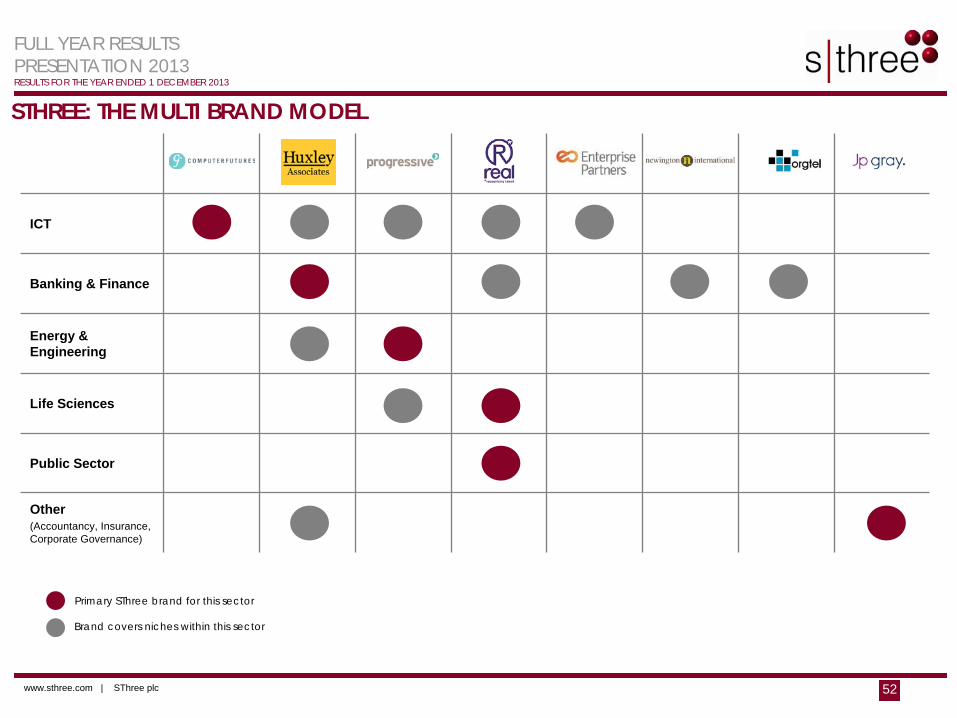
STHREE: THE MULTI BRAND MODEL
ICT
Banking & Finance
Energy & Engineering
Life Sciences
Public Sector
Other(Accountancy, Insurance, Corporate Governance)
Primary SThree brand for this sector
Brand covers niches within this sector
FULL YEAR RESULTSPRESENTATION 2013RESULTS FOR THE YEAR ENDED 1 DECEMBER 2013
www.sthree.com | SThree plc 53
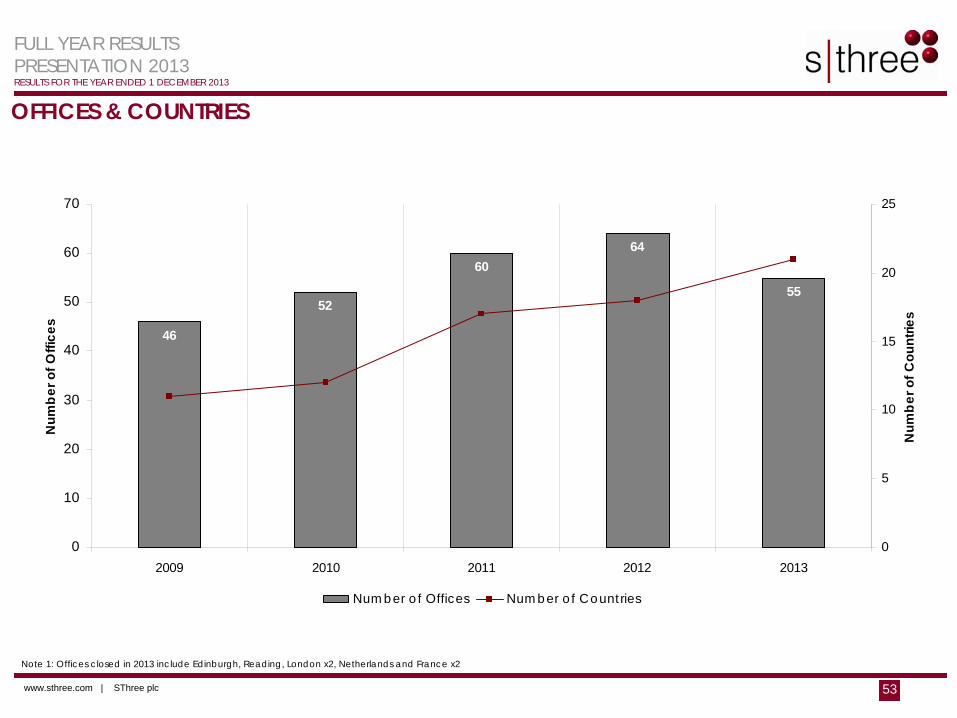
OFFICES & COUNTRIES
55
6460
52
46
0
10
20
30
40
50
60
70
2009 2010 2011 2012 2013
Year
Num
ber o
f Offi
ces
0
5
10
15
20
25
Num
ber o
f Cou
ntrie
s
Number of Offices Number of Countries
Note 1: Offices closed in 2013 include Edinburgh, Reading, London x2, Netherlands and France x2
FULL YEAR RESULTSPRESENTATION 2013RESULTS FOR THE YEAR ENDED 1 DECEMBER 2013
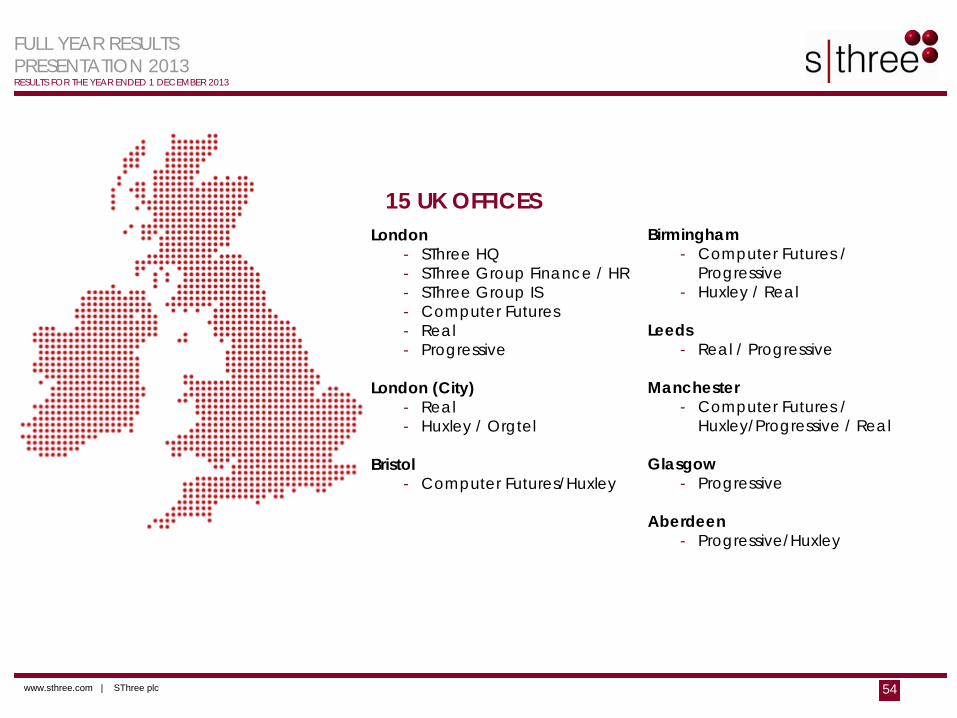
www.sthree.com | SThree plc 54
15 UK OFFICESLondon
- SThree HQ- SThree Group Finance / HR- SThree Group IS- Computer Futures- Real- Progressive
London (City)- Real- Huxley / Orgtel
Bristol- Computer Futures/Huxley
Birmingham- Computer Futures /
Progressive- Huxley / Real
Leeds- Real / Progressive
Manchester- Computer Futures /
Huxley/Progressive / Real
Glasgow- Progressive
Aberdeen- Progressive/Huxley
FULL YEAR RESULTSPRESENTATION 2013RESULTS FOR THE YEAR ENDED 1 DECEMBER 2013
www.sthree.com | SThree plc 55
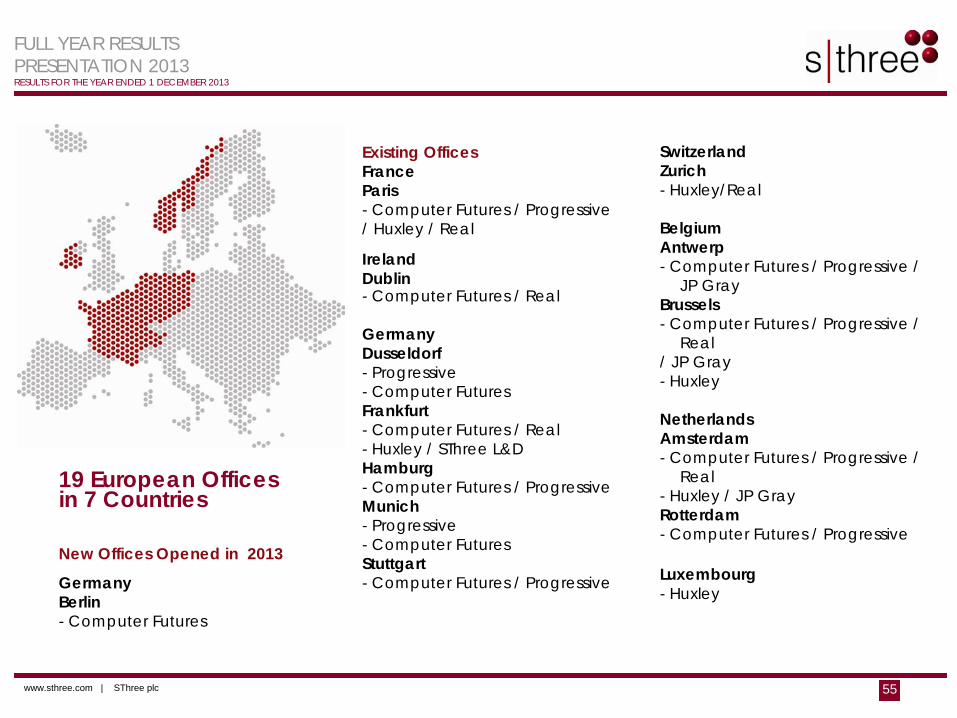
19 European Officesin 7 Countries
New Offices Opened in 2013
GermanyBerlin- Computer Futures
Existing OfficesFrance Paris- Computer Futures / Progressive/ Huxley / Real
IrelandDublin- Computer Futures / Real
Germany Dusseldorf- Progressive- Computer FuturesFrankfurt- Computer Futures / Real- Huxley / SThree L&D Hamburg- Computer Futures / ProgressiveMunich- Progressive- Computer FuturesStuttgart- Computer Futures / Progressive
SwitzerlandZurich- Huxley/Real
BelgiumAntwerp- Computer Futures / Progressive /
JP GrayBrussels- Computer Futures / Progressive /
Real / JP Gray- Huxley
NetherlandsAmsterdam- Computer Futures / Progressive /
Real- Huxley / JP GrayRotterdam- Computer Futures / Progressive
Luxembourg- Huxley
FULL YEAR RESULTSPRESENTATION 2013RESULTS FOR THE YEAR ENDED 1 DECEMBER 2013
www.sthree.com | SThree plc 56
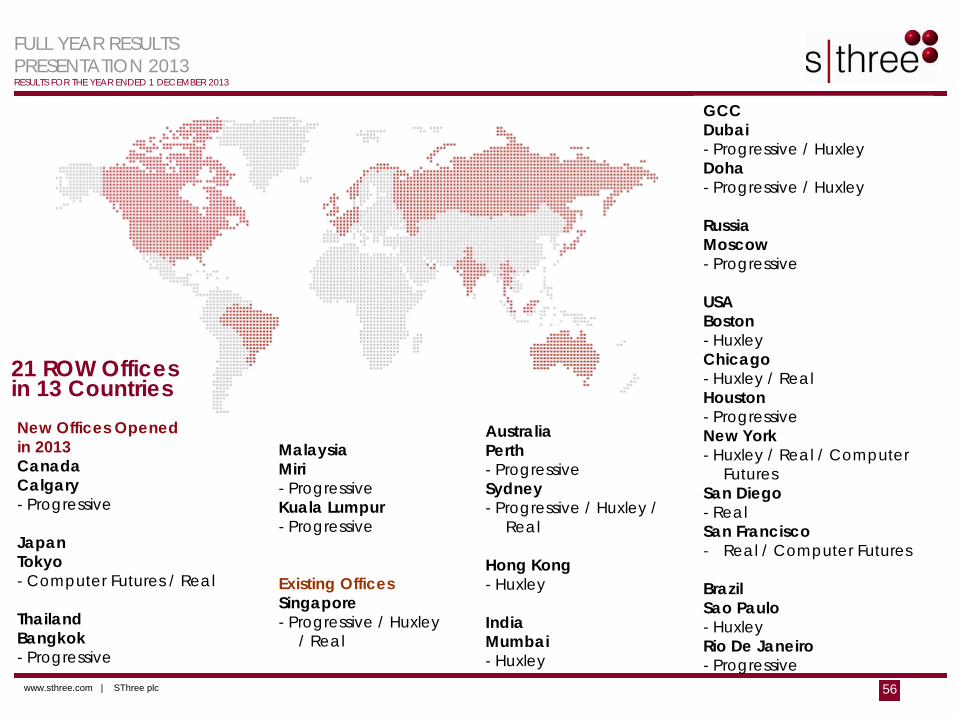
MalaysiaMiri- ProgressiveKuala Lumpur- Progressive
Existing OfficesSingapore- Progressive / Huxley
/ Real
21 ROW Officesin 13 CountriesNew Offices Opened in 2013CanadaCalgary- Progressive
JapanTokyo- Computer Futures / Real
ThailandBangkok- Progressive
AustraliaPerth- ProgressiveSydney- Progressive / Huxley /
Real
Hong Kong- Huxley
IndiaMumbai- Huxley
GCCDubai- Progressive / HuxleyDoha- Progressive / Huxley
Russia Moscow- Progressive
USABoston - HuxleyChicago- Huxley / RealHouston - ProgressiveNew York- Huxley / Real / Computer
FuturesSan Diego- RealSan Francisco- Real / Computer Futures
BrazilSao Paulo- HuxleyRio De Janeiro- Progressive
FULL YEAR RESULTSPRESENTATION 2013RESULTS FOR THE YEAR ENDED 1 DECEMBER 2013
www.sthree.com | SThree plc 57
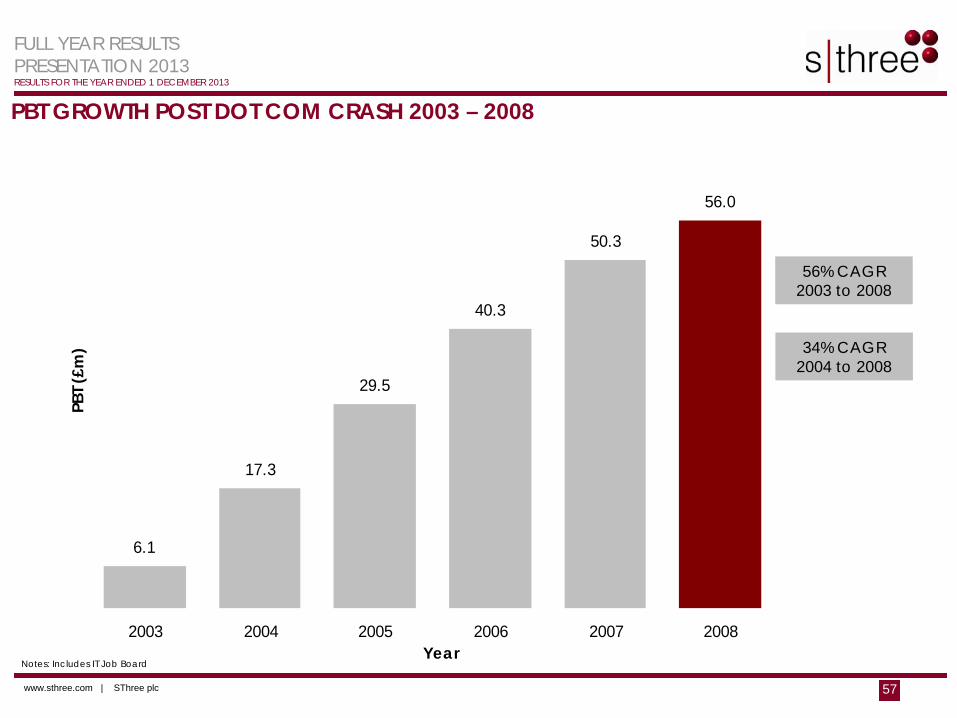
6.1
17.3
29.5
40.3
50.3
56.0
0
10
20
30
40
50
60
2003 2004 2005 2006 2007 2008
PBT GROWTH POST DOT COM CRASH 2003 – 2008
56% CAGR 2003 to 2008
Year
PBT (
£m) 34% CAGR
2004 to 2008
Notes: Includes IT Job Board
FULL YEAR RESULTSPRESENTATION 2013RESULTS FOR THE YEAR ENDED 1 DECEMBER 2013
www.sthree.com | SThree plc 58
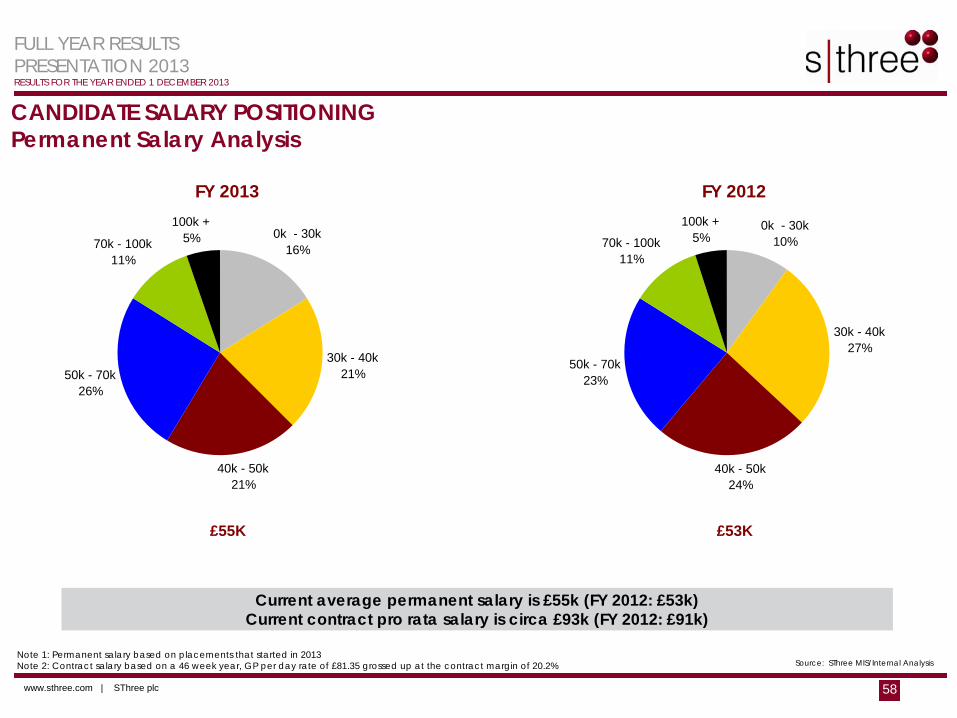
CANDIDATE SALARY POSITIONINGPermanent Salary Analysis
Current average permanent salary is £55k (FY 2012: £53k) Current contract pro rata salary is circa £93k (FY 2012: £91k)
Note 1: Permanent salary based on placements that started in 2013Note 2: Contract salary based on a 46 week year, GP per day rate of £81.35 grossed up at the contract margin of 20.2% Source: SThree MIS/Internal Analysis
£55K £53K
FY 2013 FY 2012
30k - 40k21%
40k - 50k21%
50k - 70k26%
70k - 100k11%
100k +5% 0k - 30k
16%
30k - 40k27%
40k - 50k24%
50k - 70k23%
70k - 100k11%
100k +5%
0k - 30k10%
FULL YEAR RESULTSPRESENTATION 2013RESULTS FOR THE YEAR ENDED 1 DECEMBER 2013
www.sthree.com | SThree plc 59
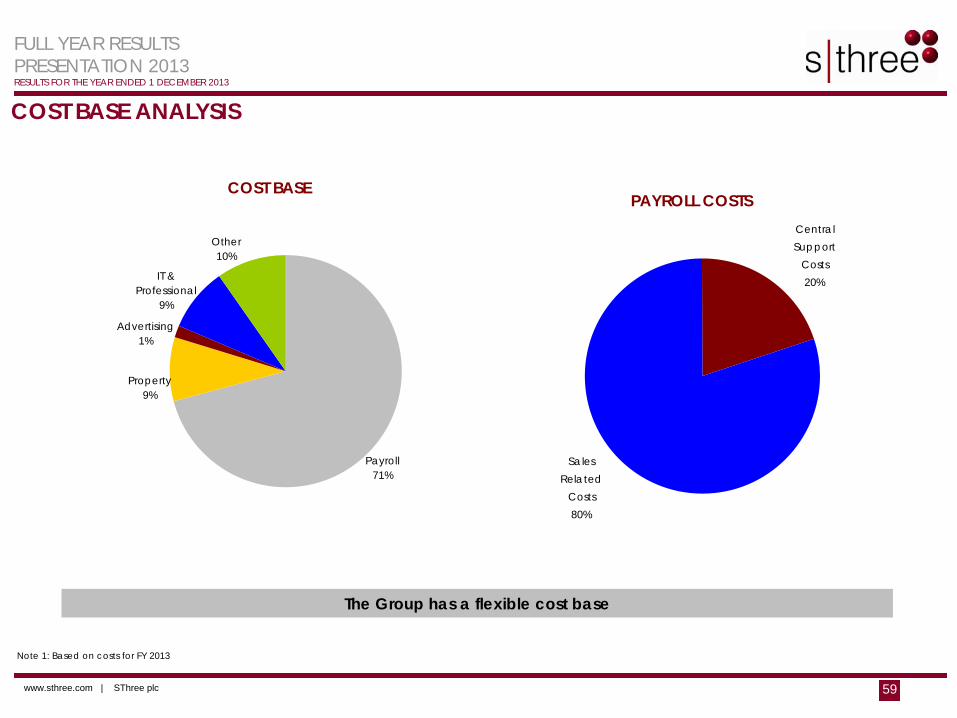
COST BASE ANALYSIS
The Group has a flexible cost base
Note 1: Based on costs for FY 2013
COST BASE
Other10%
Advertising1%
IT & Professional
9%
Payroll71%
Property9%
Sales Related
Costs80%
Central Support
Costs20%
PAYROLL COSTS
FULL YEAR RESULTSPRESENTATION 2013RESULTS FOR THE YEAR ENDED 1 DECEMBER 2013
www.sthree.com | SThree plc 60
Background• Circa 100 participants, across all geographies and sectors
• An opportunity to buy into a new business at an early stage, to become a part owner
• A key retention and attraction tool, a point of difference, given low barriers to entry
Features• A senior individual may be invited to invest in the scheme at fair value
• After a set number of years of MI holding and employment (typically 5 years), the individual can offer the vested stake for sale to SThree, against SThree shares
• The sale price is set with reference to a formula, typically between 1/2 and 2/3 x tracked business PAT x SThree plc historic PE ratio
• SThree is not obliged to purchase a minority stake offered. All stakes offered back will be considered by the MI Steering Committee, comprising of the CEO & CFO and approved by the main Board
• Buy backs for 2013 were c£7m
• Expected future buy backs to be £5m - £15m pa in shares, with marginal dilution if new shares are issued
• Buy backs in any year are dependent upon whether or not a stake is offered up for sale and accepted by SThree, the PAT of tracked businesses, the Group PE Ratio and the Board’s desire to buy out the shares offered
TRACKER SHARES (MINORITY INTEREST) ARRANGEMENTS
FULL YEAR RESULTSPRESENTATION 2013RESULTS FOR THE YEAR ENDED 1 DECEMBER 2013
www.sthree.com | SThree plc 61
Accounting• Accounting governed by IFRS 2 “Share-Based Payments”, with no income statement charge as the
payment made by participants equals the fair value of the award at that time
• A provision of £3.7m (2012: £4.4m), relating to the obligation to repay subscriptions if an employee leaves the Group before vesting, is held on the Balance Sheet
• Diluted EPS shows the dilutive impact of tracker share arrangements if all profitable tracked businesses had vested and are based on the previous year’s profits and by applying the last month’s (November 2013) average Group PE Ratio
TRACKER SHARES (MINORITY INTEREST) ARRANGEMENTS (continued)
FULL YEAR RESULTSPRESENTATION 2013RESULTS FOR THE YEAR ENDED 1 DECEMBER 2013
www.sthree.com | SThree plc 62
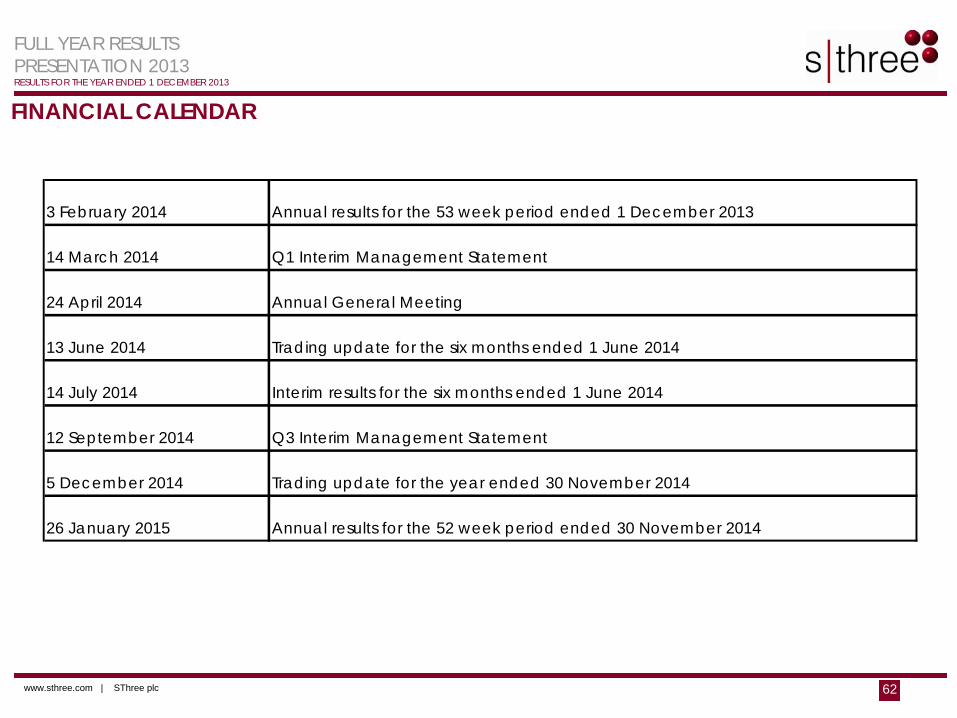
FINANCIAL CALENDAR
3 February 2014 Annual results for the 53 week period ended 1 December 2013
14 March 2014 Q1 Interim Management Statement
24 April 2014 Annual General Meeting
13 June 2014 Trading update for the six months ended 1 June 2014
14 July 2014 Interim results for the six months ended 1 June 2014
12 September 2014 Q3 Interim Management Statement
5 December 2014 Trading update for the year ended 30 November 2014
26 January 2015 Annual results for the 52 week period ended 30 November 2014
FULL YEAR RESULTSPRESENTATION 2013RESULTS FOR THE YEAR ENDED 1 DECEMBER 2013
www.sthree.com | SThree plc 63
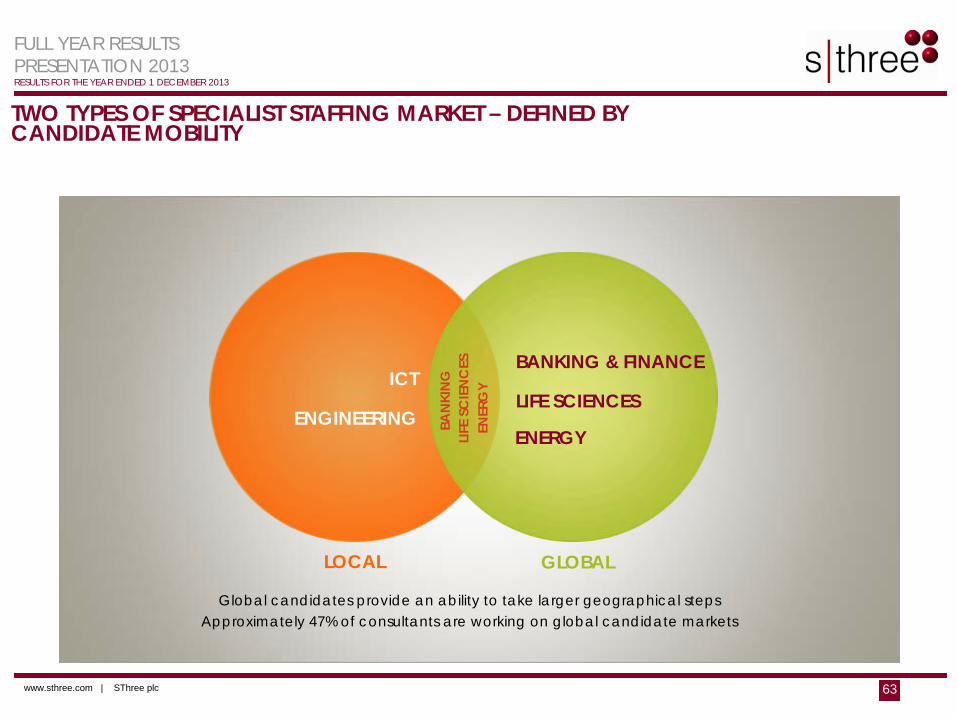
TWO TYPES OF SPECIALIST STAFFING MARKET – DEFINED BY CANDIDATE MOBILITY
LIFE SCIENCES
BANKING & FINANCE
ENERGYENGINEERING
ICT
LIFE
SC
IEN
CES
BAN
KIN
G
ENER
GY
GLOBALLOCAL
Global candidates provide an ability to take larger geographical steps Approximately 47% of consultants are working on global candidate markets
FULL YEAR RESULTSPRESENTATION 2013RESULTS FOR THE YEAR ENDED 1 DECEMBER 2013
www.sthree.com | SThree plc 64
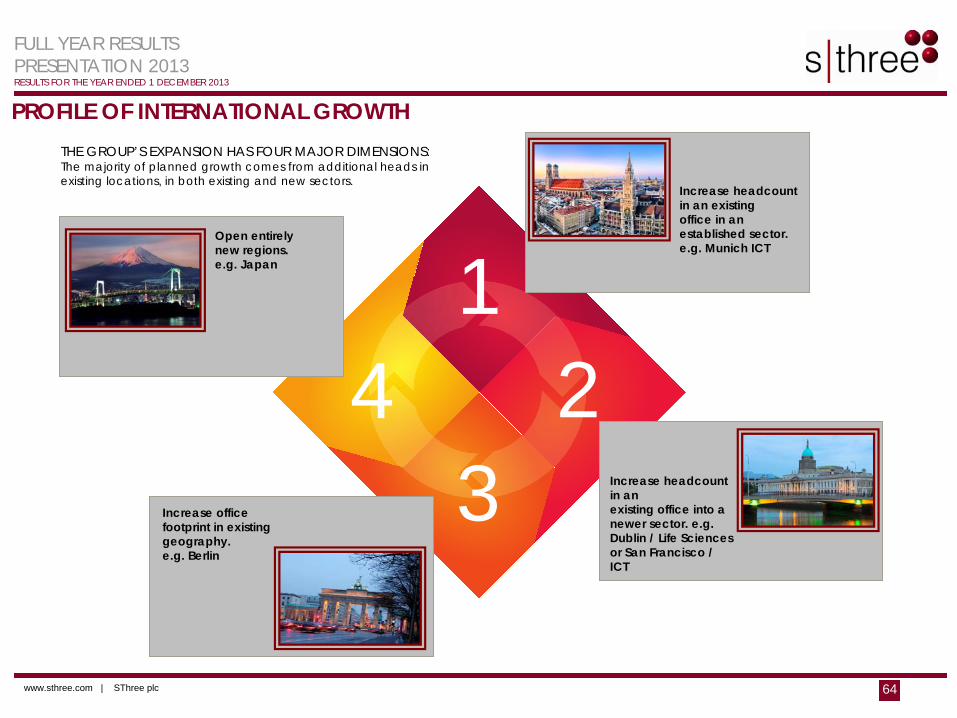
THE GROUP’S EXPANSION HAS FOUR MAJOR DIMENSIONS: The majority of planned growth comes from additional heads in existing locations, in both existing and new sectors.
12
34
Increase headcount in an existing office in an established sector.e.g. Munich ICT
PROFILE OF INTERNATIONAL GROWTH
Increase headcount in anexisting office into a newer sector. e.g. Dublin / Life Sciences or San Francisco / ICT
Open entirely new regions.e.g. Japan
Increase office footprint in existing geography. e.g. Berlin
FULL YEAR RESULTSPRESENTATION 2013RESULTS FOR THE YEAR ENDED 1 DECEMBER 2013
www.sthree.com | SThree plc 65
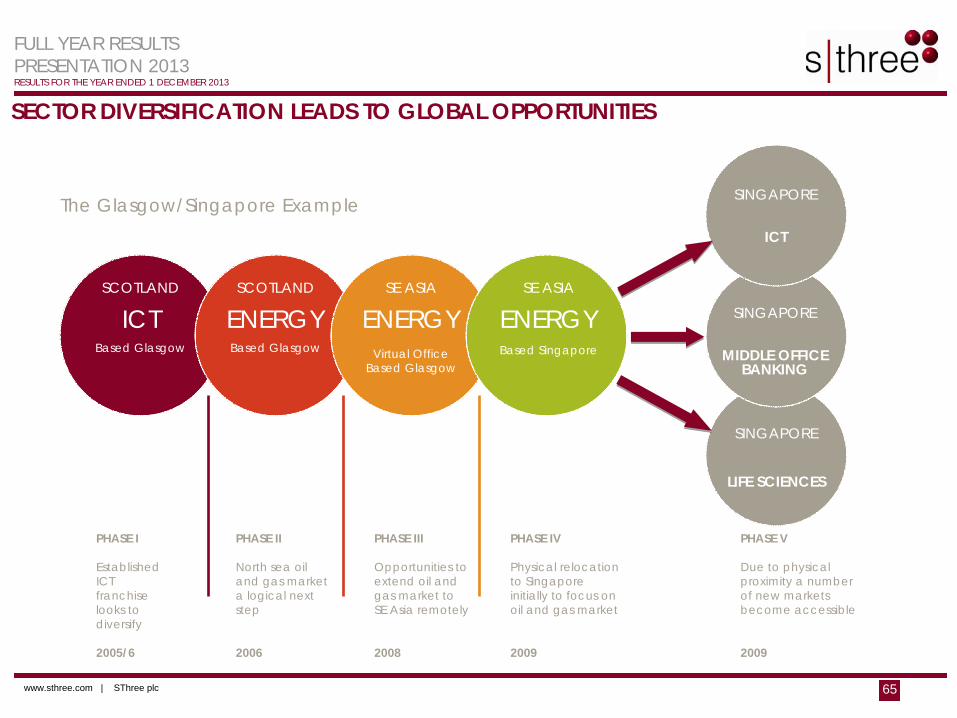
SECTOR DIVERSIFICATION LEADS TO GLOBAL OPPORTUNITIES
PHASE I
Established ICTfranchise looks todiversify
2005/6
SCOTLAND
ICTBased Glasgow
SCOTLAND
ENERGYBased Glasgow
SE ASIA
ENERGYVirtual Office
Based Glasgow
SE ASIA
ENERGYBased Singapore
SINGAPORE
ICT
SINGAPORE
MIDDLE OFFICEBANKING
SINGAPORE
LIFE SCIENCES
The Glasgow/Singapore Example
PHASE II
North sea oil and gas market a logical next step
2006
PHASE III
Opportunities toextend oil and gas market to SE Asia remotely
2008
PHASE IV
Physical relocationto Singaporeinitially to focus onoil and gas market
2009
PHASE V
Due to physicalproximity a numberof new marketsbecome accessible
2009
FULL YEAR RESULTSPRESENTATION 2013RESULTS FOR THE YEAR ENDED 1 DECEMBER 2013
www.sthree.com | SThree plc 66
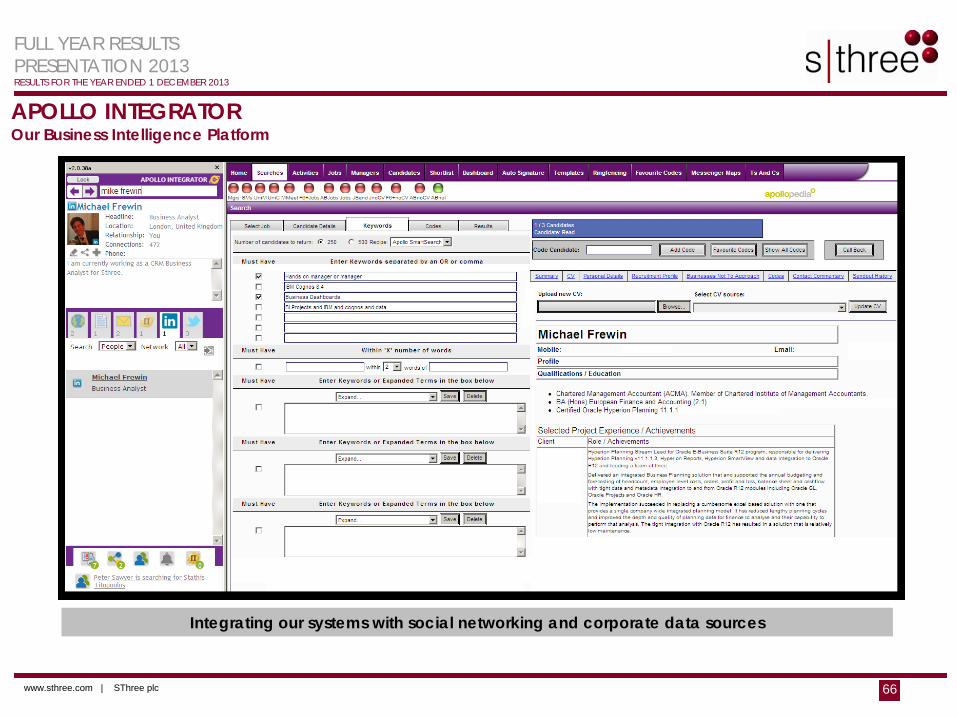
APOLLO INTEGRATOR
Integrating our systems with social networking and corporate data sources
Our Business Intelligence Platform
FULL YEAR RESULTSPRESENTATION 2013RESULTS FOR THE YEAR ENDED 1 DECEMBER 2013
www.sthree.com | SThree plc 67
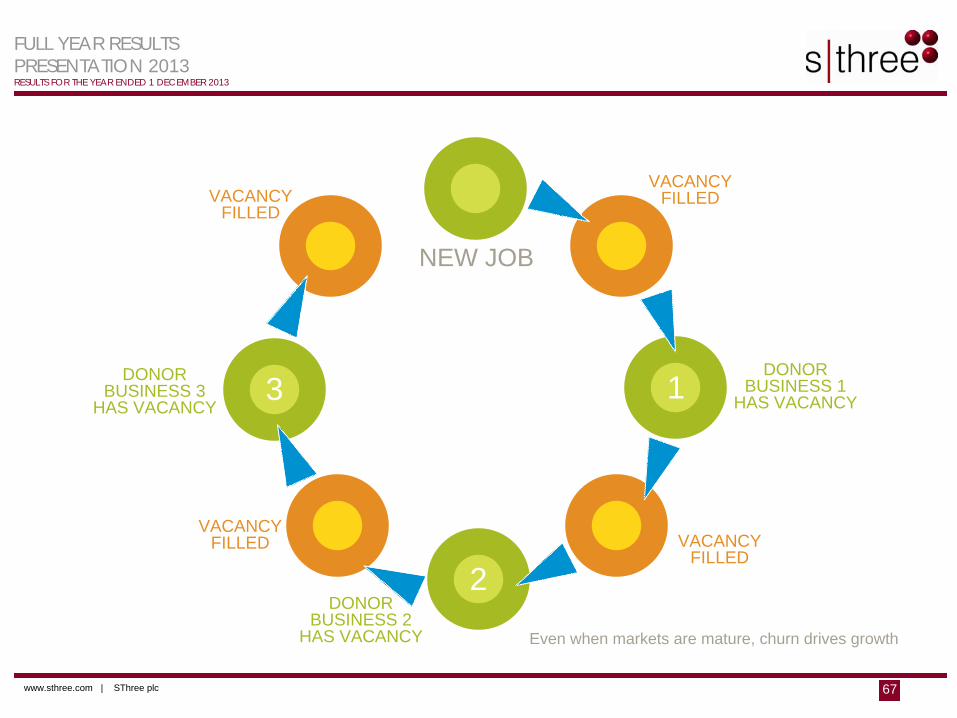
NEW JOB
Even when markets are mature, churn drives growth
VACANCY FILLED
DONOR BUSINESS 1
HAS VACANCY
VACANCY FILLED
DONOR BUSINESS 2
HAS VACANCY
VACANCY FILLED
VACANCY FILLED
DONOR BUSINESS 3
HAS VACANCY1
2
3