FULL YEAR 2014 RESULTS HEINEKEN N.V.€¦ · 3 2014 Key Highlights 1 Sol premium (volume outside...
26
1 Jean-François van Boxmeer FULL YEAR 2014 RESULTS HEINEKEN N.V. CHAIRMAN OF THE EXECUTIVE BOARD/CEO AMSTERDAM, 11 FEBRUARY 2015 Strong profit growth, delivering on strategic priorities
Transcript of FULL YEAR 2014 RESULTS HEINEKEN N.V.€¦ · 3 2014 Key Highlights 1 Sol premium (volume outside...
1
Jean-François van Boxmeer
FULL YEAR 2014 RESULTS HEINEKEN N.V.
CHAIRMAN OF THE EXECUTIVE BOARD/CEO
AMSTERDAM, 11 FEBRUARY 2015
Strong profit growth, delivering on strategic priorities

2
Disclaimer
This presentation contains forward-looking statements with regard to the financial position and results of HEINEKEN’s activities. These forward-looking statements are subject to risks and uncertainties that could cause actual results to differ materially from those expressed in the forward-looking statements.
Many of these risks and uncertainties relate to factors that are beyond HEINEKEN’s ability to control or estimate precisely, such as future market and economic conditions, the behaviour of other market participants, changes in consumer preferences, the ability to successfully integrate acquired businesses and achieve anticipated synergies, costs of raw materials, interest rate and foreign exchange fluctuations, change in tax rates, changes in law, changes in pension costs, the actions of government regulators and weather conditions. These and other risk factors are detailed in HEINEKEN’s publicly filed annual reports.
You are cautioned not to place undue reliance on these forward-looking statements, which speak only as of the date of this presentation. HEINEKEN does not undertake any obligation to publicly release any revisions to these forward-looking statements to reflect events or circumstances after the date of these materials.
Market share estimates contained in this presentation are based on outside sources such as specialised research institutes in combination with management estimates.

3
2014 Key Highlights
1 Sol premium (volume outside home market)
Strong performance reflects effectiveness of our strategy
Group revenue +3.3% organically with group rev/hl up +1.4%
Top and bottom line growth across the business
Heineken® volume +5.1% reporting positive growth in all regions
Double digit growth for global brands Desperados, Affligem and Sol1
Innovation contributed €1.5bn of revenue and rate accelerated to 7.7%
Consolidated operating profit (beia) margin up 90bps, well ahead of
medium term margin guidance (40bps)
Diluted EPS (beia) up 11%, proposed DPS up 24% (36% pay-out ratio)

4
Healthy growth across the business
2014FY Organic growth %
AFRICA MIDDLE
EASTAMERICAS
ASIA PACIFIC
CENTRAL & EASTERN EUROPE
WESTERN EUROPE
HEINEKENNV
Consolidated revenue 4.4 6.9 5.3 -3.7 2.2 3.0
Revenue per HL -3.1 3.2 0.4 1.4 0.5 1.2
Consolidated operating profit (beia) 8.8 16 5.4 -4.5 4.5 8.7
Group Beer volume 6.7 3.7 5.0 -4.2 2.3 2.0
5
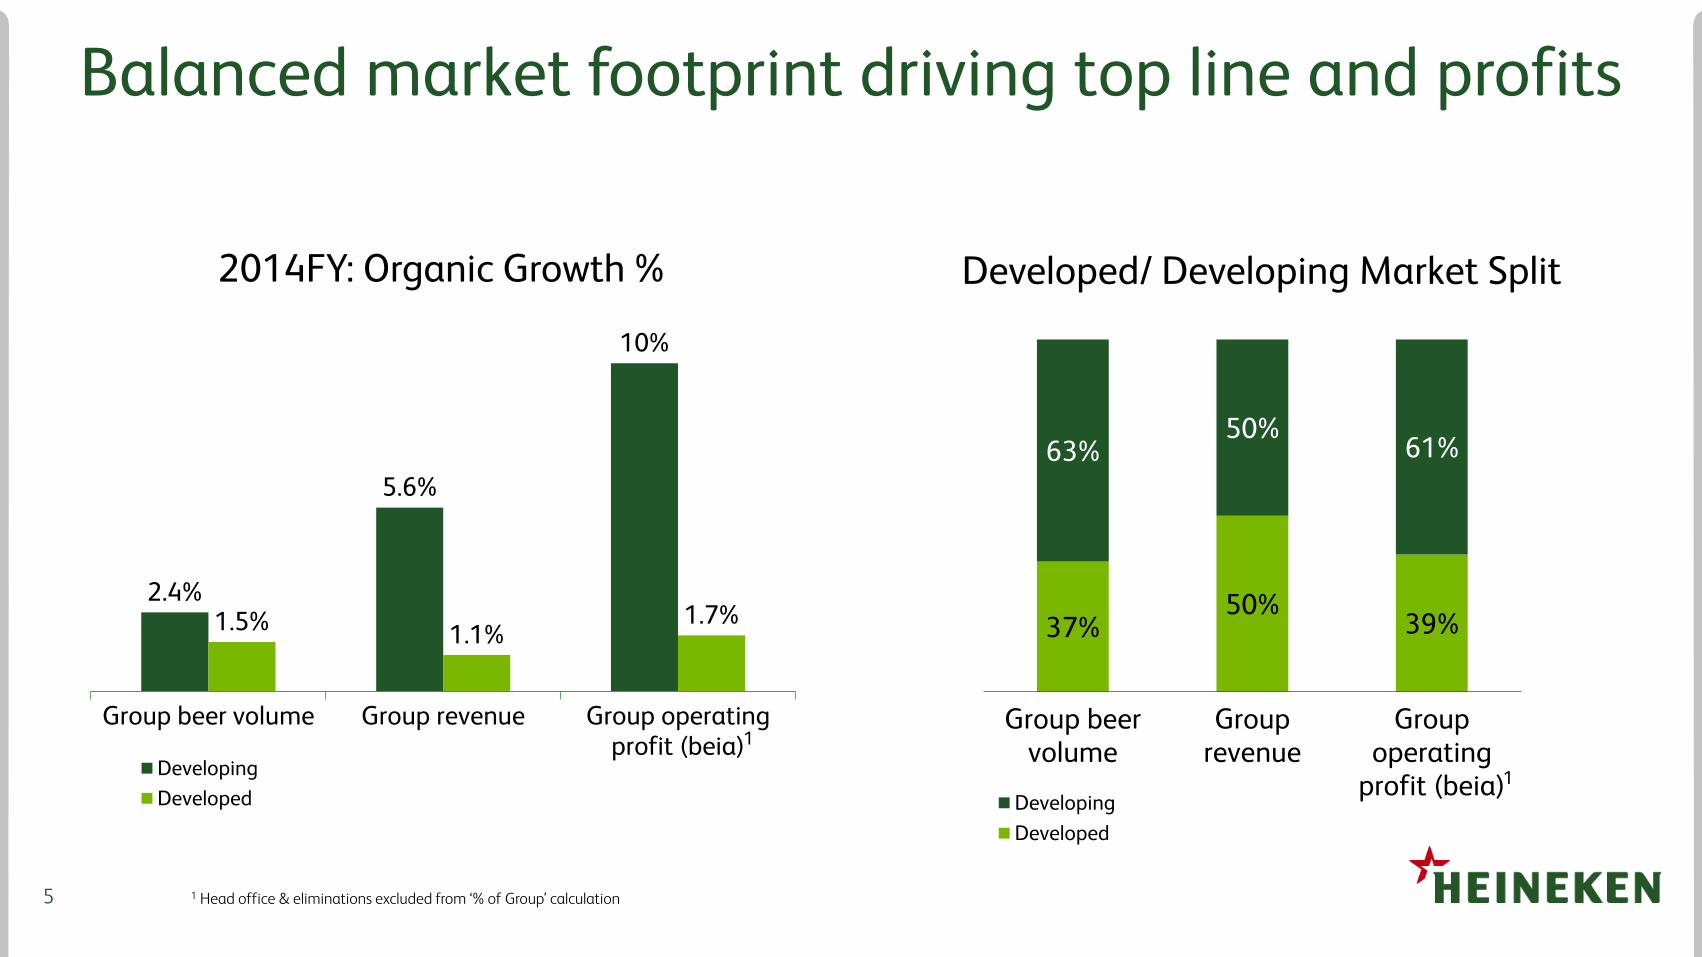
Balanced market footprint driving top line and profits
1 Head office & eliminations excluded from ‘% of Group’ calculation
37%50%
39%
63%50%
61%
Group beervolume
Grouprevenue
Groupoperating
profit (beia)Developing
Developed
Developed/ Developing Market Split2014FY: Organic Growth %
2.4%
5.6%
10%
1.5% 1.1%1.7%
Group beer volume Group revenue Group operatingprofit (beia)
Developing
Developed
1
1

6
Heineken® consistently outperforming premium
Source: Canadean – March 2014. FY2014 estimates on beer market and IPS * IPS = International Premium Segment (volume outside home market)
Heineken® premium volumes 2014FY
1.8%
4.0%
5.1%
Beer market IPS* Heineken®
Heineken® brand growing across all regions
Double digit growth in Brazil, China, France, the UK and Mexico
Encouraging progress in the US with positive Heineken® volume in Q4.
Successful ‘The City’ campaign, exciting pipeline for 2015 brand activation and marketing

7
Innovation delivered €1.5bn revenue, rate of 7.7%
From 1 January 2013, the innovation rate is calculated as revenues generated from innovation introduced in the past 40 quarters for a new category, 20 quarters for a new brand and 12 quarters for all other innovations, excluding packaging renovations divided by total revenue
Competitive advantage and sustainable contributor to profitability
Innovation rate1 New pack types Brand extensions
Innovation revenue Radler and alcohol free propositions Improving draught offer
3.0%
4.1%
5.3% 5.9%
7.7%
2010 2011 2012 2013 2014
2020 Target: 6%
€0.4bn
€1.5bn
2010 2014
40% CAGR

8
Continued focus on driving cost efficiencies
TCM2 completed in H1 2014 ahead of target and schedule.
Committed to driving further cost savings: Rightsizing the organisation to optimise cost structure Drive End2End productivity to grow topline and profits Leveraging global scale through Global Business Service organisation:
Additional efficiencies in HEINEKEN Global Procurement (HGP) Extending geographic scope and activities of HEINEKEN’s
Global Shared Services (HGSS)
Further cost savings are a key component of HEINEKEN’s medium term margin guidance
9
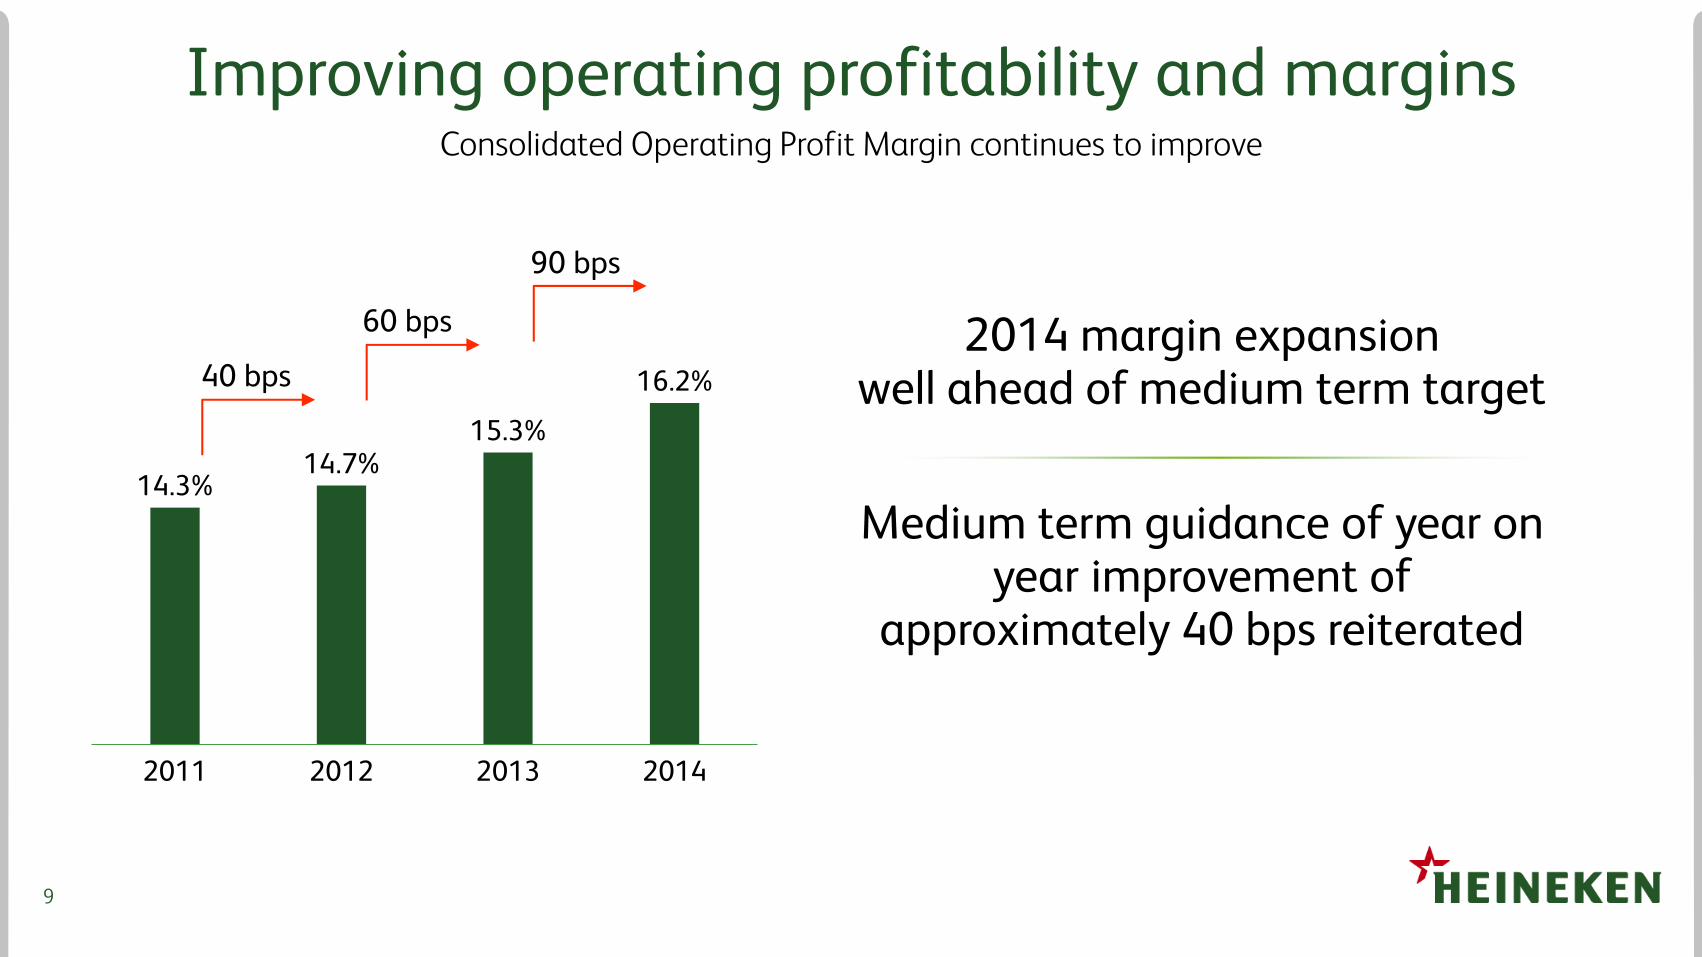
14.3%14.7%
15.3%
16.2%
2011 2012 2013 2014
Improving operating profitability and marginsConsolidated Operating Profit Margin continues to improve
90 bps
40 bps
60 bps 2014 margin expansion well ahead of medium term target
Medium term guidance of year on year improvement of
approximately 40 bps reiterated

10
2015 Full Year Outlook1
1 Based on consolidated reporting
Committed to delivering on strategic priorities – further revenue and profit growth in 2015
Continued challenging external environment
Positive organic revenue growth: Positive volume development more moderate than 2014 and weighted to H2 Revenue per hectolitre to increase driven by revenue management initiatives, pricing limited by
deflationary and off premise pressures in some markets
Slight increase in marketing and selling spend (beia) as percentage of revenue
Input cost prices to be slightly lower (excluding a foreign currency transactional effect)
Continue to target a year-on-year improvement in consolidated operating profit (beia) margin of around 40bps in the medium term. In 2015 consolidated operating profit (beia) margin will be adversely impacted by approximately 25bps from the disposal of EMPAQUE. HEINEKEN will partially but not fully offset this, such that in 2015 consolidated operating profit (beia) margin improvement will be somewhat below the 40bps medium term level

11
René Hooft Graafland
FULL YEAR 2014 RESULTS HEINEKEN N.V.
MEMBER OF THE EXECUTIVE BOARD/CFO
AMSTERDAM, 11 FEBRUARY 2015
12
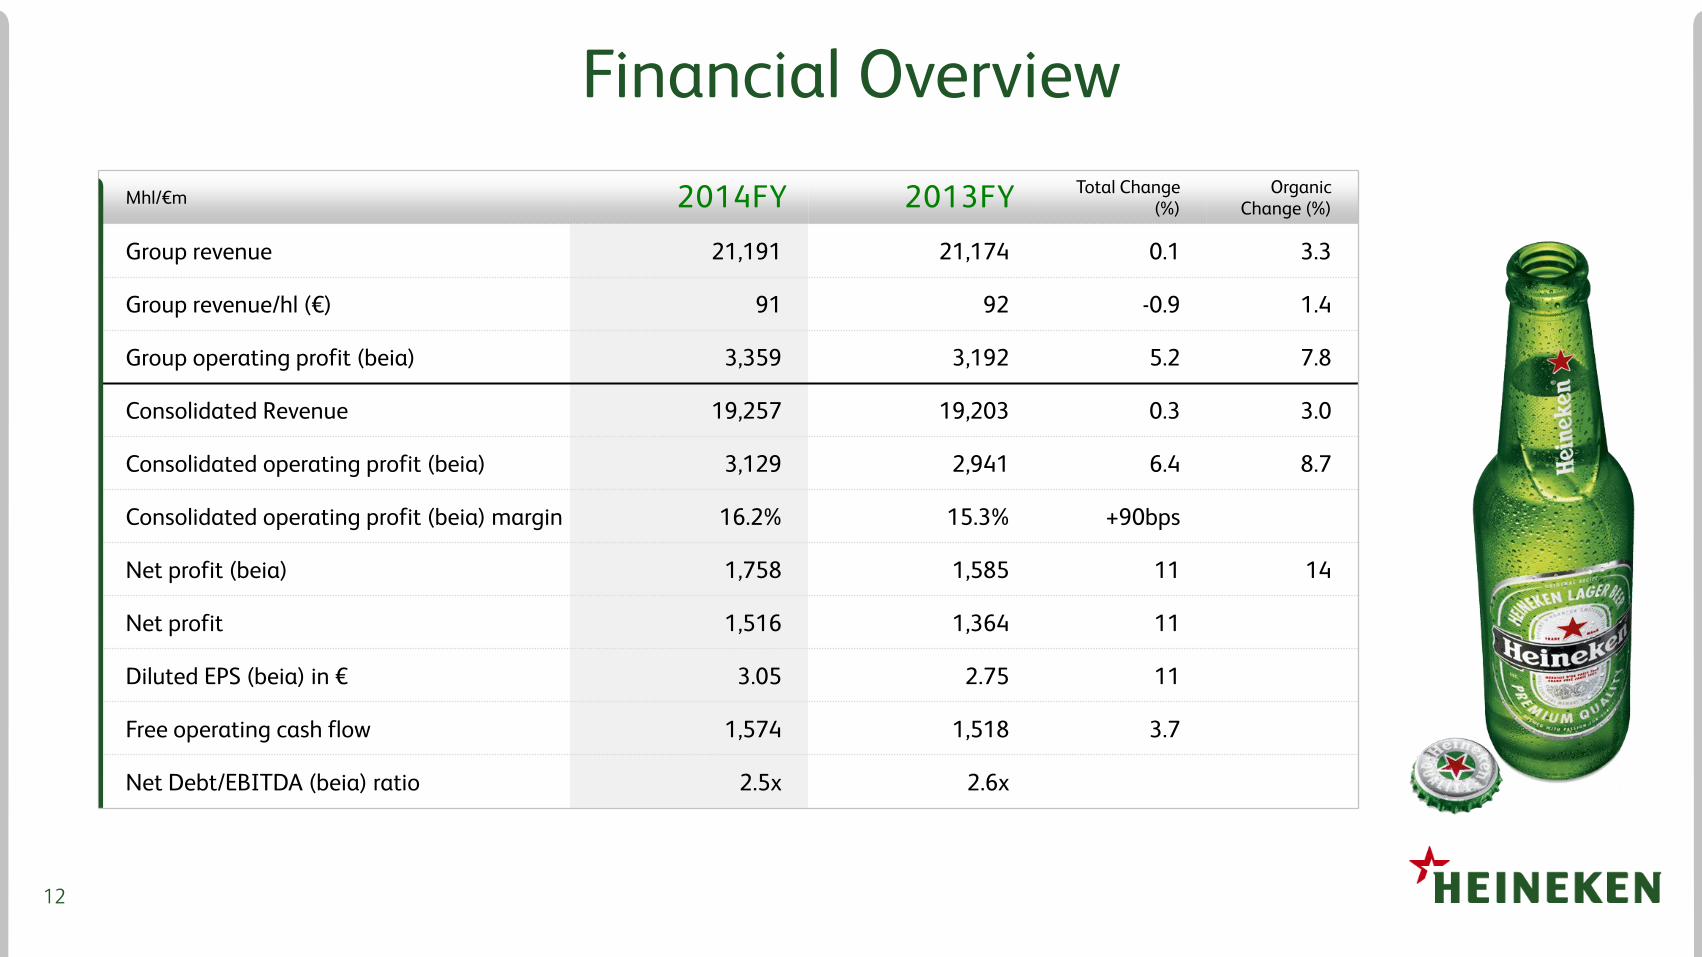
Financial Overview
Mhl/€m 2014FY 2013FY Total Change(%)
OrganicChange (%)
Group revenue 21,191 21,174 0.1 3.3
Group revenue/hl (€) 91 92 -0.9 1.4
Group operating profit (beia) 3,359 3,192 5.2 7.8
Consolidated Revenue 19,257 19,203 0.3 3.0
Consolidated operating profit (beia) 3,129 2,941 6.4 8.7
Consolidated operating profit (beia) margin 16.2% 15.3% +90bps
Net profit (beia) 1,758 1,585 11 14
Net profit 1,516 1,364 11
Diluted EPS (beia) in € 3.05 2.75 11
Free operating cash flow 1,574 1,518 3.7
Net Debt/EBITDA (beia) ratio 2.5x 2.6x
13
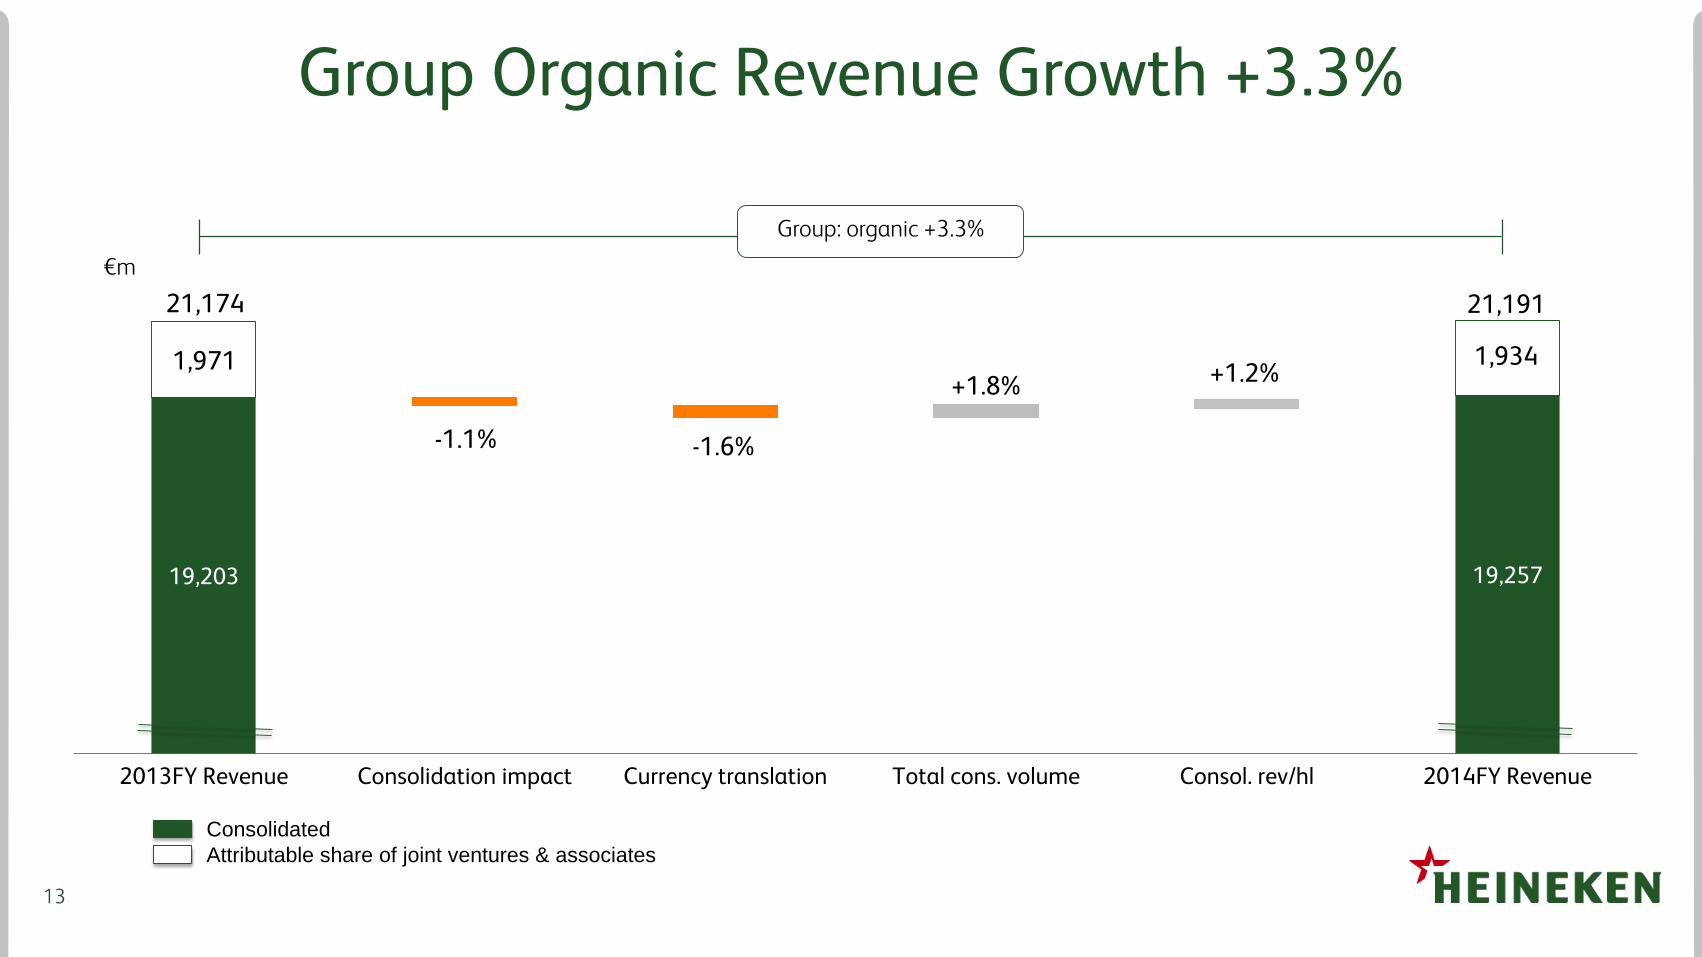
Group Organic Revenue Growth +3.3%
19,203 19,257
21,174
-1.1% -1.6%
+1.8% +1.2%
21,191
2013FY Revenue Consolidation impact Currency translation Total cons. volume Consol. rev/hl 2014FY Revenue
Group: organic +3.3%
Attributable share of joint ventures & associates
Consolidated
1,971 1,934
€m

14
Group Operating Profit (Beia) OG +7.8%
2,9413,129
3,192
-0.6% -1.7%
+8.7%
3,359
2013FY Operating profit (beia) Consolidation impact Currency translation Organic growth 2014FY Operating profit (beia)
Group: organic +7.8%
Attributable share of joint ventures & associates
Consolidated
251230
€m

15
Diluted EPS (beia) €3.05, +11%
€2.75
€3.05
-€0.02-€0.06
+€0.38
2013FY Diluted EPS (beia) Consolidation impact Currency translation Organic growth 2014FY Diluted EPS (beia)
EPS +11%

16
Strong Free Operating cash flow
1 Defined as cumulative amounts of year-on-year changes in the Total Working Capital starting from 20102 Capital expenditure related to property, plant and equipment
Net debt/EBITDA target achieved
2014FY 2013FY vs. LY
Cash flow from operations (before change in working capital)
4,279 3,990 289
Change in working capital 27 51 -24
Capital expenditure2 -1,494 -1,369 -125
Free operating cash flow 1,574 1,518 56
Net debt/EBITDA 2.5x 2.6x
4.7%
6.4%7.1%
7.8%
0
500
1,000
1,500
2011 2012 2013 2014
Capital Expenditure2 as % of Revenue (€ million)
Capex (€m) Capex (% of revenues)
0
100
200
300
400
500
2011 2012 2013 2014
Cumulative working capital contribution to cash flow1
(€ million)

17
Currency and further financial guidance
1 Based on consolidated reporting
Adverse currency impact more pronounced in H1
Assuming spot rates as at 6 Feb 2015 positive currency translational impact on consolidated operating profit (beia) €130 million and €80 million at net profit (beia)
Capital expenditure to be approximately €1.6 billion (2014: €1.5 billion)
Stable average interest rate 3.7%, effective tax rate (beia) broadly in line with 2014
Translational FX impact (€ million)1
1H14 2H14 FY14 FY15E
Consolidated revenue -376 61 -315
Consolidated operating profit (beia) -55 6 -49 130
Net profit (beia) -35 3 -32 80

18
Summary
HEINEKEN remains committed to delivering on its strategic priorities
Strong performance in 2014FY reassures strategy is working
Effective commercial investments in brands, strong execution and innovation
driving market share gains
Revenue management and further cost savings underpin confidence
in margin expansion of around 40bps year-on-year in the medium-term

19
Appendix
FULL YEAR 2014 RESULTS HEINEKEN N.V.

20
Africa Middle East
Consolidated
Strong results achieved amid volatile trading environment
Solid volume growth across most
markets, in particular Nigeria,
Ethiopia, Cameroon, Burundi, DRC
and Egypt
Organic consolidated revenue/hl
declined by 3.1%, due to high
license volumes, unfavourable
country and product mix
Continued capital investment
in new capacity across key
markets
Heineken® growth of 7.8%
driven by South Africa, Nigeria,
Cameroon and Algeria
100bps improvement on
consolidated operating profit
(beia) margin mainly from
cost efficiencies
Revenue 2,643 3.5 4.4 3,085 2.7
Revenue/hl (in €) 84 -3.8 -3.1 82 -3.7
Operating profit (beia) 655 7.9 8.8 700 5.2
Operating profit (beia) margin 24.8% +100bps 22.7% +60bps
Total volume 31.6 7.6 7.5 37.6 6.6 6.6
of which:Beer volume
25.0 7.4 7.3 29.3 6.8 6.7
Total Change (%)
Organic Change (%)
Mhl/€m 2014FY 2014FY Total Change (%)
Organic Change (%)
Group

21
Americas
Consolidated
Strong top and bottom line growth
Revenue 4,631 3.0 6.9 5,401 1.6
Revenue/hl (in €) 85 -0.7 3.2 87 -1.8
Operating profit (beia) 780 8.6 16 887 6.1
Operating profit (beia) margin 16.8% +80bps 16.4% +70bps
Total volume 54.6 3.8 3.7 62.3 3.5 3.7
of which:Beer volume
53.2 3.9 3.9 57.0 3.7 3.7
Total Change (%)
Organic Change (%)
Mhl/€m 2014FY 2014FY Total Change (%)
Organic Change (%)
Group
Solid growth in Brazil, Mexico,
Panama and export markets resulted
in 3.7% volume growth
Heineken® grew by 4.0% led
by Brazil, Mexico and export
markets
Mexico saw strong profit growth with
200bps of margin expansion due to
strong topline supported by ongoing
cost efficiencies
Operating profit (beia) increased
organically by 16% primarily due
to double digit growth in Mexico
and positive performance in Brazil
Continued strong growth
of Dos Equis and Tecate
brands in U.S and Mexico

22
Asia Pacific
Consolidated
H2 driving growth
Revenue 2,088 2.5 5.3 2,455 3.2
Revenue/hl (in €) 112 -1.4 0.4 100 -1.4
Operating profit (beia) 550 2.5 5.4 598 3.0
Operating profit (beia) margin 26.3% 0bps 24.4% 0bps
Total volume 18.7 4.0 4.9 24.5 4.7 4.8
of which:Beer volume
18.3 5.5 5.2 24.0 5.8 5.0
Total Change (%)
Organic Change (%)
Mhl/€m 2014FY 2014FY Total Change (%)
Organic Change (%)
Group
Volume growth accelerated in the
second half, with improved
trading conditions witnessed
across key markets
Production capacity expanded in
Vietnam and China, and new
greenfield underway in Myanmar
and East Timor
Market share gains
across key markets:
Vietnam, Taiwan,
Indonesia
Consolidated operating profit (beia) up
5.4% organically, with gains from Vietnam,
China, Singapore, Cambodia and export
markets
Strong double digit growth
of Tiger brand driven by
successful commercial
activation
23
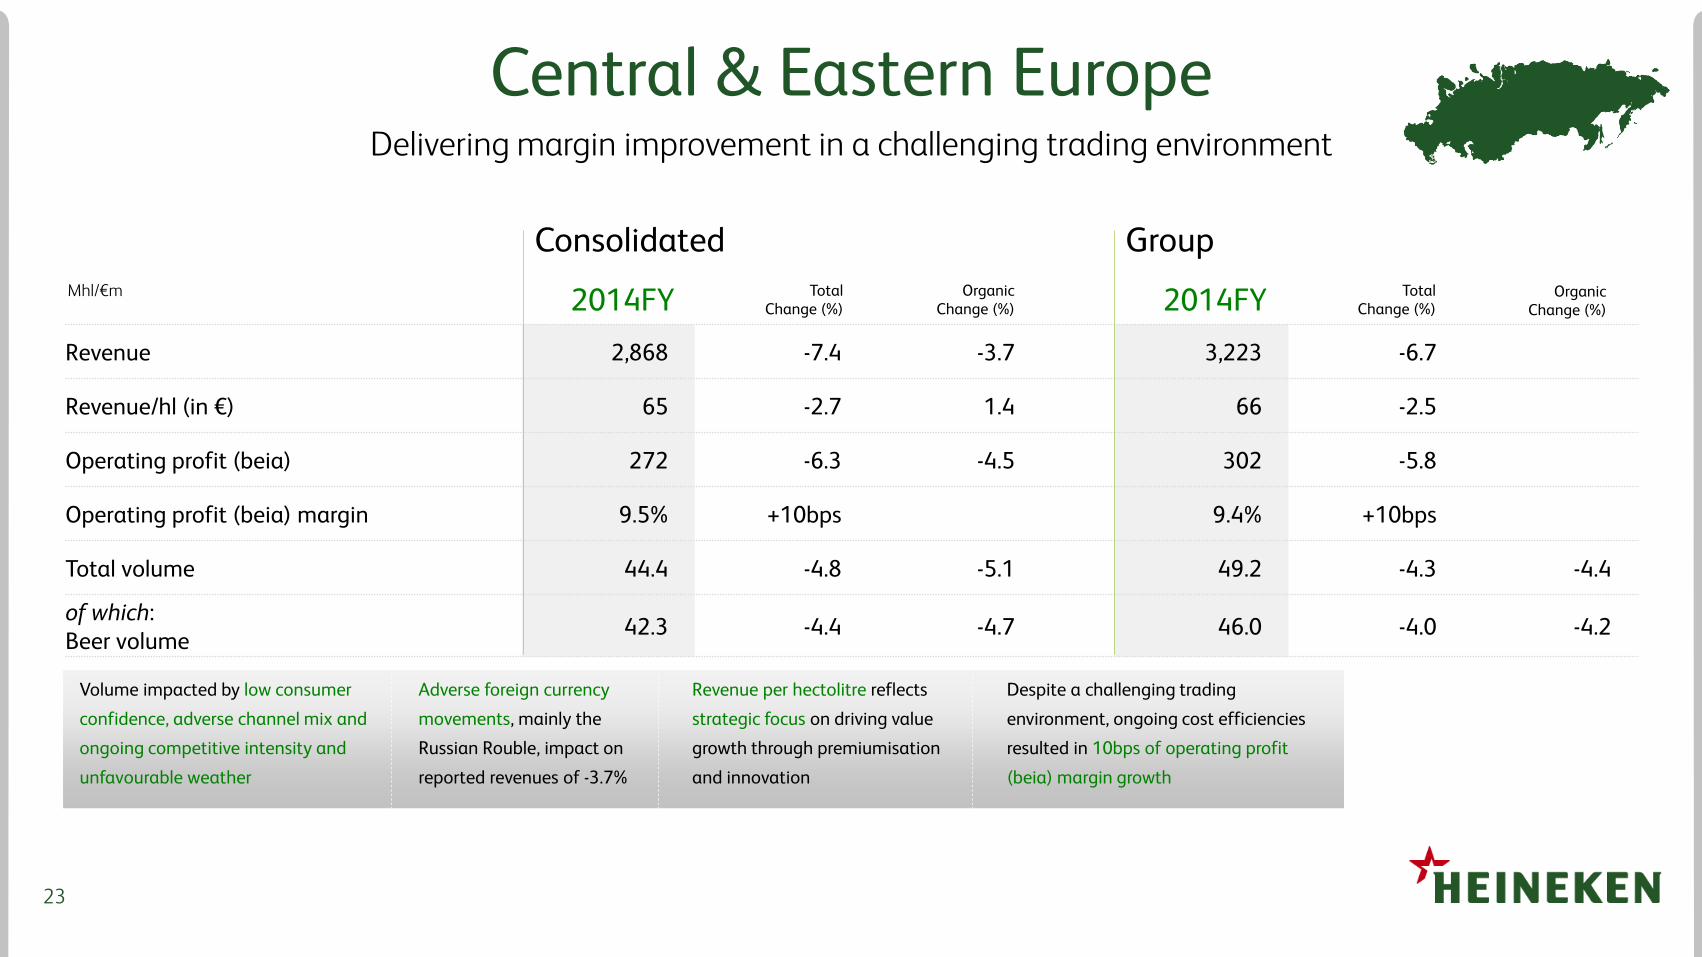
Central & Eastern Europe
Consolidated
Delivering margin improvement in a challenging trading environment
Revenue 2,868 -7.4 -3.7 3,223 -6.7
Revenue/hl (in €) 65 -2.7 1.4 66 -2.5
Operating profit (beia) 272 -6.3 -4.5 302 -5.8
Operating profit (beia) margin 9.5% +10bps 9.4% +10bps
Total volume 44.4 -4.8 -5.1 49.2 -4.3 -4.4
of which:Beer volume
42.3 -4.4 -4.7 46.0 -4.0 -4.2
Total Change (%)
Organic Change (%)
Mhl/€m 2014FY 2014FY Total Change (%)
Organic Change (%)
Group
Volume impacted by low consumer
confidence, adverse channel mix and
ongoing competitive intensity and
unfavourable weather
Adverse foreign currency
movements, mainly the
Russian Rouble, impact on
reported revenues of -3.7%
Despite a challenging trading
environment, ongoing cost efficiencies
resulted in 10bps of operating profit
(beia) margin growth
Revenue per hectolitre reflects
strategic focus on driving value
growth through premiumisation
and innovation

24
Western Europe
Consolidated & Group
Strong Execution & Higher Investments Driving Market Share Gains
Revenue 7,478 0.3 2.2
Revenue/hl (in €) 127 1.9 0.5
Operating profit (beia) 852 -0.1 4.5
Operating profit (beia) margin 11.4% 0bps
Total volume 59.0 -1.6 1.7
of which:Beer volume
42.5 0.5 2.3
Total Change (%)
Organic Change (%)
Mhl/€m 2014FY
Organic volume growth driven by broad-based market
share gains from focused commercial assertiveness,
increased brand investment and a clear consistent
strategy “Not An Inch Back” across the region
Organic revenue growth
supported by improving
volume and revenue per
hectolitre
Operating profit (beia)
grew 4.5% lead by
France, Spain, and the
Netherlands
The divestment of Oy
Hartwall Ab in Finland on
23 August 2013 is reported
as a consolidation impact
Strong focus on
innovation and
premiumisation

25
2012A 696 696 1.36
2013A 556 556 1.31
2014A 553 553 1.31
2015F 529 478 1.34
2016F 503 218 1.21
2012A -4
2013A 11
2014A 0
2015F* -1
2016F* 41
US Dollar Hedging
Position Impact
Net inflowIn USD mln
Hedged Part**Year Hedged Rate*** Year Net Profit
* Impact on open positions calculated by comparing spot rate with previous year’s hedging rate ** Hedging as at 6th February 2015*** Including the costs of hedging

26
Disposal of Empaque
Disposal announced on 1 September, for an EV of US $1,225 million to Crown Holdings Inc
Deal is subject to customary closing conditions and regulatory approval, and is expected to complete during Q1 2015
In 2014 EMPAQUE generated €515 million revenue mostly intercompany and €91 million EBIT (beia)
EMPAQUE results to date were included under ‘Head office’
In 2015 HEINEKEN consolidated operating profit (beia) margin will be adversely impacted by approximately 25bps from the disposal of EMPAQUE
HEINEKEN expects to record approximately €300 million post tax book gain, which will be treated as exceptional item in FY2015