Full report Value for money in housing options and...
27
Full report Value for money in housing options and homelessness services
Transcript of Full report Value for money in housing options and...

Full report
Value for money in housing options and homelessness services

2 Research: summary Benchmarking local authority homelessness and housing options/advice services
1. IntroductionValue for money and efficient management of housing options/homelessness prevention and assessment services have never been more important.
The budget constraints arising from current austerity – a tough economic environment leading to increased pressure on services and limits on public sector funding – will compel local authorities to look more closely at:
n what services cost
n how cost relates to service quality.
Shelter and Acclaim’s review service uses a tried and tested methodology to combine quality review and benchmarking to give authorities an integrated, independent report on the quality, value for money, efficiency and effectiveness of their housing options/homelessness prevention and assessment services.
Service benefits and features n integrated review of costs and quality
n detailed review of processes plus mystery shopping of customer services
n delivered by experts in the field with specialist knowledge of homelessness and benchmarking
n on-site support with data collection
n results presentation and final report1
n outputs enable the case to be put for the continued investment in housing options and prevention services
n ‘service modelling’ tool enables managers to test different service delivery structures and funding levels.
Participating authorities have used review service outcomes to make informed decisions about housing options/homelessness prevention and assessment services and strengthen the case for continued investment and funding.
The service has also helped authorities identify important cost savings and efficiencies that can be delivered alongside targeted action to improve service quality, enhance effectiveness and improve outcomes for clients.
Understanding how costs compare, what drives
spending levels (and unit costs) and how these relate to service quality is critical. The benchmarking outputs and the quality review results enable authorities to distinguish between effective and less effective use of resources.
This enables authorities to identify real value for money improvements and deliver better quality services without increasing costs, or deliver the same quality services for less.
Shelter and Acclaim have just completed the first tranche of reviews and this report considers some of the key themes and messages that emerged.
In particular:
n it highlights the unit cost of a prevention compared to a ‘full duty’ acceptance.
It also identifies areas in which authorities:
n could make cost savings
n identify efficiencies and
n target improvements in service delivery.
For details of the key themes from the first tranche of reviews2 and how the service could help your authority contact:
Mathew Cunningham, ShelterOffice: 0344 515 1483Mobile: 07860 501797E-Mail: [email protected]
Mark Awbery, Acclaim ConsultingOffice: 020 7345 5126Mobile: 07961 355162E-Mail: [email protected]
.
1. This will be optional in future.
2. Bristol, Medway, Exeter, Northampton, Swindon and Crawley councils participated in the first tranche of the review service.
Research: summary Benchmarking local authority homelessness and housing options/advice services3
Review service overviewThe service provides authorities with a review that covers the core VFM components of quality, performance and cost across three activity areas:
Activity 1: housing options/homelessness prevention – the work undertaken to advise and assist households dealing with housing and housing-related issues to prevent them becoming homeless.
Activity 2: homelessness assessment – the work undertaken to assess the duty owed to a household under homelessness legislation.
Activity 3: conclusion of duty – the work undertaken to meet the main homelessness duties (excluding day-to-day lettings and allocations work).
The provision of temporary accommodation can also be benchmarked on an optional basis.
Why undertake the review service?The review service aims to optimise the client experience and give clear guidelines on how participating authorities can provide services and outputs that represent real value for money.
A comprehensive examination of outputs precisely identifies areas where authorities need to focus efforts to improve service performance, quality and cost.
Key features include:
n detailed review of service quality, combining mystery shopping with onsite quality audit work (including file reviews, observation of customer contact, focus groups, interviews with staff and managers) and a desktop review of policies and procedures
n providing authorities with proactive and onsite support with the collection of benchmarking data. This assures data quality, integrity and consistency. It also helps to streamline the data collection process.
n the service is delivered by a team of experts with specialist knowledge of homelessness and housing options/advice and a background in the delivery of benchmarking and/or advice services.
Detailed analysis, feedback and reportThe review service outputs provide authorities with a level of detail in results analysis, feedback and reporting that is not matched elsewhere in the sector.
Each authority receives an onsite results presentation and a final report3, setting out:
n current spending and activity levels – and their impact across the three core activity areas
n existing service delivery processes – with areas of weakness highlighted
n areas for improving service efficiency and effectiveness:
— achieving cost savings
— improving processes
— improving outcomes for clients
— enhancing the customer experience.
Findings and outputs can be used to support the preparation of business cases and strategic plans to improve services.
The ‘service modelling’ tool provided at the end of the service can also be used to model service delivery options and test the impact of revised structures and funding levels.
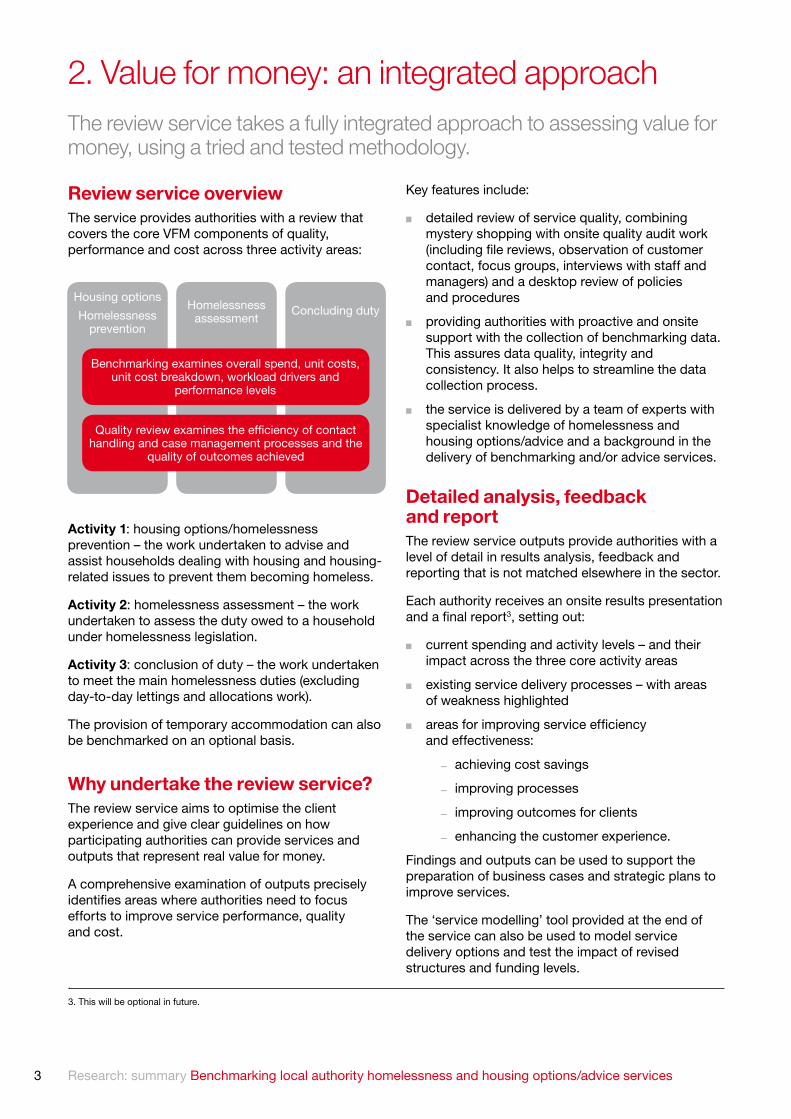
2. Value for money: an integrated approachThe review service takes a fully integrated approach to assessing value for money, using a tried and tested methodology.
Housing options
Homelessnessprevention
Homelessnessassessment
Concluding duty
Benchmarking examines overall spend, unit costs, unit cost breakdown, workload drivers and
performance levels
Quality review examines the efficiency of contact handling and case management processes and the
quality of outcomes achieved
3. This will be optional in future.
.

Research: summary Benchmarking local authority homelessness and housing options/advice services4
MethodologyThe methodology combines Shelter’s expertise in quality review work with Acclaim’s knowledge of cost and performance benchmarking to provide a fully comprehensive service.
Quality reviewsThe approach taken toward assessing service quality is founded on three core values:
1. customers – should always be at the core of service delivery
2. standards – of service delivery should meet the highest customer expectations, best practice and statutory requirements
3. consistency – services should aim to consistently achieve standards using structured processes that work towards clearly targeted outcomes.
Shelter has used these values to develop a quality standards framework, which assesses services on a like-for-like basis and benchmarks delivery across different authorities.
Quality standards frameworkThe quality standards framework is formed around the three core benchmarking activity areas:
Activity 1: housing options/homelessness preventionThe quality standards framework focuses on evaluating the following key service delivery standards:
n handling initial client contact and information gathering
n provision of prevention and options advice
n case management practice
n quality of outcomes achieved, including throughput or referral to other sources of assistance and advice.
Activity 2: homelessness assessment The quality standards framework focuses on the following key service delivery standards:
n planning and managing case investigations
n efficiency of inquiries process
n quality of decision-making and communication of decisions in line with statute, guidance and good practice.
Activity 3: conclusion of dutyThe quality standards framework focuses on the following:
n approach to meeting Part VII Housing Act 1996 duties broken down into duty types, including needs assessments for advice, assistance and support
n effectiveness of ongoing liaison and communication with applicants and the steps taken to proactively review options to move people on to suitable temporary and permanent accommodation.
Assessment processEach activity area is subdivided into a number of quality standards, which are assessed on the basis of the elements that make them up.
The process for determining the level of quality starts with assessing these constituent elements. Once that is completed, the level of quality achieved within each standard, benchmarking activity area and overall can be determined by aggregating element scores to the required level, as illustrated below:
Step 1 Each element within a standard is assessed
Step 2 The assessments for each element determine the score and rating for the relevant standard
Step 3The scores for each standard are used to determine the level of quality for each activity area
Step 4The scores in each activity area are used to determine the overall level of achievement against the quality standard framework

Research: summary Benchmarking local authority homelessness and housing options/advice services5
Service quality is evaluated against the quality standards framework using:
n telephone/email mystery shopping to assess the approach to handling initial client contact:
— 20 telephone calls are made and five emails sent over a four-week period
— the calls/emails include a range of scenarios with different levels of urgency, covering common problem types
n file review to assess housing options and homelessness case management:
— 15–20 housing options and 15–20 homelessness files are reviewed
n structured interviews with staff and managers and a desktop review of authorities’ key strategies, service plans, policies and procedures
n examination of arrangements for supporting and supervising advisers/assessment officers, together with mechanisms to support quality control and assurance.
ScoringEach element is scored using a five-point scale – ‘excellent’ (5pts); ‘good’ (4pts); ‘fair’ (3pts); ‘poor’ (2pts); and ‘failing’ (1pt).
The results are used to determine the performance for each quality standard, benchmarking activity area and overall service on a red, amber, green (RAG) basis, according to a five-point performance scale:
OutputsThis approach enables authorities to:
n understand the quality of service in each activity area, and compare this to peer authorities on multiple levels:
Overall
Activity area
Quality standard
Element
Case specific
n utilise the findings of the quality and cost benchmarking to gain a detailed understanding of service efficiency and value for money in terms of process and outcomes
n use the results to inform an improvement plan.
‘The benchmarking and audit review by Shelter and Acclaim is without doubt the most comprehensive exercise undertaken for the homelessness service at Medway Council. The benchmarking has given us a clear indication of how to address our homeless budgets and monitor against outcomes, which is even more important during the financial constraints that lie ahead.’Vanessa Wilson, Head of Housing Solutions, Medway Council
Rating Performance (based on % of available scores)
Excellent 81%–100%
Good 70%–80%
Fair 50%–69%
Poor 40%–49%
Failing <40%

Research: summary Benchmarking local authority homelessness and housing options/advice services6
BenchmarkingThe benchmarking uses activity-based costing to identify and compare the overall spend, unit cost, workload and performance profile of housing options/homelessness prevention and assessment services against one another across three core activities (as highlighted in the introduction).
The provision of temporary accommodation can also be benchmarked, on an optional basis, and some authorities participating in the initial tranche of reviews seized this opportunity4.
Benchmarking measuresThe benchmarking examined the following for each activity:
n overall spending levels – by looking at total spend per thousand (’000) households (adjusted for deprivation – see below for more about this)
n unit costs – for example, ‘cost per successful prevention’ or ‘cost per assessment’
n unit cost breakdown – how much of this is attributable to ‘operational’ staff (homelessness and housing advice staff) and how much is attributable to direct costs (see below for more about these)
n workload levels – and the relationship between these, spending levels and unit costs
n performance.
The costs benchmarked included staff costs and direct costs.
Direct costs included charges for rent deposit/damage guarantee/rent in advance schemes (or similar), sanctuary schemes, externally funded mediation services, homeless prevention fund payments, discretionary housing payments (where used for prevention) and legal services.
Staff costs included grants paid to external organisations for the provision of services – where these related to the core activities but did not fall into one of the direct cost categories.
Overheads such as central recharges for IT and office accommodation and locally incurred costs for items such as printing and stationery were excluded from the benchmarking. This decision was taken for three reasons:
n it speeded up the collection and collation of benchmarking data by removing the need to obtain and pro-rata cost data from corporate services
n it enabled the benchmarking to concentrate on ‘controllable costs’, i.e. those costs that were under the management (and control) of each authority’s housing options/homelessness prevention and assessment services
n it avoided the outputs being distorted by differences in overhead costs (which are best benchmarked as a whole – rather than as part of individual activities).
Note about the adjustment applied to take account of different deprivation levels: a number of benchmarking statistics were calculated per ’000 households to enable comparisons between authorities in relation to spending and workloads. Recognising that some authorities are more deprived than others (and that this will influence spending levels and workloads), each authority’s household numbers were adjusted using the English Indices of Deprivation to take account of this. Such statistics are presented throughout this report as ‘per ’000 adjusted households’.
.
4. The submission of benchmarking data for this activity was optional, as the outputs were aimed solely at authorities that collected the rent for the majority of their temporary accommodation themselves (e.g. PSL type accommodation) and who would therefore be impacted directly if the cost of providing such accommodation exceeded the revised HB subsidy allowance that was introduced in April.
The benchmarking outputs for this activity compared the cost of providing temporary accommodation to an authority’s HB subsidy allowance to help the authority take strategic decisions about its future provision. Since the outputs for this activity were essentially internal to each authority they are not cov-ered in this report.

Research: summary Benchmarking local authority homelessness and housing options/advice services7
The median overall quality standard achieved was ‘fair’ (66%). The upper quartile quality standard was ‘good’ (71%) while the lower quartile quality standard was ‘fair’ (60%) – illustrative of a compact group.
A key pattern emerged in relation to authorities where advisers were given scope to explore a wide range of prevention options and focused on helping clients to remain in their existing accommodation (when it was appropriate). The findings showed that this approach had a positive impact in raising the number of successful outcomes.
See later in this section for a more detailed analysis of quality and cost benchmarking outcomes.
Continued investment in servicesParticipating authorities were able to use outcomes from the review service to make informed decisions about their housing options/homelessness prevention and assessment services and build the case for their continued and increased investment and funding.
The service also helped authorities identify important cost savings and efficiencies that can be delivered alongside targeted action to improve service quality, enhance effectiveness and improve outcomes for clients.
Significant savingsUnderstanding how costs compare, what drives spending levels (and unit costs) and how these relate to service quality is critical. It enables authorities to distinguish between effective and less effective use of resources and identify real value for money improvements – where cost savings and efficiencies can be delivered alongside targeted action to improve services and outcomes for clients.
The results show that the minimum unit cost savings per prevention compared to a ‘full duty’ acceptance5 are in the range of £1,300 to £7,700 (see Section 4 for more detail):
Key messages identified in the first tranche of the reviews, evidence of good practice initiatives, efficiency ideas and scope for improving service delivery all help to strengthen the case for continued local investment.
Overall cost and quality profileThe median spend per ’000 households (adjusted for deprivation – see Section 2 for more details) for the three core activity areas examined was £7,978:
Spending on housing options/homelessness prevention advice was approximately eight times that of homelessness assessment, a clear indication of strategic priorities.
Although authorities were routinely achieving positive homelessness prevention outcomes, the quality review results indicated a clear link between quality outcomes and a better standard of client handling, advice and case management.
0
10
20
30
40
50
60
70
80
90
100
Overall Options Assessment Conclusion
MedianUpper quartileLower quartile
3. Value for money: key messagesResults of the first tranche of reviews identified a number of themes and key messages that demonstrated the value of the work being undertaken by authorities in delivering housing options / homelessness prevention and assessment services.
Housing options/homelessness prevention
Homlessness assessment
Conclusion of duty
£6,639 (83%)
£860
(11%
)
£479
(6%
)
Housing options/homelessness prevention
Homlessness assessment
Conclusion of duty
£6,639 (83%)
£860
(11%
)
£479
(6%
)
.
5. Where the household’s application for assistance is assessed under Part VII, they are accommodated in temporary accommodation provided by the au-thority and work is subsequently undertaken to conclude duty.
Research: summary Benchmarking local authority homelessness and housing options/advice services8
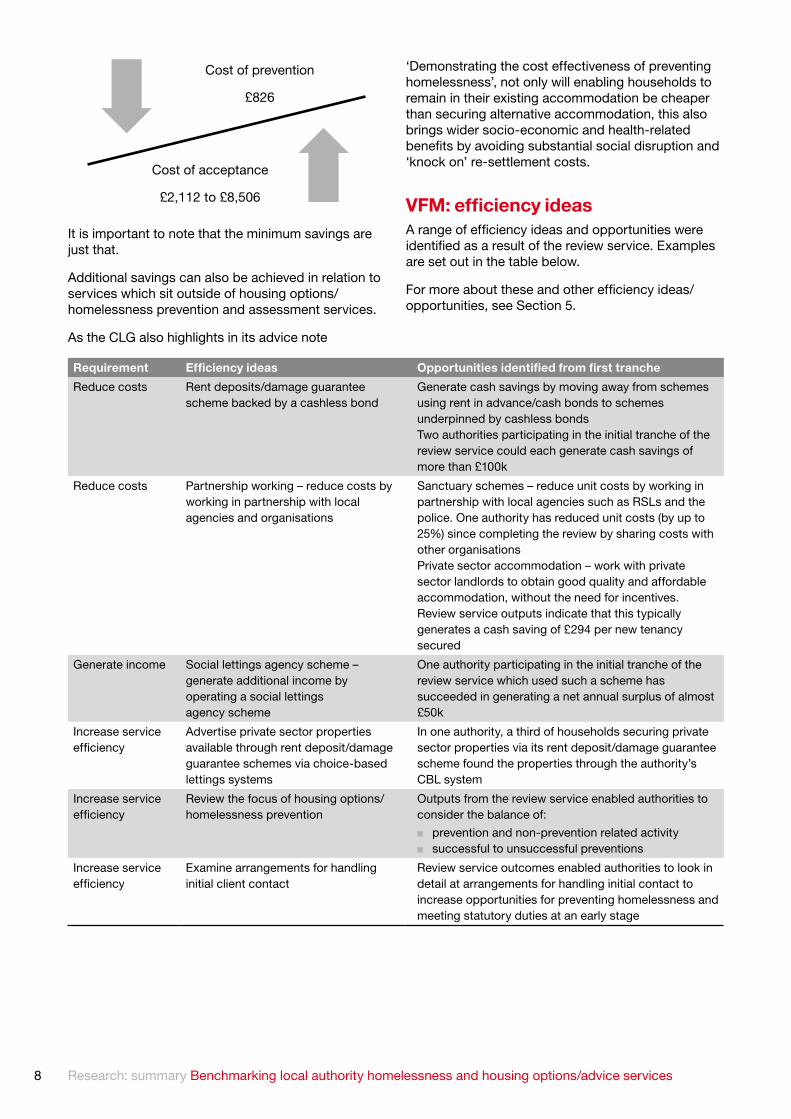
It is important to note that the minimum savings are just that.
Additional savings can also be achieved in relation to services which sit outside of housing options/ homelessness prevention and assessment services.
As the CLG also highlights in its advice note
‘Demonstrating the cost effectiveness of preventing homelessness’, not only will enabling households to remain in their existing accommodation be cheaper than securing alternative accommodation, this also brings wider socio-economic and health-related benefits by avoiding substantial social disruption and ‘knock on’ re-settlement costs.
VFM: efficiency ideasA range of efficiency ideas and opportunities were identified as a result of the review service. Examples are set out in the table below.
For more about these and other efficiency ideas/opportunities, see Section 5.
Cost of prevention
£826
Cost of acceptance
£2,112 to £8,506
Requirement Efficiency ideas Opportunities identified from first tranche
Reduce costs Rent deposits/damage guarantee scheme backed by a cashless bond
Generate cash savings by moving away from schemes using rent in advance/cash bonds to schemes underpinned by cashless bonds Two authorities participating in the initial tranche of the review service could each generate cash savings of more than £100k
Reduce costs Partnership working – reduce costs by working in partnership with local agencies and organisations
Sanctuary schemes – reduce unit costs by working in partnership with local agencies such as RSLs and the police. One authority has reduced unit costs (by up to 25%) since completing the review by sharing costs with other organisations Private sector accommodation – work with private sector landlords to obtain good quality and affordable accommodation, without the need for incentives. Review service outputs indicate that this typically generates a cash saving of £294 per new tenancy secured
Generate income Social lettings agency scheme – generate additional income by operating a social lettings agency scheme
One authority participating in the initial tranche of the review service which used such a scheme has succeeded in generating a net annual surplus of almost £50k
Increase service efficiency
Advertise private sector properties available through rent deposit/damage guarantee schemes via choice-based lettings systems
In one authority, a third of households securing private sector properties via its rent deposit/damage guarantee scheme found the properties through the authority’s CBL system
Increase service efficiency
Review the focus of housing options/homelessness prevention
Outputs from the review service enabled authorities to consider the balance of:
n prevention and non-prevention related activity n successful to unsuccessful preventions
Increase service efficiency
Examine arrangements for handling initial client contact
Review service outcomes enabled authorities to look in detail at arrangements for handling initial contact to increase opportunities for preventing homelessness and meeting statutory duties at an early stage
Research: summary Benchmarking local authority homelessness and housing options/advice services9
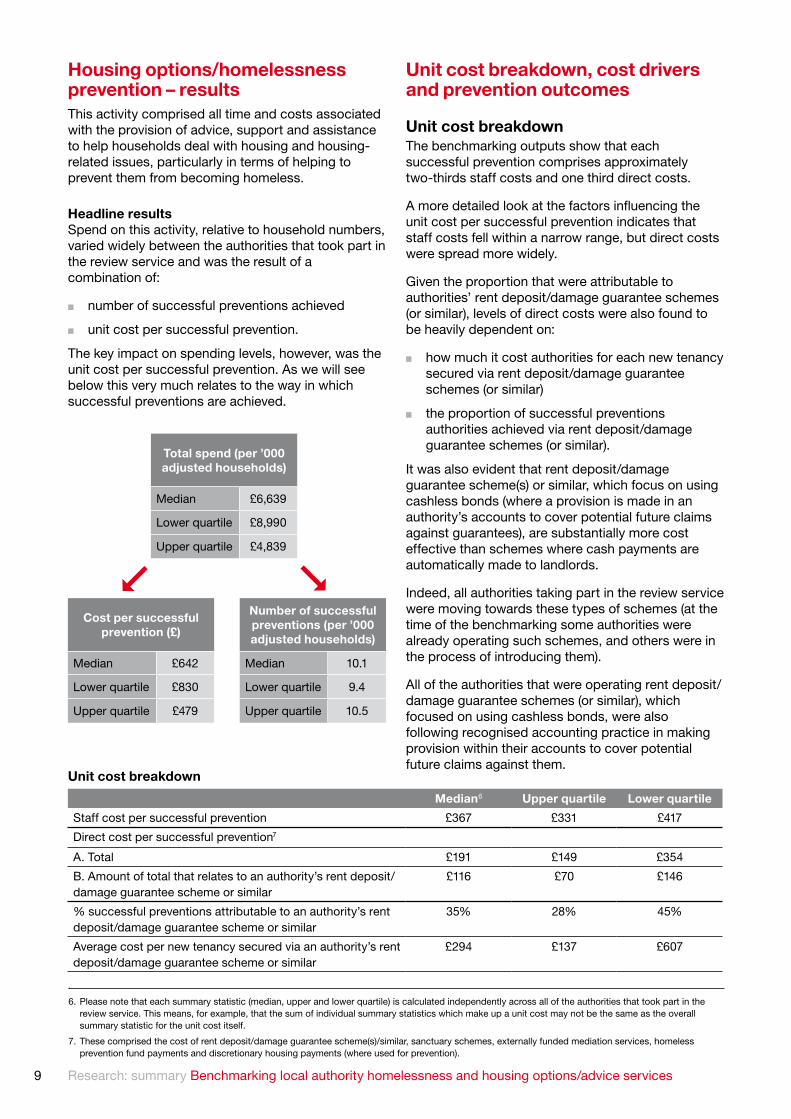
Housing options/homelessness prevention – resultsThis activity comprised all time and costs associated with the provision of advice, support and assistance to help households deal with housing and housing-related issues, particularly in terms of helping to prevent them from becoming homeless.
Headline resultsSpend on this activity, relative to household numbers, varied widely between the authorities that took part in the review service and was the result of a combination of:
n number of successful preventions achieved
n unit cost per successful prevention.
The key impact on spending levels, however, was the unit cost per successful prevention. As we will see below this very much relates to the way in which successful preventions are achieved.
Unit cost breakdown, cost drivers and prevention outcomes
Unit cost breakdownThe benchmarking outputs show that each successful prevention comprises approximately two-thirds staff costs and one third direct costs.
A more detailed look at the factors influencing the unit cost per successful prevention indicates that staff costs fell within a narrow range, but direct costs were spread more widely.
Given the proportion that were attributable to authorities’ rent deposit/damage guarantee schemes (or similar), levels of direct costs were also found to be heavily dependent on:
n how much it cost authorities for each new tenancy secured via rent deposit/damage guarantee schemes (or similar)
n the proportion of successful preventions authorities achieved via rent deposit/damage guarantee schemes (or similar).
It was also evident that rent deposit/damage guarantee scheme(s) or similar, which focus on using cashless bonds (where a provision is made in an authority’s accounts to cover potential future claims against guarantees), are substantially more cost effective than schemes where cash payments are automatically made to landlords.
Indeed, all authorities taking part in the review service were moving towards these types of schemes (at the time of the benchmarking some authorities were already operating such schemes, and others were in the process of introducing them).
All of the authorities that were operating rent deposit/damage guarantee schemes (or similar), which focused on using cashless bonds, were also following recognised accounting practice in making provision within their accounts to cover potential future claims against them.
Unit cost breakdown
Total spend (per ’000 adjusted households)
Median £6,639
Lower quartile £8,990
Upper quartile £4,839
Cost per successful prevention (£)
Median £642
Lower quartile £830
Upper quartile £479
Number of successful preventions (per ’000 adjusted households)
Median 10.1
Lower quartile 9.4
Upper quartile 10.5
Median6 Upper quartile Lower quartile
Staff cost per successful prevention £367 £331 £417
Direct cost per successful prevention7
A. Total £191 £149 £354
B. Amount of total that relates to an authority’s rent deposit/damage guarantee scheme or similar
£116 £70 £146
% successful preventions attributable to an authority’s rent deposit/damage guarantee scheme or similar
35% 28% 45%
Average cost per new tenancy secured via an authority’s rent deposit/damage guarantee scheme or similar
£294 £137 £607
.
6. Please note that each summary statistic (median, upper and lower quartile) is calculated independently across all of the authorities that took part in the review service. This means, for example, that the sum of individual summary statistics which make up a unit cost may not be the same as the overall summary statistic for the unit cost itself.
7. These comprised the cost of rent deposit/damage guarantee scheme(s)/similar, sanctuary schemes, externally funded mediation services, homeless prevention fund payments and discretionary housing payments (where used for prevention).

Research: summary Benchmarking local authority homelessness and housing options/advice services10
However, as such schemes are relatively new, the full cost of claims has almost certainly yet to emerge – and any authority operating this type of scheme should keep the level of provision it has made in its accounts under regular review.
The potential for tenancies secured via rent deposit/damage guarantee scheme(s) or similar to fail is noteworthy in this respect.
The benchmarking results show that typically (see below) almost 10% of tenancies secured via rent deposit/damage guarantee scheme(s) or similar either fail part way through the minimum required term or are not renewed at the end of it.
The differing levels of staff and direct cost inputs into options/preventions services, when benchmarked against others, begin to highlight where authorities could focus their efforts to improve the efficiency and effectiveness of such services.
However, cost and resource benchmarking results must not be viewed in isolation and decisions about improving service efficiency and effectiveness should not be based solely on these.
It is important that such decisions are taken in context, and with a broader view of an authority’s housing options and homelessness prevention services. This is vital to ensure the provision of a well-balanced high quality service.
Cost drivers and prevention outcomesThe benchmarking results indicate that, typically, just over a third of successful preventions led to the household being able to remain in their existing accommodation. This is similar to the results of the CLG’s analysis of national P1E data in its advice note ‘Demonstrating the cost effectiveness of preventing homelessness’, CLG (July 2010).
However, individual authorities differed widely in the proportion of successful preventions where households were enabled to remain in their existing accommodation.
In some authorities more than 50% of households successfully prevented from becoming homeless were able to remain in their existing accommodation, while in others it was closer to 25%.
As the CLG advice note makes clear, enabling households to remain in their existing accommodation is not only cheaper than securing alternative accommodation, but it also brings wider socio-economic benefits – by avoiding substantial social disruption and ‘knock on’ resettlement costs.
The way in which authorities enabled households to remain in their existing accommodation (or obtain alternative accommodation) also varied widely, reflecting the influence of local policies and circumstances on authorities that took part in the review service.
Median Upper quartile Lower quartile
Successful preventions
A. Household enabled to remain in their existing home 34% 41% 26%
B. Household enabled to obtain alternative accommodation 66% 59% 74%
Outcomes of tenancies secured via an authority’s rent deposit/damage guarantee scheme or similar
A. Tenancy failed part way through the minimum required term
3.1% 0.0% 6.1%
B. Tenancy was not renewed at the end of the minimum required term
6.6% 4.6% 8.9%
Average cost per sanctuary scheme £627 £368 £1,057

Research: summary Benchmarking local authority homelessness and housing options/advice services11
Benchmarking outputs indicate the following upper/lower quartiles for the proportion of successful preventions where the household was able to remain in their existing accommodation – for the main types of prevention undertaken:
n debt advice, resolution of HB problems, social/private sector arrears and mortgage arrears (excluding Mortgage Rescue Scheme) – 7.6% to 20.2%
n external mediation (using trained mediators) – 0.0% to 5.4%
n conciliation and internal mediation (using trained mediators) – 1.3% to 4.2%
n sanctuary scheme – 1.2% to 4.1%
n illegal eviction/harassment – 0.1% to 1.6%.
The benchmarking outputs also indicate the following upper/lower quartiles for the proportion of successful preventions where the household was able to obtain alternative accommodation – across the main types of prevention undertaken:
n rent deposit/damage guarantee scheme(s) or similar – 27.6% to 45.0%
n hostel/HMO or supported accommodation – 1.1% to 6.9%
n part VI offer of accommodation – 2.2% to 7.4%
n private sector accommodation (without a landlord incentive) – 0.2% to 5.0%.
A key point to highlight is authorities’ varied success in working with the private rented sector to secure good quality, affordable rented accommodation to support homelessness prevention work, without resorting to incentives.
Authorities variously secured between zero and a quarter of the private sector tenancies that they used to help them prevent homelessness without the need to provide incentives via a rent deposit/damage guarantee scheme or similar. This highlights the potential role that close working with the private sector can play in helping authorities obtain good quality and affordable rented accommodation, to support prevention work as cost efficiently as possible.
The benchmarking indicates that authorities were generally successful in targeting time (and resources) effectively toward cases where prevention was likely to be successful. The results showed that typically (as a median) an authority achieved just over seven successful preventions for every unsuccessful prevention.
However, there was a distinct variation in the balance of services between prevention work and ‘housing advice only’ work (where assistance was provided on
a casework basis), with authorities variously undertaking between a third (lowest value quartile) and 0.8 (highest value quartile) of a ‘housing advice only’ case per successful or unsuccessful prevention.
Costs of sanctuary schemes also varied widely between the authorities that took part in the review service, both as a result of the level/type of scheme provided and the extent to which authorities were able to share costs with partner agencies (such as the police and registered social landlords).
‘By working in partnership with Shelter and Acclaim Consulting, Northampton Borough Council is now in a stronger position to identify strengths and weaknesses and address the challenges that housing faces in an environment of funding reductions. The work has allowed the council to realign funding within the housing directorate to protect these services in the future.’Ian Swift, Housing Solutions Manager, Northampton Borough Council
Assessment – resultsFor benchmarking purposes, this activity encompassed all time and costs associated with the formal assessment and investigation of what duty is owed, if any, to an applicant seeking assistance under homelessness legislation (Part VII of the Housing Act, 1996).
Headline results
Total spend (per ’000 adjusted households)
Median £860
Lower quartile £1,131
Upper quartile £828
Cost per assessment – s. 184 decisions
taken (£)
Median £375
Lower quartile £447
Upper quartile £300
Assessments – s. 184 decisions taken (per
’000 adjusted households)
Median 2.5
Lower quartile 3.2
Upper quartile 2.2

Research: summary Benchmarking local authority homelessness and housing options/advice services12
Spend on this activity, relative to household numbers, also varied widely between the authorities that took part in the review service and resulted from a combination of:
n number of assessments completed (where a decision was issued under s.184)
n unit cost per assessment completed (and a decision issued under s.184).
What is apparent from the benchmarking results, however, is the level of resource input which goes into housing options/homelessness prevention compared to homelessness assessment.
Typically almost eight times the resourcing input that goes into homelessness assessment goes into housing options/homelessness prevention.
The approach toward operational management also varies widely between authorities. Some authorities take a functional approach toward the completion of homelessness assessment work (with specific officers undertaking this), others operate more generic services (with officers undertaking both options/prevention and assessment work).
However, there seems to be a general trend toward a more generic-type of approach to the completion of homelessness assessment work. This is likely to continue as the number of assessments completed by authorities continues to reduce over time.
Unit cost breakdown, cost drivers and assessment outcomes
Unit cost breakdownThe benchmarking outputs show that almost all of the cost of this activity comprises staff costs. Of the minor proportion attributable to direct costs, almost all related to legal costs (and generally for one or two specific cases).
As the benchmarking results in the table below and the headline results diagram indicate, authorities participating in the review service varied in the:
n number of assessments completed – relative to household numbers
n acceptance rate – as a %
n number of acceptances made – relative to household numbers.
By benchmarking and reporting on each of these indicators together, authorities were able to take an integrated view of their assessment services and evaluate their effectiveness in relation to local circumstances and the operational environment.
For example, the outputs enabled authorities to judge whether their acceptance rate (as a %) appeared to be relatively high/low given the number of assessments they were completing and the number of acceptances that they made (relative to household numbers).
Median Upper quartile Lower quartile
Staff cost per assessment £366 £296 £441
Direct cost per assessment £19 £13 £40
Acceptance rate (% decisions issued under s. 184 where a ‘full duty’ was accepted)
57% 75% 44%
Number of acceptances (per ’000 adjusted households) 1.5 1.1 1.7
Research: summary Benchmarking local authority homelessness and housing options/advice services13
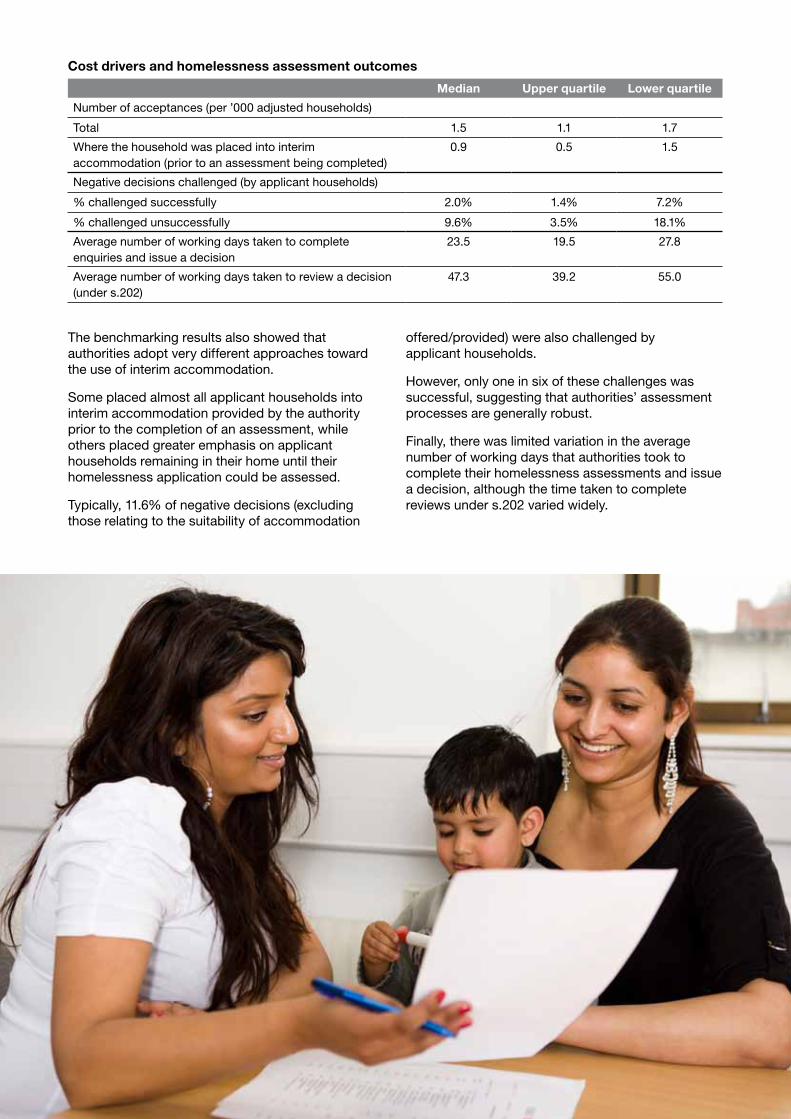
Median Upper quartile Lower quartile
Number of acceptances (per ’000 adjusted households)
Total 1.5 1.1 1.7
Where the household was placed into interim accommodation (prior to an assessment being completed)
0.9 0.5 1.5
Negative decisions challenged (by applicant households)
% challenged successfully 2.0% 1.4% 7.2%
% challenged unsuccessfully 9.6% 3.5% 18.1%
Average number of working days taken to complete enquiries and issue a decision
23.5 19.5 27.8
Average number of working days taken to review a decision (under s.202)
47.3 39.2 55.0
The benchmarking results also showed that authorities adopt very different approaches toward the use of interim accommodation.
Some placed almost all applicant households into interim accommodation provided by the authority prior to the completion of an assessment, while others placed greater emphasis on applicant households remaining in their home until their homelessness application could be assessed.
Typically, 11.6% of negative decisions (excluding those relating to the suitability of accommodation
offered/provided) were also challenged by applicant households.
However, only one in six of these challenges was successful, suggesting that authorities’ assessment processes are generally robust.
Finally, there was limited variation in the average number of working days that authorities took to complete their homelessness assessments and issue a decision, although the time taken to complete reviews under s.202 varied widely.
Cost drivers and homelessness assessment outcomes
Research: summary Benchmarking local authority homelessness and housing options/advice services14
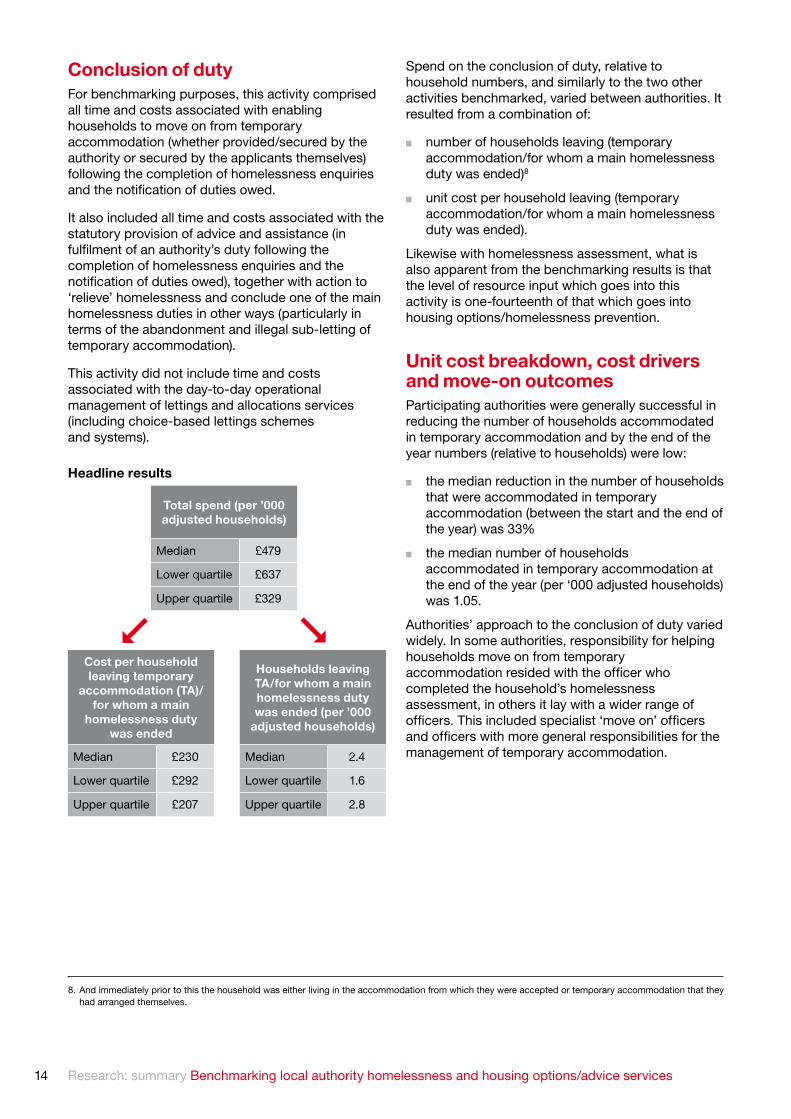
Conclusion of dutyFor benchmarking purposes, this activity comprised all time and costs associated with enabling households to move on from temporary accommodation (whether provided/secured by the authority or secured by the applicants themselves) following the completion of homelessness enquiries and the notification of duties owed.
It also included all time and costs associated with the statutory provision of advice and assistance (in fulfilment of an authority’s duty following the completion of homelessness enquiries and the notification of duties owed), together with action to ‘relieve’ homelessness and conclude one of the main homelessness duties in other ways (particularly in terms of the abandonment and illegal sub-letting of temporary accommodation).
This activity did not include time and costs associated with the day-to-day operational management of lettings and allocations services (including choice-based lettings schemes and systems).
Headline results
Spend on the conclusion of duty, relative to household numbers, and similarly to the two other activities benchmarked, varied between authorities. It resulted from a combination of:
n number of households leaving (temporary accommodation/for whom a main homelessness duty was ended)8
n unit cost per household leaving (temporary accommodation/for whom a main homelessness duty was ended).
Likewise with homelessness assessment, what is also apparent from the benchmarking results is that the level of resource input which goes into this activity is one-fourteenth of that which goes into housing options/homelessness prevention.
Unit cost breakdown, cost drivers and move-on outcomesParticipating authorities were generally successful in reducing the number of households accommodated in temporary accommodation and by the end of the year numbers (relative to households) were low:
n the median reduction in the number of households that were accommodated in temporary accommodation (between the start and the end of the year) was 33%
n the median number of households accommodated in temporary accommodation at the end of the year (per ‘000 adjusted households) was 1.05.
Authorities’ approach to the conclusion of duty varied widely. In some authorities, responsibility for helping households move on from temporary accommodation resided with the officer who completed the household’s homelessness assessment, in others it lay with a wider range of officers. This included specialist ‘move on’ officers and officers with more general responsibilities for the management of temporary accommodation.
Total spend (per ’000 adjusted households)
Median £479
Lower quartile £637
Upper quartile £329
Cost per household leaving temporary
accommodation (TA)/for whom a main
homelessness duty was ended
Median £230
Lower quartile £292
Upper quartile £207
Households leaving TA/for whom a main homelessness duty was ended (per ’000
adjusted households)
Median 2.4
Lower quartile 1.6
Upper quartile 2.8
.
8. And immediately prior to this the household was either living in the accommodation from which they were accepted or temporary accommodation that they had arranged themselves.
Research: summary Benchmarking local authority homelessness and housing options/advice services15
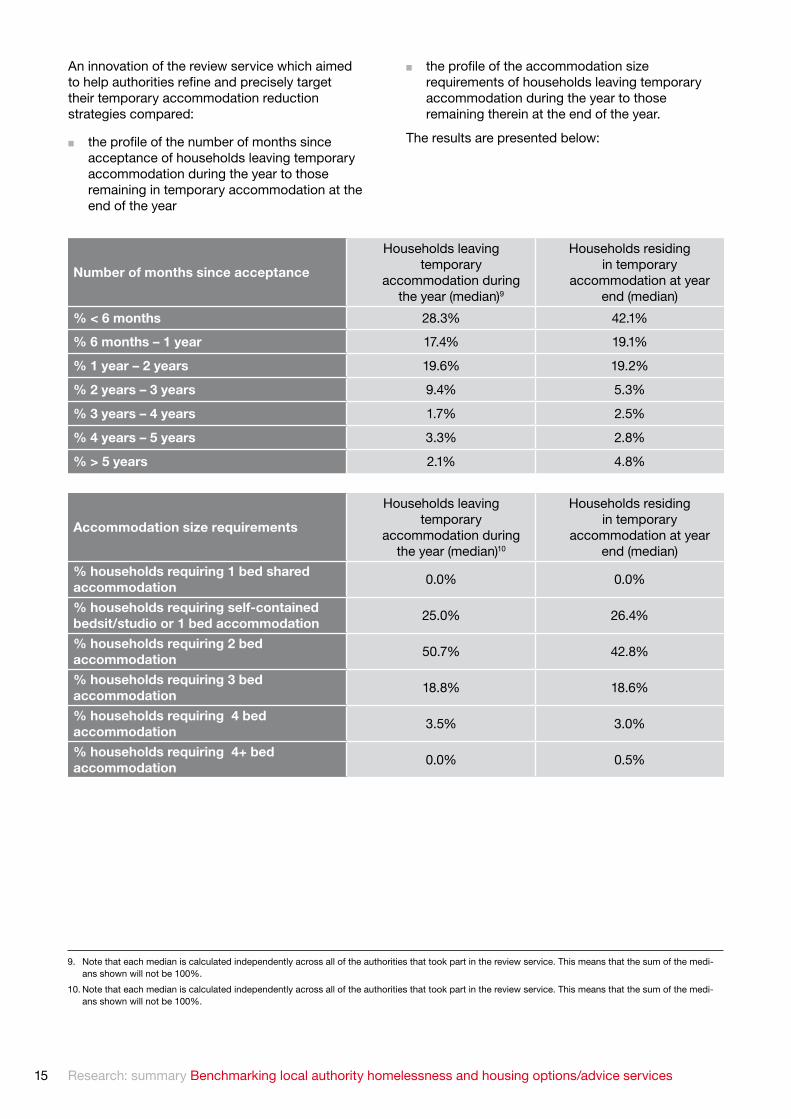
An innovation of the review service which aimed to help authorities refine and precisely target their temporary accommodation reduction strategies compared:
n the profile of the number of months since acceptance of households leaving temporary accommodation during the year to those remaining in temporary accommodation at the end of the year
n the profile of the accommodation size requirements of households leaving temporary accommodation during the year to those remaining therein at the end of the year.
The results are presented below:
Number of months since acceptance
Households leaving temporary
accommodation during the year (median)9
Households residing in temporary
accommodation at year end (median)
% < 6 months 28.3% 42.1%
% 6 months – 1 year 17.4% 19.1%
% 1 year – 2 years 19.6% 19.2%
% 2 years – 3 years 9.4% 5.3%
% 3 years – 4 years 1.7% 2.5%
% 4 years – 5 years 3.3% 2.8%
% > 5 years 2.1% 4.8%
Accommodation size requirements
Households leaving temporary
accommodation during the year (median)10
Households residing in temporary
accommodation at year end (median)
% households requiring 1 bed shared accommodation 0.0% 0.0%
% households requiring self-contained bedsit/studio or 1 bed accommodation 25.0% 26.4%
% households requiring 2 bed accommodation 50.7% 42.8%
% households requiring 3 bed accommodation 18.8% 18.6%
% households requiring 4 bed accommodation 3.5% 3.0%
% households requiring 4+ bed accommodation 0.0% 0.5%
9. Note that each median is calculated independently across all of the authorities that took part in the review service. This means that the sum of the medi-ans shown will not be 100%.
10. Note that each median is calculated independently across all of the authorities that took part in the review service. This means that the sum of the medi-ans shown will not be 100%.
Research: summary Benchmarking local authority homelessness and housing options/advice services16
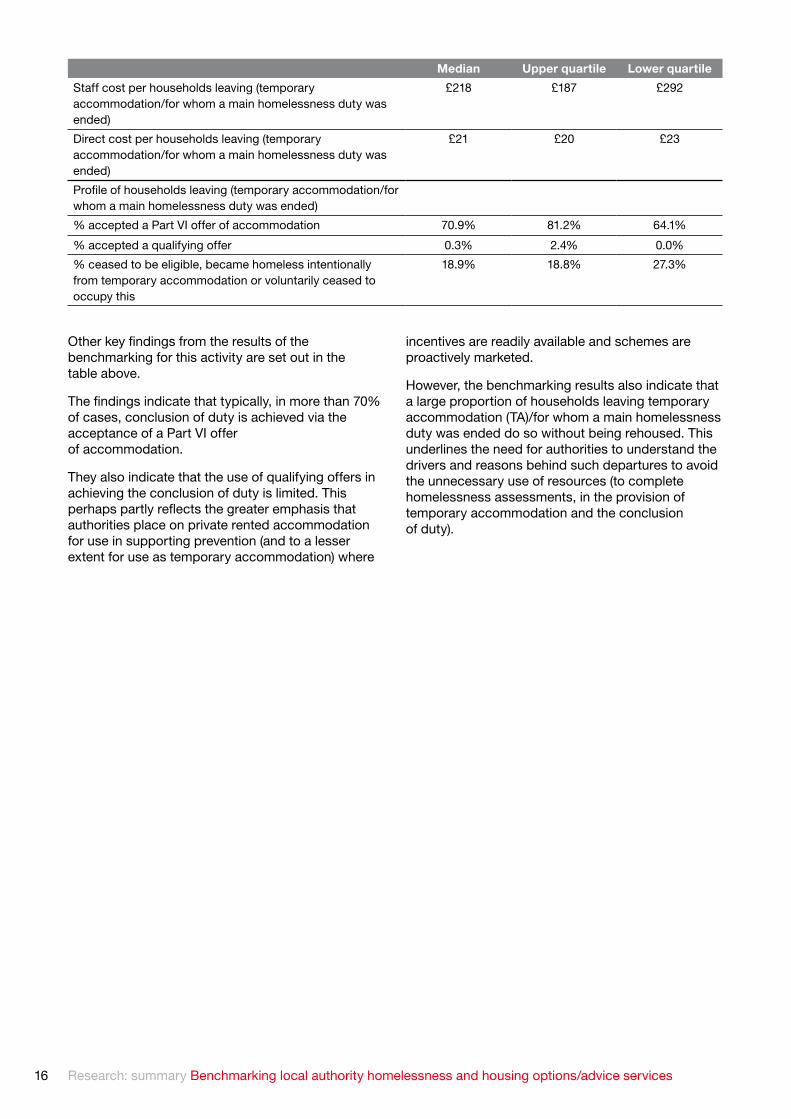
Median Upper quartile Lower quartile
Staff cost per households leaving (temporary accommodation/for whom a main homelessness duty was ended)
£218 £187 £292
Direct cost per households leaving (temporary accommodation/for whom a main homelessness duty was ended)
£21 £20 £23
Profile of households leaving (temporary accommodation/for whom a main homelessness duty was ended)
% accepted a Part VI offer of accommodation 70.9% 81.2% 64.1%
% accepted a qualifying offer 0.3% 2.4% 0.0%
% ceased to be eligible, became homeless intentionally from temporary accommodation or voluntarily ceased to occupy this
18.9% 18.8% 27.3%
Other key findings from the results of the benchmarking for this activity are set out in the table above.
The findings indicate that typically, in more than 70% of cases, conclusion of duty is achieved via the acceptance of a Part VI offer of accommodation.
They also indicate that the use of qualifying offers in achieving the conclusion of duty is limited. This perhaps partly reflects the greater emphasis that authorities place on private rented accommodation for use in supporting prevention (and to a lesser extent for use as temporary accommodation) where
incentives are readily available and schemes are proactively marketed.
However, the benchmarking results also indicate that a large proportion of households leaving temporary accommodation (TA)/for whom a main homelessness duty was ended do so without being rehoused. This underlines the need for authorities to understand the drivers and reasons behind such departures to avoid the unnecessary use of resources (to complete homelessness assessments, in the provision of temporary accommodation and the conclusion of duty).

Research: summary Benchmarking local authority homelessness and housing options/advice services17
QualityDeveloping and maintaining clear and robust processes to support housing options/homelessness prevention advice and service delivery from the initial point of contact is vital to achieving good quality outcomes for clients.
This is especially the case if services are to be focused on timely, good quality prevention advice and action that can draw on a range of resources to keep households in their existing accommodation when appropriate, and provide sustainable solutions when not.
This requires investment in a broad range of tools, resources and services to ensure that advisers can rely on a range of initiatives to help prevent homelessness.
The cost savings of preventing homelessness far outweigh the impact of losing accommodation and the cost of meeting the statutory duty, as we clearly demonstrate in Section 4.
Quality standardIn terms of the overall quality standard achieved by the group, the median result was ‘fair’ (66%). This result is indicative of the core finding across the participating group of authorities that points to a level of inconsistency in the quality of service delivery between, and within, the three core activity areas – housing options/homelessness prevention, homelessness assessment and conclusion of duty.
The upper quartile quality standard was ‘good’ (71%) and the lower quartile ‘fair’ (60%). With a range of just 13% between the highest overall score (73%) and the lowest overall score (60%), the results are illustrative of a compact group in terms of the quality of service delivery and outcomes achieved. None of the services were rated as ‘poor’ or ‘failing’.
Key messages: overviewAcross the group, a number of quality themes emerged, including strong evidence that targeted casework played a key role in authorities that were routinely successful in achieving homelessness preventions.
It was also clear that advice giving was an important factor and that improving advice could lead to more efficient and effective use of resources and achieve better quality outcomes.
A more structured approach could, we believe, extract greater value from existing spend on services, improving the quality of delivery and outcomes for clients.
1. Customer access to servicesMystery shopping highlighted the importance of effectively managing access to services and how opportunities for early intervention to prevent homelessness and meet statutory duties may be missed if access is limited or denied.
The results suggest that a key area for improvement would be more effective ‘triage’ of initial contact to proactively manage the customer journey from the initial point of contact through to further advice and assistance.
There was also evidence that performance was not strong where authorities relied on a corporate contact centre to manage access. However, even where mystery shoppers were able to speak to trained housing advisers, it was often the case that more could have been done to structure conversations to maximise the contact benefit for the client (e.g. by providing tailored outline advice on appropriate next steps) and the authority (to help it manage the throughput to face to face service provision efficiently).
0
10
20
30
40
50
60
70
80
90
100
Overall Options Assessment Conclusion
MedianUpper quartileLower quartile
Quality standard Group result %UQ Median LQ
Activity 1: Housing options 66 63 59
Activity 2: Homelessness assessment
79 73 66
Activity 3: Concluding Part VII duties
71 63 55
Overall quality standard achieved
71 66 60

Research: summary Benchmarking local authority homelessness and housing options/advice services18
The experience of our mystery shoppers suggests that if an authority can ensure its process for handling initial client contact is set up so that customers can speak to trained, specialist advisers with a structured approach to managing the call at the initial point of contact, this results in more people accessing the correct level of help at the right time and in the most appropriate manner (e.g. via an appointment, emergency drop-in, home visit, follow up telephone/email contact, completion of form etc).
2. Quality of options advice and homelessness prevention caseworkThe results show a close correlation between good case management standards and better quality outcomes. Better quality outcomes (i.e. successfully tackling the immediate problem as well as addressing the underlying causes) were more routinely achieved where service delivery was based on good case management and advisers were given scope to explore a wide range of options.
The positive impact of good case management was evident in the quality and sustainability of outcomes achieved by services that adopted a holistic, proactive approach – compared to those that did not.
Consequently, review service outcomes point to a need for authorities to consider how officers delivering options/prevention services can strengthen their case management skills and improve the efficient and effective delivery of housing options and homelessness prevention advice.
3. Meeting statutory dutiesHomelessness assessment case management standards were generally more advanced than standards for housing options/homelessness prevention advice, with clearer records of cases’ progress to a decision under s.184 (or s.202).
The general standard of decision-making and notification was good in the sample of cases reviewed, with clients normally receiving fair decisions, based on a reasoned and objective review of the available evidence.
However, the results did point to a need to consider how clearer records and action planning (at the initial contact and housing options stage) would have provided more robust evidence that officers were giving sufficient consideration as to whether the trigger points for progressing an application for assistance (s.183 HA 1996) and securing interim accommodation (s.188 HA 1996) had been passed.
More could also be done to improve communication with clients and ensure that inquiries were open and transparent.
4. Concluding dutyIn most authorities, close liaison was maintained post-decision to try to secure suitable temporary accommodation for households owed the full duty under s.193.
However, the results pointed to a need for authorities to consider how resources could be targeted post-decision to proactively support clients moving on from temporary accommodation to permanent accommodation, or to meet the advice and assistance duties.
5. Efficiency of processEfficiency of advice and assessment systems and processes can be improved by reducing unnecessary contacts with clients and avoiding collecting and recording the same information about a client’s situation and circumstances on multiple occasions.
Taking action to improve systems and processes can also help to drive up standards of customer service.

Research: summary Benchmarking local authority homelessness and housing options/advice services19
Detailed information about a client’s situation is important in determining suitable options, and making Part VI and VII assessment where required. However, it should only be necessary to gather information once (unless there are significant changes in circumstance).
Results of the quality review point to a need to ensure that the ‘whole’ process is connected and works smoothly across (at least) the following:
n handling initial contact from clients
n housing register application/CBL scheme
n housing options/homelessness prevention
n homelessness assessment.
It was interesting that information collection, collation and recording worked better in services where officers had more generic roles, as there was less cause to ‘hand over’ to others (who often started information gathering afresh).
6. Guidance, personal development, support and supervisionAdvisers and assessment officers need the knowledge, skills, tools and resources to do their job effectively.
Housing options/homelessness prevention and assessment services require ongoing investment to provide the professional environment advisers need to deliver good quality services.
Key elements are:
n fit for purpose advice and case management systems and processes
n clear guidance on case management standards and processes
n training in case management practice and knowledge areas
n access to knowledge update resources and group reviews (at team meetings) of legal developments and best practice
n a regular programme of 1-2-1 casework support and supervision sessions with a senior adviser/team leader, tied to performance monitoring against outcomes of periodic file reviews and objectives set at annual appraisals.
7. Quality control and quality assuranceEmbedding a robust approach to quality control and quality assurance is necessary to ensure that high standards are clearly set and maintained.
Quality control can be achieved with more visible prompts at key stages in advice processes, together with ‘sign-off’ at the point of recording outcomes.
In terms of quality assurance, a programme of periodic peer or supervisor reviews of a sample of case files for key quality, process and statutory compliance criteria can also help to maintain or drive up standards.
‘We had been looking to undertake this exercise to evaluate our services and it provided an objective, realistic view which, given the proposed budget changes, is particularly timely. The review will enable us to evidence quality and cost, which has enabled us to identify areas for improvement and how we can move forward to provide an efficient, effective and quality service in our borough.’Nick Kemmett, Homeless Operations Manager, Swindon Borough Council

Research: summary Benchmarking local authority homelessness and housing options/advice services20
Activity areas: results and key messages
Prevention and housing options/adviceThe median quality standard score for this activity area was ‘fair’ (63%). Similar to the overall quality scores, this was indicative of a level of inconsistency.
Results for authorities that took part in the first tranche of reviews were narrowly confined, with the upper quartile (66%) and lower quartile (59%) both in the ‘fair’ performance band.
The spread between the highest performance score (67% ‘fair’) and the lowest (55% ‘fair’) was just 12%.
Case managementCase management from initial contact through to case closure was generally of a fair standard, but could be improved to match good practice.
Shelter’s experience as a national advice and support service provider across a range of platforms has led us to believe that good quality outcomes routinely follow the consistent application of good case management standards by advisers and support workers:
n good case management starts at the initial point of contact with effective triage operated by advisers with the specialist skills needed to give clients the right level of help at the right time
n at diagnostic interviews, advisers establish a detailed picture of the client’s circumstances so that comprehensive advice covering the presenting problems and any underlying issues (by signposting or referral if needs be) can be given
n a clear action plan is prepared to guide casework assistance, confirmed in writing and given/sent to the client. This should also signal the action needed to achieve targeted outcomes within a clear timescale.
n close liaison and frequent contact ensures a good relationship is established between adviser and client. It also helps to prevent action tailing off before a tangible outcome can be achieved. Case notes chart the action and contact undertaken, as well as providing a record of the history of the case from initial contact, to diagnostic interview and case closure
n written confirmation of outcome(s) is used to formally close the advice case.
The results of the quality review point to a need for authorities to consider how to get the best out of processes in these areas by:
n structuring the approach to establishing details of a client’s situation at first contact. This can best be achieved using a series of standard prompts that lead the officer handling the contact to diagnose the urgency of the problem, provide some outline advice on likely options and suggest clear and appropriate next steps that proactively, and consistently, manage access to the service
n making records of diagnostic options interviews in a standard format to provide clear details of a client’s situation, the range of options discussed (including application under Part VII where necessary) and an agreed action plan
n utilising such records to provide clients with tailored confirmation of the advice that has been given and a next steps action plan
n advisers taking ownership of individual cases, with an emphasis on maintaining close liaison and prompting contact with clients to ensure this is not lost and cases are progressed efficiently
n maintaining comprehensive case records to provide a clear audit trail from initial contact through options interview(s) and casework to a recorded outcome, with quality control mechanisms embedded throughout the process (especially at the point of case closure, to validate outcomes prior to reporting)
n establishing quality assurance routines to assure a consistent approach and level of quality in the delivery of advice-based services
n investing time and resources to provide a professional environment for the delivery of good quality advice (and assessment) services. The key elements are:
— fit for purpose advice and case management systems and processes
Quality standard Group result %UQ Median LQ
A1 Handling initial client contact 65 62 57
B1 Options advice 69 67 65
B2 Confirmation of advice 55 53 49
B3 Casework assistance 66 63 57
B4 Case closure 65 59 55
B5 Outcomes 71 71 68
Activity area 1: housing options quality standard
66 63 59
Research: summary Benchmarking local authority homelessness and housing options/advice services21
— clear guidance on case management standards and processes
— training in case management practice, and relevant housing/housing-related subject areas
— knowledge update resources being made available and group reviews (at team meetings) of legal developments and best practice
— a regular programme of 1-2-1 casework support and supervision sessions with a senior adviser/team leader, tied to performance monitoring against objectives set during annual appraisals.
OutcomesGroup results for outcomes were spread across ‘good’ and ‘fair’, and were compact for the group as a whole. This is indicative of our finding that successful outcomes were achieved for the majority of clients.
However, the most striking finding – which points to a correlation between better outcomes, a more comprehensive approach to service delivery and good case management – relates to individual authority level results. The range between the highest scoring authority (78% ‘good’) and the lowest scoring authority (59% ‘fair’) was a significant 19% for quality of outcomes overall (21% for ‘enhanced’ outcomes).
The difference could be tracked to the standard of advice and case management and the use of a broader range of prevention options, tools and resources.
High and low scoring authorities could report successful outcomes, but where the approach focused on advisers taking ownership from the initial point of contact with the aim of enabling clients to remain in their home, more successful and sustainable outcomes were achieved.
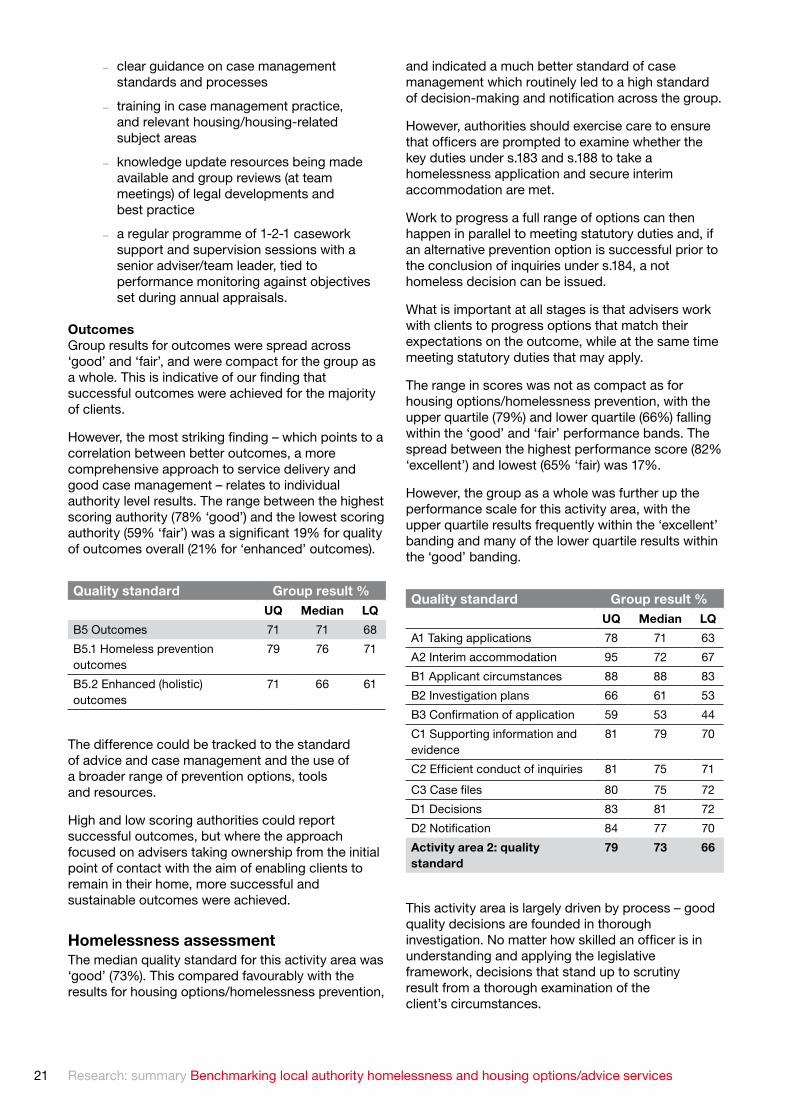
Homelessness assessmentThe median quality standard for this activity area was ‘good’ (73%). This compared favourably with the results for housing options/homelessness prevention,
and indicated a much better standard of case management which routinely led to a high standard of decision-making and notification across the group.
However, authorities should exercise care to ensure that officers are prompted to examine whether the key duties under s.183 and s.188 to take a homelessness application and secure interim accommodation are met.
Work to progress a full range of options can then happen in parallel to meeting statutory duties and, if an alternative prevention option is successful prior to the conclusion of inquiries under s.184, a not homeless decision can be issued.
What is important at all stages is that advisers work with clients to progress options that match their expectations on the outcome, while at the same time meeting statutory duties that may apply.
The range in scores was not as compact as for housing options/homelessness prevention, with the upper quartile (79%) and lower quartile (66%) falling within the ‘good’ and ‘fair’ performance bands. The spread between the highest performance score (82% ‘excellent’) and lowest (65% ‘fair) was 17%.
However, the group as a whole was further up the performance scale for this activity area, with the upper quartile results frequently within the ‘excellent’ banding and many of the lower quartile results within the ‘good’ banding.
This activity area is largely driven by process – good quality decisions are founded in thorough investigation. No matter how skilled an officer is in understanding and applying the legislative framework, decisions that stand up to scrutiny result from a thorough examination of the client’s circumstances.
Quality standard Group result %UQ Median LQ
B5 Outcomes 71 71 68
B5.1 Homeless prevention outcomes
79 76 71
B5.2 Enhanced (holistic) outcomes
71 66 61
Quality standard Group result %UQ Median LQ
A1 Taking applications 78 71 63
A2 Interim accommodation 95 72 67
B1 Applicant circumstances 88 88 83
B2 Investigation plans 66 61 53
B3 Confirmation of application 59 53 44
C1 Supporting information and evidence
81 79 70
C2 Efficient conduct of inquiries 81 75 71
C3 Case files 80 75 72
D1 Decisions 83 81 72
D2 Notification 84 77 70
Activity area 2: quality standard
79 73 66

Research: summary Benchmarking local authority homelessness and housing options/advice services22
Taking time to plan inquiries at the outset so that the investigation focuses on pertinent points and is progressed efficiently towards a decision, combined with chronological notes that chart progress through the inquiries, are key to demonstrating the action and evidence obtained between the point of application and decision.
Taking time to confirm an application and providing the client with information about the decision-making process also helps to make this open and transparent for the client.
In this regard, the median performance across all examined aspects was routinely in the ‘good’ performance banding. However, there were two notable exceptions – investigation plans and confirmation of application – where practice was less evolved across the authorities. We advocate these steps as good practice.
As noted above, planning inquiries (with a timetabled case plan) promotes greater consistency in the time taken to issue decisions, and encourages officers to be thorough. In general, inquiries were conducted efficiently, but within each case sample there were instances of decisions that took several weeks to complete, with no obvious cause for the delay.
In our experience, clients value being informed about the progress of their application. A common theme in our service user surveys for authorities is client dissatisfaction when they are kept in the dark about what is happening or how long a decision could take. Communicating with clients as a matter of process can alleviate these concerns.
Significant variation in performance was found in taking and progressing formal applications for assistance and providing/offering interim accommodation at the appropriate point (i.e. duties under s.183 and s.188 Housing Act 1996). There was considerable inconsistency in approach and some lack of clarity in records to indicate how these important statutory functions had been met.
Concluding Part VII dutiesThis quality standard is designed to evaluate how proactive an authority is in managing cases after a decision on an application has been made and the duty established.
The starting point involves a case officer being assigned a key worker role to take the case forward and meet the statute’s demand on duty. The key features of post-decision contact and liaison will be:
n securing suitable temporary accommodation as required
n a prompt assessment of needs and update of banding priority on the authority’s housing register/CBL scheme
n provision of information and advice about the next steps a client and the authority need to take, including the possibility of exploring alternative options for concluding duty (where a full duty is owed)
n maintaining close liaison and frequent contact to ensure that clients are taking positive steps to at least bid for properties on the CBL scheme.
The median quality standard for this activity was ‘fair’ (63%). This was indicative of inconsistent performance across the participating group of authorities, particularly in terms of maintaining close contact and liaising with clients on options to meet either the full or the advice and assistance duty.
The overall group result shows a variation between upper (‘good’ 71%) and lower (‘fair’ 55%) quartiles of 16%, which is distinct and reflects the variation between authorities in their standards of approach toward case management. The range of scores between the highest performer (‘good’ 73%) and the lowest (‘fair’ 51%) was a significant 22%.
The evidence from authorities that took part suggests that the main focus of activity post-decision was on securing suitable temporary accommodation. There was less focus on maintaining close contact and liaison with clients to progress conclusion of duty by closely monitoring and supporting efforts to secure permanent accommodation. There was also limited evidence across the group of a proactive approach to meeting relevant advice and assistance duties
There were often no clear and set processes in place to manage cases post-decision. This was reflected in the number of staff and the different functions involved in this aspect of case management.
Quality standard Group result %UQ Median LQ
D1 Decisions 83 81 72
D1.1 Accurate decisions 89 81 72
D1.2 Sufficient supporting evidence
87 81 67
D2 Notification 84 77 70
D2.1 Statutory notification requirements
85 80 76
D2.2 Explanation of duty owed 83 76 65
D2.3 Easy to understand 84 77 72

Research: summary Benchmarking local authority homelessness and housing options/advice services23
accommodation and the amount covered by LHA (£1,215, calculated at 119% of an average LHA of £139 per week over 46 weeks, the average stay in temporary accommodation post decision)
— Total = £2,112
3. Saving = £1,286 (£2,112 – £826).
It is important to note that the minimum savings highlighted are just that:
n first, they are based on LHA figures derived from the benchmarking results. Savings could potentially be a lot higher, given that the HB subsidy ceiling (outside London) for an average LHA of £139 is £185 (£139 x 90% + £60). In London, the savings would also be higher – reflecting LHA rates within the capital
n second, they do not take into account savings arising from households being accommodated in interim accommodation while their homelessness applications are assessed (which the benchmarking results indicate typically takes authorities 23.5 working days to complete)
n third, they do not include savings arising from households being accommodated in emergency accommodation, such as B&B (the LHA rates used above are based on local LHA rates).
Additional savings will also be achieved in relation to services that sit outside of housing options/homelessness prevention and assessment.
For example, if prevention work successfully enables a local authority/RSL tenant to stay put, the cost of an eviction and the resulting void will be saved.
As the CLG also highlights in its advice note ‘Demonstrating the cost effectiveness of preventing homelessness’, enabling households to remain in their existing accommodation is cheaper than securing alternative accommodation, and it brings wider socio-economic benefits by avoiding substantial social disruption and re-settlement costs.
The illustration below shows the minimum amounts that could be saved per household prevented from becoming homeless compared to a ‘full duty’ acceptance.11
‘This has really helped confirm that we offer much better value for money than previously thought... The level of detail provided a clear picture of where and how to improve further.’Richard Nochar, Service Manager Housing Solutions, Bristol City Council
In terms of a ‘full duty’ acceptance, authorities are required to shoulder a greater burden of costs. The overall unit cost of a ‘full duty’ acceptance is high compared to prevention:
1. Cost of a successful prevention: £642 (£826 including overheads)12
2. Cost of an acceptance: — cost of making a decision on a homelessness application £375 (£558 including overheads)
— cost of the work attributable to concluding duty £230 (£339 including overheads)
— cost of temporary accommodation – calculated as the average difference between the cost of providing temporary
£826£1,215
£339
£558
Prevention unit cost
£826
Acceptance unit cost
£2,112
Saving £1,286
Potential savings are higher if an authority is required to meet the full duty for a household that is not in receipt of LHA. In such situations, the saving could be as high as £7,680 per prevention.
11. Where the household’s application for assistance is assessed under Part VII, they are accommodated in temporary accommodation provided by the authority and work is subsequently undertaken to conclude duty.
12. Overheads have been included as 50% of staff costs (based on the results of previous benchmarking work completed by Acclaim) to give a full cost comparison.
4. Value for money: prevention v acceptanceThere is scope to achieve cost savings and deliver better outcomes for clients by prioritising spending on prevention advice and assistance

Research: summary Benchmarking local authority homelessness and housing options/advice services24
support homeless prevention work without resorting to incentives for landlords, typically generates a cash saving of £294 per new tenancy secured.
One authority secured almost 200 properties in this way to support its prevention work – potentially generating a cash saving of more than £50,000 as a result.
Authorities can also seek to reduce costs by sharing with partner agencies. Sanctuary scheme provision is a good example, with some authorities that took part in the review service bearing the full cost and others sharing cost with partner agencies, such as local RSLs and the police.
More consistency in delivery and good practice can be achieved by authorities working more closely within sub-regional groups. This can also lead to ef-ficiencies in the use of quality standards frameworks and joint commissioning of adviser training.
Opportunities for generating income The outputs from the review service highlighted a number of income generation opportunities to improve the overall efficiency, value for money and effectiveness of authorities’ services.
Particular examples included:
n operating a social lettings agency scheme. One authority generated a £50,000 annual surplus from such a scheme
n charging private sector landlords to advertise rented accommodation on an authority’s CBL system. At least one authority that took part in the initial tranche of the review service was in the process of taking steps to introduce such charges
Other rent deposit/damage guarantee scheme opportunitiesAside from moving to focus on rent deposit/damage guarantee schemes backed by cashless bonds/damage guarantees, the outputs from the review service highlighted a number of opportunities for increasing the cost efficiency and effectiveness of
The outputs from the review service highlighted a number of areas in which authorities could improve service efficiency, value for money and effectiveness – to deliver better quality services without increasing costs, or the same quality services for less.
The key efficiency ideas and opportunities identified that have the potential to deliver quality improvements to services and cash savings are summarised below:
Rent deposit/damage guarantee schemes backed by a cashless bondAuthorities could realise significant cash savings by focusing on rent deposit/damage guarantee schemes which use cashless bonds/damage guarantees.
These are more cost-effective because authorities can make a bad debt provision in their accounts equal to a proportion of potential liability (usually around a third) – rather than having to make a payment in every case (as is the case for authorities operating a finder’s fee or rent deposit scheme where there is limited/no expectation that monies paid out will be returned/paid back).
Two authorities participating in the initial tranche of the review service could realise cash savings of £375 –£450 per new tenancy secured via rent deposit/damage guarantee schemes by moving away from schemes focusing on rent in advance/cash bonds to schemes backed by cashless bonds.
This could equate to cash savings of more than £100,000 for each authority – a significant proportion of total operating costs.
Partnership workingEffective joint and partnership working with other local authorities and organisations has the potential to generate significant quality improvements, service efficiencies and cash savings.
The benchmarking results indicate that effective joint working with private sector landlords to obtain good quality and affordable rented accommodation, to
5. Value for money: efficiency ideasThere is scope for authorities to improve service efficiency, value for money and effectiveness to deliver better quality services without increasing costs, or the same quality services for less.

Research: summary Benchmarking local authority homelessness and housing options/advice services25
rent deposit/damage guarantee schemes. These include:
n advertising rent deposit/damage guarantee scheme properties on CBL systems, to enable applicant households to ‘find their own’ property. In one authority, a third of all households securing properties in the private sector via its rent deposit/damage guarantee scheme found their property using the authority’s CBL system
n to improve sustainability, identifying and investigating common drivers/reasons for tenancies secured via an authority’s rent deposit/damage guarantee scheme failing part way through the minimum term or not being renewed at the end
n considering the inclusion of additional services (on a charged for/gratis basis) – as part of the rent deposit/damage guarantee scheme ‘package’. For example:
— energy performance certificates
— white goods/rent arrears insurance
— local landlord accreditation scheme fees
n making sure that the financial risks of rent deposit/damage guarantee schemes are closely managed. For example, by:
— ensuring that sufficient provision is made in accounts to cover potential claims against guarantees
— limiting the duration of guarantees
— including a ‘dilapidations clause’ in guarantees to reduce the financial risk over time
— linking the maximum value of guarantees to property size, rather than one month’s rent to make the values easier to control
— requiring landlords accepted on to such schemes to be accredited
— pre/post inspecting properties, using inventories and checking in/out services
— using clear property standards to underpin rent deposit/damage guarantee schemes
— advertising HB ‘fast-track’ or guaranteed processing times to encourage landlords’ participation
— requiring landlords to notify the authority if a deposit/bond scheme tenancy is likely to be at risk.
Targeting time and resources effectivelyTargeting time and resources effectively across options/prevention and homelessness services can increase the beneficial impact of authorities’ investment.
Housing options/homelessness preventionThe outputs from the review service enabled authorities to compare the following against one another:

Research: summary Benchmarking local authority homelessness and housing options/advice services26
n the ratio of successful preventions to unsuccessful preventions
n the balance of prevention and non-prevention (‘advice only’) activity
Typically (as a median) an authority achieved just over seven successful preventions for every unsuccessful prevention. Authorities could use this as a ‘can opener’ to determine whether they need to examine the level of unsuccessful preventions (and their drivers) further.
Authorities also variously undertook between a third (lowest value quartile) and 0.8 (highest value quartile) of a ‘housing advice only’ case per successful or unsuccessful prevention. Authorities could use this to help them review the balance of resources across their prevention and options/advice services.
Households departing temporary accommodation/for whom a main homelessness duty was endedThe benchmarking results indicated that the median proportion of households that left temporary accommodation/for whom a main homelessness duty was ended without being rehoused13 was almost 19% (with an inter-quartile range of just below 19% to 27%).
This highlights the potential that understanding the drivers and reasons behind such departures could have for authorities on reducing unnecessary use of resources (to complete homelessness assessments, in the provision of temporary accommodation and the conclusion of duty).
Temporary accommodation reduction strategiesUnderstanding the key drivers and reasons behind significant mismatches in the following could help
authorities in targeting resources to reduce the use of temporary accommodation:
n the profile of the number of months since acceptance of households leaving temporary accommodation during the year and those remaining therein at the end of the year
n the profile of the accommodation size requirements of households leaving temporary accommodation during the year and those remaining therein at the end of the year.
Other efficiency ideas and opportunitiesOther efficiency ideas and opportunities identified as a result of the review service that have the potential to deliver quality improvements to services and cash savings include:
n more effective triage of initial contacts and monitoring and analysing information about repeat callers – to understand the key drivers and reasons behind these
n reducing the number of appointments by operating a ‘fast-track’ drop off service for documents/other information
n introducing more robust case management systems that focus on preventing homelessness whenever possible, with processes that support timely, prompt action and effective working towards targeted outcomes.
n ensuring that organisations providing services under contract/via grant funding are effectively monitored and the overall quality/value for money obtained regularly evaluated
n introducing an ‘efficiency bank’ (good VFM ideas) and an officer suggestion scheme, to make sure that innovative new ideas identified by officers are systematically captured, evaluated and introduced.
13. i.e. because they ceased to be eligible, became intentionally homeless from this or departed voluntarily.
Shelter 88 Old Street London EC1V 9HU
0300 330 1234 shelter.org.uk
Registered charity in England and Wales (263710) and in Scotland (SC002327)
Until there’s a home for everyoneWe are one of the richest countries in the world, and yet millions of people in Britain wake up every day in housing that is run-down, overcrowded, or dangerous. Many others have lost their home altogether. Bad housing robs us of security, health, and a fair chance in life.
Shelter helps more than 170,000 people a year fight for their rights, get back on their feet, and find and keep a home. We also tackle the root causes of bad housing by campaigning for new laws, policies, and solutions.
Our website gets more than 100,000 visits a month; visit shelter.org.uk to join our campaign, find housing advice, or make a donation.
We need your help to continue our work. Please support us.
RH
3441. To protect the identity of our clients, models have been used in all photography. P
hotography by André Lichtenberg, S
imon R
awles, N
ick David.