Full Presentation Slides - California Air Resources Board · • Marine Exchange - yearly cost for...
26
1 California Environmental Protection Agency Air Resources Board Public Workshop Vessel Speed Reduction for Ocean-Going Vessels Sacramento September 9, 2008 Overview • Background • Proposed Approaches • Impacts - Emissions - Environmental - Economic • Potential Issues • Next Steps 2
Transcript of Full Presentation Slides - California Air Resources Board · • Marine Exchange - yearly cost for...
1
California Environmental Protection AgencyAir Resources Board
Public WorkshopVessel Speed Reductionfor Ocean-Going Vessels
SacramentoSeptember 9, 2008
Overview• Background
• Proposed Approaches
• Impacts- Emissions- Environmental- Economic
• Potential Issues
• Next Steps
2

2
Background
3
Evaluation Update
• VSR Technical Assessment Report
– Evaluate Emissions Impacts
– Estimate Potential Exposures
– Estimate Health Risk
– Evaluate Economic Impacts
4
Background
3
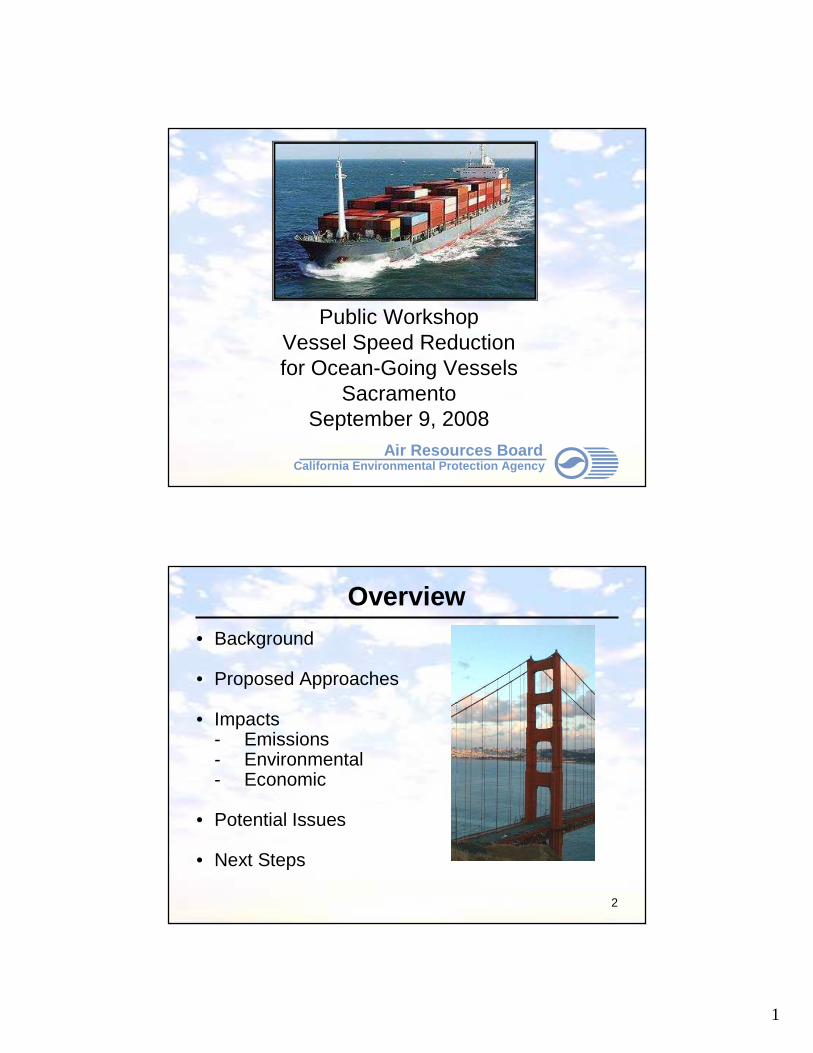
Air Pollution is a SeriousPublic Health Concern
• Numerous studies have confirmed a link between air pollution and adverse health impacts– premature death– respiratory disease– reduced lung function in
children– cardiovascular disease– cancer
5
Background
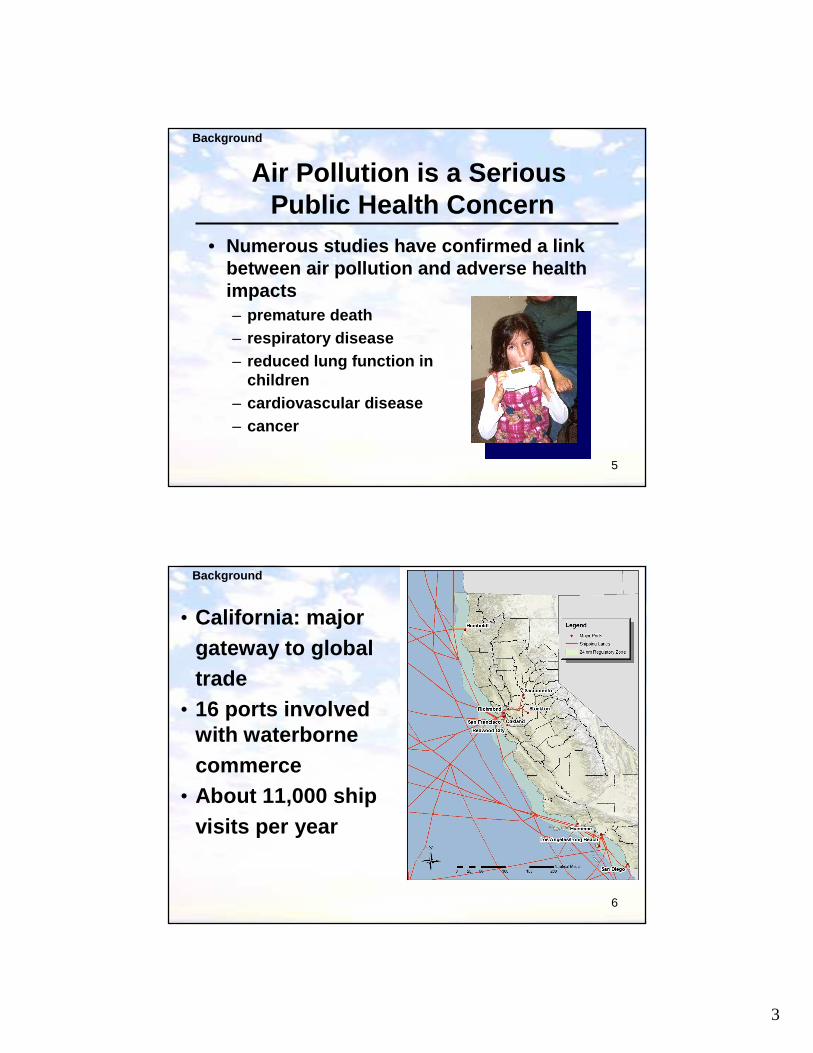
• California: majorgateway to globaltrade
• 16 ports involved with waterbornecommerce
• About 11,000 shipvisits per year
6
Background
4
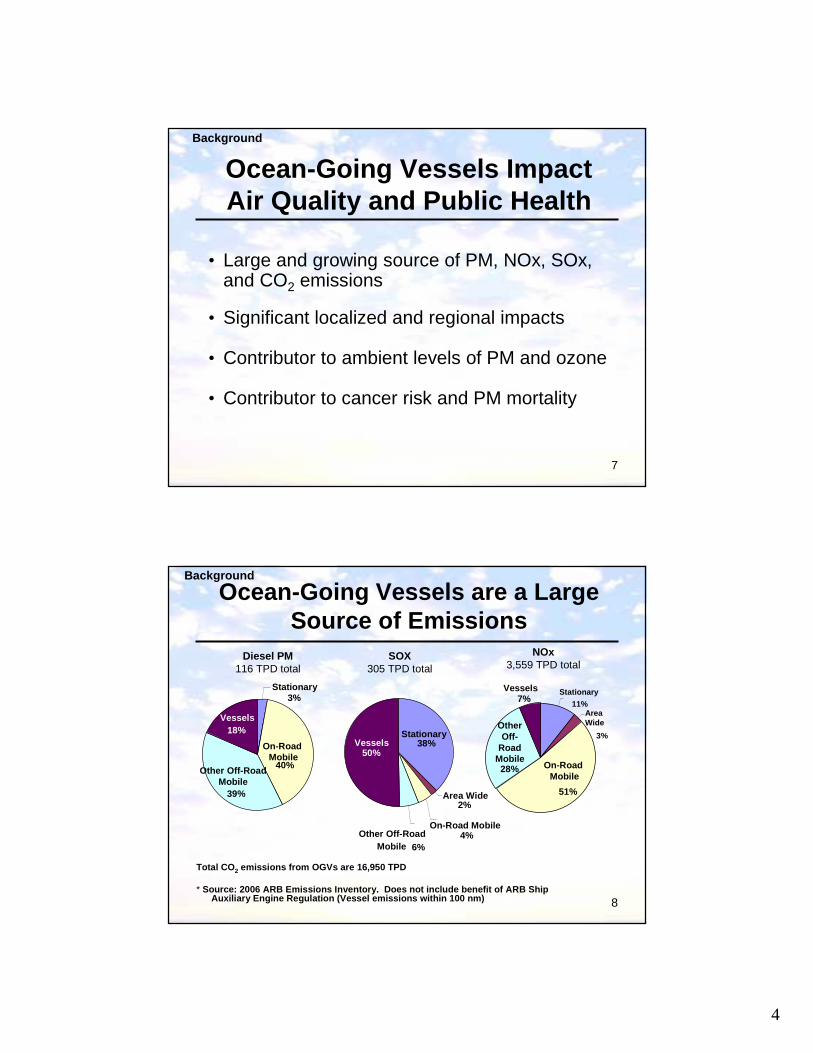
Ocean-Going Vessels ImpactAir Quality and Public Health
• Large and growing source of PM, NOx, SOx, and CO2 emissions
• Significant localized and regional impacts
• Contributor to ambient levels of PM and ozone
• Contributor to cancer risk and PM mortality
7
Background
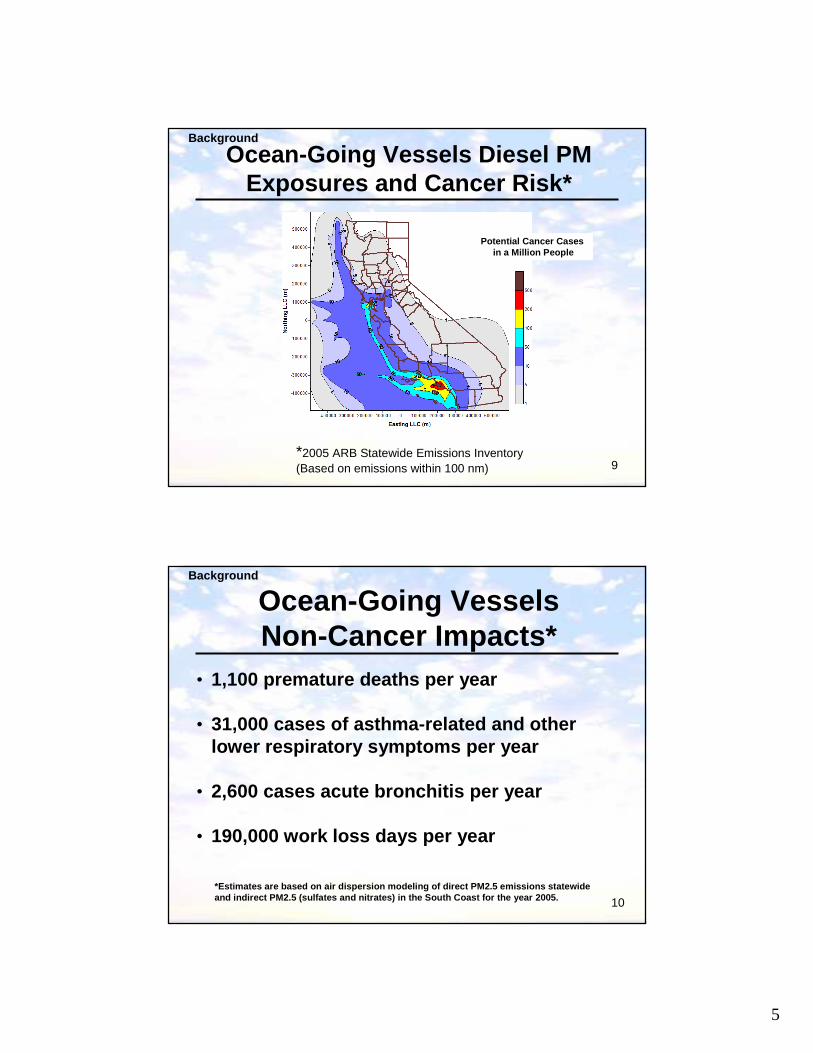
Ocean-Going Vessels are a LargeSource of Emissions
Total CO 2 emissions from OGVs are 16,950 TPD
* Source: 2006 ARB Emissions Inventory. Does not inc lude benefit of ARB Ship Auxiliary Engine Regulation (Vessel emissions withi n 100 nm) 8
Stationary3%
On-Road Mobile
40%Other Off-Road Mobile
39%
Vessels18%
Stationary
11%AreaWide
3%
On-Road Mobile
51%
Other Off-
Road Mobile28%
Vessels7%
Stationary38%
Area Wide2%
On-Road Mobile4%Other Off-Road
Mobile 6%
Vessels50%
SOX305 TPD total
Diesel PM116 TPD total
NOx3,559 TPD total
Background
5
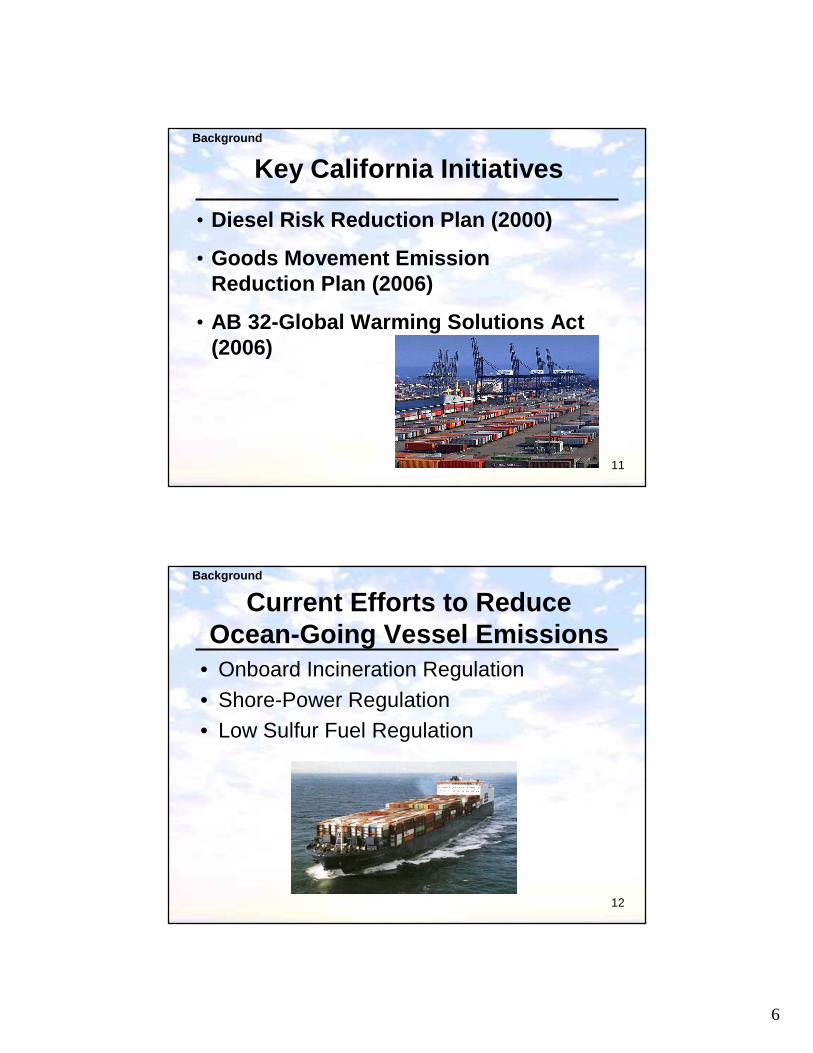
Ocean-Going Vessels Diesel PMExposures and Cancer Risk*
9
Potential Cancer Casesin a Million People
*2005 ARB Statewide Emissions Inventory(Based on emissions within 100 nm)
Background
Ocean-Going VesselsNon-Cancer Impacts*
• 1,100 premature deaths per year
• 31,000 cases of asthma-related and other lower respiratory symptoms per year
• 2,600 cases acute bronchitis per year
• 190,000 work loss days per year
10*Estimates are based on air dispersion modeling of direct PM2.5 emissions statewide and indirect PM2.5 (sulfates and nitrates) in the S outh Coast for the year 2005.
Background
6
Key California Initiatives
• Diesel Risk Reduction Plan (2000)
• Goods Movement EmissionReduction Plan (2006)
• AB 32-Global Warming Solutions Act (2006)
11
Background
Current Efforts to ReduceOcean-Going Vessel Emissions
• Onboard Incineration Regulation• Shore-Power Regulation• Low Sulfur Fuel Regulation
12
Background
7
Benefits of a VSR Measure
• Provide Reductions in Toxic Air Contaminants– Diesel PM
• Provide Reductions in Criteria Pollutants– NOx– SOx
• Provide Reductions in Greenhouse Gases– CO2
13
Background
Proposed Approaches
14
8
Proposed Approaches
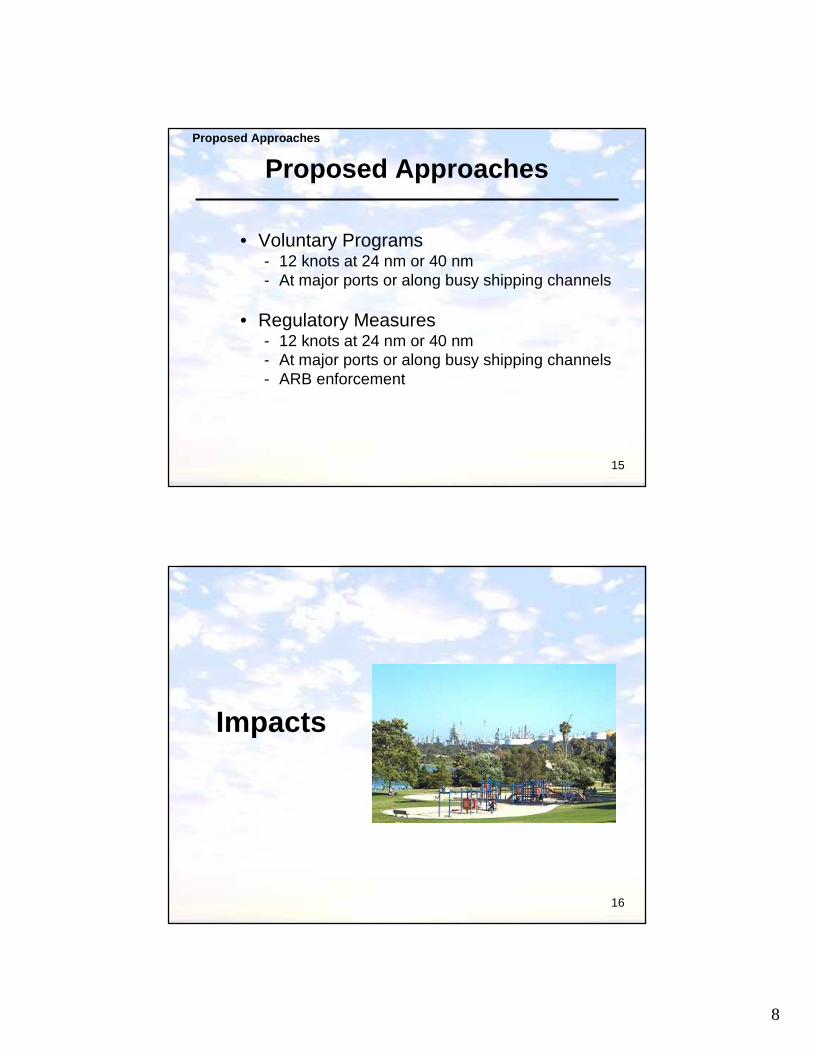
• Voluntary Programs- 12 knots at 24 nm or 40 nm- At major ports or along busy shipping channels
• Regulatory Measures- 12 knots at 24 nm or 40 nm- At major ports or along busy shipping channels- ARB enforcement
15
Proposed Approaches
Impacts
16
9
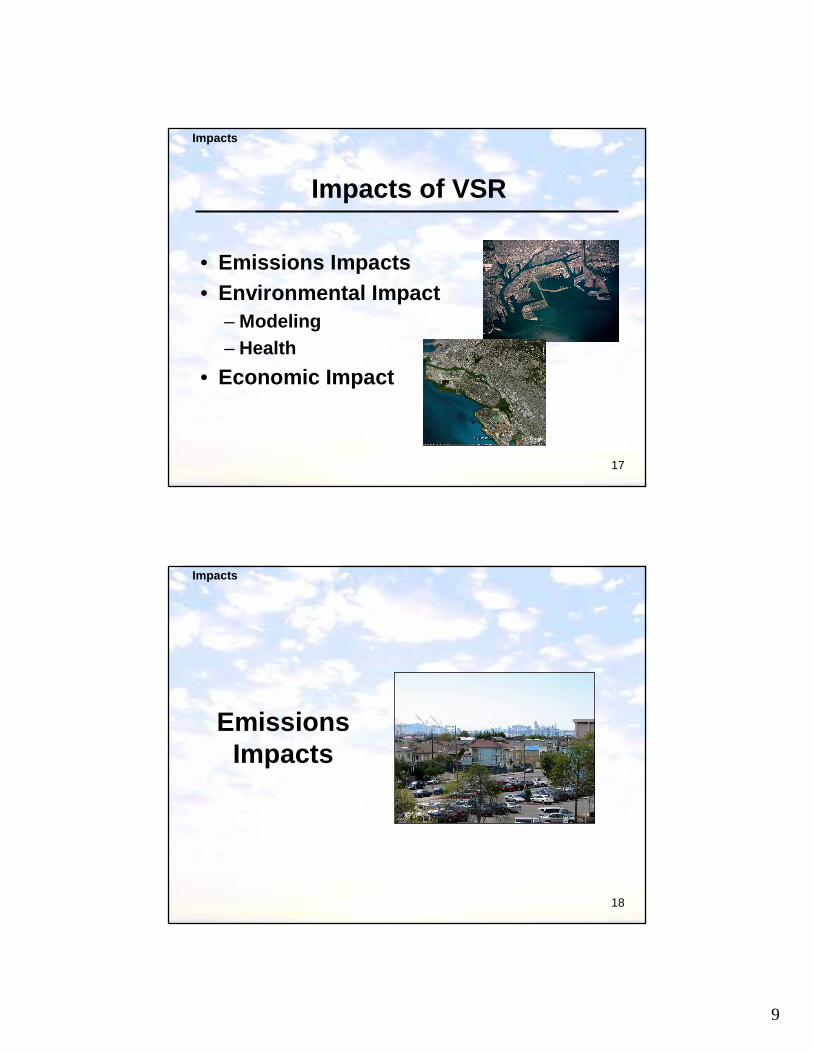
Impacts of VSR
• Emissions Impacts• Environmental Impact
– Modeling– Health
• Economic Impact
17
Impacts
Emissions Impacts
18
Impacts

10
Impacts
14
Emissions within the 24 nm Zones
19
Emissions Impacts
Emissions EstimatesTotal Emissions for Five Major Ports with and witho ut VSR in the
24 nm Zone for 2008 (tons/day)*
1425782995CO2
163744SOx
214152NOx
2045Diesel PM
% Emission Reduction
With VSRWithout VSRPollutants
*Assume all vessels reduce speed to 12 knots within 24 nm zone. Numbers are rounded
20
Emissions Impacts
11
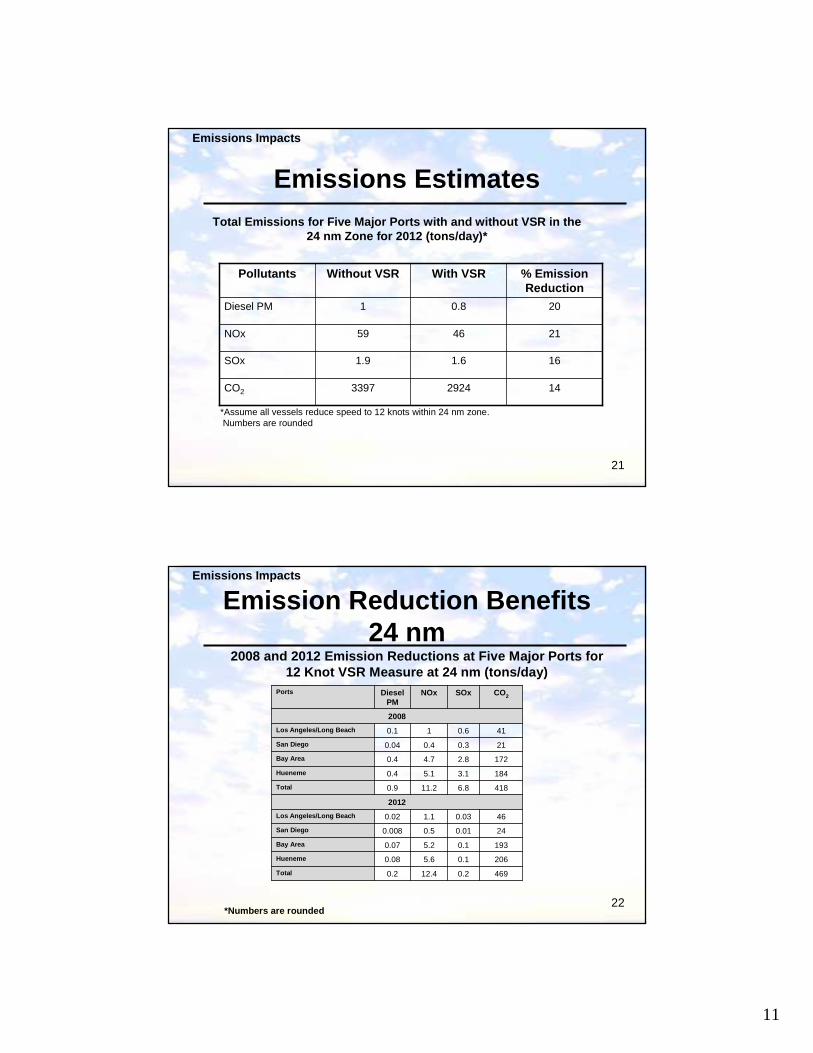
Emissions EstimatesTotal Emissions for Five Major Ports with and witho ut VSR in the
24 nm Zone for 2012 (tons/day)*
1429243397CO2
161.61.9SOx
214659NOx
200.81Diesel PM
% Emission Reduction
With VSRWithout VSRPollutants
*Assume all vessels reduce speed to 12 knots within 24 nm zone. Numbers are rounded
21
Emissions Impacts
Emission Reduction Benefits 24 nm
2008 and 2012 Emission Reductions at Five Major Por ts for 12 Knot VSR Measure at 24 nm (tons/day)
*Numbers are rounded22
Emissions Impacts
4690.212.40.2Total
2060.15.60.08Hueneme
1930.15.20.07Bay Area
240.010.50.008San Diego
460.031.10.02Los Angeles/Long Beach
2012
4186.811.20.9Total
1843.15.10.4Hueneme
1722.84.70.4Bay Area
210.30.40.04San Diego
410.610.1Los Angeles/Long Beach
2008
CO2SOxNOxDiesel PM
Ports
12
Impacts
14
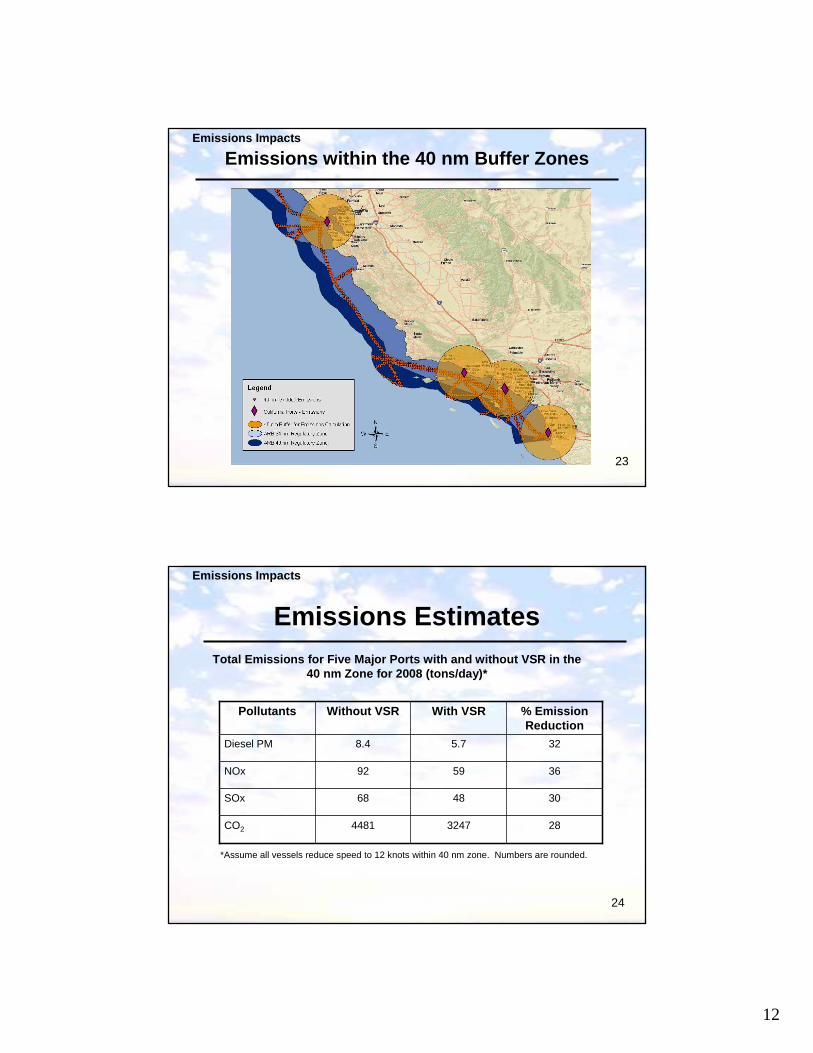
Emissions within the 40 nm Buffer Zones
23
Emissions Impacts
Emissions EstimatesTotal Emissions for Five Major Ports with and witho ut VSR in the
40 nm Zone for 2008 (tons/day)*
2832474481CO2
304868SOx
365992NOx
325.78.4Diesel PM
% Emission Reduction
With VSRWithout VSRPollutants
*Assume all vessels reduce speed to 12 knots within 40 nm zone. Numbers are rounded.
24
Emissions Impacts
13
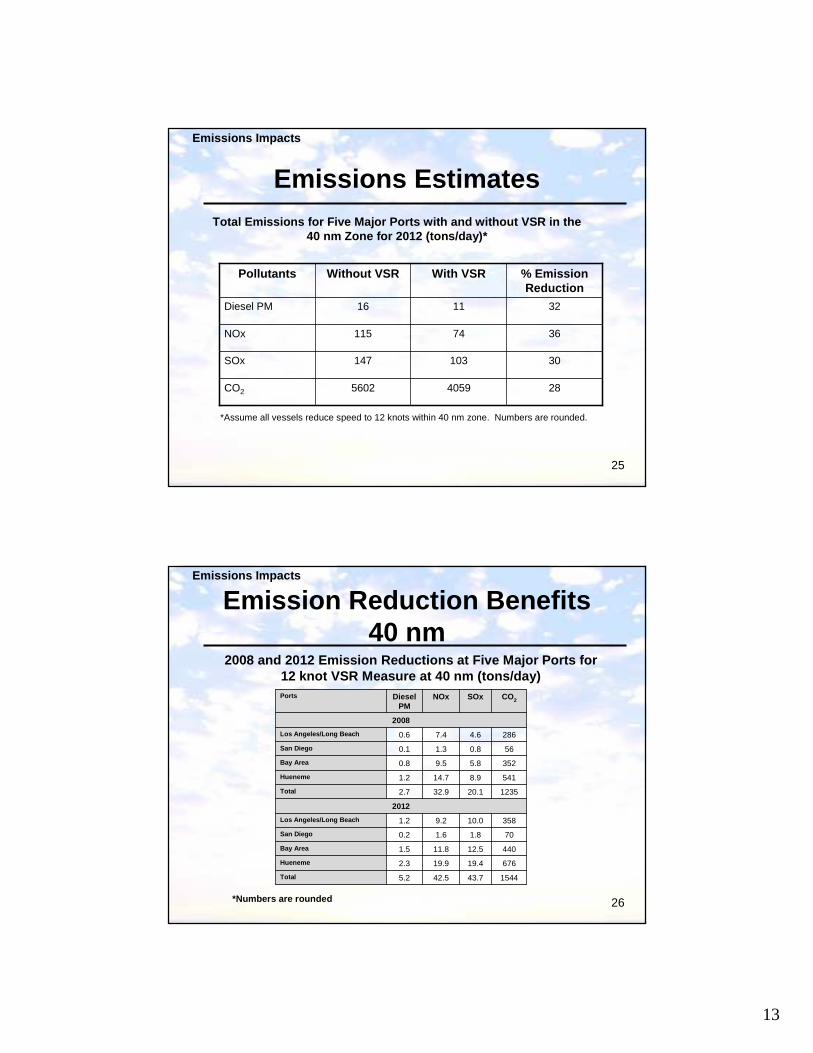
Emissions EstimatesTotal Emissions for Five Major Ports with and witho ut VSR in the
40 nm Zone for 2012 (tons/day)*
2840595602CO2
30103147SOx
3674115NOx
321116Diesel PM
% Emission Reduction
With VSRWithout VSRPollutants
*Assume all vessels reduce speed to 12 knots within 40 nm zone. Numbers are rounded.
25
Emissions Impacts
Emission Reduction Benefits 40 nm
2008 and 2012 Emission Reductions at Five Major Por ts for 12 knot VSR Measure at 40 nm (tons/day)
*Numbers are rounded 26
Emissions Impacts
154443.742.55.2Total
67619.419.92.3Hueneme
44012.511.81.5Bay Area
701.81.60.2San Diego
35810.09.21.2Los Angeles/Long Beach
2012
123520.132.92.7Total
5418.914.71.2Hueneme
3525.89.50.8Bay Area
560.81.30.1San Diego
2864.67.40.6Los Angeles/Long Beach
2008
CO2SOxNOxDiesel PM
Ports

14
Comparison of Emissions Benefits 24 nm and 40 nm
Emission Reduction benefits at 24 nm and 40 nm for 12 knot VSR measure for 2008 and 2012
*Numbers are rounded. Emissions are the sum of all 5 major ports. 27
Emissions Impacts
1544469CO2
43.70.2SOx
42.512.4NOx
5.20.2Diesel PM
2012
1235418CO2
20.16.8SOx
32.911.2NOx
2.70.9Diesel PM
2008
40 nm(tons/day)
24 nm (tons/day)
Pollutant
AB-32 Greenhouse Gases
• ARB required to develop and implement measures to reduce greenhouse gas (GHG) emissions
• VSR recognized as a GHG measure– Slowing vessel speeds reduces CO2 emissions
• For 2020, reductions of about 0.3 MMTCO2E (690 tpd) at 24 nm and 0.8 MMTCO2E (2260 tpd) at 40 nm– Assumes vessels do not speed up at other parts of
the voyage to make up for lost time in the VSR zone.
28
Emissions Impacts
15
Environmental Impacts
- Modeling- Health Impacts
29
Air Dispersion Modeling
30
• Air dispersion models are being used to estimate emissions impacts from OGVson regional and local (near-source) coastal communities
• Baseline modeling from OGV Fuel Regulatory Analysis for the South Coast Air Basin (SCAB)
Modeling

16
VSR Modeling Overview
31
Direct Diesel PM Emissions: - CALPUFF- Focus on Diesel PM- 2005 emissions within 24nm and 40 nm - Port Specific (BA, LA/LB, SD) and a Coastal
location near Santa Barbara
Direct and Secondary PM Emissions:- CMAQ- Applies to Diesel PM, PM, NOx, SOx- 2005 emissions within 24nm and 40nm- Photochemically impacted emissions in the SCAB
Projected Modeling Completion October 2008
Modeling
Impacts
14
Air Dispersion Modeling (24 nm)
32
Modeling
17
Impacts
14
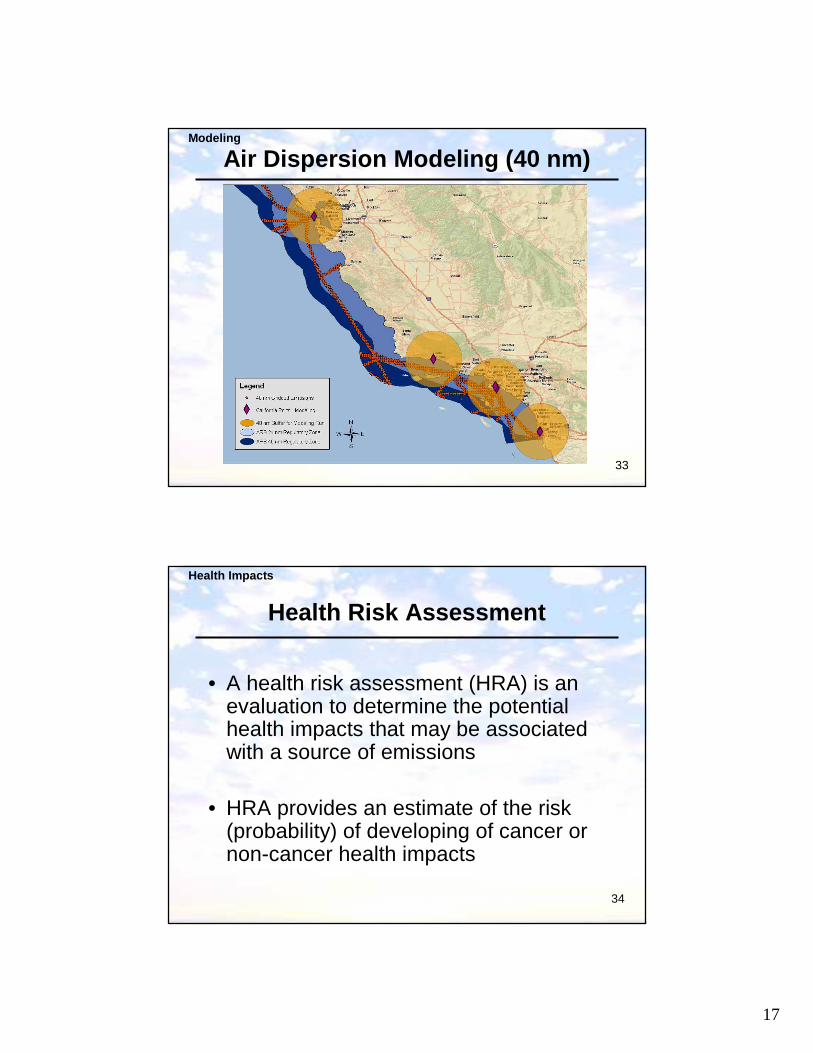
Air Dispersion Modeling (40 nm)
33
Modeling
Impacts
14
Health Risk Assessment
34
• A health risk assessment (HRA) is an evaluation to determine the potential health impacts that may be associated with a source of emissions
• HRA provides an estimate of the risk (probability) of developing of cancer or non-cancer health impacts
Health Impacts

18
Impacts
14
Proposed VSR Health Risk Assessment
35
• Include emissions of Diesel PM, NOx, and SOx
• Focus on busiest ports and one coastal location within 24 and 40nm of coastline
• Use 2005 OGV emissions inventory and the results from the various models and modeling scenarios previously discussed
• Present the regional and local health impacts of pollutants fromOGVs with and without VSR measures
• Potential cancer impacts from Diesel PM
• Potential non-cancer impacts from directly emitted and secondarily formed PM
Health Impacts
36
Health Impacts
Example Map of Potential Regional Cancer Risk*
Without Measures With Measures
*FOR ILLUSTRATION PURPOSES ONLY – NOT ACTUAL VSR DAT A
19
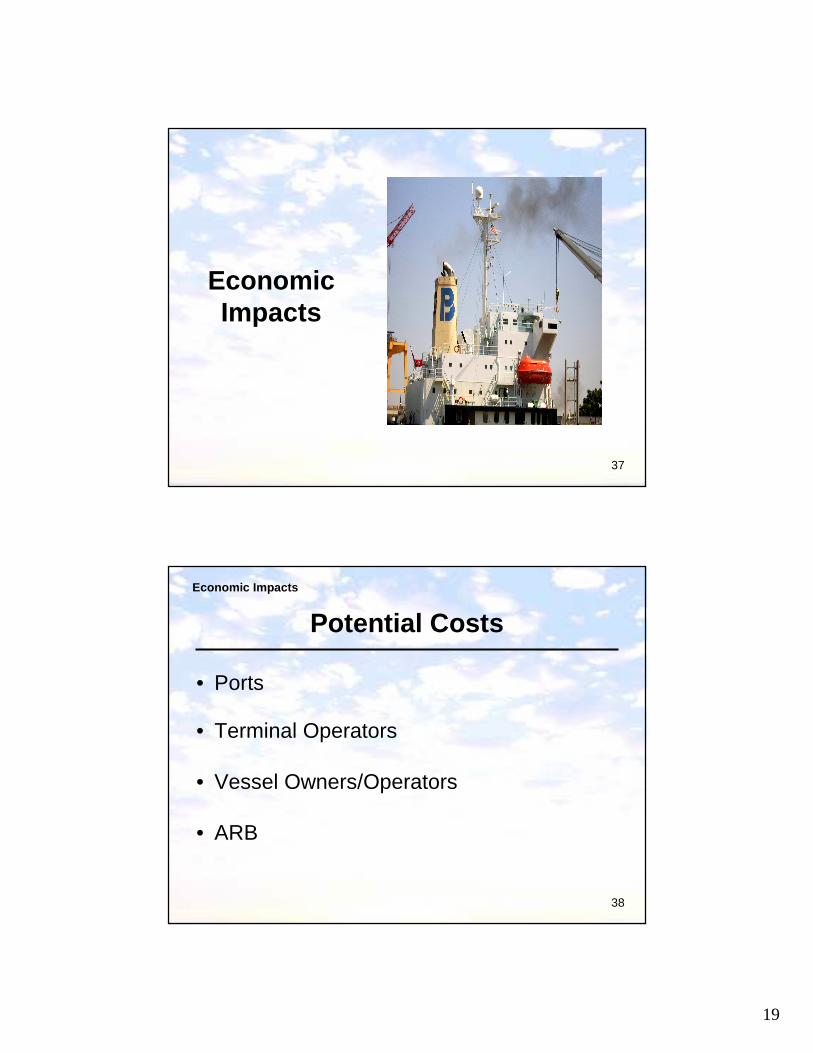
Economic Impacts
37
Potential Costs
• Ports
• Terminal Operators
• Vessel Owners/Operators
• ARB
38
Economic Impacts

20
Port Costs
• Administrative costs to implement a VSR program
- yearly cost ranges from $50,000 to $100,000- additional costs for computer software
• AIS receiver- cost $2,000 per receiver (1st year only)
• Outreach efforts- yearly cost ranges from $10,000 to $15,000
• Marine Exchange- yearly cost for monthly speed report is $7,200- yearly technical support cost ranges from $5,000 to
$15,000
39
Economic Impacts
Terminal Operator Costs
• Terminals may incur costs for vessel delays- $10,000 - $20,000/hour depending on ship size- additional overtime costs of $30,000/hour on
weekends and holidays- If vessels make up time during other segments
of voyage, then no additional cost.
40
Economic Impacts

21
Vessel Owner/Operator Costs
41
Economic Impacts
Mercator Transport Group Report (Feb. 22, 2005)
based on 5,000 TEU containership
$1,500
from a vessel operator
based on estimated labor costs and port calls
$5,000
from No-Net Increase Report
Include maintenance and labor costs
$3,000
(Marine News No. 2 -2000) WartsilaSwitzerland Ltd.
based on 10,000 TEU containership for Twin-Screw Propulsion for super container
$145
ReferenceNotesApprox. Cost Due to 1 hour
Delay
Example of Fuel Cost and Savings for One Vessel at 24 nm
1. Based on average container ship coming from north into LA/LB. Assumes VSR zone goes from 6-24 miles from shore. Precautionary zone is at 6 nm and speeds slow to 11 knots. All values are for inbound only
2. Assumes fuel is 0.1% distillate- avg. price of $886/metric tonne3. Time spent and fuel used excludes the precautionary zone
42
$3,600$2,040728 gallons(2.3 metric tones)
2 hours12 knotsWith VSR
N/A$5,6701977 gallons(6.4 metric tones)
1 hour22 knotsWithout VSR
Fuel Savings (dollar)
Fuel Cost (dollar)
Fuel Used in VSR Zone (inbound only)
Approximate time spent in the VSR zone (inbound only)
Speed traveled in the VSR zone
Economic Impacts
22
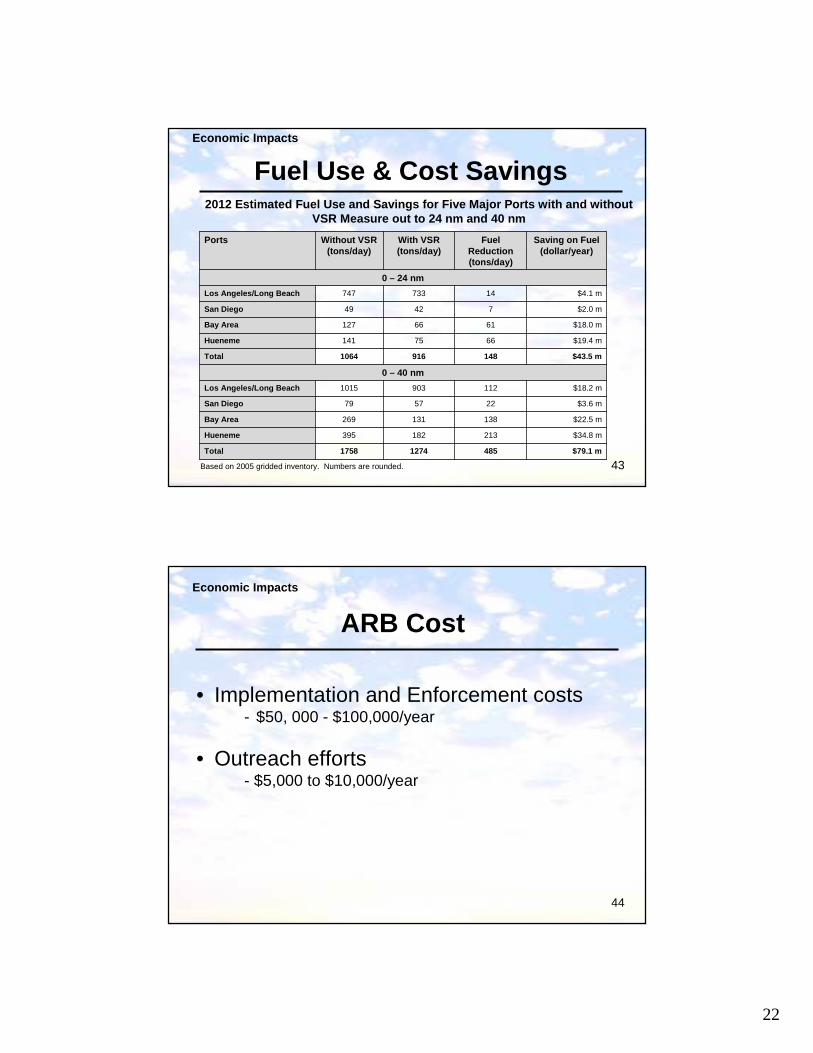
Fuel Use & Cost Savings2012 Estimated Fuel Use and Savings for Five Major Ports with and without
VSR Measure out to 24 nm and 40 nm
43
Economic Impacts
Based on 2005 gridded inventory. Numbers are rounded.
$79.1 m48512741758Total
$34.8 m213182395Hueneme
$22.5 m138131269Bay Area
$3.6 m225779San Diego
$18.2 m1129031015Los Angeles/Long Beach
0 – 40 nm
$43.5 m1489161064Total
$19.4 m6675141Hueneme
$18.0 m6166127Bay Area
$2.0 m74249San Diego
$4.1 m14733747Los Angeles/Long Beach
0 – 24 nm
Saving on Fuel (dollar/year)
Fuel Reduction (tons/day)
With VSR (tons/day)
Without VSR (tons/day)
Ports
ARB Cost
• Implementation and Enforcement costs - $50, 000 - $100,000/year
• Outreach efforts- $5,000 to $10,000/year
44
Economic Impacts
23
Summary of Cost Data Needs
• Costs to ports
• Costs to vessel operators/owners, and terminal operators for delay
• How VSR costs impact the overall costs of goods movement? - What costs will be passed on to the consumer?
45
Economic Impacts
Potential Issues
46
24
Potential Issues
• U.S. Navy concerned that ships will travel through missile test range near Santa Barbara Channel with a VSR measure
• Environmentalists concerned that ships may speed up in Santa Barbara Channel
- Concerns over ship strikes to blue whales
47
Potential Issues
Potential Issues
• Overall increase in emissions (outside VSR zone) if ships speed up during other segments of voyage– Preliminary results show that increasing
speeds by ½ knot or more could increase overall emissions
– Additional analysis– Looking at global impacts to CO2 if ships
speed up48
Potential Issues
25
Next Steps
49
Next Steps
• Work with stakeholders to address data gaps
• Survey (late September)
• Release Draft Technical Assessment Report for comment (Fall 2008)
• Next workshop (December 2008)
50
Next Steps
26
Contact Information
Michelle Komlenic(Lead)
(916) [email protected]
http://www.arb.ca.gov/ports/marinevess/vsr/vsr.htm
51
Robert Krieger(Manager)(916) [email protected]
Dan Donohoue(Branch Chief)(916) [email protected]