FULL NITROGEN RECOVERY AND POTABLE WATER · PDF fileFULL NITROGEN RECOVERY AND POTABLE WATER...
15
1 FULL NITROGEN RECOVERY AND POTABLE WATER PRODUCTION FROM HUMAN URINE BY MEMBRANE DISTILLATION Sebastiaan Derese 1 , Arne R.D. Verliefde 2 . 1 Ghent University, Ghent, Belgium, [email protected], Coupure Links 653, 9000 Ghent, +32 9 264 99 10 2 Ghent University, Ghent, Belgium Abstract Human urine offers some interesting possibilities for ammonia and potable water recovery. Membrane distillation holds possible advantages over existing urine treatment technologies, specifically regarding ammonia recovery. It was shown that up to 95 m% of all ammonia present in hydrolyzed urine could be recovered by increasing the urine pH to 10.5 or higher within a period of 2 hours, with a maximal separation factor of up to 16. The possibility of potable water production was investigated in human urine by assessing the permeate water quality, maximum recovery and mid-term process stability. It was shown that at least 75% of the available water could be recovered from non-hydrolyzed human urine without process failure. As such, membrane distillation is a viable alternative for existing urine treatment. Introduction The invention of the Haber-Bosch process in the middle of the 20 th century has had an enormous impact on human society, ranging from increased yields in agriculture and population growth to eutrophication and increased CO2 emissions. In 2008, nitrogen fixation through the Haber-Bosch process was responsible for up to 1-2% of the worldwide energy consumption while producing up to 130 million tonnes of ammonia fertilizer (Canfield et al., 2010). Even though the environmental issues and disadvantages of investing enormous amounts of energy in nitrogen fixation are hard to ignore, the incentive for nitrogen recycling is not driven by depletion, as nitrogen gas is naturally abundant in the air. In fact, the combination of Haber-Bosch and ‘recycling’ nitrogen by oxidizing it in wastewater treatment plants (WWTP) brings the total energy tag up to 90 MJ kg -1 N, as such that nitrogen recovery through e.g. struvite (102 MJ kg -1 N) or stripping (90 MJ kg -1 N) cannot compete (Maurer et al., 2003). The road to increasing energy efficiency for the anthropogenic part of the nitrogen cycle therefore leads to a challenge: either the activation energy for the Haber-Bosch process is decreased (Kitani et al., 2012), or either the road leads to innovative nitrogen recycling treatment, using less resources, less exergy and less treatment steps.
Transcript of FULL NITROGEN RECOVERY AND POTABLE WATER · PDF fileFULL NITROGEN RECOVERY AND POTABLE WATER...

1
FULL NITROGEN RECOVERY AND POTABLE WATER PRODUCTION
FROM HUMAN URINE BY MEMBRANE DISTILLATION
Sebastiaan Derese1, Arne R.D. Verliefde2.
1Ghent University, Ghent, Belgium, [email protected], Coupure Links 653, 9000
Ghent, +32 9 264 99 10
2Ghent University, Ghent, Belgium
Abstract
Human urine offers some interesting possibilities for ammonia and potable water recovery.
Membrane distillation holds possible advantages over existing urine treatment technologies,
specifically regarding ammonia recovery. It was shown that up to 95 m% of all ammonia present
in hydrolyzed urine could be recovered by increasing the urine pH to 10.5 or higher within a
period of 2 hours, with a maximal separation factor of up to 16. The possibility of potable water
production was investigated in human urine by assessing the permeate water quality, maximum
recovery and mid-term process stability. It was shown that at least 75% of the available water
could be recovered from non-hydrolyzed human urine without process failure. As such,
membrane distillation is a viable alternative for existing urine treatment.
Introduction
The invention of the Haber-Bosch process in the middle of the 20th century has had an enormous
impact on human society, ranging from increased yields in agriculture and population growth to
eutrophication and increased CO2 emissions. In 2008, nitrogen fixation through the Haber-Bosch
process was responsible for up to 1-2% of the worldwide energy consumption while producing
up to 130 million tonnes of ammonia fertilizer (Canfield et al., 2010). Even though the
environmental issues and disadvantages of investing enormous amounts of energy in nitrogen
fixation are hard to ignore, the incentive for nitrogen recycling is not driven by depletion, as
nitrogen gas is naturally abundant in the air. In fact, the combination of Haber-Bosch and
‘recycling’ nitrogen by oxidizing it in wastewater treatment plants (WWTP) brings the total
energy tag up to 90 MJ kg-1N, as such that nitrogen recovery through e.g. struvite (102 MJ kg-1
N)
or stripping (90 MJ kg-1N) cannot compete (Maurer et al., 2003).
The road to increasing energy efficiency for the anthropogenic part of the nitrogen cycle
therefore leads to a challenge: either the activation energy for the Haber-Bosch process is
decreased (Kitani et al., 2012), or either the road leads to innovative nitrogen recycling
treatment, using less resources, less exergy and less treatment steps.

2
Human urine is the major source of nitrogen in domestic wastewater. On its own, it adds more
than 80% of total nitrogen, 50 % of total phosphorus and 70% of total potassium in 1% of the
total volume. Diluting this urine (step 1) and treating it in WWTP’s (step 2) add complexity to
efficient nutrient recovery. The future of human nutrient recovery is source separation, as Larsen
and Gujer already stipulated in 1996. However, source-separated human urine cannot be used
directly as a fertilizer, due to the likely presence of pathogens (Heinonen-Tanski and van Wijk-
Sijbesma, 2005) and/or pharmaceuticals (Winker et al., 2008a, Winker et al., 2008b).
A thorough review of the treatment processes for source-separated human urine by Maurer et al.
in 2006 compared different techniques towards various criteria (hygienization, volume reduction,
stabilization, P-recovery, N-recovery, MP elimination, nutrient-MP-elimination, nutrient
elimination, solidification and need for pre- or post-treatment). To the best of our knowledge, no
single-step treatment is able to satisfy all these criteria. Many technologies focus on nutrient
recovery through struvite precipitation (Ronteltap et al., 2010, Antonini et al., 2011, Ganrot et
al., 2007, Etter et al., 2011), ion exchange (O’Neal and Boyer, 2013), adsorption (Lind et al.,
2000), distillation and nitrification (Udert and Wächter, 2012) and ammonia stripping (Antonini
et al., 2011, Bașakçılardan-Kabakcı et al., 2007). Although they may offer interesting
perspectives in developed countries, they also require electricity and/or expensive equipment,
preventing their use in cut-off rural communities of developing countries, which rely heavily on
agriculture (Bilsborrow, 1987) and are faced with increasing nutrient mining due to population
growth (Henao and Baanante, 2006).
Membrane distillation is one of the promising techniques to produce potable water from
impaired water sources in developing countries, as it only requires low-grade heat (e.g. solar
energy) to transfer volatile substances through a hydrophobic membrane by establishing a vapour
pressure gradient. As such, theoretically speaking, 100 % rejection of non-volatile substances
can be achieved. Specifically for urine, recovery of ammonia and water was already achieved
through membrane distillation, albeit at intermediate recovery – 40.6-75.1% for ammonia and
31.9-48.6% for water correspondingly (Zhao et al., 2013). Another study by El-Bourawi et al.
(2007) however showed that ammonia removal efficiencies of over 90% from ammonia-water
solutions are possible under specific operational conditions.
In this paper, we further investigate the options that membrane distillation and membrane
stripping have towards water and ammonia recovery, by varying major operational conditions
and testing membranes with various characteristics.
Background
The vapour pressure gradient across the membrane surface required for mass transfer in
membrane distillation can be established in various ways: direct membrane distillation (DCMD),
by separating a feed and permeate liquid stream with a membrane, air-gap membrane distillation
(AGMD), where the transferred vapour condenses in a separate chamber filled with air,
separated from the permeate liquid by a condensing wall, sweeping-gas membrane distillation

3
(SGMD), where the transferred vapour is transported to a condenser by a carrier gas, and
vacuum membrane distillation, where a vacuum pump provides the vapour pressure gradient
(Alkhudhiri et al., 2012). This study was conducted using direct-contact membrane distillation,
which is the simplest and most researched configuration, used for desalination processes (Hsu et
al., 2002), concentration of aqueous solutions in food industries (Calabro et al., 1994) and acid
manufacturing (Tomaszewska et al., 1995).
In direct-contact membrane distillation, the bulk vapour pressure gradient of compound i
between the feed and permeate is defined as:
∆𝑝𝑖 = 𝑝𝑖,𝑓 − 𝑝𝑖,𝑝
Where pi,f and pi,p are the feed and permeate vapour pressure of compound i respectively. The
vapour pressure of volatile compound i within a mixed solution can be calculated using:
𝑝𝑖 = 𝑝𝑖0 𝑥𝑖
In which pi0 is the vapour pressure above a pure solution of compound i at the temperature of
interest. This vapour pressure can be calculated by using the Antoine equation:
𝑝𝑖0 = exp (𝐴 −
𝐵
𝑇 + 𝐶)
In which T is the absolute temperature in K. For water, at temperatures between 274.15 and
373.15 K, the values for A, B and C are 23.1964, 3816.44 and −46.13, respectively.
For ammonia, the calculation is slightly more complex, as it is affected both by the ammonium-
ammonia equilibrium as well as the Henry’s law coefficient. The pKa of ammonium is 9.24 at
standard conditions, meaning that ammonia is only quantitatively present as a dissolved gas
above a pH of 7. Additionally, for ammonia to ‘strip’ from a watery solution, it has to overcome
very strong hydrogen bonds. The Henry coefficient of ammonia gas is 60 M/bar at standard
conditions. Vapour pressure of ammonia is therefore strongly correlated to solution temperature
and pH.
The flux of mass through the membrane is defined as:
𝐽𝑖 =𝑚𝑝,𝑖 − 𝑚𝑓,𝑖
𝐴 𝑡
Where mp,i and mf,i are the mass of substance i in the permeate and feed water specifically, A is
the membrane surface in the module and t is the time in h. To compare membrane performance
throughout an experiment with variable vapour pressures, membrane permeability (specific per
compound) is used:
𝐴𝑚,𝑖 =𝐽𝑖
∆𝑝𝑖
As various volatile substances may transport through the membrane, and selectivity towards a
specific substance is often desirable. To this goal, the separation factor is often introduced:

4
𝛼 = (1 −𝐶𝑝
𝐶𝑓) × 100
Materials and methods
Experiments
Urine was collected from healthy female and male candidates and mixed in a 20L disinfected
vessel. These vessels were either kept refrigerated at 4°C until experiments were started (non-
hydrolyzed urine) or were inoculated with stale urine from previous experiments and left at room
temperature to hydrolyze until the pH reached 9. The composition of the three batches used in
this study are shown in Table 1.
Table 1: Composition of fresh and hydrolyzed human urine batches.
Batch code HYDRO-01 HYDRO-02 FRESH-01
Volume (L) 5 12.2 4.2
pH (4 °C) 9.5 9.34 6.97
TOC (mg/L) 4660 4648 34346
IC (mg/L) 1680 1663 1538
Na (mg/L) 1558 1752 1802
K (mg/L) 1486 1638 1363
Ca (mg/L) 16 67 65
Mg (mg/L) 1 6 54
PO4-P (mg/L) 381 452 508
NH4-N (mg/L) 1335 1216 296
The experiments were conducted in a membrane distillation set-up with an active membrane
surface of 0.0056 m² (L: 0.25m, W: 0.05m, D: 0.005m). The initial pH of feed (urine) and
permeate (demineralized water) solutions was adjusted using 12 M NaOH or 96% H2SO4 to
minimize dilution. All reagents were analytical grade. The temperature was controlled within
±1°C using Pt100-electrodes. pH of the feed urine and conductivity and total mass of the
permeate were logged on a personal computer. Experiments were run for a period of 6 hours
(membrane stripping) or until temperature control due to volume reduction became erratic.
The membranes used in this study were flat-sheet PTFE membranes, of which average pore size,
thickness, water contact angle and flux are shown in Table 2.

5
Table 2: Characteristics of the membranes used in this study.
Membrane type S02 NS01 NS02
Average pore size (µm) 0.2 0.1 0.2
Membrane thickness
(µm) 1271 66 66
Contact angle (water)
(°) 130 134 142
Flux (L/m².h)2 13.85 16.46 38.70
5 mL samples of feed urine and permeate were taken at regular intervals and were kept frozen at
-18°C until preparation for analysis. Sodium, potassium, calcium and magnesium analysis was
performed on a tabletop Vista MPX ICP-OES (Agilent Technologies, USA). Ammonium
concentrations were determined using a continuous flow AA3-AutoAnalyzer (BranLuebbe,
Germany). Phosphorus was determined spectrophotometrically using the Scheel method. TC and
IC concentrations were analysed on a Shimadzu TOC-5000 analyzer.
Results
Ammonia recovery was calculated as:
𝑅𝑒𝑐𝑁𝐻3(%) =
𝑚𝑁𝐻3,𝑝𝑒𝑟𝑚,𝑒𝑞.
𝑚𝑁𝐻3,𝑓𝑒𝑒𝑑,0× 100
In which mNH3,perm,eq. and mNH3,feed,0 are the total masses of ammonia at equilibrium in the
permeate, and initially in the feed. Losses are not accounted for, except when comparing to the
ammonia removal, which is defined as:
𝑅𝑒𝑚𝑁𝐻3(%) =
𝑚𝑁𝐻3,𝑓𝑒𝑒𝑑,𝑒𝑞.
𝑚𝑁𝐻3,𝑓𝑒𝑒𝑑,0× 100
1 Membrane thickness includes the porous support layer. 2 Clean water flux was determined at a bulk vapour pressure difference of 9.8 kPa (Tfeed=40°C, Tpermeate=20°C) using
demineralized water. Due to temperature polarization effects, membrane permeability is not constant.
6
Results and discussion
Ammonia recovery
Effect of urine hydrolysis on ammonia recovery
From the urine analysis above, it can be hypothesized that ammonia recovery from human urine
should take place after full hydrolysis has taken place. Indeed, even when ammonia volatilization
to the surroundings occurs, ammonia levels are still up to 4 times higher in hydrolyzed urine.
However, membrane processes are sensitive to (bio)fouling, and as hydrolysis is performed by
ureolytic bacteria (Mobley and Hausinger, 1989) their presence may impact membrane
performance.
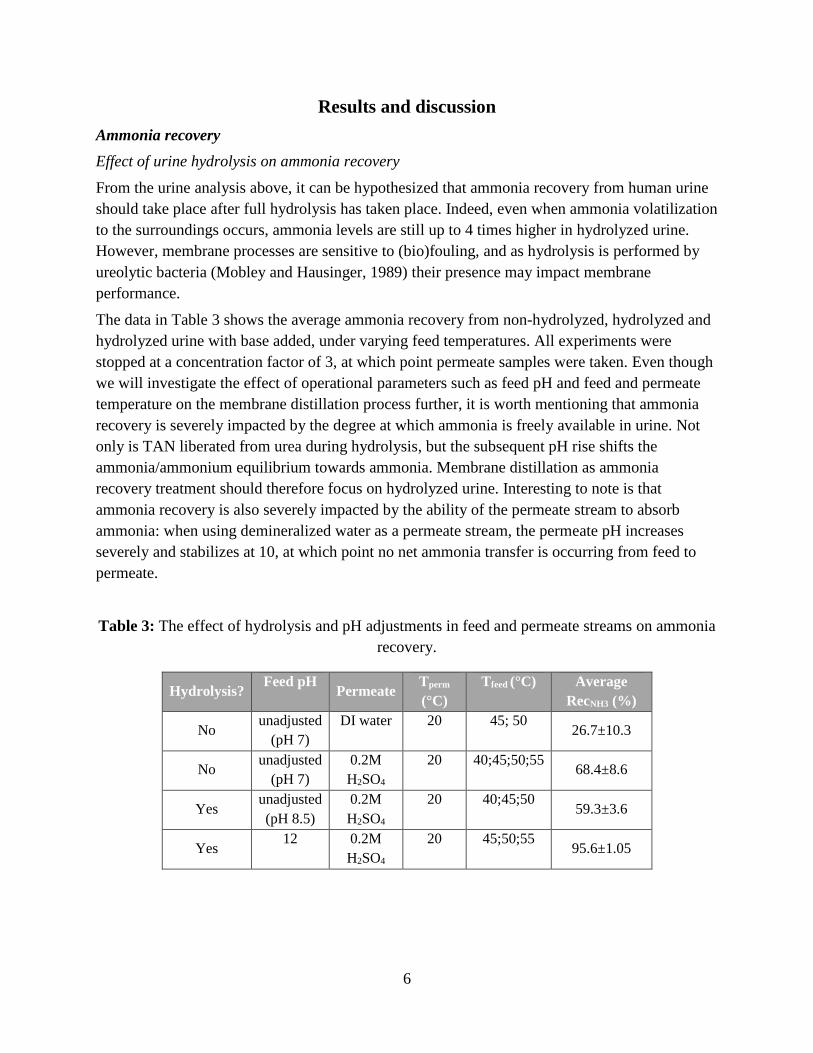
The data in Table 3 shows the average ammonia recovery from non-hydrolyzed, hydrolyzed and
hydrolyzed urine with base added, under varying feed temperatures. All experiments were
stopped at a concentration factor of 3, at which point permeate samples were taken. Even though
we will investigate the effect of operational parameters such as feed pH and feed and permeate
temperature on the membrane distillation process further, it is worth mentioning that ammonia
recovery is severely impacted by the degree at which ammonia is freely available in urine. Not
only is TAN liberated from urea during hydrolysis, but the subsequent pH rise shifts the
ammonia/ammonium equilibrium towards ammonia. Membrane distillation as ammonia
recovery treatment should therefore focus on hydrolyzed urine. Interesting to note is that
ammonia recovery is also severely impacted by the ability of the permeate stream to absorb
ammonia: when using demineralized water as a permeate stream, the permeate pH increases
severely and stabilizes at 10, at which point no net ammonia transfer is occurring from feed to
permeate.
Table 3: The effect of hydrolysis and pH adjustments in feed and permeate streams on ammonia
recovery.
Hydrolysis? Feed pH
Permeate Tperm
(°C)
Tfeed (°C) Average
RecNH3 (%)
No unadjusted
(pH 7)
DI water 20 45; 50 26.7±10.3
No unadjusted
(pH 7)
0.2M
H2SO4
20 40;45;50;55 68.4±8.6
Yes unadjusted
(pH 8.5)
0.2M
H2SO4
20 40;45;50 59.3±3.6
Yes 12 0.2M
H2SO4
20 45;50;55 95.6±1.05
7
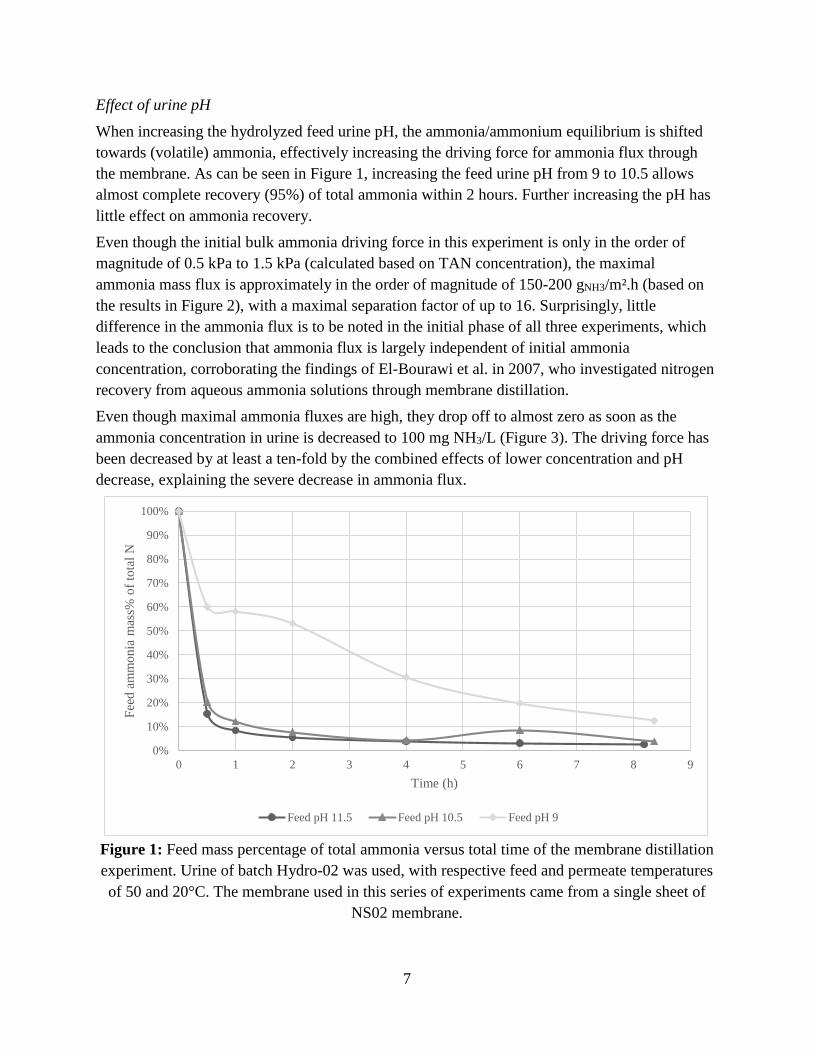
Effect of urine pH
When increasing the hydrolyzed feed urine pH, the ammonia/ammonium equilibrium is shifted
towards (volatile) ammonia, effectively increasing the driving force for ammonia flux through
the membrane. As can be seen in Figure 1, increasing the feed urine pH from 9 to 10.5 allows
almost complete recovery (95%) of total ammonia within 2 hours. Further increasing the pH has
little effect on ammonia recovery.
Even though the initial bulk ammonia driving force in this experiment is only in the order of
magnitude of 0.5 kPa to 1.5 kPa (calculated based on TAN concentration), the maximal
ammonia mass flux is approximately in the order of magnitude of 150-200 gNH3/m².h (based on
the results in Figure 2), with a maximal separation factor of up to 16. Surprisingly, little
difference in the ammonia flux is to be noted in the initial phase of all three experiments, which
leads to the conclusion that ammonia flux is largely independent of initial ammonia
concentration, corroborating the findings of El-Bourawi et al. in 2007, who investigated nitrogen
recovery from aqueous ammonia solutions through membrane distillation.
Even though maximal ammonia fluxes are high, they drop off to almost zero as soon as the
ammonia concentration in urine is decreased to 100 mg NH3/L (Figure 3). The driving force has
been decreased by at least a ten-fold by the combined effects of lower concentration and pH
decrease, explaining the severe decrease in ammonia flux.
Figure 1: Feed mass percentage of total ammonia versus total time of the membrane distillation
experiment. Urine of batch Hydro-02 was used, with respective feed and permeate temperatures
of 50 and 20°C. The membrane used in this series of experiments came from a single sheet of
NS02 membrane.
0%
10%
20%
30%
40%
50%
60%
70%
80%
90%
100%
0 1 2 3 4 5 6 7 8 9
Fee
d a
mm
onia
mas
s% o
f to
tal
N
Time (h)
Feed pH 11.5 Feed pH 10.5 Feed pH 9

8
Figure 2: Concentration of ammonia in the acidified permeate. Urine of batch Hydro-02 was
used, with respective feed and permeate temperatures of 50 and 20°C. The membrane used in
this series of experiments came from a single sheet of NS02 membrane.
Figure 3: Concentration of ammonia in the feed urine. Urine of batch Hydro-02 was used, with
respective feed and permeate temperatures of 50 and 20°C. The membrane used in this series of
experiments came from a single sheet of NS02 membrane.
0
200
400
600
800
1000
1200
1400
0 1 2 3 4 5 6 7 8 9Am
mo
nia
-N c
once
ntr
atio
n i
n p
erm
eate
(m
g/L
)
Time (h)
pH 10.5 pH 11.5 pH 9
0
500
1000
1500
2000
2500
0 1 2 3 4 5 6 7 8 9Am
mo
nia
-N c
once
ntr
atio
n i
n f
eed
uri
ne
(mg/L
)
Time (h)
pH 10.5 pH 11.5 pH 9

9
Effect of feed temperature
In a next set of experiments, the influence of feed temperature was investigated. As membrane
distillation is often operated below 60°C, we investigated a temperature range between 40 and 60
°C (Figure 4). Even though within this range the equilibrium driving force of ammonia doubles,
the effect on total ammonia recovery is rather small. Especially when the feed temperature is
increased from 50 to 60 °C, the gains are marginal.
However, when looking at Figure 5, the equilibrium ammonia concentration in the permeate of
the experiment run at a feed temperature of 40°C is higher. Even though efforts were made to
prevent ammonia losses, it seems that a higher vapour pressure and driving force also increases
the losses encountered. The prevention of losses through gas-tightening should be taken into
account when designing larger scale membrane distillation set-ups.
Figure 4: Feed mass percentage of total ammonia versus total time of the membrane distillation
experiment. Urine of batch Hydro-01 was used, with a feed pH of 10.5. The membrane used in
this series of experiments came from a single sheet of S02 membrane.
0%
10%
20%
30%
40%
50%
60%
70%
80%
90%
100%
0 1 2 3 4 5 6 7 8 9
Fee
d a
mm
onia
mas
s% o
f to
tal
N
Time (h)
Feed 60°C Feed pH 50°C Feed 40°C

10
Figure 5: Concentration of ammonia in the acidified permeate. Urine of batch Hydro-01 was
used, with a feed pH of 10.5. The membrane used in this series of experiments came from a
single sheet of S02 membrane.
Figure 6: Concentration of ammonia in the feed urine. Urine of batch Hydro-01 was used, with a
feed pH of 10.5. The membrane used in this series of experiments came from a single sheet of
S02 membrane.
0
200
400
600
800
1000
1200
1400
1600
0 1 2 3 4 5 6 7 8 9Am
mo
nia
-N c
once
ntr
atio
n i
n p
erm
eate
(m
g/L
)
Time (h)
60-20 50-20 40-20
0
200
400
600
800
1000
1200
0 1 2 3 4 5 6 7 8 9Am
mo
nia
-N c
once
ntr
atio
n i
n f
eed
uri
ne
(mg/L
)
Time (h)
60-20 50-20 40-20

11
Potable water recovery
Potable water recovery from urine is a much debated option. Whether undesirable from a purely
psychological or ideological point of view, or due to technical aspects, currently (vacuum)
distillation is one of the only single-step technologies that meets health and safety guidelines.
Membrane distillation, however in many aspects similar to distillation, could provide some
interesting advantages over regular distillation. However, safety and water quality standards
should be met, and the membrane distillation process should be robust against process failure
such as fouling or wetting. Here, we investigate the process stability and fouling resistance, the
maximum water recovery and presence of unwanted compounds in permeate water.
Effect of hydrolysis on membrane fouling
Due to the large difference in (biological) composition between non-hydrolyzed and hydrolyzed
urine, water flux through the membrane may vary heavily when urine of a different hydrolysis
degree is used. When comparing Figure 7 and 8, it is clear that water flux is not too heavily
impacted by fouling, wetting or scaling in middle term experiments. Indeed, average fluxes of
5.45 and 4.7 L/m².h, respectively are attainable in middle term experiments. However, when
looking at membrane fouling (Figure 9), it is clear that some membrane fouling is developing,
especially within the zones of low turbulence. Non-hydrolyzed urine that can be kept stable by
e.g. acidification is preferable for long-term water production to keep the membrane process
stable.
Figure 7: Water flux in a membrane distillation experiment using batch FRESH-01 urine.
Tfeed=50°C, Tpermeate=20°C, pH unadjusted (pH 7). Experiments were run to a concentration
factor of 3, the membrane used is a NS01 membrane.
0
2
4
6
8
10
12
0 1 2 3 4 5 6 7 8 9 10
Flu
x (
L/m
².h
)
Time (h)

12
Figure 8: Water flux in a membrane distillation experiment using batch HYDRO-02 urine.
Tfeed=50°C, Tpermeate=20°C, pH adjusted to 12). Experiments were run to a concentration
factor of 3, the membrane used is a NS01 membrane.
Figure 9: Membrane fouling of the membrane used in experiment of Figure 10.
Maximum water recovery
As membrane distillation is not too severely impacted by fouling or scaling, high water
recoveries should be attainable. However, at a certain point the feed concentration and viscosity
will start to increase, reducing the vapour pressure and potentially foul and scale the membrane.
In the experiments above, recovery of up to 65% was achievable without significant flux loss. In
Figure 12 an experiment was run for 25h, effectively recovering up to 75% of the water in urine,
at which point temperature control was becoming erratic.
0
2
4
6
8
10
12
0 1 2 3 4 5 6 7 8 9 10
Flu
x (
L/m
².h
)
Time (h)

13
Figure 10: Long-term membrane distillation experiment, using 2 L of batch Fresh-01 urine.
Tfeed=50°C, Tpermeate=20°C. The pH was unadjusted at 7. Membrane used: S02.
Conclusions
In this paper, we aimed to investigate the possibilities of ammonia and potable water recovery
from human urine through membrane distillation. Membrane distillation could offer some
advantages regarding speed and efficiency over existing urine treatment technologies,
specifically regarding ammonia recovery. It was shown that up to 95 m% of all ammonia present
in hydrolyzed urine could be recovered by increasing the urine pH to 10.5 or higher within a
period of 2 hours. As such, membrane distillation offers a very valuable alternative to other
ammonia recovery technologies, such as stripping. However, membrane distillation still requires
addition of caustics and heat for a full, quick and reliable ammonia recovery from urine,
reducing its applicability as a possible nitrogen fertilizer production technique for developing
countries.
The possibility of potable water production was investigated in human urine by assessing the
permeate water quality, maximum recovery and mid-term process stability. It was shown that at
least 75% of the available water could be recovered from non-hydrolyzed human urine without
process failure.
Membrane distillation can therefore be classified as a very interesting treatment step for human
urine treatment, allowing very high recovery of ammonia and water. Further research should
focus on further improving the selectivity towards either water and/or ammonia and investigate
long-term flux behaviour of membrane distillation membranes.
0.0000
0.0020
0.0040
0.0060
0.0080
0.0100
0.0120
0 5 10 15 20 25 30
Per
mea
bil
ity (
L/m
².h.b
ar)
Time (hrs)

14
References
Alkhudhiri A., Darwish N., Hilal, N. (2012), Membrane distillation: a comprehensive review,
Desalination, pp. 2-18.
Antonini, S., Paris, S., Eichert, T., Clemens, J. (2011), Nitrogen and Phosphorus Recovery from
Human Urine by Struvite Precipitation and Air Stripping in Vietnam, Clean – Air, Soil,
Water, pp. 1099-1104.
Bașakçılardan-Kabakcı, S., Ipekoglu, A.N., Talınlı, I. (2007), Recovery of Ammonia from
Human Urine by Stripping and Absorption, Environmental Engineering Science, pp.
615-624.
Bilsborrow, R.E. (1987), Population pressure and agricultural development in developing
countries: a conceptual framework and recent evidence, World Development, pp. 183-
203.
Calabro, V., Jiao, B.L., Drioli, E. (1994), Theoretical and experimental study on membrane
distillation in the concentration of orange juice, Industrial and Engineering Chemistry
Research, pp. 1803–1808.
Canfield, Donald E., Glazer, Alexander N. and Falkowski, Paul G. (2010), “The Evolution and
Future of Earth’s Nitrogen Cycle”, Science, pp. 192-196.
El-Bourawi, M.S., Khayet, M., Ma, R., Ding, Z., Li, Z., Zhang, X. (2007), Application of
vacuum membrane distillation for ammonia removal, Journal of Membrane Science, pp.
200-209.
Etter, B., Tilley E., Khadka, R., K.M. Udert (2011), Low-cost struvite production using source-
separated urine in Nepal, Water research, pp. 852-862.
Ganrot, Z., Dave, Göran, Nilsson, E. (2007), Recovery of N and P from human urine by freezing,
struvite precipitation and adsorption to zeolite and active carbon, Bioresource
technology, pp. 3112-3121.
Heinonen-Tanski, H., van Wijk-Sijbesma, C. (2005), Human excreta for plant production,
Bioresource Technology, pp. 403-411.
Henao, J. and Baanante, C. (2006), Agricultural Production and Soil Nutrient Mining in Africa:
Implications for Resource Conservation and Policy Development (Summary), IFDC
Technical Bulletin.
Hsu, S.T., Cheng, K.T., Chiou, J.S. (2002), Seawater desalination by direct contact membrane
distillation, Desalination, pp. 279–287.
Kitano, M., Inoue, Y., Yamazaki, Y., Hayashi, F., Kanbara, S., Matsuishi, S., Yokoyama, T.,
Kim, S., Hara, M., Hosono, H., Ammonia synthesis using a stable electride as an
electron donor and reversible hydrogen store, Nature Chemistry, pp. 934-940.

15
Larsen, T. A., Gujer, W (1996), Separate management of anthropogenic nutrient solutions
(human urine), Water Science and Technology, pp. 87−94.
Lind, B., Ban, Z., Bydén, S. (2000), Nutrient recovery from human urine by struvite
crystallization with ammonia adsorption on zeolite and wollastonite, Bioresource
Technology, pp. 169-174.
Maurer, M., Pronk, W. and Larsen, T.A. (2006), Treatment processes for source-separated urine,
Water Research, pp. 3151-3166.
Maurer, M., Schwegler, P. and Larsen, T.A. (2003), Nutrients in urine: energetic aspects of
removal and recovery, Water Science and Technology, pp. 37-46.
Mobley, H. L. T. and Hausinger, R. P. (1989). Microbial Ureases: Significance, regulation
and molecular characterisation, Microbiological Review, pp. 85-108.
Norddahl, B., Horn, V.G., Larsson, M., du Preez, J.H., Christensen, K. (2006), A membrane
contactor for ammonia stripping, pilot scale experience and modelling, Desalination,
pp. 172-174.
O’Neal, A.J., Boyer, T.H. (2013), Phosphate recovery using hybrid anion exchange:
Applications to source-separated urine and combined wastewater streams, Water
Research, pp. 5003-5017.
Ronteltap, M., Maurer, M., Hausherr, R., Gujer, W. (2010), Struvite precipitation from urine –
influencing factors on particle size, Water Research, pp. 2038-2046.
Tomaszewska, M., Gryta, M., Morawski, A.W. (1995), Study on the concentration of acids by
membrane distillation, Journal of Membrane Science, pp. 113–122.
Udert, K., Wächter, M. (2012), Complete nutrient recovery from source-separated urine by
nitrification and distillation, Water Research, pp. 453-464.
Winker, M., Faika, D., Gulyas, H. and Otterpohl R. (2008a), A comparison of human
pharmaceutical concentrations in raw municipal wastewater and yellowwater, Science of
the total environment, pp. 96-104.
Winker, M., Tettenborn, F., Faika, D., Gulyas, H., Otterpohl, R. (2008b), Comparison of
analytical and theoretical pharmaceutical concentrations in human urine in Germany,
Water Research, pp. 3633-3640.
Zhao, Z., Xu, L., Shang X., Chen, K. (2013), Water regeneration from human urine by vacuum
membrane distillation and analysis of membrane fouling characteristics, Separation and
Purification Technology, pp. 369-376.