Full Legal Disclaimer herein, - Spruce Point Capital ...Jul 31, 2013 · Full Legal Disclaimer ....
14
Full Legal Disclaimer Any investment involves substantial risks, including complete loss of capital. Any forecasts or estimates are for illustrative purpose only and should not be taken as limitations of the maximum possible loss or gain. Any information contained in this report may include forward-looking statements, expectations, and projections. You should assume these types of statements, expectations, and projections may turn out to be incorrect. Use of Spruce Point Capital Management LLC’s (“Spruce Point”) research is at your own risk. You should do your own research and due diligence before making any investment decision with respect to securities covered herein, including, but not limited to, the suitability of any transaction to your risk tolerance and investment objectives and consult your own tax, financial and legal experts as warranted. Spruce Point is not a broker/dealer or financial advisor and nothing contained herein should be construed as an offer or solicitation to buy or sell any investment or security mentioned in this report. You should assume that as of the publication date of any report or letter, Spruce Point (possibly along with or through our members, partners, affiliates, employees, and/or consultants) along with our clients and/or investors has a short position in all stocks (and/or are long puts/short call options of the stock) covered herein, including without limitation Just Energy Inc. and therefore stands to realize significant gains in the event that the price of stock declines. Following publication of any report or letter, we intend to continue transacting in the securities covered therein, and we may be long, short, or neutral at any time hereafter regardless of our initial recommendation. This is not an offer to sell or a solicitation of an offer to buy any security, nor shall any security be offered or sold to any person, in any jurisdiction in which such offer would be unlawful under the securities laws of such jurisdiction. Spruce Point is not registered as an investment advisor or broker/dealer. To the best of our ability and belief, all information contained herein is accurate and reliable, and has been obtained from public sources we believe to be accurate and reliable, and who are not insiders or connected persons of the stock covered herein or who may otherwise owe any fiduciary duty or duty of confidentiality to the issuer, or to any other person or entity that was breached by the transmission of information to Spruce Point. However, such information is presented “as is,” without warranty of any kind – whether express or implied. Spruce Point makes no representation, express or implied, as to the accuracy, timeliness, or completeness of any such information or with regard to the results to be obtained from its use. All expressions of opinion are subject to change without notice, and Spruce Point does not undertake to update or supplement this report or any of the information contained herein. You should do your own research and due diligence before making any investment decision with respect to securities covered herein
Transcript of Full Legal Disclaimer herein, - Spruce Point Capital ...Jul 31, 2013 · Full Legal Disclaimer ....
Full Legal Disclaimer
Any investment involves substantial risks, including complete loss of capital. Any forecasts or estimates are for illustrative purpose only and should not be taken as limitations of the maximum possible loss or gain. Any information contained in this report may include forward-looking statements, expectations, and projections. You should assume these types of statements, expectations, and projections may turn out to be incorrect. Use of Spruce Point Capital Management LLC’s (“Spruce Point”) research is at your own risk. You should do your own research and due diligence before making any investment decision with respect to securities covered herein, including, but not limited to, the suitability of any transaction to your risk tolerance and investment objectives and consult your own tax, financial and legal experts as warranted. Spruce Point is not a broker/dealer or financial advisor and nothing contained herein should be construed as an offer or solicitation to buy or sell any investment or security mentioned in this report.
You should assume that as of the publication date of any report or letter, Spruce Point (possibly along with or through our members, partners, affiliates, employees, and/or consultants) along with our clients and/or investors has a short position in all stocks (and/or are long puts/short call options of the stock) covered herein, including without limitation Just Energy Inc. and therefore stands to realize significant gains in the event that the price of stock declines. Following publication of any report or letter, we intend to continue transacting in the securities covered therein, and we may be long, short, or neutral at any time hereafter regardless of our initial recommendation.
This is not an offer to sell or a solicitation of an offer to buy any security, nor shall any security be offered or sold to any person, in any jurisdiction in which such offer would be unlawful under the securities laws of such jurisdiction. Spruce Point is not registered as an investment advisor or broker/dealer.
To the best of our ability and belief, all information contained herein is accurate and reliable, and has been obtained from public sources we believe to be accurate and reliable, and who are not insiders or connected persons of the stock covered herein or who may otherwise owe any fiduciary duty or duty of confidentiality to the issuer, or to any other person or entity that was breached by the transmission of information to Spruce Point. However, such information is presented “as is,” without warranty of any kind – whether express or implied. Spruce Point makes no representation, express or implied, as to the accuracy, timeliness, or completeness of any such information or with regard to the results to be obtained from its use.
All expressions of opinion are subject to change without notice, and Spruce Point does not undertake to update or supplement this report or any of the information contained herein. You should do your own research and due diligence before making any investment decision with respect to securities covered herein
Just Energy: Another Dividend Cut Poses An Above Average Risk to Investors
July 31, 2013
Executive Summary
Just Energy (NYSE: JE / TSX: JE) is a company that U.S. consumers and investors are quickly realizing has become toxic to their wallets through deceptive energy marketing practices, and harmful to their brokerage accounts. Investors tempted by its seemingly attractive 7% current yield should carefully consider the sustainability of its dividend through a rigorous analysis of the company’s earnings prospects, already debt-heavy capital structure, and management’s historical proclamations. Having Net Debt/EBITDA of 6.4x, we believe JE has overstretched its balance sheet and is struggling to survive amidst a brutally competitive market for its energy products, waning organic growth, and declining margins. The company already cut its dividend in February 2013, but we think another cut is highly probable.
We estimate JE is incapable of producing sufficient cash flow to cover the reduced C$122m/year dividend burden, rendering its dividend policy unsustainable. Regardless of any cut, we believe JE’s stock is grossly overvalued and has an intrinsic value of $4.00 per share, representing ~46% downside from the current price.
Problems Start and Management Is Still Dancing Even When the Music Stops
The foundation of JE’s business model is to send sales people door-to-door to convince residential and commercial energy customers to switch to buying energy from JE, as opposed to their local utility. The pitch, or so it goes, is that by signing up with JE, consumers can save money by locking-in their gas or electricity costs via fixed price contracts: as the company once put it – “it’s like having a fixed mortgage instead of a floating mortgage.” The business model worked to provide enormous gains for early investors, but market conditions and JE’s business practices appear to have worsened….significantly!
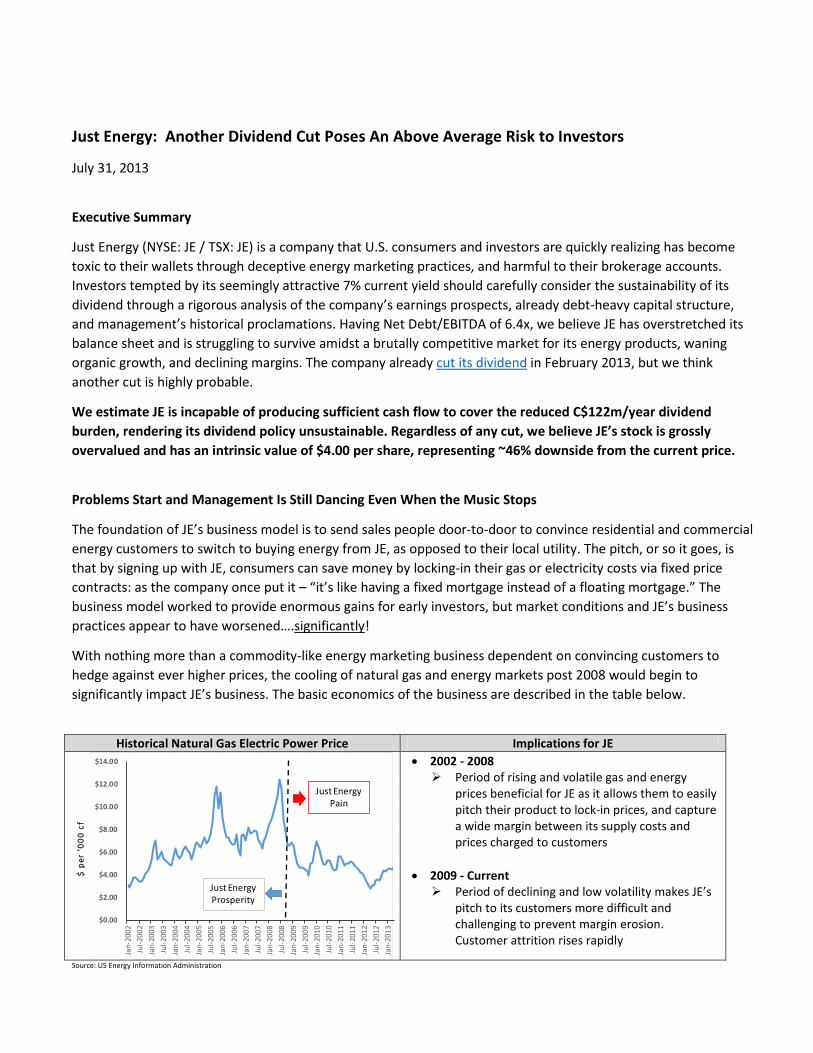
With nothing more than a commodity-like energy marketing business dependent on convincing customers to hedge against ever higher prices, the cooling of natural gas and energy markets post 2008 would begin to significantly impact JE’s business. The basic economics of the business are described in the table below.
Historical Natural Gas Electric Power Price Implications for JE
$ p
er '
00
0 c
f
$0.00
$2.00
$4.00
$6.00
$8.00
$10.00
$12.00
$14.00
Jan-
2002
Jul-2
002
Jan-
2003
Jul-2
003
Jan-
2004
Jul-2
004
Jan-
2005
Jul-2
005
Jan-
2006
Jul-2
006
Jan-
2007
Jul-2
007
Jan-
2008
Jul-2
008
Jan-
2009
Jul-2
009
Jan-
2010
Jul-2
010
Jan-
2011
Jul-2
011
Jan-
2012
Jul-2
012
Jan-
2013
Just Energy Prosperity
Just Energy Pain
• 2002 - 2008 Period of rising and volatile gas and energy
prices beneficial for JE as it allows them to easily pitch their product to lock-in prices, and capture a wide margin between its supply costs and prices charged to customers
• 2009 - Current Period of declining and low volatility makes JE’s
pitch to its customers more difficult and challenging to prevent margin erosion. Customer attrition rises rapidly
Source: US Energy Information Administration
Unfazed by economic conditions, Executive Chairman McDonald’s comments in the FY 2009 earnings press release would lead investors to believe that JE’s business is immune to commodity prices, and has the investment profile of a stable earning utility, and not an independent marketer:
“Since our IPO eight years ago, we have seen good weather and bad weather, skyrocketing commodity prices and collapsing commodity prices, good economic times and the worst recession since the 1930’s. I would like to think that Energy Savings (now Just Energy) has been an investment rock throughout the entire period, providing predictable, reliable and growing cash flow to our investors every year, just as I promised at the time of the IPO”
Not surprisingly, Chairman McDonald’s comments here would mark the peak of JE’s “predictable, reliable, and growing cash flow.” Investors would have to carefully scrutinize the company’s annual report for further clues of pending problems. To illustrate, according to its FY 2009 Annual Report (p. 15), core Canadian gas customers renewed contracts at a 73% rate, far below the 80% target management had guided investors to expect, and well below the 82% rate posted in FY 2008. With competitors such as Direct Energy (owned by Centrica (LON: CAN)), Superior Energy, MX Energy, and incumbent utility providers all vying for its customers, JE’s margins began to significantly contract and the company came under immense pressure to replace lost customers.
Not wanting to disappoint investors that were growing accustomed to JE’s ever-rising stock price (which hit C$21.50 in 2007) and juicy C$1.24 annual dividend, we believe JE’s management team faced a crossroad:
1. Face reality that its core business growth and margin opportunity had structurally changed and cut the dividend;
2. Maintain the dividend, and try to cover it by:
a. Accelerating growth with more aggressive sales tactics
b. Borrowing money to buy businesses in an attempt to diversify and divert cash flow toward the dividend
Knowing all too well that a dividend cut would not be palatable to its income oriented investors, JE’s management chose the second path, compounding the company’s problems with both aggressive and deceptive sales tactics and a debt-fueled acquisition binge.
JE’s Growth Appears the Result of Deceptive Sales Tactics, Now at Risk of Unraveling
We believe JE’s service offering is of dubious value and that its growth was driven by deceptive sales practices and contractual terms, as evidenced by a large body of consumer fraud complaints. As we’ve documented, JE’s sales personnel have falsely represented themselves to customers as agents of local utilities or implied that “the new contracts are somehow mandatory (see CBS news video: JE Ringing Door Bells in Boston).” Further, regulatory agencies and consumer advocacy groups have, on multiple occasions, found the company’s sales practices to be deceptive and misleading (click: here, here and here).
For example, in their marketing pitches, JE’s sales personnel have presented a very disingenuous comparison of a consumers’ natural gas utility costs relative to unrelated costs, such as that of a gallon of gasoline. Most consumers don’t know the difference between natural gas on a $ per therm basis compared to gasoline on a $ per gallon basis, so they were misled into thinking they were saving money (see CBS news video: JE Confused Consumers Take Dangerous Gas Gamble). Even JE’s advertised contractual terms appear meant to deceive. As noted in the table below, JE “appears” to offer the lowest price fixed contract, but as discussed below there’s a ‘catch.’
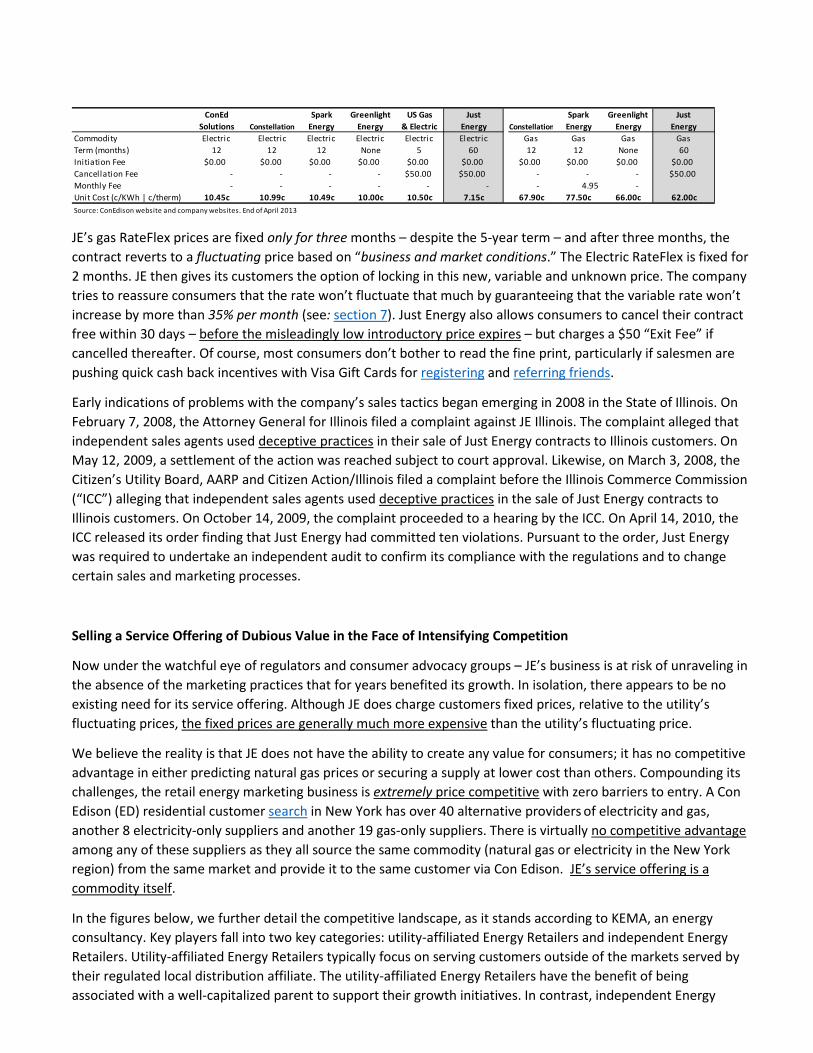
ConEd Spark Greenlight US Gas Just Spark Greenlight JustSolutions Constellation Energy Energy & Electric Energy Constellation Energy Energy Energy
Commodity Electric Electric Electric Electric Electric Electric Gas Gas Gas GasTerm (months) 12 12 12 None 5 60 12 12 None 60Initiation Fee $0.00 $0.00 $0.00 $0.00 $0.00 $0.00 $0.00 $0.00 $0.00 $0.00Cancellation Fee - - - - $50.00 $50.00 - - - $50.00Monthly Fee - - - - - - - 4.95 - Unit Cost (c/KWh | c/therm) 10.45c 10.99c 10.49c 10.00c 10.50c 7.15c 67.90c 77.50c 66.00c 62.00cSource: ConEdison website and company websites. End of April 2013
JE’s gas RateFlex prices are fixed only for three months – despite the 5-year term – and after three months, the contract reverts to a fluctuating price based on “business and market conditions.” The Electric RateFlex is fixed for 2 months. JE then gives its customers the option of locking in this new, variable and unknown price. The company tries to reassure consumers that the rate won’t fluctuate that much by guaranteeing that the variable rate won’t increase by more than 35% per month (see: section 7). Just Energy also allows consumers to cancel their contract free within 30 days – before the misleadingly low introductory price expires – but charges a $50 “Exit Fee” if cancelled thereafter. Of course, most consumers don’t bother to read the fine print, particularly if salesmen are pushing quick cash back incentives with Visa Gift Cards for registering and referring friends.
Early indications of problems with the company’s sales tactics began emerging in 2008 in the State of Illinois. On February 7, 2008, the Attorney General for Illinois filed a complaint against JE Illinois. The complaint alleged that independent sales agents used deceptive practices in their sale of Just Energy contracts to Illinois customers. On May 12, 2009, a settlement of the action was reached subject to court approval. Likewise, on March 3, 2008, the Citizen’s Utility Board, AARP and Citizen Action/Illinois filed a complaint before the Illinois Commerce Commission (“ICC”) alleging that independent sales agents used deceptive practices in the sale of Just Energy contracts to Illinois customers. On October 14, 2009, the complaint proceeded to a hearing by the ICC. On April 14, 2010, the ICC released its order finding that Just Energy had committed ten violations. Pursuant to the order, Just Energy was required to undertake an independent audit to confirm its compliance with the regulations and to change certain sales and marketing processes.
Selling a Service Offering of Dubious Value in the Face of Intensifying Competition
Now under the watchful eye of regulators and consumer advocacy groups – JE’s business is at risk of unraveling in the absence of the marketing practices that for years benefited its growth. In isolation, there appears to be no existing need for its service offering. Although JE does charge customers fixed prices, relative to the utility’s fluctuating prices, the fixed prices are generally much more expensive than the utility’s fluctuating price.
We believe the reality is that JE does not have the ability to create any value for consumers; it has no competitive advantage in either predicting natural gas prices or securing a supply at lower cost than others. Compounding its challenges, the retail energy marketing business is extremely price competitive with zero barriers to entry. A Con Edison (ED) residential customer search in New York has over 40 alternative providers of electricity and gas, another 8 electricity-only suppliers and another 19 gas-only suppliers. There is virtually no competitive advantage among any of these suppliers as they all source the same commodity (natural gas or electricity in the New York region) from the same market and provide it to the same customer via Con Edison. JE’s service offering is a commodity itself.
In the figures below, we further detail the competitive landscape, as it stands according to KEMA, an energy consultancy. Key players fall into two key categories: utility-affiliated Energy Retailers and independent Energy Retailers. Utility-affiliated Energy Retailers typically focus on serving customers outside of the markets served by their regulated local distribution affiliate. The utility-affiliated Energy Retailers have the benefit of being associated with a well-capitalized parent to support their growth initiatives. In contrast, independent Energy
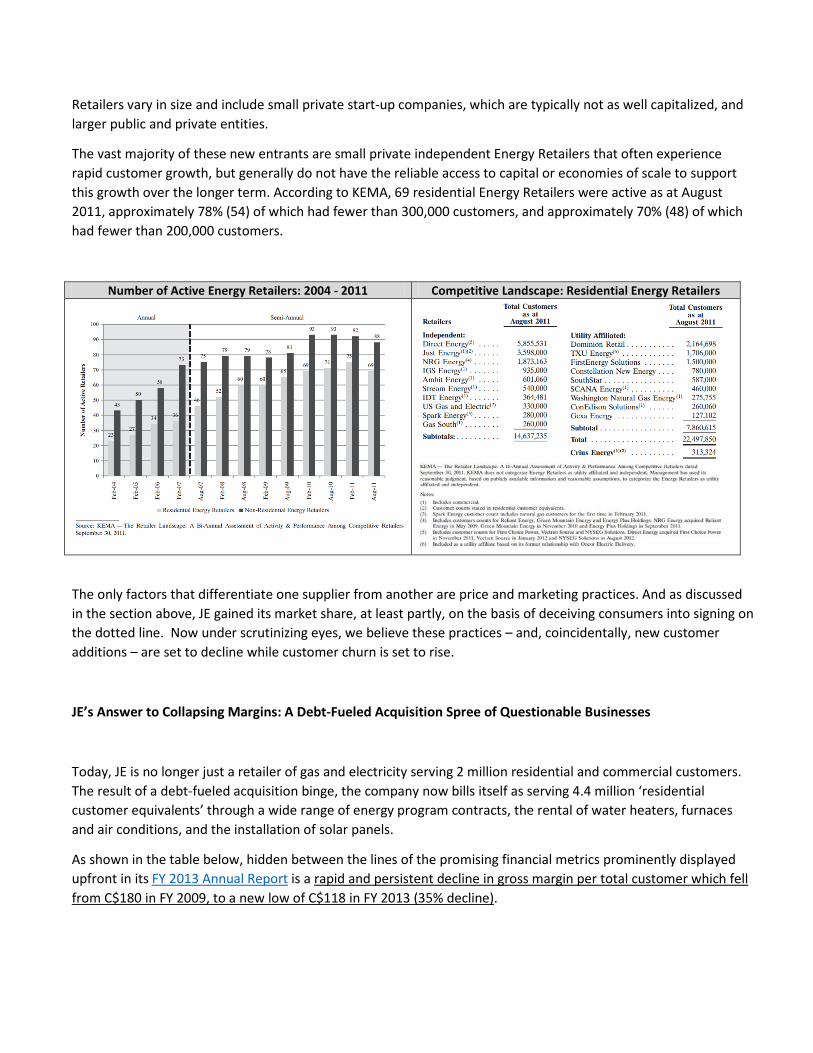
Retailers vary in size and include small private start-up companies, which are typically not as well capitalized, and larger public and private entities.
The vast majority of these new entrants are small private independent Energy Retailers that often experience rapid customer growth, but generally do not have the reliable access to capital or economies of scale to support this growth over the longer term. According to KEMA, 69 residential Energy Retailers were active as at August 2011, approximately 78% (54) of which had fewer than 300,000 customers, and approximately 70% (48) of which had fewer than 200,000 customers.
Number of Active Energy Retailers: 2004 - 2011 Competitive Landscape: Residential Energy Retailers
The only factors that differentiate one supplier from another are price and marketing practices. And as discussed in the section above, JE gained its market share, at least partly, on the basis of deceiving consumers into signing on the dotted line. Now under scrutinizing eyes, we believe these practices – and, coincidentally, new customer additions – are set to decline while customer churn is set to rise.
JE’s Answer to Collapsing Margins: A Debt-Fueled Acquisition Spree of Questionable Businesses
Today, JE is no longer just a retailer of gas and electricity serving 2 million residential and commercial customers. The result of a debt-fueled acquisition binge, the company now bills itself as serving 4.4 million ‘residential customer equivalents’ through a wide range of energy program contracts, the rental of water heaters, furnaces and air conditions, and the installation of solar panels.
As shown in the table below, hidden between the lines of the promising financial metrics prominently displayed upfront in its FY 2013 Annual Report is a rapid and persistent decline in gross margin per total customer which fell from C$180 in FY 2009, to a new low of C$118 in FY 2013 (35% decline).
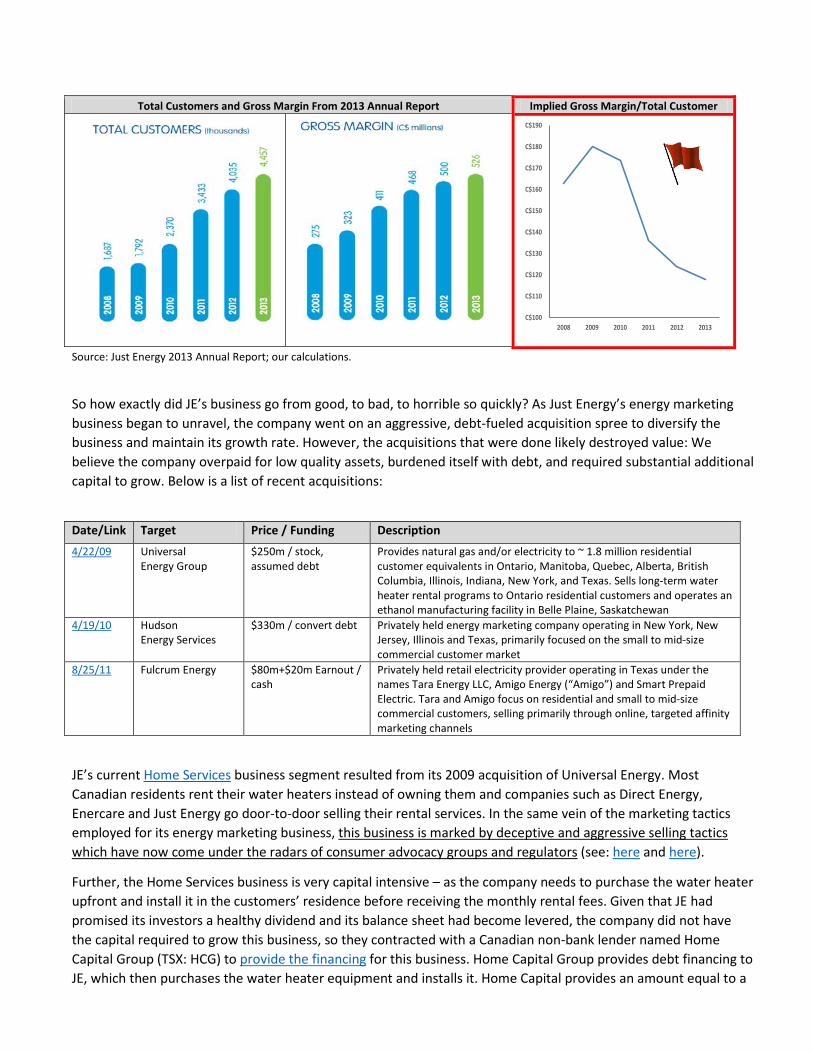
Total Customers and Gross Margin From 2013 Annual Report Implied Gross Margin/Total Customer
C$100
C$110
C$120
C$130
C$140
C$150
C$160
C$170
C$180
C$190
2008 2009 2010 2011 2012 2013 Source: Just Energy 2013 Annual Report; our calculations.
So how exactly did JE’s business go from good, to bad, to horrible so quickly? As Just Energy’s energy marketing business began to unravel, the company went on an aggressive, debt-fueled acquisition spree to diversify the business and maintain its growth rate. However, the acquisitions that were done likely destroyed value: We believe the company overpaid for low quality assets, burdened itself with debt, and required substantial additional capital to grow. Below is a list of recent acquisitions:
Date/Link Target Price / Funding Description 4/22/09 Universal
Energy Group $250m / stock, assumed debt
Provides natural gas and/or electricity to ~ 1.8 million residential customer equivalents in Ontario, Manitoba, Quebec, Alberta, British Columbia, Illinois, Indiana, New York, and Texas. Sells long-term water heater rental programs to Ontario residential customers and operates an ethanol manufacturing facility in Belle Plaine, Saskatchewan
4/19/10 Hudson Energy Services
$330m / convert debt Privately held energy marketing company operating in New York, New Jersey, Illinois and Texas, primarily focused on the small to mid-size commercial customer market
8/25/11 Fulcrum Energy $80m+$20m Earnout / cash
Privately held retail electricity provider operating in Texas under the names Tara Energy LLC, Amigo Energy (“Amigo”) and Smart Prepaid Electric. Tara and Amigo focus on residential and small to mid-size commercial customers, selling primarily through online, targeted affinity marketing channels
JE’s current Home Services business segment resulted from its 2009 acquisition of Universal Energy. Most Canadian residents rent their water heaters instead of owning them and companies such as Direct Energy, Enercare and Just Energy go door-to-door selling their rental services. In the same vein of the marketing tactics employed for its energy marketing business, this business is marked by deceptive and aggressive selling tactics which have now come under the radars of consumer advocacy groups and regulators (see: here and here).
Further, the Home Services business is very capital intensive – as the company needs to purchase the water heater upfront and install it in the customers’ residence before receiving the monthly rental fees. Given that JE had promised its investors a healthy dividend and its balance sheet had become levered, the company did not have the capital required to grow this business, so they contracted with a Canadian non-bank lender named Home Capital Group (TSX: HCG) to provide the financing for this business. Home Capital Group provides debt financing to JE, which then purchases the water heater equipment and installs it. Home Capital provides an amount equal to a
fixed period of monthly rental cash flows (typically 5 years, but also 7 and 10 years) discounted back at an 8% imputed interest rate. In return, Home Capital Group receives all of the monthly rental cash flows from the customer until their interest and principal has been fully amortized.
In effect, Home Capital Group makes a secured loan at 8%, backed by the asset and customer contracts, on a growing business, while JE does all of the marketing, installation and maintenance. JE retains ownership of the asset and all of the cash flows once the Home Capital debt is fully paid off. The interesting aspect about the Home Services business is that while Just Energy reports substantial growth in customers, revenues and EBITDA, the business doesn’t generate any cash flows for at least several years until the Home Capital debt is repaid. It is also worth noting, that JE’s Home Services business is only as good as its financial partner’s solvency and survivability. Home Capital Group’s financial stability has also been called into question recently by noted hedge fund manager Steve Eisman, who presented a strong short case for Home Capital Group at the Ira Sohn Investment Conference in May 2013.
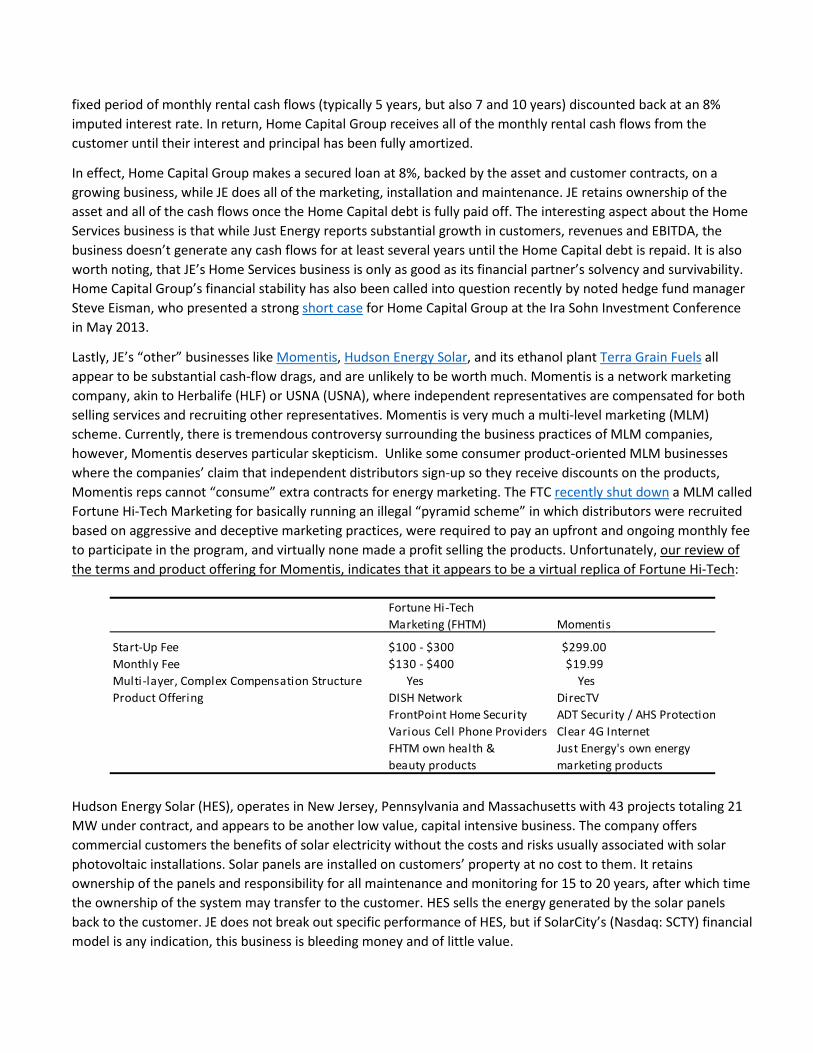
Lastly, JE’s “other” businesses like Momentis, Hudson Energy Solar, and its ethanol plant Terra Grain Fuels all appear to be substantial cash-flow drags, and are unlikely to be worth much. Momentis is a network marketing company, akin to Herbalife (HLF) or USNA (USNA), where independent representatives are compensated for both selling services and recruiting other representatives. Momentis is very much a multi-level marketing (MLM) scheme. Currently, there is tremendous controversy surrounding the business practices of MLM companies, however, Momentis deserves particular skepticism. Unlike some consumer product-oriented MLM businesses where the companies’ claim that independent distributors sign-up so they receive discounts on the products, Momentis reps cannot “consume” extra contracts for energy marketing. The FTC recently shut down a MLM called Fortune Hi-Tech Marketing for basically running an illegal “pyramid scheme” in which distributors were recruited based on aggressive and deceptive marketing practices, were required to pay an upfront and ongoing monthly fee to participate in the program, and virtually none made a profit selling the products. Unfortunately, our review of the terms and product offering for Momentis, indicates that it appears to be a virtual replica of Fortune Hi-Tech:
Fortune Hi-TechMarketing (FHTM) Momentis
Start-Up Fee $100 - $300 $299.00Monthly Fee $130 - $400 $19.99Multi-layer, Complex Compensation Structure Yes YesProduct Offering DISH Network DirecTV
FrontPoint Home Security ADT Security / AHS ProtectionVarious Cell Phone Providers Clear 4G InternetFHTM own health & Just Energy's own energybeauty products marketing products
Hudson Energy Solar (HES), operates in New Jersey, Pennsylvania and Massachusetts with 43 projects totaling 21 MW under contract, and appears to be another low value, capital intensive business. The company offers commercial customers the benefits of solar electricity without the costs and risks usually associated with solar photovoltaic installations. Solar panels are installed on customers’ property at no cost to them. It retains ownership of the panels and responsibility for all maintenance and monitoring for 15 to 20 years, after which time the ownership of the system may transfer to the customer. HES sells the energy generated by the solar panels back to the customer. JE does not break out specific performance of HES, but if SolarCity’s (Nasdaq: SCTY) financial model is any indication, this business is bleeding money and of little value.
Lastly, in March 2013, JE formally commenced the process to dispose of its ethanol business, Terra Grain Fuels, which has been operating in an unpredictable product environment, making it difficult for JE to derive real growth and profitability from the segment. Burdened by recourse debt, we also ascribe zero value to this business.
On Life Support and Struggling to Define its Own Financial Metrics: Why Would Anyone Invest in Just Energy?
Trying to Silence the Critics
Instead of acknowledging its challenges, it appears that JE’s management has continually sought to avoid them, and divert investor attention from its spiraling financial crisis by creating metrics that artificially overstate its true financial condition. We are not the first to be critical of JE’s business model, and question the survivability of its dividend policy. Other critics such as the Accountability Research Corporation in Canada were early to identify the flaws of its dividend policy and business model and issued a strong sell recommendation. Management’s standard response to critics appears to be dashing off press releases whenever the slightest hint of trouble approaches its stock price. For example, in October 2011, when early hints surfaced that its dividend policy could not be sustained, the company quickly issued a lengthy press release to quell “market rumors.” After Accountability Research initiated its strong sell opinion in July 2012, the company issued another press release in response to “unusual trading activity,” and yet again sought to reaffirm its dividend policy and outlook.
In our view, it appears the skeptics were warranted, and that numerous warning signs were present that investors should have been paying attention to. First, earlier in 2012 the company listed its shares on the NYSE for “greater access to capital markets and to provide a platform for anticipated future growth.” We view this as a move designed primarily to nurture a new class of US investors for a future equity issuance by the company if needed. In late August 2012, the company re-instituted a Dividend Reinvestment Policy (DRIP), a move that appears designed to mitigate JE’s cash dividend burden. In October 2012 the company filed a $1 billion shelf registration at Sedar and by December 2012 announced a “C$105m Investment” by the Canada Pension Plan Investment Board (CPPIB). The terms of the unsecured debt deal, which carry a 9.75% coupon, appear by CPPIB to ascribe a deeply junk credit view of JE’s business.
Finally, with no chips at the table left to play, the company cut its dividend by 33% on February 2013 and noted a “Board decision to reallocate capital priorities to focus on strategic growth initiatives and debt reduction.” In our opinion, the dividend cut is a step in the right direction, but additional dividend cuts loom large. We note that JE continues to push its DRIP policy and recently amended it at the end of April 2013 to allow US shareholders to more easily participate. The chorus of critics have not yet been silenced either, as noted by a May 2013 article in The Globe and Mail, and the company’s quick response to defend itself.
Trumpeting Questionable Investment Merits and Obfuscating Financial Performance with Creative Metrics
According to the above mentioned Global and Mail article, which questions Chairman/Founder Rebecca McDonald’s background, she credits her success to her late husband:
“He taught me the most important lesson—it’s all about sales,” she has said. “You could have the best idea but if you don’t sell it, you’ll never get ahead.” -- Rebecca McDonald.
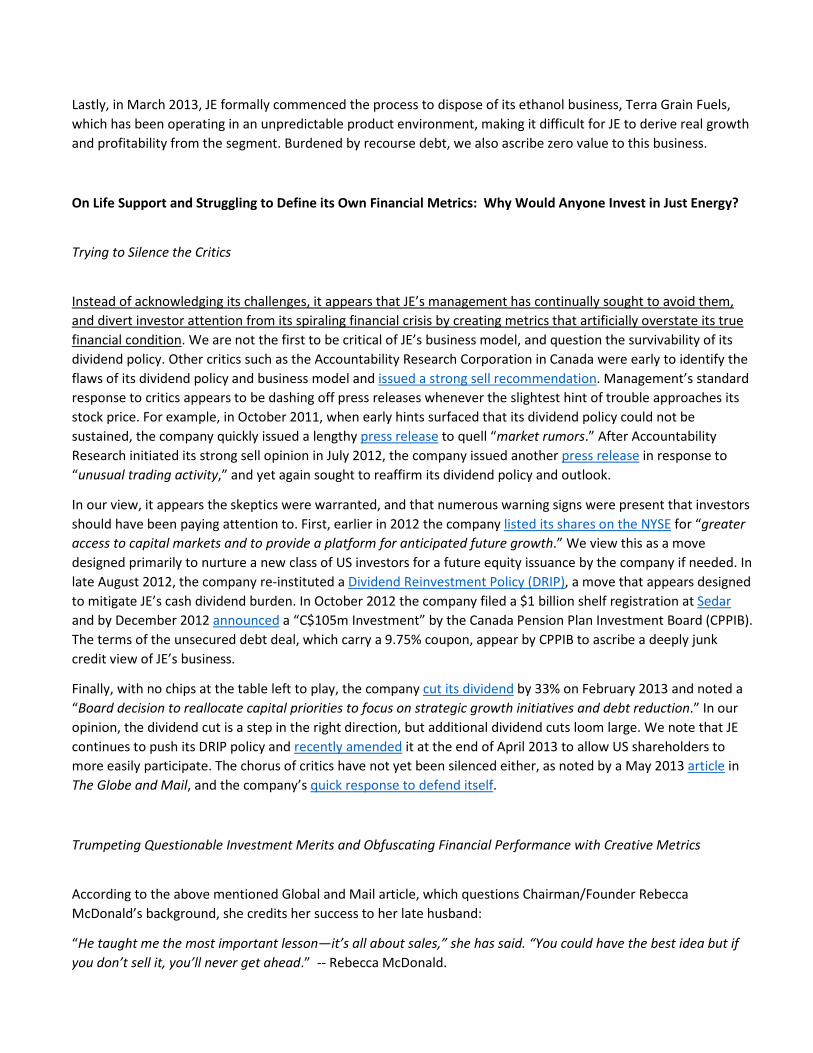
It appears she has also directed her selling skills at putting forth a happy face and convincing the investment community (72% of the stock is held by retail investors) of JE’s investment merits, despite the numerous challenges and problems with the company’s business model. In the table below, we highlight JE’s investment merits, as espoused in the company’s May 2013 investor presentation, against our own assessment.
Investment Thesis: May 2013 Short Thesis Summary
• JE is nothing more than a provider of commodity energy products, where ‘technology’ and ‘innovation’ mean little
• The company’s growth prospects are vanishing. Having tapped out growth in Canada, JE moved to the US, and is now having to stretch into the UK
• Its diversification efforts to stem declining growth and margins in its core business through acquisitions have not been disciplined. JE’s balance sheet is impaired with over C$1bn of debt, and a C$122m/yr dividend requirement
• JE has attempted to distract investors from its financial problems by focusing on aggressively constructed metrics such as Adjusted EBITDA and Embedded Margin
• Having lost substantial credibility, JE’s management may be forced to cut its dividend again if it cannot deliver on the cash flow growth it has promised to investors
In sum, we believe that JE has no technology or product advantage, as it operates in commodity-like end markets with scores of competitors. The company’s claim that it has taken a disciplined approach to business development is also at odds with our observations about its reckless M&A strategy and its push into non-cash flow producing businesses (e.g. solar panel installations, water heating installation, and ethanol). Our biggest concern, and a central tenet of our short thesis, is that JE’s cash flow is simply not strong or visible enough to warrant a continuation of its dividend policy, while its balance sheet remains impaired by C$ 1.1 billion of debt.
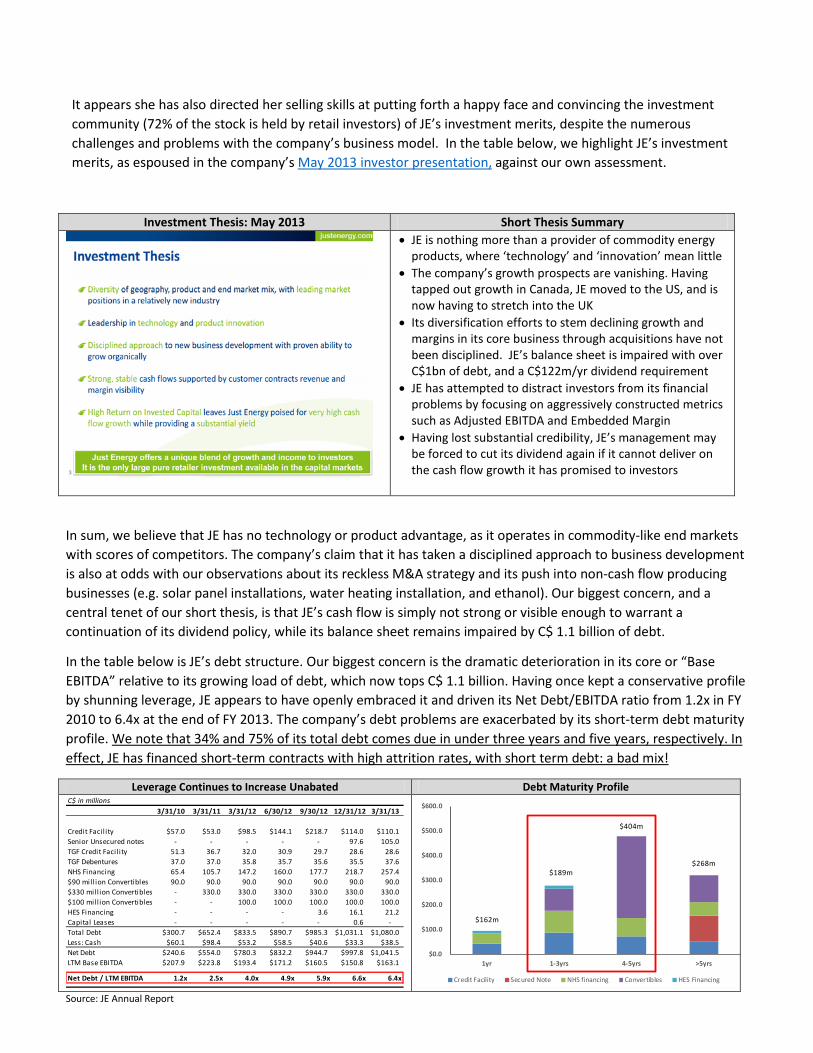
In the table below is JE’s debt structure. Our biggest concern is the dramatic deterioration in its core or “Base EBITDA” relative to its growing load of debt, which now tops C$ 1.1 billion. Having once kept a conservative profile by shunning leverage, JE appears to have openly embraced it and driven its Net Debt/EBITDA ratio from 1.2x in FY 2010 to 6.4x at the end of FY 2013. The company’s debt problems are exacerbated by its short-term debt maturity profile. We note that 34% and 75% of its total debt comes due in under three years and five years, respectively. In effect, JE has financed short-term contracts with high attrition rates, with short term debt: a bad mix!
Leverage Continues to Increase Unabated Debt Maturity Profile C$ in millions
3/31/10 3/31/11 3/31/12 6/30/12 9/30/12 12/31/12 3/31/13
Credit Facil ity $57.0 $53.0 $98.5 $144.1 $218.7 $114.0 $110.1Senior Unsecured notes - - - - - 97.6 105.0 TGF Credit Facil ity 51.3 36.7 32.0 30.9 29.7 28.6 28.6 TGF Debentures 37.0 37.0 35.8 35.7 35.6 35.5 37.6 NHS Financing 65.4 105.7 147.2 160.0 177.7 218.7 257.4 $90 mill ion Convertibles 90.0 90.0 90.0 90.0 90.0 90.0 90.0 $330 mill ion Convertibles - 330.0 330.0 330.0 330.0 330.0 330.0 $100 mill ion Convertibles - - 100.0 100.0 100.0 100.0 100.0 HES Financing - - - - 3.6 16.1 21.2 Capital Leases - - - - - 0.6 - Total Debt $300.7 $652.4 $833.5 $890.7 $985.3 $1,031.1 $1,080.0Less: Cash $60.1 $98.4 $53.2 $58.5 $40.6 $33.3 $38.5Net Debt $240.6 $554.0 $780.3 $832.2 $944.7 $997.8 $1,041.5LTM Base EBITDA $207.9 $223.8 $193.4 $171.2 $160.5 $150.8 $163.1
Net Debt / LTM EBITDA 1.2x 2.5x 4.0x 4.9x 5.9x 6.6x 6.4x
$0.0
$100.0
$200.0
$300.0
$400.0
$500.0
$600.0
1yr 1-3yrs 4-5yrs >5yrs
Credit Facility Secured Note NHS financing Convertibles HES Financing
$268m$189m
$404m
$162m
Source: JE Annual Report
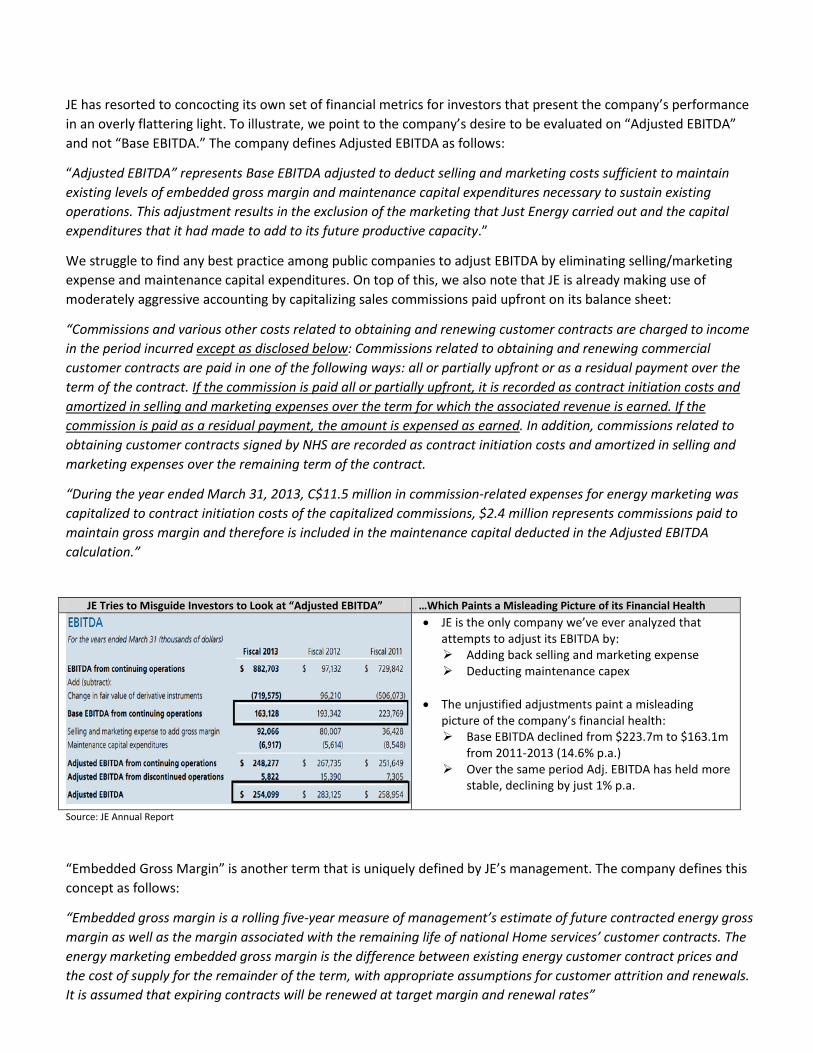
JE has resorted to concocting its own set of financial metrics for investors that present the company’s performance in an overly flattering light. To illustrate, we point to the company’s desire to be evaluated on “Adjusted EBITDA” and not “Base EBITDA.” The company defines Adjusted EBITDA as follows:
“Adjusted EBITDA” represents Base EBITDA adjusted to deduct selling and marketing costs sufficient to maintain existing levels of embedded gross margin and maintenance capital expenditures necessary to sustain existing operations. This adjustment results in the exclusion of the marketing that Just Energy carried out and the capital expenditures that it had made to add to its future productive capacity.”
We struggle to find any best practice among public companies to adjust EBITDA by eliminating selling/marketing expense and maintenance capital expenditures. On top of this, we also note that JE is already making use of moderately aggressive accounting by capitalizing sales commissions paid upfront on its balance sheet:
“Commissions and various other costs related to obtaining and renewing customer contracts are charged to income in the period incurred except as disclosed below: Commissions related to obtaining and renewing commercial customer contracts are paid in one of the following ways: all or partially upfront or as a residual payment over the term of the contract. If the commission is paid all or partially upfront, it is recorded as contract initiation costs and amortized in selling and marketing expenses over the term for which the associated revenue is earned. If the commission is paid as a residual payment, the amount is expensed as earned. In addition, commissions related to obtaining customer contracts signed by NHS are recorded as contract initiation costs and amortized in selling and marketing expenses over the remaining term of the contract.
“During the year ended March 31, 2013, C$11.5 million in commission-related expenses for energy marketing was capitalized to contract initiation costs of the capitalized commissions, $2.4 million represents commissions paid to maintain gross margin and therefore is included in the maintenance capital deducted in the Adjusted EBITDA calculation.”
JE Tries to Misguide Investors to Look at “Adjusted EBITDA” …Which Paints a Misleading Picture of its Financial Health
• JE is the only company we’ve ever analyzed that attempts to adjust its EBITDA by: Adding back selling and marketing expense Deducting maintenance capex
• The unjustified adjustments paint a misleading
picture of the company’s financial health: Base EBITDA declined from $223.7m to $163.1m
from 2011-2013 (14.6% p.a.) Over the same period Adj. EBITDA has held more
stable, declining by just 1% p.a.
Source: JE Annual Report
“Embedded Gross Margin” is another term that is uniquely defined by JE’s management. The company defines this concept as follows:
“Embedded gross margin is a rolling five-year measure of management’s estimate of future contracted energy gross margin as well as the margin associated with the remaining life of national Home services’ customer contracts. The energy marketing embedded gross margin is the difference between existing energy customer contract prices and the cost of supply for the remainder of the term, with appropriate assumptions for customer attrition and renewals. It is assumed that expiring contracts will be renewed at target margin and renewal rates”
We have numerous concerns about this metric, and in our opinion, there are too many embedded (no pun intended) assumptions in this definition to give it credibility:
• Management recently started disclosing Embedded Gross Margin figures to investors in 2010, which begs the question, “why is it relevant now vs. then?”
• Management does not disclose the discount rate used to arrive at its present value figure • Inability to determine to what degree the calculation compensates for customer credit risk • Does not give insight into the average duration of the company’s contracted portfolio • Assumes contracts will be renewed at target margin and renewal rates, which as history has shown, can
be an invalid assumption
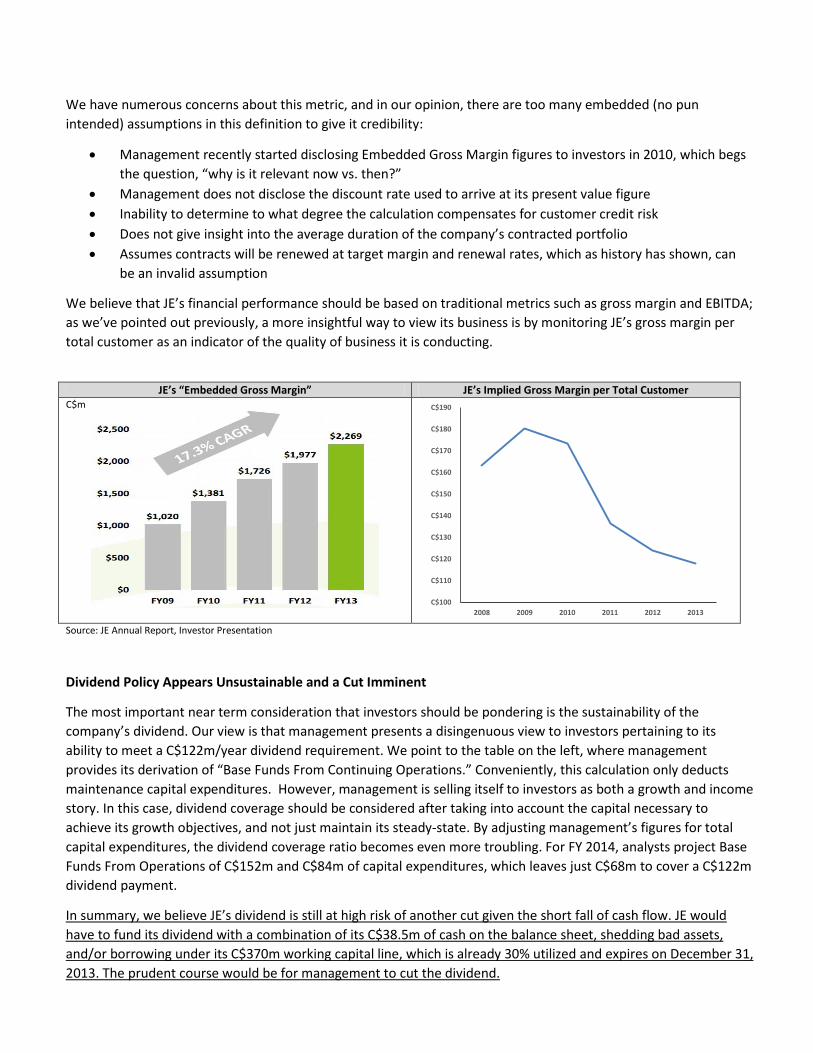
We believe that JE’s financial performance should be based on traditional metrics such as gross margin and EBITDA; as we’ve pointed out previously, a more insightful way to view its business is by monitoring JE’s gross margin per total customer as an indicator of the quality of business it is conducting.
JE’s “Embedded Gross Margin” JE’s Implied Gross Margin per Total Customer C$m
C$100
C$110
C$120
C$130
C$140
C$150
C$160
C$170
C$180
C$190
2008 2009 2010 2011 2012 2013 Source: JE Annual Report, Investor Presentation
Dividend Policy Appears Unsustainable and a Cut Imminent
The most important near term consideration that investors should be pondering is the sustainability of the company’s dividend. Our view is that management presents a disingenuous view to investors pertaining to its ability to meet a C$122m/year dividend requirement. We point to the table on the left, where management provides its derivation of “Base Funds From Continuing Operations.” Conveniently, this calculation only deducts maintenance capital expenditures. However, management is selling itself to investors as both a growth and income story. In this case, dividend coverage should be considered after taking into account the capital necessary to achieve its growth objectives, and not just maintain its steady-state. By adjusting management’s figures for total capital expenditures, the dividend coverage ratio becomes even more troubling. For FY 2014, analysts project Base Funds From Operations of C$152m and C$84m of capital expenditures, which leaves just C$68m to cover a C$122m dividend payment.
In summary, we believe JE’s dividend is still at high risk of another cut given the short fall of cash flow. JE would have to fund its dividend with a combination of its C$38.5m of cash on the balance sheet, shedding bad assets, and/or borrowing under its C$370m working capital line, which is already 30% utilized and expires on December 31, 2013. The prudent course would be for management to cut the dividend.
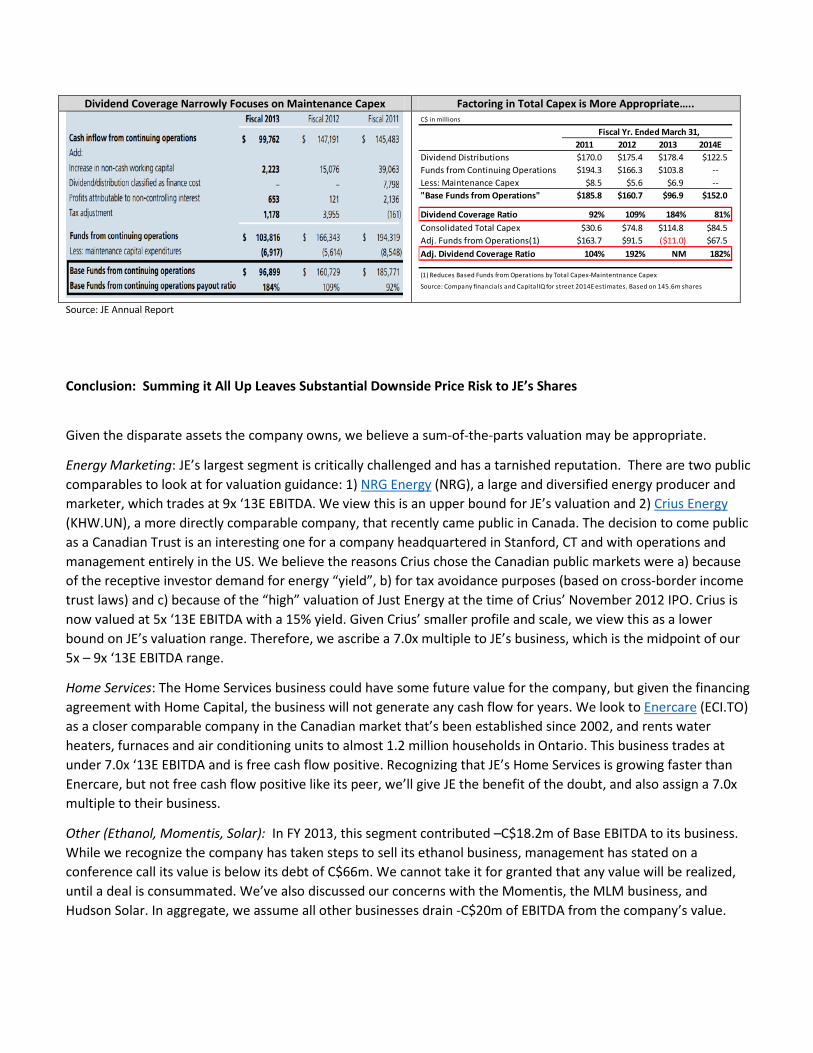
Dividend Coverage Narrowly Focuses on Maintenance Capex Factoring in Total Capex is More Appropriate…..
C$ in millions
Fiscal Yr. Ended March 31,2011 2012 2013 2014E
Dividend Distributions $170.0 $175.4 $178.4 $122.5Funds from Continuing Operations $194.3 $166.3 $103.8 --Less: Maintenance Capex $8.5 $5.6 $6.9 --"Base Funds from Operations" $185.8 $160.7 $96.9 $152.0
Dividend Coverage Ratio 92% 109% 184% 81%Consolidated Total Capex $30.6 $74.8 $114.8 $84.5Adj. Funds from Operations(1) $163.7 $91.5 ($11.0) $67.5Adj. Dividend Coverage Ratio 104% 192% NM 182%
(1) Reduces Based Funds from Operations by Total Capex-Maintentnance Capex
Source: Company financials and CapitalIQ for street 2014E estimates. Based on 145.6m shares Source: JE Annual Report
Conclusion: Summing it All Up Leaves Substantial Downside Price Risk to JE’s Shares
Given the disparate assets the company owns, we believe a sum-of-the-parts valuation may be appropriate.
Energy Marketing: JE’s largest segment is critically challenged and has a tarnished reputation. There are two public comparables to look at for valuation guidance: 1) NRG Energy (NRG), a large and diversified energy producer and marketer, which trades at 9x ‘13E EBITDA. We view this is an upper bound for JE’s valuation and 2) Crius Energy (KHW.UN), a more directly comparable company, that recently came public in Canada. The decision to come public as a Canadian Trust is an interesting one for a company headquartered in Stanford, CT and with operations and management entirely in the US. We believe the reasons Crius chose the Canadian public markets were a) because of the receptive investor demand for energy “yield”, b) for tax avoidance purposes (based on cross-border income trust laws) and c) because of the “high” valuation of Just Energy at the time of Crius’ November 2012 IPO. Crius is now valued at 5x ‘13E EBITDA with a 15% yield. Given Crius’ smaller profile and scale, we view this as a lower bound on JE’s valuation range. Therefore, we ascribe a 7.0x multiple to JE’s business, which is the midpoint of our 5x – 9x ‘13E EBITDA range.
Home Services: The Home Services business could have some future value for the company, but given the financing agreement with Home Capital, the business will not generate any cash flow for years. We look to Enercare (ECI.TO) as a closer comparable company in the Canadian market that’s been established since 2002, and rents water heaters, furnaces and air conditioning units to almost 1.2 million households in Ontario. This business trades at under 7.0x ‘13E EBITDA and is free cash flow positive. Recognizing that JE’s Home Services is growing faster than Enercare, but not free cash flow positive like its peer, we’ll give JE the benefit of the doubt, and also assign a 7.0x multiple to their business.
Other (Ethanol, Momentis, Solar): In FY 2013, this segment contributed –C$18.2m of Base EBITDA to its business. While we recognize the company has taken steps to sell its ethanol business, management has stated on a conference call its value is below its debt of C$66m. We cannot take it for granted that any value will be realized, until a deal is consummated. We’ve also discussed our concerns with the Momentis, the MLM business, and Hudson Solar. In aggregate, we assume all other businesses drain -C$20m of EBITDA from the company’s value.
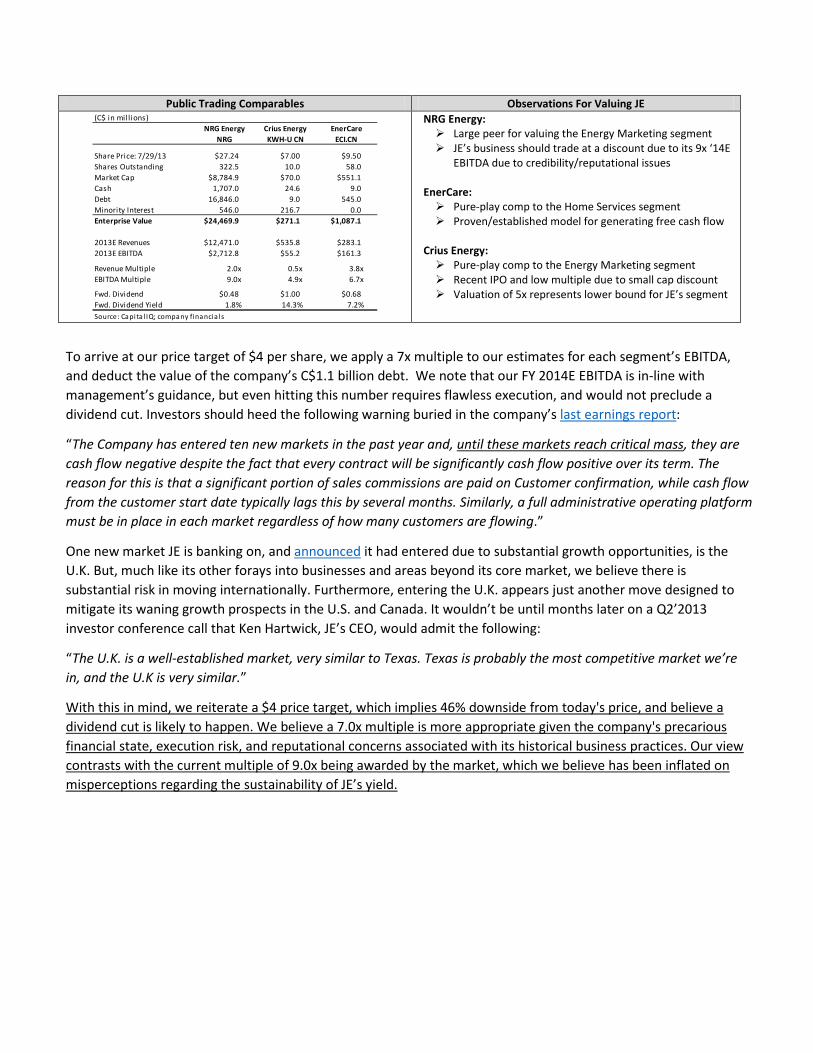
Public Trading Comparables Observations For Valuing JE (C$ in mill ions)
NRG Energy Crius Energy EnerCareNRG KWH-U CN ECI.CN
Share Price: 7/29/13 $27.24 $7.00 $9.50Shares Outstanding 322.5 10.0 58.0Market Cap $8,784.9 $70.0 $551.1Cash 1,707.0 24.6 9.0Debt 16,846.0 9.0 545.0Minority Interest 546.0 216.7 0.0Enterprise Value $24,469.9 $271.1 $1,087.1
2013E Revenues $12,471.0 $535.8 $283.12013E EBITDA $2,712.8 $55.2 $161.3
Revenue Multiple 2.0x 0.5x 3.8xEBITDA Multiple 9.0x 4.9x 6.7x
Fwd. Dividend $0.48 $1.00 $0.68Fwd. Dividend Yield 1.8% 14.3% 7.2%Source: Capi ta l IQ; company financia ls
NRG Energy: Large peer for valuing the Energy Marketing segment JE’s business should trade at a discount due to its 9x ‘14E
EBITDA due to credibility/reputational issues
EnerCare: Pure-play comp to the Home Services segment Proven/established model for generating free cash flow
Crius Energy: Pure-play comp to the Energy Marketing segment Recent IPO and low multiple due to small cap discount Valuation of 5x represents lower bound for JE’s segment
To arrive at our price target of $4 per share, we apply a 7x multiple to our estimates for each segment’s EBITDA, and deduct the value of the company’s C$1.1 billion debt. We note that our FY 2014E EBITDA is in-line with management’s guidance, but even hitting this number requires flawless execution, and would not preclude a dividend cut. Investors should heed the following warning buried in the company’s last earnings report:
“The Company has entered ten new markets in the past year and, until these markets reach critical mass, they are cash flow negative despite the fact that every contract will be significantly cash flow positive over its term. The reason for this is that a significant portion of sales commissions are paid on Customer confirmation, while cash flow from the customer start date typically lags this by several months. Similarly, a full administrative operating platform must be in place in each market regardless of how many customers are flowing.”
One new market JE is banking on, and announced it had entered due to substantial growth opportunities, is the U.K. But, much like its other forays into businesses and areas beyond its core market, we believe there is substantial risk in moving internationally. Furthermore, entering the U.K. appears just another move designed to mitigate its waning growth prospects in the U.S. and Canada. It wouldn’t be until months later on a Q2’2013 investor conference call that Ken Hartwick, JE’s CEO, would admit the following:
“The U.K. is a well-established market, very similar to Texas. Texas is probably the most competitive market we’re in, and the U.K is very similar.”
With this in mind, we reiterate a $4 price target, which implies 46% downside from today's price, and believe a dividend cut is likely to happen. We believe a 7.0x multiple is more appropriate given the company's precarious financial state, execution risk, and reputational concerns associated with its historical business practices. Our view contrasts with the current multiple of 9.0x being awarded by the market, which we believe has been inflated on misperceptions regarding the sustainability of JE’s yield.
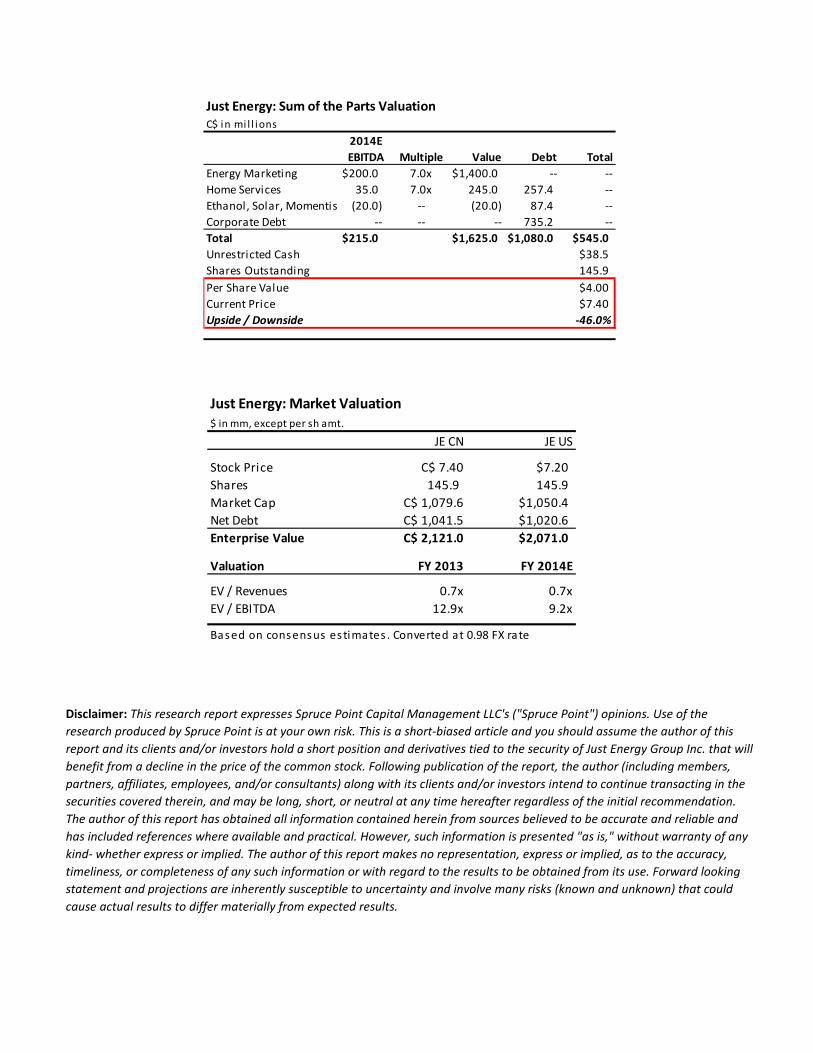
Just Energy: Sum of the Parts ValuationC$ in mi l l ions
2014EEBITDA Multiple Value Debt Total
Energy Marketing $200.0 7.0x $1,400.0 -- --Home Services 35.0 7.0x 245.0 257.4 --Ethanol, Solar, Momentis (20.0) -- (20.0) 87.4 --Corporate Debt -- -- -- 735.2 --Total $215.0 $1,625.0 $1,080.0 $545.0Unrestricted Cash $38.5Shares Outstanding 145.9 Per Share Value $4.00Current Price $7.40Upside / Downside -46.0%
Just Energy: Market Valuation$ in mm, except per sh amt.
JE CN JE US
Stock Price C$ 7.40 $7.20Shares 145.9 145.9 Market Cap C$ 1,079.6 $1,050.4Net Debt C$ 1,041.5 $1,020.6Enterprise Value C$ 2,121.0 $2,071.0
Valuation FY 2013 FY 2014E
EV / Revenues 0.7x 0.7xEV / EBITDA 12.9x 9.2x
Based on consensus estimates . Converted at 0.98 FX rate
Disclaimer: This research report expresses Spruce Point Capital Management LLC's ("Spruce Point") opinions. Use of the research produced by Spruce Point is at your own risk. This is a short-biased article and you should assume the author of this report and its clients and/or investors hold a short position and derivatives tied to the security of Just Energy Group Inc. that will benefit from a decline in the price of the common stock. Following publication of the report, the author (including members, partners, affiliates, employees, and/or consultants) along with its clients and/or investors intend to continue transacting in the securities covered therein, and may be long, short, or neutral at any time hereafter regardless of the initial recommendation. The author of this report has obtained all information contained herein from sources believed to be accurate and reliable and has included references where available and practical. However, such information is presented "as is," without warranty of any kind- whether express or implied. The author of this report makes no representation, express or implied, as to the accuracy, timeliness, or completeness of any such information or with regard to the results to be obtained from its use. Forward looking statement and projections are inherently susceptible to uncertainty and involve many risks (known and unknown) that could cause actual results to differ materially from expected results.