Full Legal Disclaimer · 2019-05-24 · 2 Full Legal Disclaimer This research presentation...
39
1
Transcript of Full Legal Disclaimer · 2019-05-24 · 2 Full Legal Disclaimer This research presentation...
1
2
Full Legal Disclaimer
This research presentation expresses our research opinions. You should assume that as of the publication date of any presentation, report or letter, Spruce
Point Capital Management LLC (possibly along with or through our members, partners, affiliates, employees, and/or consultants) along with our subscribers
and clients has a short position in all stocks (and are long/short combinations of puts and calls on the stock) covered herein, including without limitation
Healthcare Trust of America, Inc. (“HTA”), and therefore stand to realize significant gains in the event that the price of its stock declines. Following publication
of any presentation, report or letter, we intend to continue transacting in the securities covered therein, and we may be long, short, or neutral at any time
hereafter regardless of our initial recommendation. All expressions of opinion are subject to change without notice, and Spruce Point Capital Management
does not undertake to update this report or any information contained herein. Spruce Point Capital Management, subscribers and/or consultants shall have no
obligation to inform any investor or viewer of this report about their historical, current, and future trading activities.
This research presentation expresses our research opinions, which we have based upon interpretation of certain facts and observations, all of which are
based upon publicly available information, and all of which are set out in this research presentation. Any investment involves substantial risks, including
complete loss of capital. Any forecasts or estimates are for illustrative purpose only and should not be taken as limitations of the maximum possible loss or
gain. Any information contained in this report may include forward looking statements, expectations, pro forma analyses, estimates, and projections. You
should assume these types of statements, expectations, pro forma analyses, estimates, and projections may turn out to be incorrect for reasons beyond
Spruce Point Capital Management LLC’s control. This is not investment or accounting advice nor should it be construed as such. Use of Spruce Point Capital
Management LLC’s research is at your own risk. You should do your own research and due diligence, with assistance from professional financial, legal and
tax experts, before making any investment decision with respect to securities covered herein. All figures assumed to be in US Dollars, unless specified
otherwise.
To the best of our ability and belief, as of the date hereof, all information contained herein is accurate and reliable and does not omit to state material facts
necessary to make the statements herein not misleading, and all information has been obtained from public sources we believe to be accurate and reliable,
and who are not insiders or connected persons of the stock covered herein or who may otherwise owe any fiduciary duty or duty of confidentiality to the issuer,
or to any other person or entity that was breached by the transmission of information to Spruce Point Capital Management LLC. However, Spruce Point
Capital Management LLC recognizes that there may be non-public information in the possession of HTA or other insiders of HTA that has not been publicly
disclosed by HTA. Therefore, such information contained herein is presented “as is,” without warranty of any kind – whether express or implied. Spruce Point
Capital Management LLC makes no other representations, express or implied, as to the accuracy, timeliness, or completeness of any such information or with
regard to the results to be obtained from its use.
This report’s estimated fundamental value only represents a best efforts estimate of the potential fundamental valuation of a specific security, and is not
expressed as, or implied as, assessments of the quality of a security, a summary of past performance, or an actionable investment strategy for an investor.
This is not an offer to sell or a solicitation of an offer to buy any security, nor shall any security be offered or sold to any person, in any jurisdiction in which
such offer would be unlawful under the securities laws of such jurisdiction. Spruce Point Capital Management LLC is not registered as an investment advisor,
broker/dealer, or accounting firm.
All rights reserved. This document may not be reproduced or disseminated in whole or in part without the prior written consent of Spruce Point
Capital Management LLC.
3
About Spruce Point Capital Management
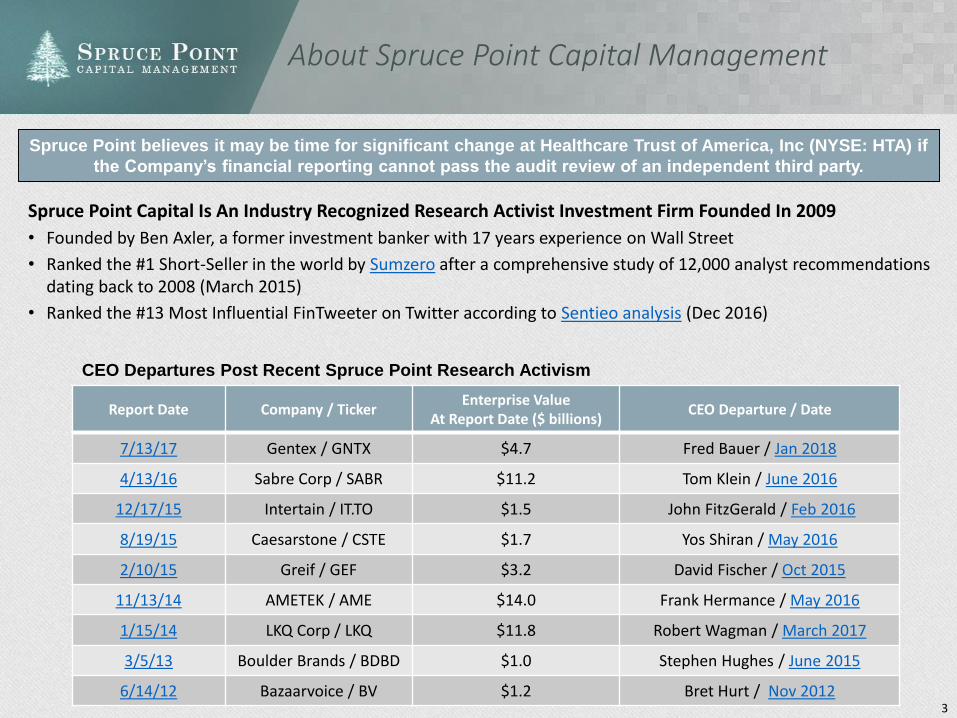
Spruce Point believes it may be time for significant change at Healthcare Trust of America, Inc (NYSE: HTA) if
the Company’s financial reporting cannot pass the audit review of an independent third party.
Report Date Company / TickerEnterprise Value
At Report Date ($ billions)CEO Departure / Date
7/13/17 Gentex / GNTX $4.7 Fred Bauer / Jan 2018
4/13/16 Sabre Corp / SABR $11.2 Tom Klein / June 2016
12/17/15 Intertain / IT.TO $1.5 John FitzGerald / Feb 2016
8/19/15 Caesarstone / CSTE $1.7 Yos Shiran / May 2016
2/10/15 Greif / GEF $3.2 David Fischer / Oct 2015
11/13/14 AMETEK / AME $14.0 Frank Hermance / May 2016
1/15/14 LKQ Corp / LKQ $11.8 Robert Wagman / March 2017
3/5/13 Boulder Brands / BDBD $1.0 Stephen Hughes / June 2015
6/14/12 Bazaarvoice / BV $1.2 Bret Hurt / Nov 2012
CEO Departures Post Recent Spruce Point Research Activism
Spruce Point Capital Is An Industry Recognized Research Activist Investment Firm Founded In 2009
• Founded by Ben Axler, a former investment banker with 17 years experience on Wall Street
• Ranked the #1 Short-Seller in the world by Sumzero after a comprehensive study of 12,000 analyst recommendations dating back to 2008 (March 2015)
• Ranked the #13 Most Influential FinTweeter on Twitter according to Sentieo analysis (Dec 2016)
Executive Summary
5
Spruce Point Is Short Healthcare Trust of America, Inc. (NYSE: HTA) And Sees 20% To 40% Downside Risk
HTA’s Chief Executive Officer Has A History of Failure And Non-Shareholder Friendly Outcomes: At Spruce Point, we like to follow executives who have destroyed shareholder value in the past as this pattern often repeats itself. HTA’s CEO and Chairman Scott Peters has been linked to multiple bankruptcies and liquidations (Grub & Ellis, NNN Realty Advisors, G REIT, T REIT, and Golf Trust of America). Furthermore, we highlight a corporate and personal web of inter-relationships that links both HTA and CEO Peters to multiple bad players in the REIT industry, including Tony Thompson who was barred by FINRA and Nick Schorsch, Former Chairman of American Realty Capital Partners (ARCP, now VEREIT (NYSE: VER)), whose firm manipulated non-GAAP results and had its CFO convicted of fraud.
HTA’s Existence Began As A Non-Traded REIT Prior To A Direct Listing On The NYSE: Spruce Point has had many successes shorting companies that have taken back-door or non-traditional listing channels to come public, most notably the early China scams. Within real estate, the Non-traded REIT (NTR) industry is known to be a conflict-ridden business. NTRs are sold to retail investors through broker-dealers who earn egregious commissions (upwards of 10%). In general, for every $10 share purchase, about $1.50 is spent on up-front fees and acquisition expenses, leaving only $8.50 to be invested. After Scott Peters (and his executive team) scraped fees from raising $2.2bn under the NTR umbrella, management listed the Company on the NYSE in 2012 without raising capital via a traditional IPO. In doing so, we believe public investors may not have received the benefits from a rigorous underwriting and due diligence IPO process.
In Our Opinion, HTA Is Likely Manipulating Its Quarterly Same-Property Cash Net Operating Income (SPNOI) Results: We have conducted a statistical analysis of quarterly SPNOI performance, and believe it is highly likely that this measure is being managed in a manner to show consistent results. In our analysis, we compared HTA’s quarterly SPNOI results with its Medical Office Building (MOB) peers. HTA demonstrates the least volatility (i.e. lowest standard deviation) by a significant margin. We point to potential accounting maneuvers and culprits of how the comparisons have remained so consistent throughout its public history, and share scary similarities of reported results with the Brixmor accounting scandal.
We Can’t Reconcile HTA’s Same-Property NOI Margin Profile: Same-property revenues have grown on avg. by 1.9% and same-property expenses are down by 1.1% since 2013, yet, there is no commensurate SPNOI margin expansion. We provide an illustration of how we believe HTA’s margin profile should be expanding according to its reporting, and illustrate why the math doesn’t appear to work. HTA may be achieving its consistent SPNOI results though uneconomic means: e.g. entering into expensive long-term fixed-price contracts, and/or selling properties at unattractive prices.
Serious Concerns With The CFO And Accounting Function: Despite CFO Robert A. Milligan claiming to have worked for Bank of America/ML from July 2007 - Jan 2012 as a VP in corporate banking advisory, there is no FINRA record to evidence his employment. Milligan’s public profile also says he is CFO/Treasurer/Secretary, yet he also signs HTA’s SEC filings as Principal Accounting Officer (he is an MBA, not a CPA). HTA has a named Chief Accounting Officer, David Gershenson, as part of its executive team. SEC rules state that the Chief Accounting Officer must sign the 10-K filing; why hasn’t he done so? HTA’s accounting function appears in disarray with a majority of the staff sitting in South Carolina, two thousand miles away from its executive office in Scottsdale, Arizona. Our analysis shows that a majority of HTA’s accounting team has been in place less than one year, suggesting significant internal turnover and an inexperienced team overseeing the numbers.
Spruce Point believes Healthcare Trust of America, Inc. (HTA or the Company) and its Audit Committee should open an
investigation into its reporting of Same-Property Cash NOI, which exhibits virtually no volatility - a statistically unlikely outcome.
6
An Audit Committee Review of HTA’s Consistent Results Should Be Conducted By A Third-Party
Management Is Incentivized To Deliver SPNOI Growth In The Exact Narrow Range That They Have Operated In: Management bonus incentives seem to neatly align to deliver SPNOI growth in the range of 2% to 3%. SPNOI growth is the most important (i.e. highest weighting) performance metric in determining management compensation. We also don’t understand why management is being compensated as if they surpassed the “3% SPNOI growth metric.” HTA has reported 2.9% annual SPNOI growth (i.e. below the 3% high target) for each of the last three years. Although, HTA has awarded its management team as if they surpassed the 3.0% SPNOI performance.
Industry Outlook For MOB REITS Is Not Favorable: Rising interest rates combined with a higher cost of equity for the public MOB REITs is leading to a higher cost of capital. HTA currently trades at a discount to the market’s estimated NAV, which makes acquisitions increasingly difficult, especially since management has shown a willingness to issue more equity in recent years. Investors have become complacent with expecting growth from acquisitions and we see the acquisition environment slowing significantly. Furthermore, private capital investors are flowing into the MOB space. These private investors seemingly have a lower cost of capital given their lower return threshold which in turn create a more competitive property acquisition market. We believe this backdrop caused management to panic into overbidding for the Duke Portfolio at an original cap-rate below 5%.
It Appears HTA’s Board Shows Signs of A Cabal of Rubber-Stamping CEO Loyalists: In the context of CEO Peters being paid $8 to $10m per year for consistently hitting magical SPNOI numbers, investors should scrutinize several directors with associations to Scott Peters past failures. Are these Board members really independent? For example, W. Bradley Blair II (co-founded Golf Trust of America with Mr. Peters) has been the Lead Independent Director and also serves on the Audit and Compensation Committee. In addition, Gary T. Wescombe (Chairman of G REIT where Mr. Peters was the former President and CEO) joined the board of HTA a month after it was formed and serves as the Chairman of the Audit Committee.
Management Constantly Promotes Its Consistency of SPNOI Results: If you preach long enough to the choir, eventually they will sing to your tune, or at least that is what it appears HTA’s management is hoping for. We highlight numerous quotes over the last three and a half years illustrating how important it is to HTA’s management to repeatedly communicate the narrative of consistent SPNOI growth. By repeatedly touting the word consistency, coupled with SPNOI results that have virtually no volatility, its easy to see how HTA can appease its dividend hungry, risk averse investors. Furthermore, management has engaged in promotional marketing of its stock to retail investors through video shows such as Mad Money and The Motley Fool. Even worse, management disguises bullish Seeking Alpha blog endorsements as company press releases, a potentially misleading tactic illustrating just how far management pushes the envelope to promote itself.
7
HTA’s Share Price Has 20% - 40% Downside Risk
Insiders Are Selling, While Passive And ETF Driven Money Is Buying, Who Is Laughing All The Way To The Bank? Spruce Point has consistently warned about the disturbing trend in the money management industry of blind index buying displacing fundamental and engaged ownership. HTA’s CEO, and all insiders combined, have been consistent net sellers of stock over the years. While increasingly using equity to fund its growth, it appears management has put no additional capital at risk to maintain ownership. As a result, insider ownership sits at an all-time low of just 0.9% percent while large institutional money managers needing to pedal REIT funds and ETFs to retail investors gobble up more shares
Analyst See 17% Upside To HTA’s Share Price, Yet Are Not Discounting Potential Financial Restatement Risks: Even with HTA’s share price down ~13% YTD, and it trading below the market’s estimated NAV, HTA told investors yesterday at the NAREIT conference it would not be a buyer of its own stock, and doesn’t see it as “accretive” at this level. Despite this bold statement, approximately 60% of sell-side analysts still have a “Buy” recommendation while the remaining 40% see its shares performing with the market as a “Neutral or Market-Perform”. Why should investors buy when: 1) Both the Company and insiders aren’t buying, and 2) Analysts covering HTA have been overly optimistic and inaccurate about their share price forecasts? We expect a further re-rating lower in the share price should HTA’s Audit Committee open an investigation into its abnormal financial reporting practices. We provide case studies to analyze what happened at other REITs with similar accounting issues surfaced: VEREIT, Inc. (VER) – formerly known as American Realty Capital Properties, Inc. (ARCP) – and Brixmor Property Group, Inc. (BRX) both fell ~40% and ~20%, respectively, after each company acknowledged manipulating certain non-GAAP metrics. In our opinion, the evidence suggests that similar irregularities may exist at HTA and we show a comparative framework between HTA and BRX. Given these precedent accounting case studies in the REIT sector, we believe HTA’s stock could trade to a range between $15 and $20 which represents approximately 20% to 40% downside
8
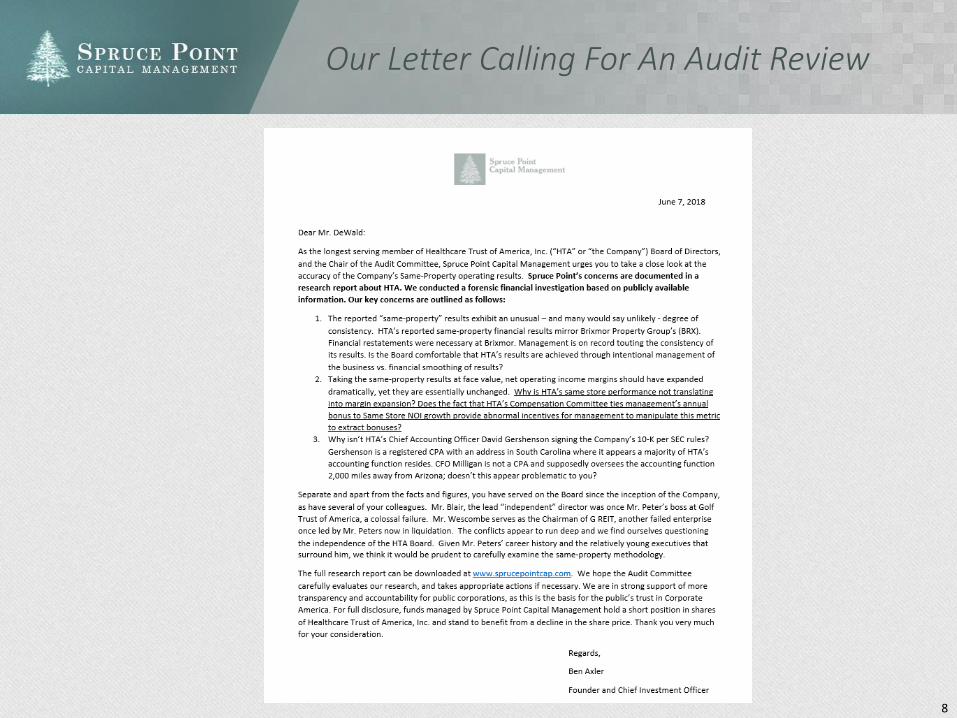
Our Letter Calling For An Audit Review
9
Capital Structure And Valuation
Source: Bloomberg and Company filings
(1) Data as of 3/31/18
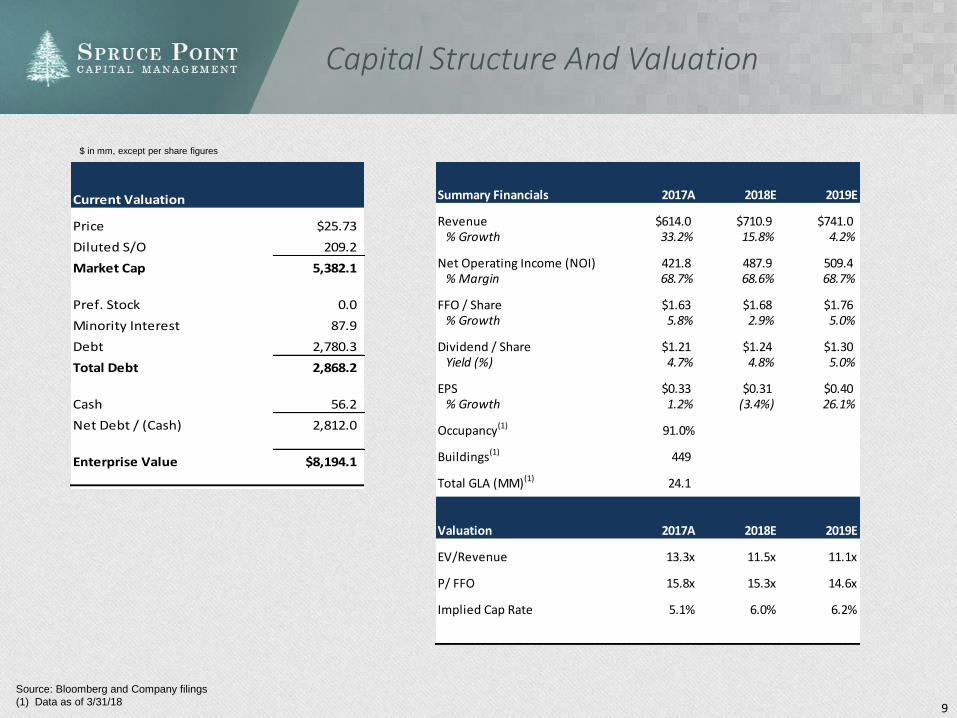
Summary Financials 2017A 2018E 2019E
Revenue $614.0 $710.9 $741.0% Growth 33.2% 15.8% 4.2%
Net Operating Income (NOI) 421.8 487.9 509.4% Margin 68.7% 68.6% 68.7%
FFO / Share $1.63 $1.68 $1.76% Growth 5.8% 2.9% 5.0%
Dividend / Share $1.21 $1.24 $1.30Yield (%) 4.7% 4.8% 5.0%
EPS $0.33 $0.31 $0.40% Growth 1.2% (3.4%) 26.1%
Occupancy(1) 91.0%
Buildings(1) 449
Total GLA (MM)(1) 24.1
Valuation 2017A 2018E 2019E
EV/Revenue 13.3x 11.5x 11.1x
P/ FFO 15.8x 15.3x 14.6x
Implied Cap Rate 5.1% 6.0% 6.2%
Healthcare Trust of America Inc Capitalization as of 06/06/18Current Valuation
Price $25.73
Diluted S/O 209.2
Market Cap 5,382.1
Pref. Stock 0.0
Minority Interest 87.9
Debt 2,780.3
Total Debt 2,868.2
Cash 56.2
Net Debt / (Cash) 2,812.0
Enterprise Value $8,194.1
$ in mm, except per share figures

A Primer on CEO Scott Peters And His Web of Sordid Relationships
11
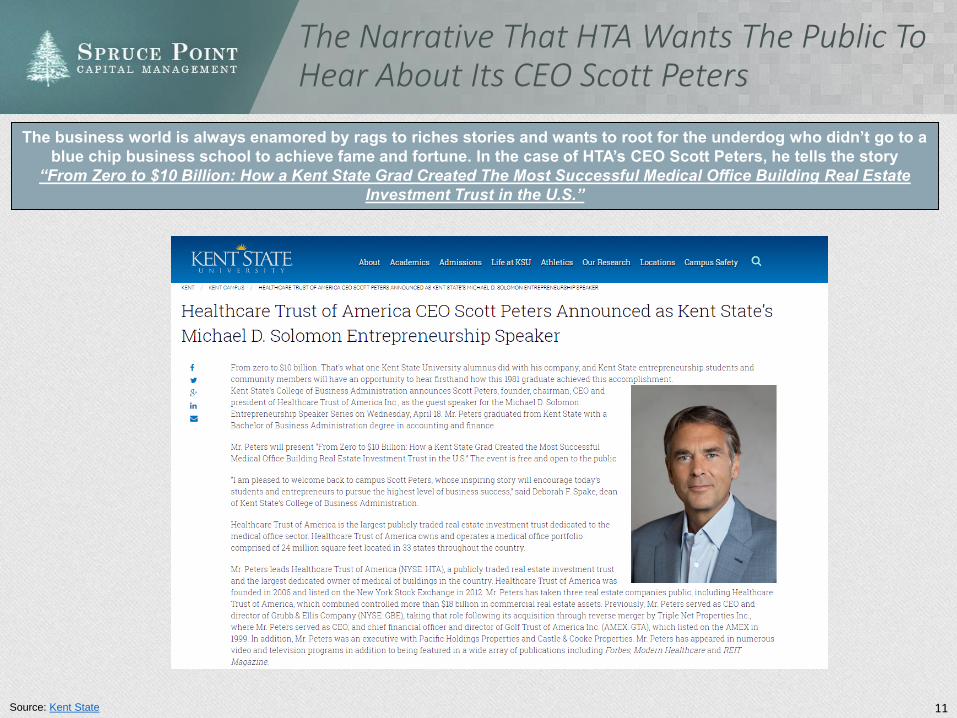
The Narrative That HTA Wants The Public To Hear About Its CEO Scott Peters
The business world is always enamored by rags to riches stories and wants to root for the underdog who didn’t go to a
blue chip business school to achieve fame and fortune. In the case of HTA’s CEO Scott Peters, he tells the story
“From Zero to $10 Billion: How a Kent State Grad Created The Most Successful Medical Office Building Real Estate
Investment Trust in the U.S.”
Source: Kent State
12
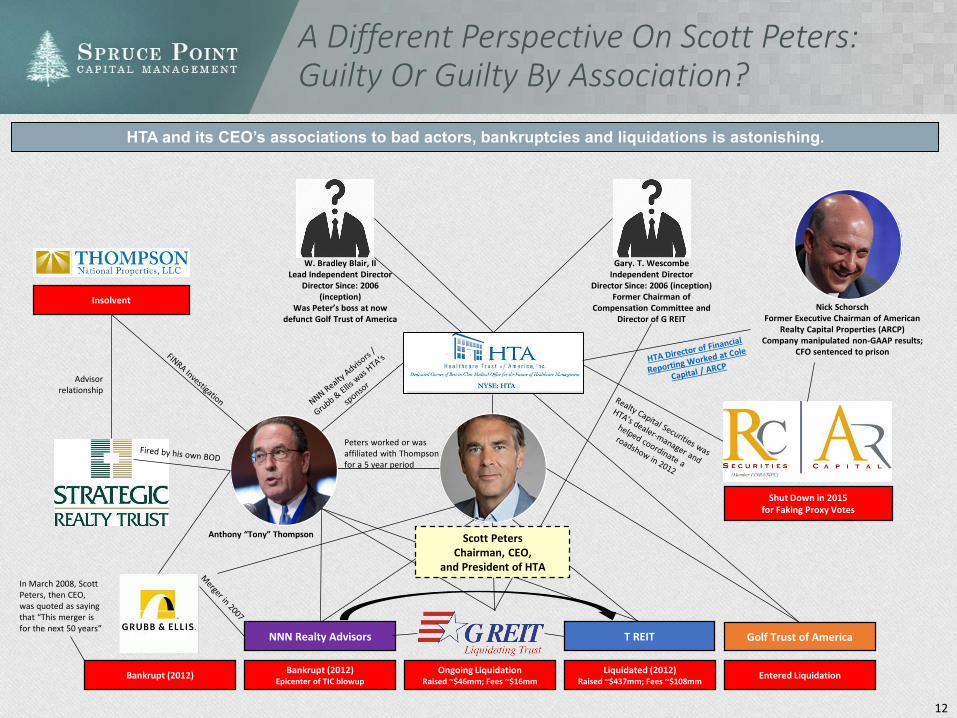
Gary. T. Wescombe Independent Director
Director Since: 2006 (inception)Former Chairman of
Compensation Committee and Director of G REIT
W. Bradley Blair, IILead Independent Director
Director Since: 2006 (inception)
Was Peter’s boss at now defunct Golf Trust of America
Bankrupt (2012)Bankrupt (2012)
Epicenter of TIC blowup
In March 2008, Scott Peters, then CEO, was quoted as saying that “This merger is for the next 50 years”
Advisor relationship
Peters worked or was affiliated with Thompson for a 5 year period
Ongoing LiquidationRaised ~$46mm; Fees ~$16mm
Liquidated (2012)Raised ~$437mm; Fees ~$108mm
Entered Liquidation
T REIT Golf Trust of AmericaNNN Realty Advisors
Shut Down in 2015 for Faking Proxy Votes
Nick SchorschFormer Executive Chairman of American
Realty Capital Properties (ARCP)Company manipulated non-GAAP results;
CFO sentenced to prison
Insolvent
Anthony “Tony” Thompson Scott PetersChairman, CEO,
and President of HTA
A Different Perspective On Scott Peters: Guilty Or Guilty By Association?
HTA and its CEO’s associations to bad actors, bankruptcies and liquidations is astonishing.
13
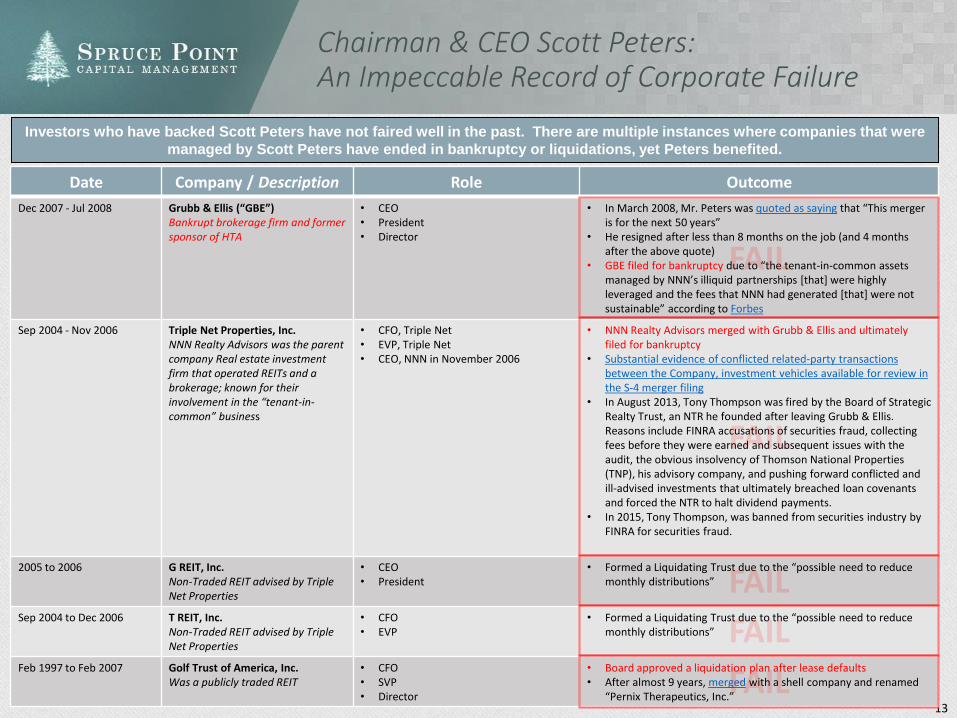
Chairman & CEO Scott Peters:An Impeccable Record of Corporate Failure
Investors who have backed Scott Peters have not faired well in the past. There are multiple instances where companies that were
managed by Scott Peters have ended in bankruptcy or liquidations, yet Peters benefited.
Date Company / Description Role Outcome
Dec 2007 - Jul 2008 Grubb & Ellis (“GBE”)Bankrupt brokerage firm and former sponsor of HTA
• CEO• President• Director
• In March 2008, Mr. Peters was quoted as saying that “This merger is for the next 50 years”
• He resigned after less than 8 months on the job (and 4 months after the above quote)
• GBE filed for bankruptcy due to “the tenant-in-common assets managed by NNN’s illiquid partnerships [that] were highly leveraged and the fees that NNN had generated [that] were not sustainable” according to Forbes
Sep 2004 - Nov 2006 Triple Net Properties, Inc.NNN Realty Advisors was the parent company Real estate investment firm that operated REITs and a brokerage; known for their involvement in the “tenant-in-common” business
• CFO, Triple Net• EVP, Triple Net• CEO, NNN in November 2006
• NNN Realty Advisors merged with Grubb & Ellis and ultimately filed for bankruptcy
• Substantial evidence of conflicted related-party transactions between the Company, investment vehicles available for review in the S-4 merger filing
• In August 2013, Tony Thompson was fired by the Board of Strategic Realty Trust, an NTR he founded after leaving Grubb & Ellis. Reasons include FINRA accusations of securities fraud, collecting fees before they were earned and subsequent issues with the audit, the obvious insolvency of Thomson National Properties (TNP), his advisory company, and pushing forward conflicted and ill-advised investments that ultimately breached loan covenants and forced the NTR to halt dividend payments.
• In 2015, Tony Thompson, was banned from securities industry by FINRA for securities fraud.
2005 to 2006 G REIT, Inc.Non-Traded REIT advised by Triple Net Properties
• CEO• President
• Formed a Liquidating Trust due to the “possible need to reduce monthly distributions”
Sep 2004 to Dec 2006 T REIT, Inc.Non-Traded REIT advised by Triple Net Properties
• CFO• EVP
• Formed a Liquidating Trust due to the “possible need to reduce monthly distributions”
Feb 1997 to Feb 2007 Golf Trust of America, Inc.Was a publicly traded REIT
• CFO• SVP• Director
• Board approved a liquidation plan after lease defaults• After almost 9 years, merged with a shell company and renamed
“Pernix Therapeutics, Inc.”
14
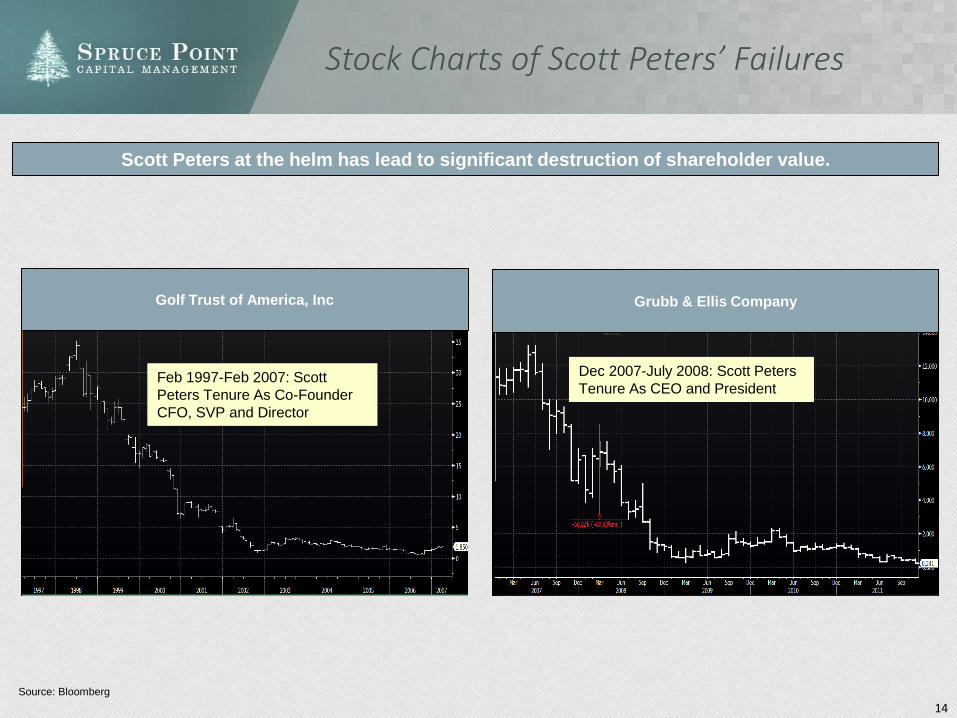
Stock Charts of Scott Peters’ Failures
Scott Peters at the helm has lead to significant destruction of shareholder value.
Feb 1997-Feb 2007: Scott
Peters Tenure As Co-Founder
CFO, SVP and Director
Golf Trust of America, Inc Grubb & Ellis Company
Dec 2007-July 2008: Scott Peters
Tenure As CEO and President
Source: Bloomberg
15
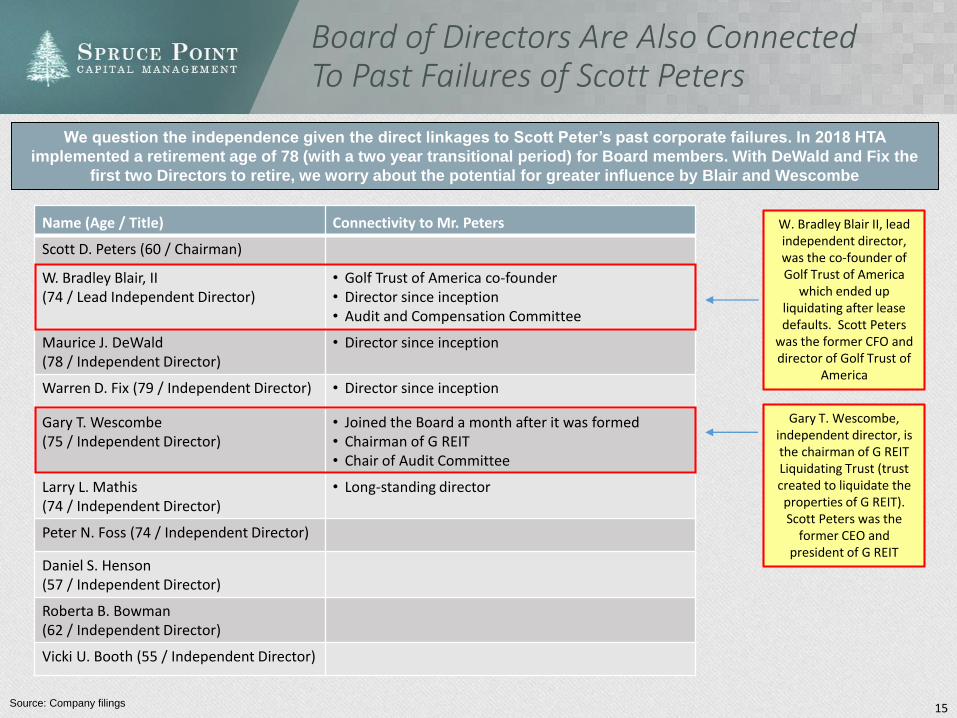
Board of Directors Are Also Connected To Past Failures of Scott Peters
Source: Company filings
W. Bradley Blair II, lead independent director, was the co-founder of Golf Trust of America
which ended up liquidating after lease defaults. Scott Peters
was the former CFO and director of Golf Trust of
America
Gary T. Wescombe, independent director, is the chairman of G REIT Liquidating Trust (trust created to liquidate the properties of G REIT). Scott Peters was the
former CEO and president of G REIT
We question the independence given the direct linkages to Scott Peter’s past corporate failures. In 2018 HTA
implemented a retirement age of 78 (with a two year transitional period) for Board members. With DeWald and Fix the
first two Directors to retire, we worry about the potential for greater influence by Blair and Wescombe
Name (Age / Title) Connectivity to Mr. Peters
Scott D. Peters (60 / Chairman)
W. Bradley Blair, II (74 / Lead Independent Director)
• Golf Trust of America co-founder• Director since inception• Audit and Compensation Committee
Maurice J. DeWald (78 / Independent Director)
• Director since inception
Warren D. Fix (79 / Independent Director) • Director since inception
Gary T. Wescombe (75 / Independent Director)
• Joined the Board a month after it was formed• Chairman of G REIT• Chair of Audit Committee
Larry L. Mathis (74 / Independent Director)
• Long-standing director
Peter N. Foss (74 / Independent Director)
Daniel S. Henson (57 / Independent Director)
Roberta B. Bowman (62 / Independent Director)
Vicki U. Booth (55 / Independent Director)
16
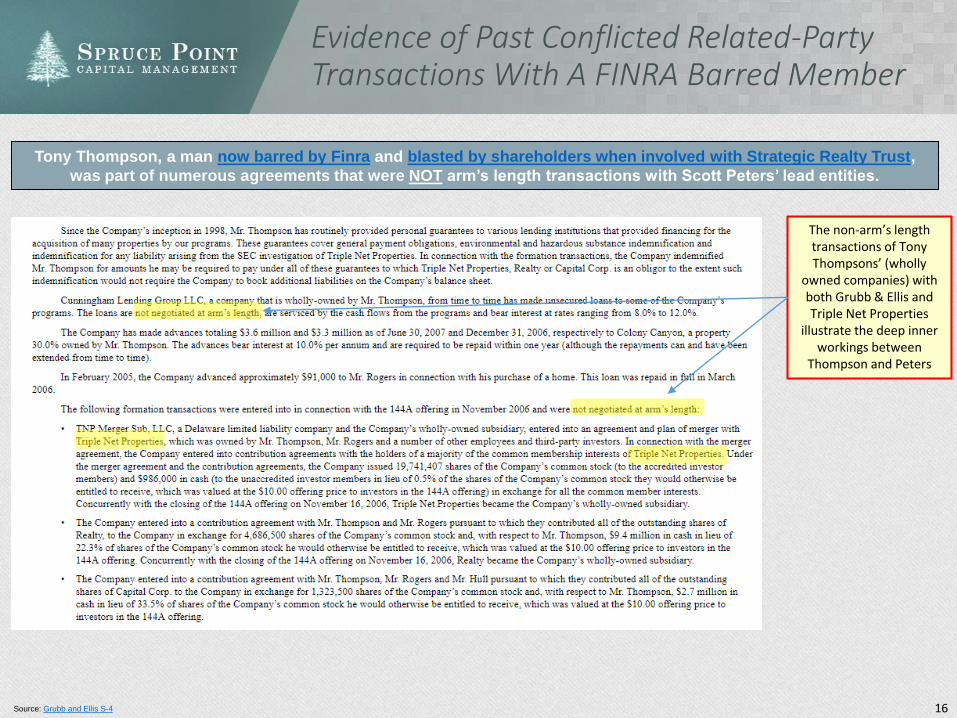
Evidence of Past Conflicted Related-Party Transactions With A FINRA Barred Member
Source: Grubb and Ellis S-4
Tony Thompson, a man now barred by Finra and blasted by shareholders when involved with Strategic Realty Trust,
was part of numerous agreements that were NOT arm’s length transactions with Scott Peters’ lead entities.
The non-arm’s length transactions of Tony Thompsons’ (wholly
owned companies) with both Grubb & Ellis and Triple Net Properties
illustrate the deep inner workings between
Thompson and Peters
HTA’s Statistically Improbable “Consistent” Results
18
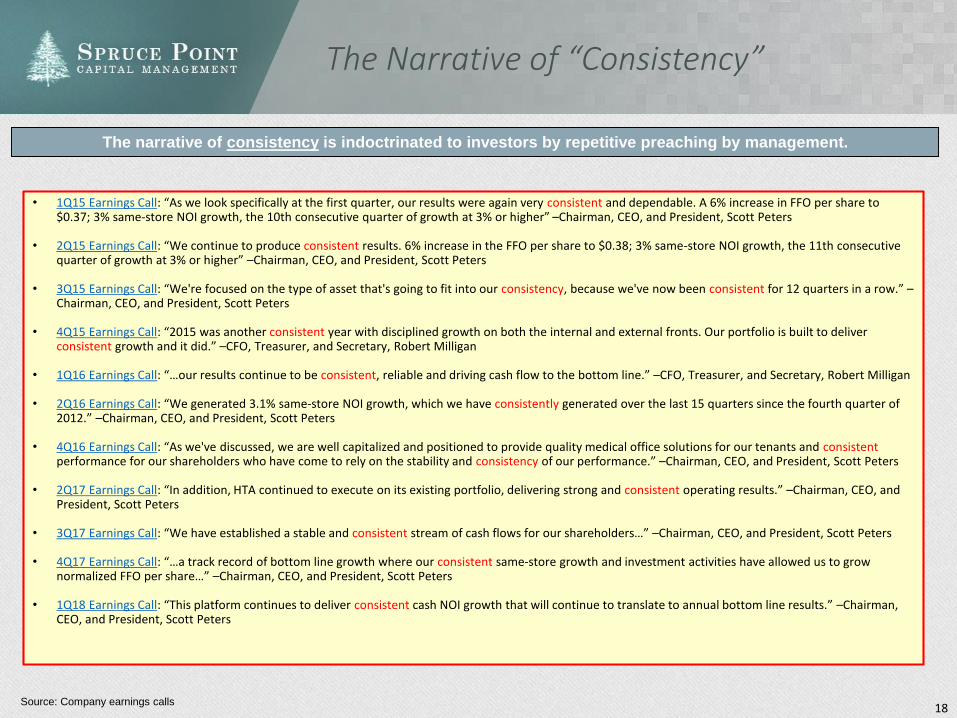
The Narrative of “Consistency”
• 1Q15 Earnings Call: “As we look specifically at the first quarter, our results were again very consistent and dependable. A 6% increase in FFO per share to $0.37; 3% same-store NOI growth, the 10th consecutive quarter of growth at 3% or higher” –Chairman, CEO, and President, Scott Peters
• 2Q15 Earnings Call: “We continue to produce consistent results. 6% increase in the FFO per share to $0.38; 3% same-store NOI growth, the 11th consecutive quarter of growth at 3% or higher” –Chairman, CEO, and President, Scott Peters
• 3Q15 Earnings Call: “We're focused on the type of asset that's going to fit into our consistency, because we've now been consistent for 12 quarters in a row.” –Chairman, CEO, and President, Scott Peters
• 4Q15 Earnings Call: “2015 was another consistent year with disciplined growth on both the internal and external fronts. Our portfolio is built to deliver consistent growth and it did.” –CFO, Treasurer, and Secretary, Robert Milligan
• 1Q16 Earnings Call: “…our results continue to be consistent, reliable and driving cash flow to the bottom line.” –CFO, Treasurer, and Secretary, Robert Milligan
• 2Q16 Earnings Call: “We generated 3.1% same-store NOI growth, which we have consistently generated over the last 15 quarters since the fourth quarter of 2012.” –Chairman, CEO, and President, Scott Peters
• 4Q16 Earnings Call: “As we've discussed, we are well capitalized and positioned to provide quality medical office solutions for our tenants and consistentperformance for our shareholders who have come to rely on the stability and consistency of our performance.” –Chairman, CEO, and President, Scott Peters
• 2Q17 Earnings Call: “In addition, HTA continued to execute on its existing portfolio, delivering strong and consistent operating results.” –Chairman, CEO, and President, Scott Peters
• 3Q17 Earnings Call: “We have established a stable and consistent stream of cash flows for our shareholders…” –Chairman, CEO, and President, Scott Peters
• 4Q17 Earnings Call: “…a track record of bottom line growth where our consistent same-store growth and investment activities have allowed us to grow normalized FFO per share…” –Chairman, CEO, and President, Scott Peters
• 1Q18 Earnings Call: “This platform continues to deliver consistent cash NOI growth that will continue to translate to annual bottom line results.” –Chairman, CEO, and President, Scott Peters
Source: Company earnings calls
The narrative of consistency is indoctrinated to investors by repetitive preaching by management.
19
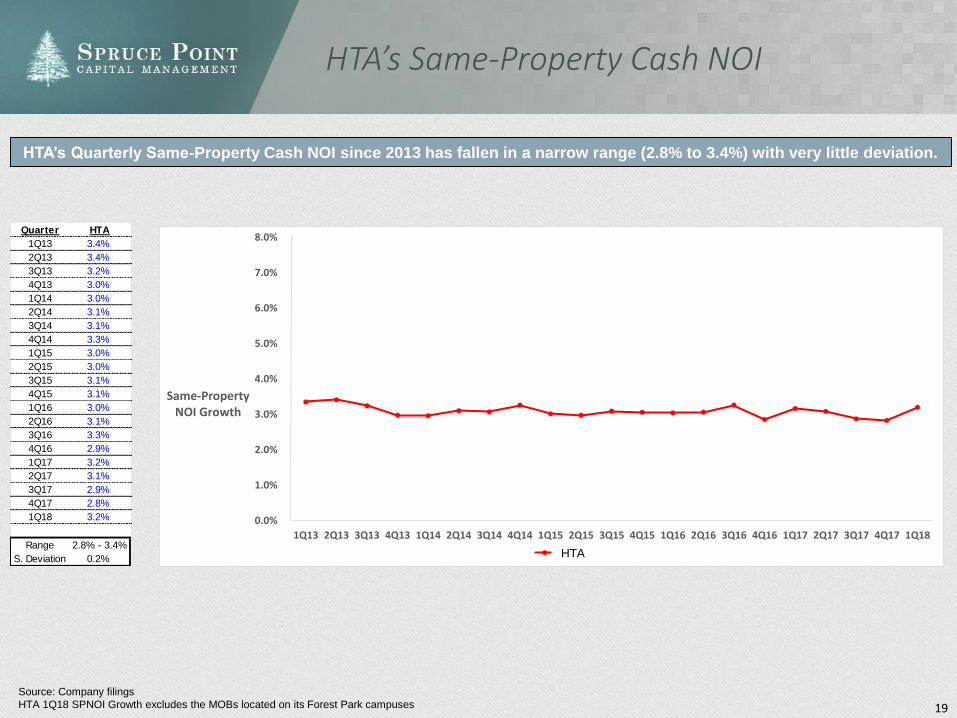
HTA’s Same-Property Cash NOI
Source: Company filings
HTA 1Q18 SPNOI Growth excludes the MOBs located on its Forest Park campuses
HTA’s Quarterly Same-Property Cash NOI since 2013 has fallen in a narrow range (2.8% to 3.4%) with very little deviation.
Quarter HTA
1Q13 3.4%
2Q13 3.4%
3Q13 3.2%
4Q13 3.0%
1Q14 3.0%
2Q14 3.1%
3Q14 3.1%
4Q14 3.3%
1Q15 3.0%
2Q15 3.0%
3Q15 3.1%
4Q15 3.1%
1Q16 3.0%
2Q16 3.1%
3Q16 3.3%
4Q16 2.9%
1Q17 3.2%
2Q17 3.1%
3Q17 2.9%
4Q17 2.8%
1Q18 3.2%
Range 2.8% - 3.4%
S. Deviation 0.2%
0.0%
1.0%
2.0%
3.0%
4.0%
5.0%
6.0%
7.0%
8.0%
1Q13 2Q13 3Q13 4Q13 1Q14 2Q14 3Q14 4Q14 1Q15 2Q15 3Q15 4Q15 1Q16 2Q16 3Q16 4Q16 1Q17 2Q17 3Q17 4Q17 1Q18
Same-Property NOI Growth
HTAHTA
20
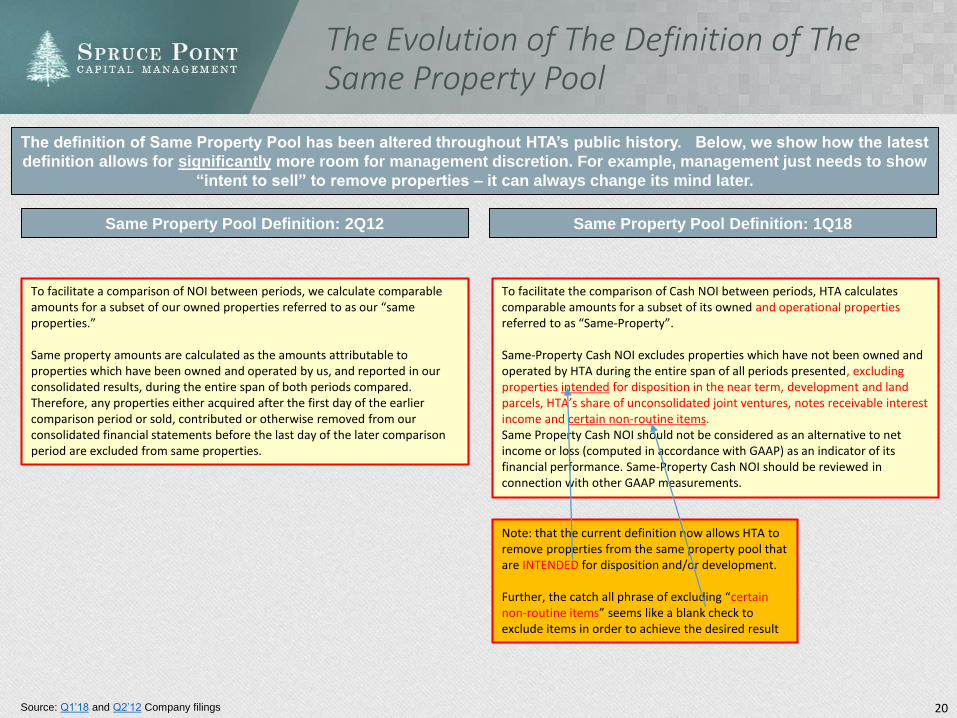
The Evolution of The Definition of The Same Property Pool
Source: Q1’18 and Q2’12 Company filings
The definition of Same Property Pool has been altered throughout HTA’s public history. Below, we show how the latest
definition allows for significantly more room for management discretion. For example, management just needs to show
“intent to sell” to remove properties – it can always change its mind later.
Same Property Pool Definition: 2Q12 Same Property Pool Definition: 1Q18
To facilitate a comparison of NOI between periods, we calculate comparable amounts for a subset of our owned properties referred to as our “same properties.”
Same property amounts are calculated as the amounts attributable to properties which have been owned and operated by us, and reported in our consolidated results, during the entire span of both periods compared. Therefore, any properties either acquired after the first day of the earlier comparison period or sold, contributed or otherwise removed from our consolidated financial statements before the last day of the later comparison period are excluded from same properties.
To facilitate the comparison of Cash NOI between periods, HTA calculates comparable amounts for a subset of its owned and operational propertiesreferred to as “Same-Property”.
Same-Property Cash NOI excludes properties which have not been owned and operated by HTA during the entire span of all periods presented, excluding properties intended for disposition in the near term, development and land parcels, HTA’s share of unconsolidated joint ventures, notes receivable interest income and certain non-routine items. Same Property Cash NOI should not be considered as an alternative to net income or loss (computed in accordance with GAAP) as an indicator of its financial performance. Same-Property Cash NOI should be reviewed in connection with other GAAP measurements.
Note: that the current definition now allows HTA to remove properties from the same property pool that are INTENDED for disposition and/or development.
Further, the catch all phrase of excluding “certain non-routine items” seems like a blank check to exclude items in order to achieve the desired result
21
2.8%
1.6%
0.2% 0.0%
1.0%
0.4%
3.1%
2.5%
1.7%
2.5% 2.4%
4.0%
3.3% 3.1%
4.2% 4.4%
6.7%
7.1%
0.0%
1.0%
2.0%
3.0%
4.0%
5.0%
6.0%
7.0%
8.0%
HTA WELL VTR HCP DOC HR
Range ofSSNOI
GrowthOverTime
Low Average High
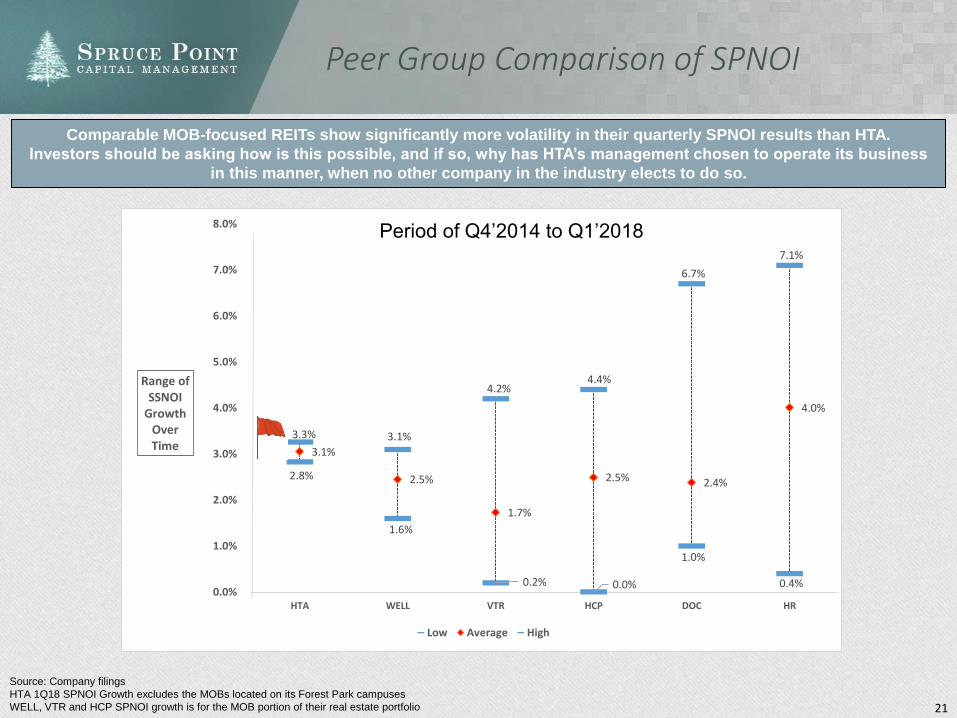
Peer Group Comparison of SPNOI
Source: Company filings
HTA 1Q18 SPNOI Growth excludes the MOBs located on its Forest Park campuses
WELL, VTR and HCP SPNOI growth is for the MOB portion of their real estate portfolio
Comparable MOB-focused REITs show significantly more volatility in their quarterly SPNOI results than HTA.
Investors should be asking how is this possible, and if so, why has HTA’s management chosen to operate its business
in this manner, when no other company in the industry elects to do so.
Period of Q4’2014 to Q1’2018
22
Weaknesses In The Accounting Organization
1) We observe that Mr. Gershenson worked at BDO and has his CPA address
registered in South Carolina. He likely audited Golf Trust of America, the CEO’s former
company which was based also in South Carolina and audited by BDO
Source: Company Filings, LinkedIn.com
2) SEC 10-K Part D. (2)(a): “The report must be signed by the registrant, and on behalf
of the registrant by its principal executive officer or officers, its principal financial officer
or officers, its controller or principal accounting officer, and by at least
the majority of the board of directors or persons performing similar functions”
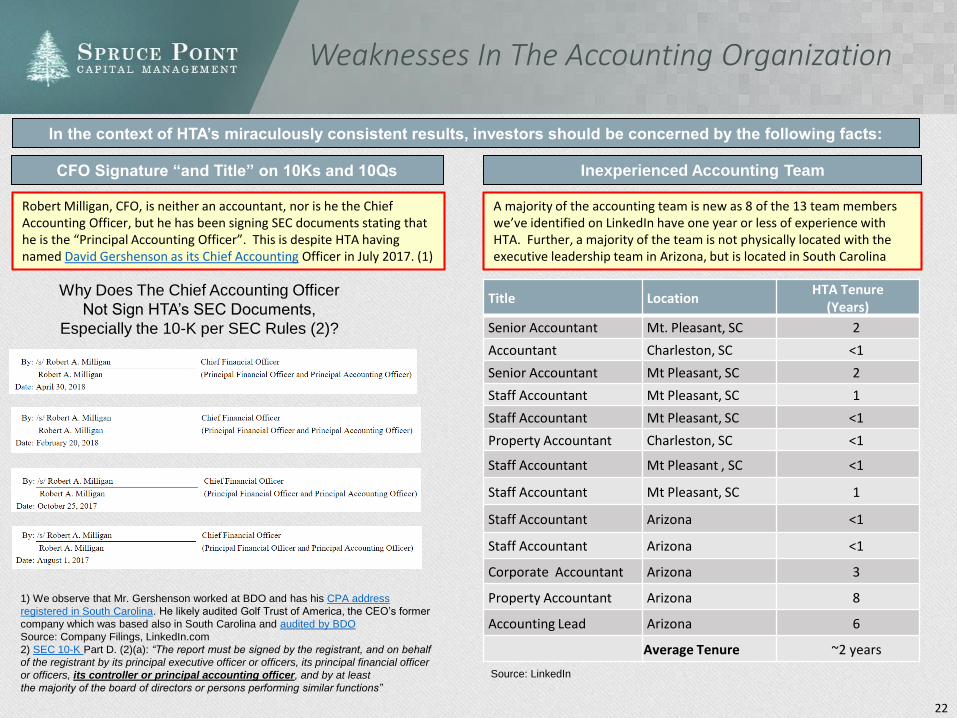
A majority of the accounting team is new as 8 of the 13 team members we’ve identified on LinkedIn have one year or less of experience with HTA. Further, a majority of the team is not physically located with the executive leadership team in Arizona, but is located in South Carolina
Robert Milligan, CFO, is neither an accountant, nor is he the Chief Accounting Officer, but he has been signing SEC documents stating that he is the “Principal Accounting Officer”. This is despite HTA having named David Gershenson as its Chief Accounting Officer in July 2017. (1)
Inexperienced Accounting TeamCFO Signature “and Title” on 10Ks and 10Qs
Title LocationHTA Tenure
(Years)
Senior Accountant Mt. Pleasant, SC 2
Accountant Charleston, SC <1
Senior Accountant Mt Pleasant, SC 2
Staff Accountant Mt Pleasant, SC 1
Staff Accountant Mt Pleasant, SC <1
Property Accountant Charleston, SC <1
Staff Accountant Mt Pleasant , SC <1
Staff Accountant Mt Pleasant, SC 1
Staff Accountant Arizona <1
Staff Accountant Arizona <1
Corporate Accountant Arizona 3
Property Accountant Arizona 8
Accounting Lead Arizona 6
Average Tenure ~2 years
Why Does The Chief Accounting Officer
Not Sign HTA’s SEC Documents,
Especially the 10-K per SEC Rules (2)?
Source: LinkedIn
In the context of HTA’s miraculously consistent results, investors should be concerned by the following facts:
23
Potential Culprits: SSPOI Comparison of 2015 vs. 2014
Source: 2 & 3‐YEAR SAME PROPERTY GROWTH (2/16/17), FY15 Proxy. All figures $ in millions
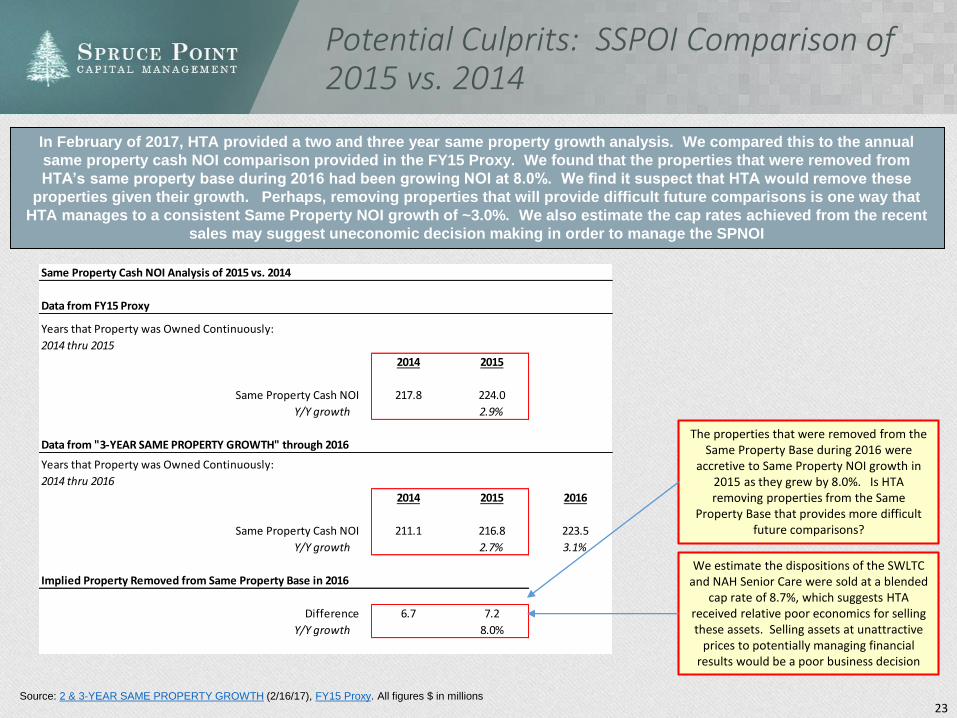
In February of 2017, HTA provided a two and three year same property growth analysis. We compared this to the annual
same property cash NOI comparison provided in the FY15 Proxy. We found that the properties that were removed from
HTA’s same property base during 2016 had been growing NOI at 8.0%. We find it suspect that HTA would remove these
properties given their growth. Perhaps, removing properties that will provide difficult future comparisons is one way that
HTA manages to a consistent Same Property NOI growth of ~3.0%. We also estimate the cap rates achieved from the recent
sales may suggest uneconomic decision making in order to manage the SPNOI
The properties that were removed from the Same Property Base during 2016 were
accretive to Same Property NOI growth in 2015 as they grew by 8.0%. Is HTA removing properties from the Same
Property Base that provides more difficult future comparisons?
Same Property Cash NOI Analysis of 2015 vs. 2014
Data from FY15 Proxy
Years that Property was Owned Continuously:
2014 thru 2015
2014 2015
Same Property Cash NOI 217.8 224.0
Y/Y growth 2.9%
Data from "3‐YEAR SAME PROPERTY GROWTH" through 2016
Years that Property was Owned Continuously:
2014 thru 2016
2014 2015 2016
Same Property Cash NOI 211.1 216.8 223.5
Y/Y growth 2.7% 3.1%
Implied Property Removed from Same Property Base in 2016
Difference 6.7 7.2
Y/Y growth 8.0%
We estimate the dispositions of the SWLTC and NAH Senior Care were sold at a blended
cap rate of 8.7%, which suggests HTA received relative poor economics for selling these assets. Selling assets at unattractive
prices to potentially managing financial results would be a poor business decision
24
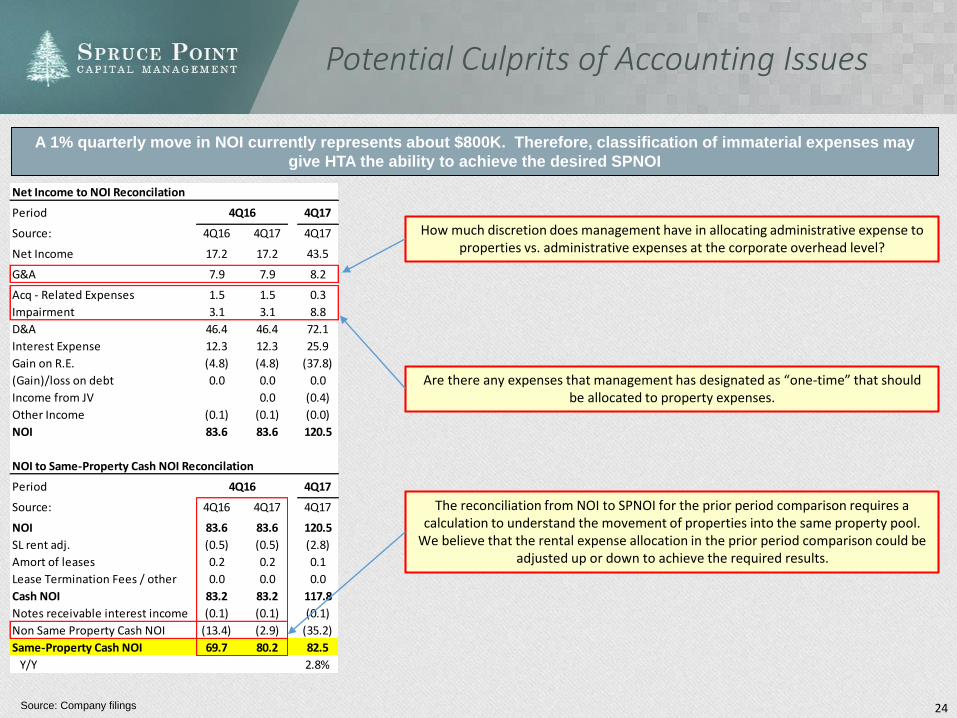
Net Income to NOI Reconcilation
Period 4Q16 4Q17
Source: 4Q16 4Q17 4Q17
Net Income 17.2 17.2 43.5
G&A 7.9 7.9 8.2
Acq - Related Expenses 1.5 1.5 0.3
Impairment 3.1 3.1 8.8
D&A 46.4 46.4 72.1
Interest Expense 12.3 12.3 25.9
Gain on R.E. (4.8) (4.8) (37.8)
(Gain)/loss on debt 0.0 0.0 0.0
Income from JV 0.0 (0.4)
Other Income (0.1) (0.1) (0.0)
NOI 83.6 83.6 120.5
NOI to Same-Property Cash NOI Reconcilation
Period 4Q16 4Q17
Source: 4Q16 4Q17 4Q17
NOI 83.6 83.6 120.5
SL rent adj. (0.5) (0.5) (2.8)
Amort of leases 0.2 0.2 0.1
Lease Termination Fees / other 0.0 0.0 0.0
Cash NOI 83.2 83.2 117.8
Notes receivable interest income (0.1) (0.1) (0.1)
Non Same Property Cash NOI (13.4) (2.9) (35.2)
Same-Property Cash NOI 69.7 80.2 82.5
Y/Y 2.8%
Potential Culprits of Accounting Issues
Source: Company filings
A 1% quarterly move in NOI currently represents about $800K. Therefore, classification of immaterial expenses may
give HTA the ability to achieve the desired SPNOI
How much discretion does management have in allocating administrative expense to properties vs. administrative expenses at the corporate overhead level?
Are there any expenses that management has designated as “one-time” that should be allocated to property expenses.
The reconciliation from NOI to SPNOI for the prior period comparison requires a calculation to understand the movement of properties into the same property pool.
We believe that the rental expense allocation in the prior period comparison could be adjusted up or down to achieve the required results.
25
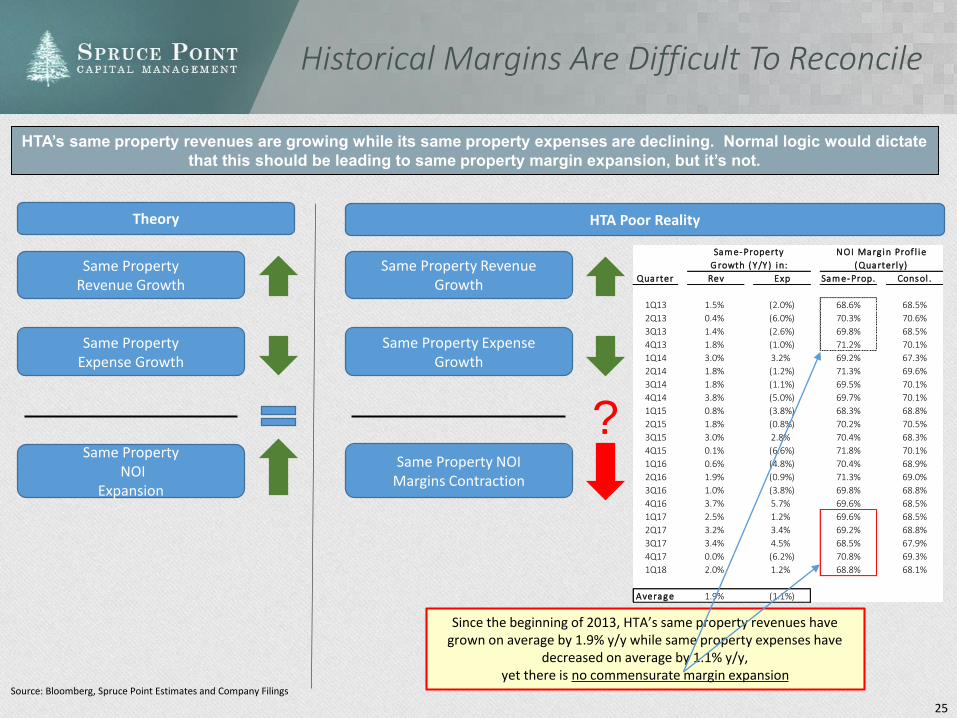
Sam e-Property NOI Marg in Prof l ie
G rowth ( Y /Y ) in: ( Quarterly)
Quarter Rev Exp Sam e-Prop. Consol .
1Q13 1.5% (2.0%) 68.6% 68.5%
2Q13 0.4% (6.0%) 70.3% 70.6%
3Q13 1.4% (2.6%) 69.8% 68.5%
4Q13 1.8% (1.0%) 71.2% 70.1%
1Q14 3.0% 3.2% 69.2% 67.3%
2Q14 1.8% (1.2%) 71.3% 69.6%
3Q14 1.8% (1.1%) 69.5% 70.1%
4Q14 3.8% (5.0%) 69.7% 70.1%
1Q15 0.8% (3.8%) 68.3% 68.8%
2Q15 1.8% (0.8%) 70.2% 70.5%
3Q15 3.0% 2.8% 70.4% 68.3%
4Q15 0.1% (6.6%) 71.8% 70.1%
1Q16 0.6% (4.8%) 70.4% 68.9%
2Q16 1.9% (0.9%) 71.3% 69.0%
3Q16 1.0% (3.8%) 69.8% 68.8%
4Q16 3.7% 5.7% 69.6% 68.5%
1Q17 2.5% 1.2% 69.6% 68.5%
2Q17 3.2% 3.4% 69.2% 68.8%
3Q17 3.4% 4.5% 68.5% 67.9%
4Q17 0.0% (6.2%) 70.8% 69.3%
1Q18 2.0% 1.2% 68.8% 68.1%
Averag e 1.9% (1.1%)
HTA’s same property revenues are growing while its same property expenses are declining. Normal logic would dictate
that this should be leading to same property margin expansion, but it’s not.
Source: Bloomberg, Spruce Point Estimates and Company Filings
Theory
Same Property Revenue Growth
Historical Margins Are Difficult To Reconcile
Same Property Expense Growth
Same PropertyNOI
Expansion
HTA Poor Reality
Same Property Revenue Growth
Same Property ExpenseGrowth
Same Property NOI Margins Contraction
Since the beginning of 2013, HTA’s same property revenues have grown on average by 1.9% y/y while same property expenses have
decreased on average by 1.1% y/y, yet there is no commensurate margin expansion
?
26
Surprise! HTA Management Incentivized For SPNOI Growth Around 3%
Source: Proxies (2014, 2015, 2016, 2017, 2018)
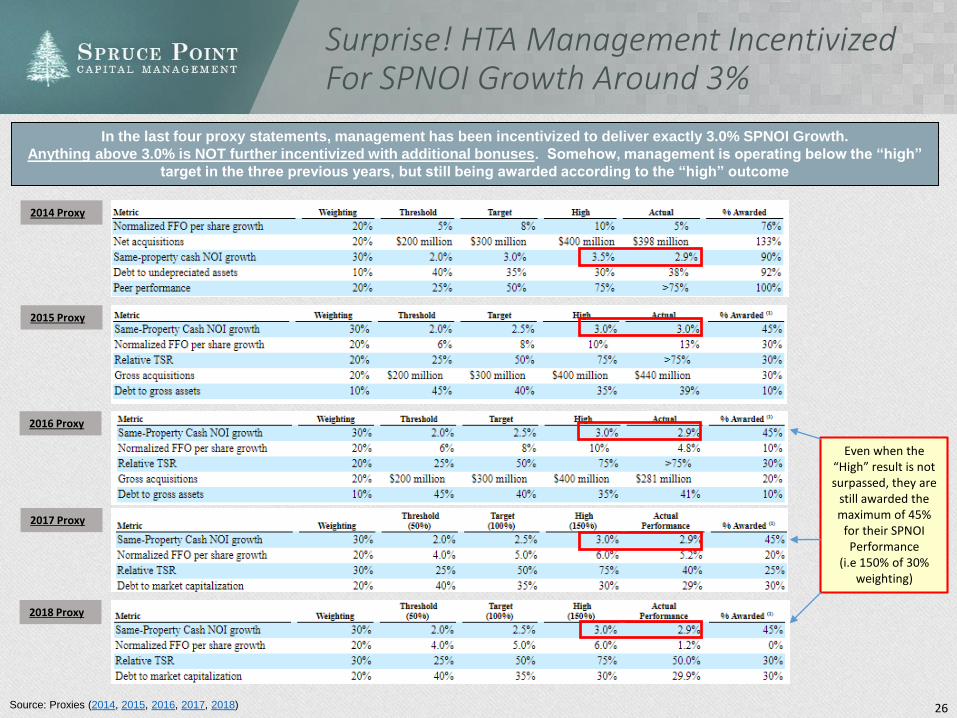
In the last four proxy statements, management has been incentivized to deliver exactly 3.0% SPNOI Growth.
Anything above 3.0% is NOT further incentivized with additional bonuses. Somehow, management is operating below the “high”
target in the three previous years, but still being awarded according to the “high” outcome
2014 Proxy
2015 Proxy
2016 Proxy
2017 Proxy
2018 Proxy
Even when the “High” result is not surpassed, they are
still awarded the maximum of 45%
for their SPNOI Performance
(i.e 150% of 30% weighting)
27
Pay Close Attention To Slide Change, Made At The NAREIT Conf June 6th
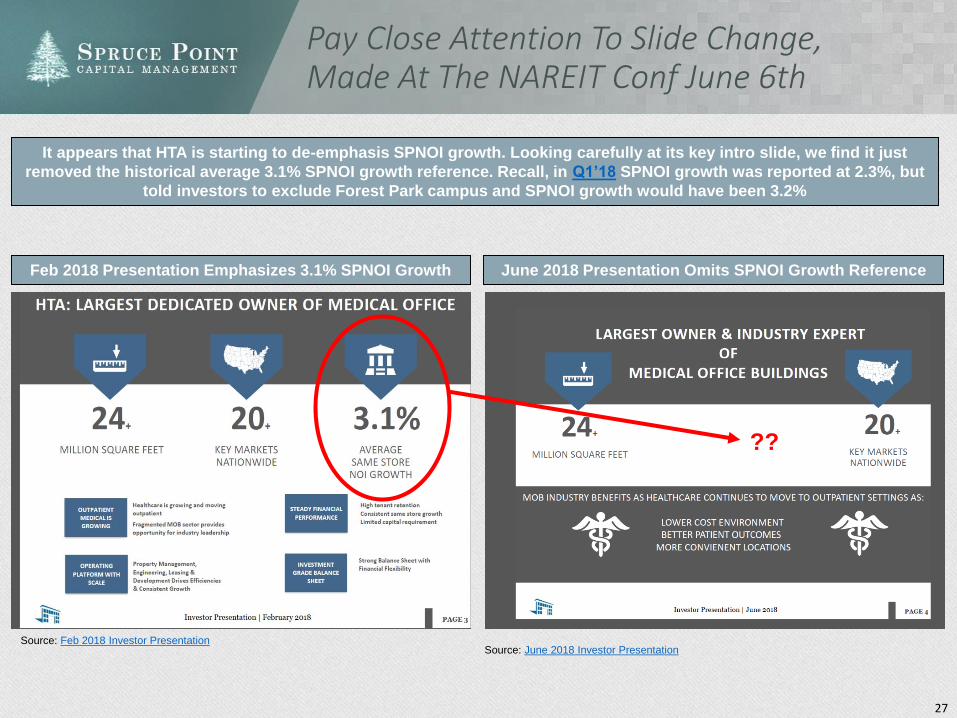
It appears that HTA is starting to de-emphasis SPNOI growth. Looking carefully at its key intro slide, we find it just
removed the historical average 3.1% SPNOI growth reference. Recall, in Q1’18 SPNOI growth was reported at 2.3%, but
told investors to exclude Forest Park campus and SPNOI growth would have been 3.2%
Source: June 2018 Investor PresentationSource: Feb 2018 Investor Presentation
Feb 2018 Presentation Emphasizes 3.1% SPNOI Growth June 2018 Presentation Omits SPNOI Growth Reference
??
The Stock Promotion of HTA
29
Promotional CEO Pitching Stock To Retail Investors
Source: CNBC, “Does HTA Have A Clean Bill of Health”, May 20, 2013 Source: Motley Fool, “Healthcare Trust Of America Gets a Big Upgrade”, May 20, 2014
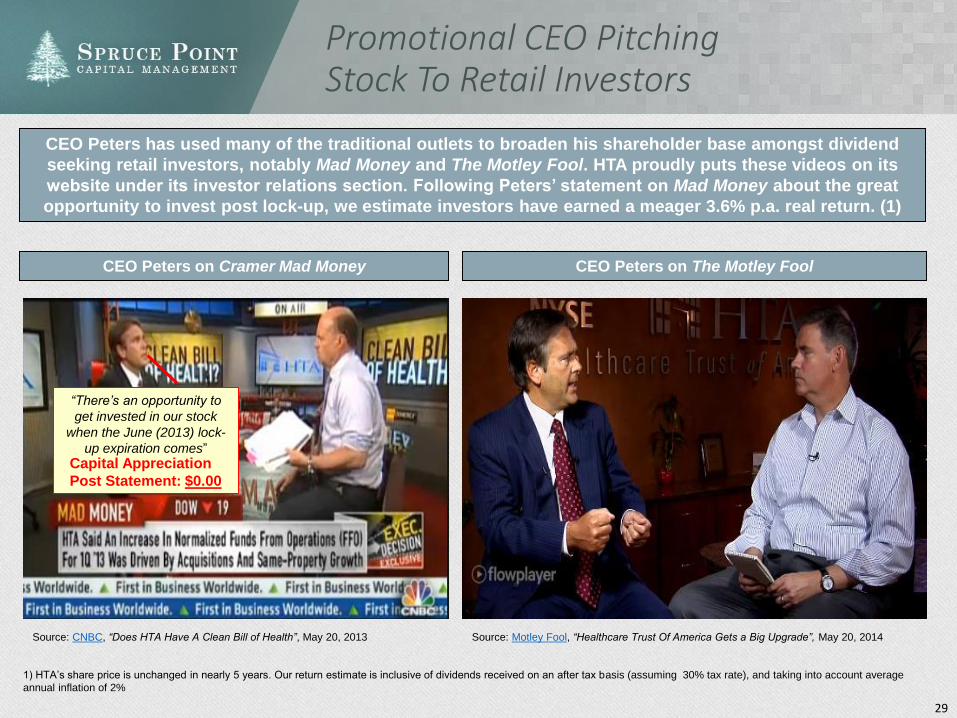
“There’s an opportunity to
get invested in our stock
when the June (2013) lock-
up expiration comes”Capital Appreciation
Post Statement: $0.00
CEO Peters on Cramer Mad Money CEO Peters on The Motley Fool
CEO Peters has used many of the traditional outlets to broaden his shareholder base amongst dividend
seeking retail investors, notably Mad Money and The Motley Fool. HTA proudly puts these videos on its
website under its investor relations section. Following Peters’ statement on Mad Money about the great
opportunity to invest post lock-up, we estimate investors have earned a meager 3.6% p.a. real return. (1)
1) HTA’s share price is unchanged in nearly 5 years. Our return estimate is inclusive of dividends received on an after tax basis (assuming 30% tax rate), and taking into account average
annual inflation of 2%
30
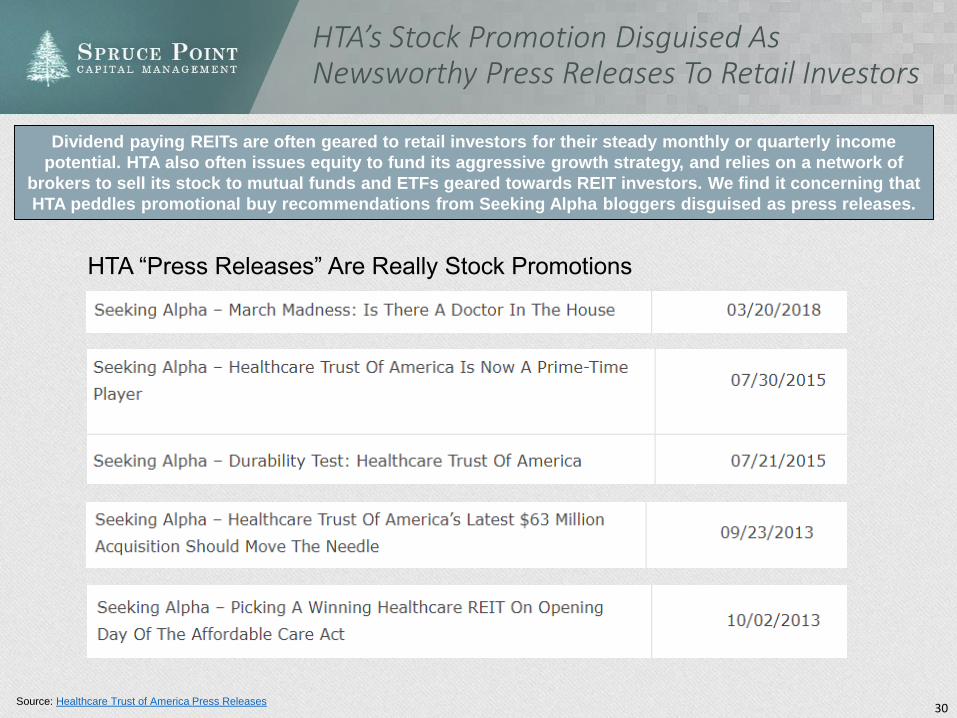
HTA’s Stock Promotion Disguised As Newsworthy Press Releases To Retail Investors
Dividend paying REITs are often geared to retail investors for their steady monthly or quarterly income
potential. HTA also often issues equity to fund its aggressive growth strategy, and relies on a network of
brokers to sell its stock to mutual funds and ETFs geared towards REIT investors. We find it concerning that
HTA peddles promotional buy recommendations from Seeking Alpha bloggers disguised as press releases.
Source: Healthcare Trust of America Press Releases
HTA “Press Releases” Are Really Stock Promotions
31
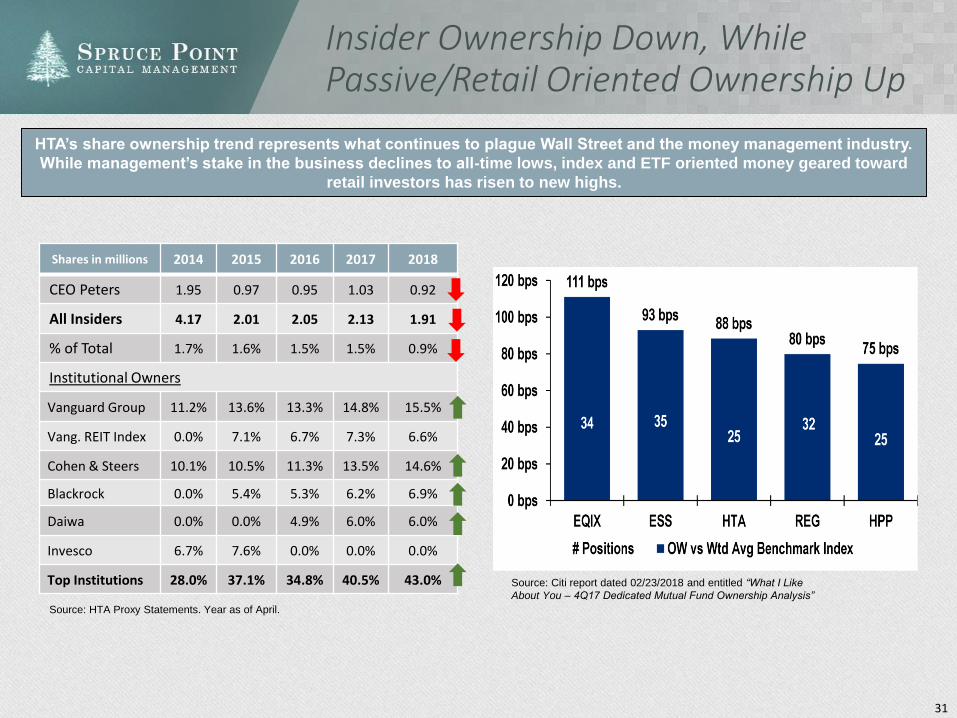
Insider Ownership Down, While Passive/Retail Oriented Ownership Up
Source: Citi report dated 02/23/2018 and entitled “What I Like
About You – 4Q17 Dedicated Mutual Fund Ownership Analysis”
Shares in millions 2014 2015 2016 2017 2018
CEO Peters 1.95 0.97 0.95 1.03 0.92
All Insiders 4.17 2.01 2.05 2.13 1.91
% of Total 1.7% 1.6% 1.5% 1.5% 0.9%
Institutional Owners
Vanguard Group 11.2% 13.6% 13.3% 14.8% 15.5%
Vang. REIT Index 0.0% 7.1% 6.7% 7.3% 6.6%
Cohen & Steers 10.1% 10.5% 11.3% 13.5% 14.6%
Blackrock 0.0% 5.4% 5.3% 6.2% 6.9%
Daiwa 0.0% 0.0% 4.9% 6.0% 6.0%
Invesco 6.7% 7.6% 0.0% 0.0% 0.0%
Top Institutions 28.0% 37.1% 34.8% 40.5% 43.0%
Source: HTA Proxy Statements. Year as of April.
HTA’s share ownership trend represents what continues to plague Wall Street and the money management industry.
While management’s stake in the business declines to all-time lows, index and ETF oriented money geared toward
retail investors has risen to new highs.
32
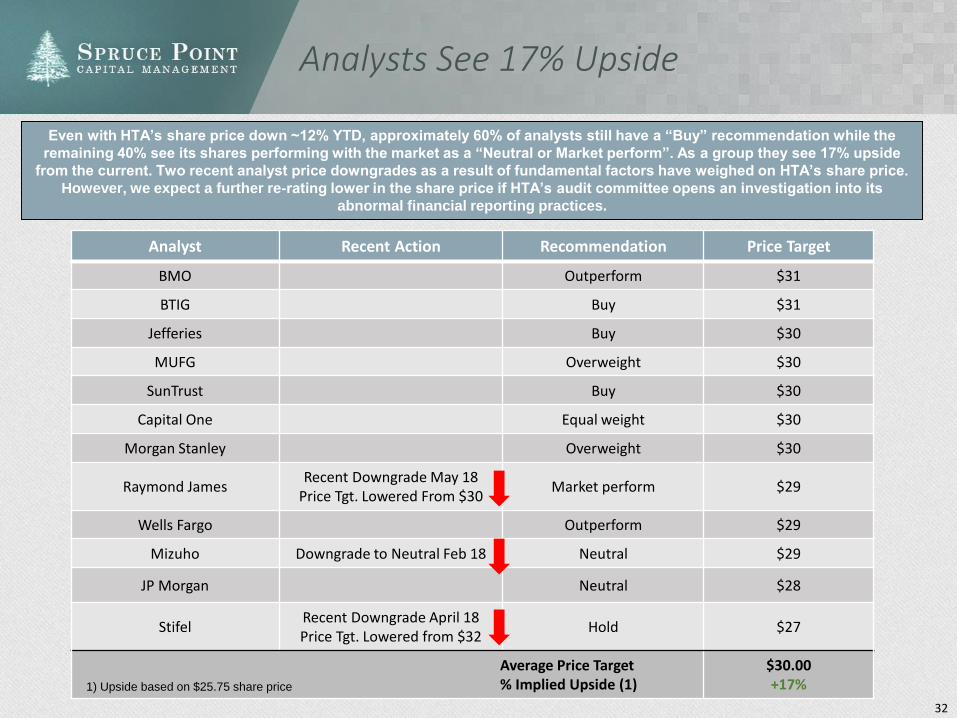
Analysts See 17% Upside
Analyst Recent Action Recommendation Price Target
BMO Outperform $31
BTIG Buy $31
Jefferies Buy $30
MUFG Overweight $30
SunTrust Buy $30
Capital One Equal weight $30
Morgan Stanley Overweight $30
Raymond JamesRecent Downgrade May 18
Price Tgt. Lowered From $30Market perform $29
Wells Fargo Outperform $29
Mizuho Downgrade to Neutral Feb 18 Neutral $29
JP Morgan Neutral $28
StifelRecent Downgrade April 18Price Tgt. Lowered from $32
Hold $27
Average Price Target% Implied Upside (1)
$30.00+17%
Even with HTA’s share price down ~12% YTD, approximately 60% of analysts still have a “Buy” recommendation while the
remaining 40% see its shares performing with the market as a “Neutral or Market perform”. As a group they see 17% upside
from the current. Two recent analyst price downgrades as a result of fundamental factors have weighed on HTA’s share price.
However, we expect a further re-rating lower in the share price if HTA’s audit committee opens an investigation into its
abnormal financial reporting practices.
1) Upside based on $25.75 share price
20% To 40% Downside Risk When The Market Connects The Dots To The Brixmor And ARCP Accounting Scandals
34
Case Study: Brixmor Property Group
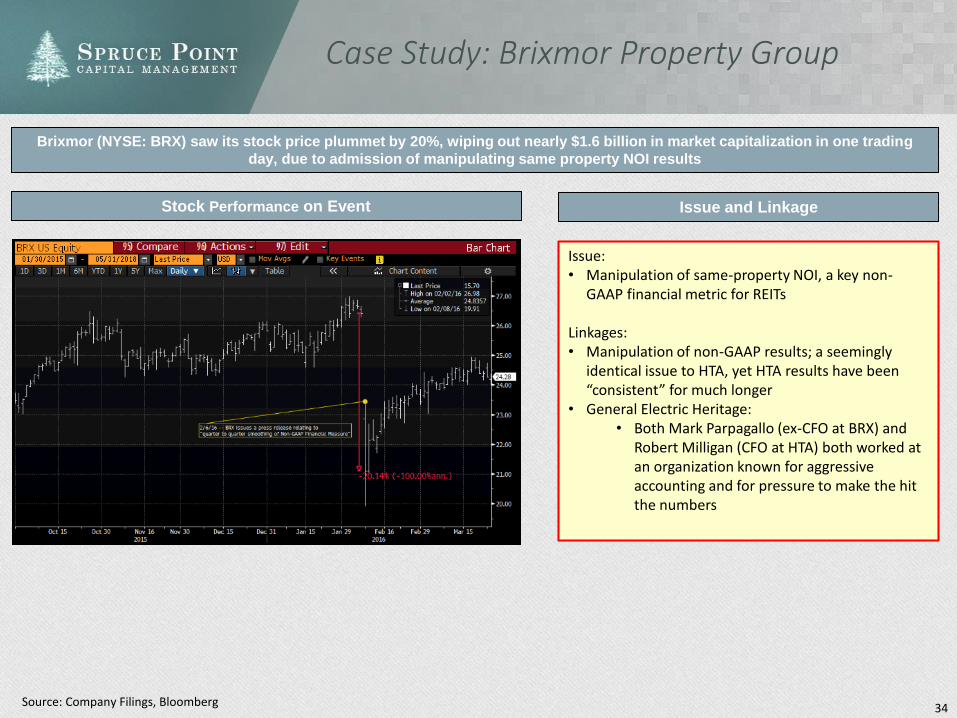
Brixmor (NYSE: BRX) saw its stock price plummet by 20%, wiping out nearly $1.6 billion in market capitalization in one trading
day, due to admission of manipulating same property NOI results
Source: Company Filings, Bloomberg
Stock Performance on Event
Issue: • Manipulation of same-property NOI, a key non-
GAAP financial metric for REITs
Linkages:• Manipulation of non-GAAP results; a seemingly
identical issue to HTA, yet HTA results have been “consistent” for much longer
• General Electric Heritage: • Both Mark Parpagallo (ex-CFO at BRX) and
Robert Milligan (CFO at HTA) both worked at an organization known for aggressive accounting and for pressure to make the hit the numbers
Issue and Linkage
35
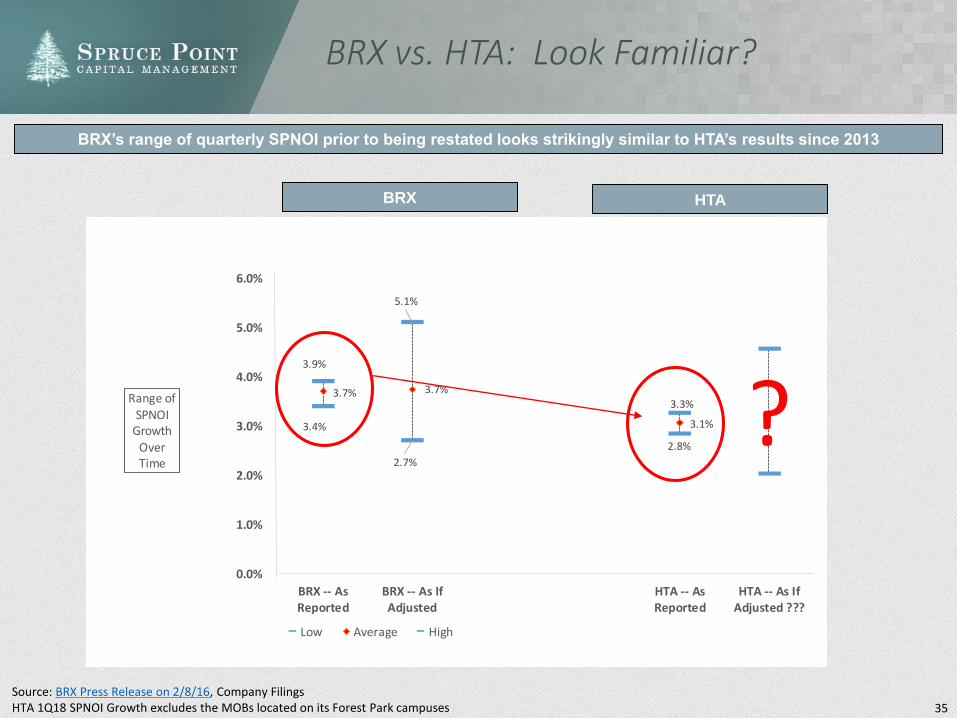
3.4%
2.7%
2.8%
3.7% 3.7%
3.1%
3.9%
5.1%
3.3%
0.0%
1.0%
2.0%
3.0%
4.0%
5.0%
6.0%
BRX -- AsReported
BRX -- As IfAdjusted
HTA -- AsReported
HTA -- As IfAdjusted ???
Range of
SPNOI Growth
OverTime
Low Average High
?
BRX vs. HTA: Look Familiar?
BRX’s range of quarterly SPNOI prior to being restated looks strikingly similar to HTA’s results since 2013
Source: BRX Press Release on 2/8/16, Company FilingsHTA 1Q18 SPNOI Growth excludes the MOBs located on its Forest Park campuses
BRX HTA
36
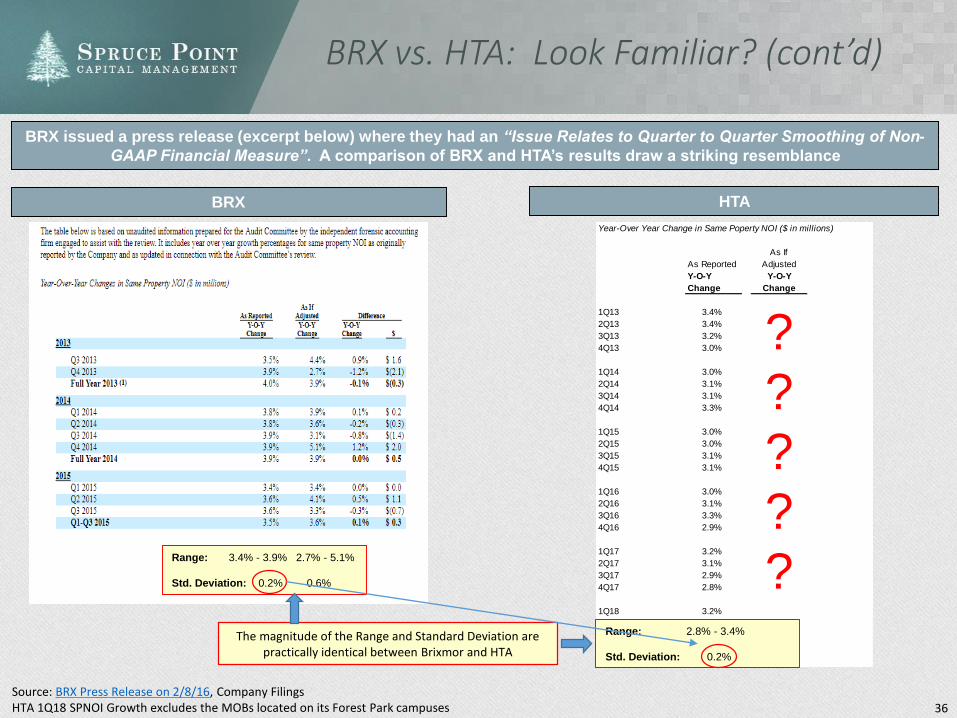
BRX vs. HTA: Look Familiar? (cont’d)
BRX issued a press release (excerpt below) where they had an “Issue Relates to Quarter to Quarter Smoothing of Non-
GAAP Financial Measure”. A comparison of BRX and HTA’s results draw a striking resemblance
Source: BRX Press Release on 2/8/16, Company FilingsHTA 1Q18 SPNOI Growth excludes the MOBs located on its Forest Park campuses
BRX HTA
3Q13
4Q13
1Q14
2Q14
3Q14
4Q14
1Q15
2Q15
3Q15
Ra nge
S ta nda rd De via tion
Ra nge 3.4% -
3.9%
2.7% -
5.1%
S ta nda rd De via tion 0.2% 0.7%
Year-Over Year Change in Same Poperty NOI ($ in millions)
As If
As Reported Adjusted
Y-O-Y Y-O-Y
Change Change
1Q13 3.4%
2Q13 3.4%
3Q13 3.2%
4Q13 3.0%
1Q14 3.0%
2Q14 3.1%
3Q14 3.1%
4Q14 3.3%
1Q15 3.0%
2Q15 3.0%
3Q15 3.1%
4Q15 3.1%
1Q16 3.0%
2Q16 3.1%
3Q16 3.3%
4Q16 2.9%
1Q17 3.2%
2Q17 3.1%
3Q17 2.9%
4Q17 2.8%
1Q18 3.2%
Ra nge 2.8% - 3 .4%
S ta nda rd De via tion 0.2%
?????
The magnitude of the Range and Standard Deviation are practically identical between Brixmor and HTA
Range: 3.4% - 3.9% 2.7% - 5.1%
Std. Deviation: 0.2% 0.6%
Range: 2.8% - 3.4%
Std. Deviation: 0.2%
37
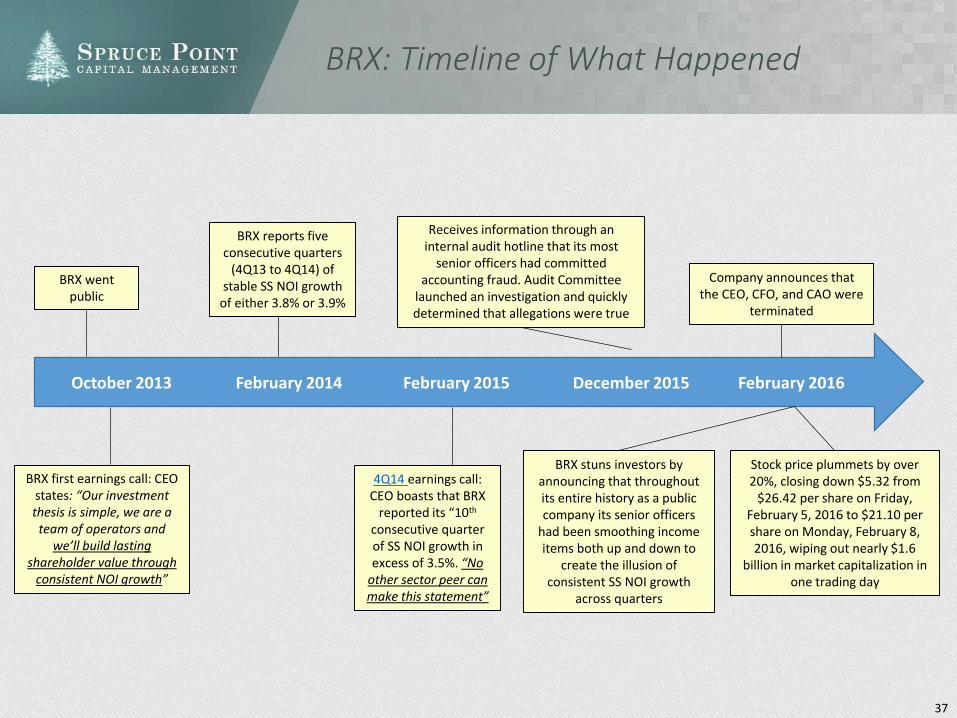
October 2013
BRX went public
BRX first earnings call: CEO states: “Our investment thesis is simple, we are a
team of operators and we’ll build lasting
shareholder value through consistent NOI growth”
February 2014
BRX reports five consecutive quarters
(4Q13 to 4Q14) of stable SS NOI growth
of either 3.8% or 3.9%
February 2015
4Q14 earnings call: CEO boasts that BRX
reported its “10th
consecutive quarter of SS NOI growth in excess of 3.5%. “No
other sector peer can make this statement”
December 2015
Receives information through an internal audit hotline that its most
senior officers had committed accounting fraud. Audit Committee
launched an investigation and quickly determined that allegations were true
February 2016
BRX stuns investors by announcing that throughout its entire history as a public company its senior officers
had been smoothing income items both up and down to
create the illusion of consistent SS NOI growth
across quarters
Company announces that the CEO, CFO, and CAO were
terminated
Stock price plummets by over 20%, closing down $5.32 from
$26.42 per share on Friday, February 5, 2016 to $21.10 per share on Monday, February 8, 2016, wiping out nearly $1.6
billion in market capitalization in one trading day
BRX: Timeline of What Happened
38
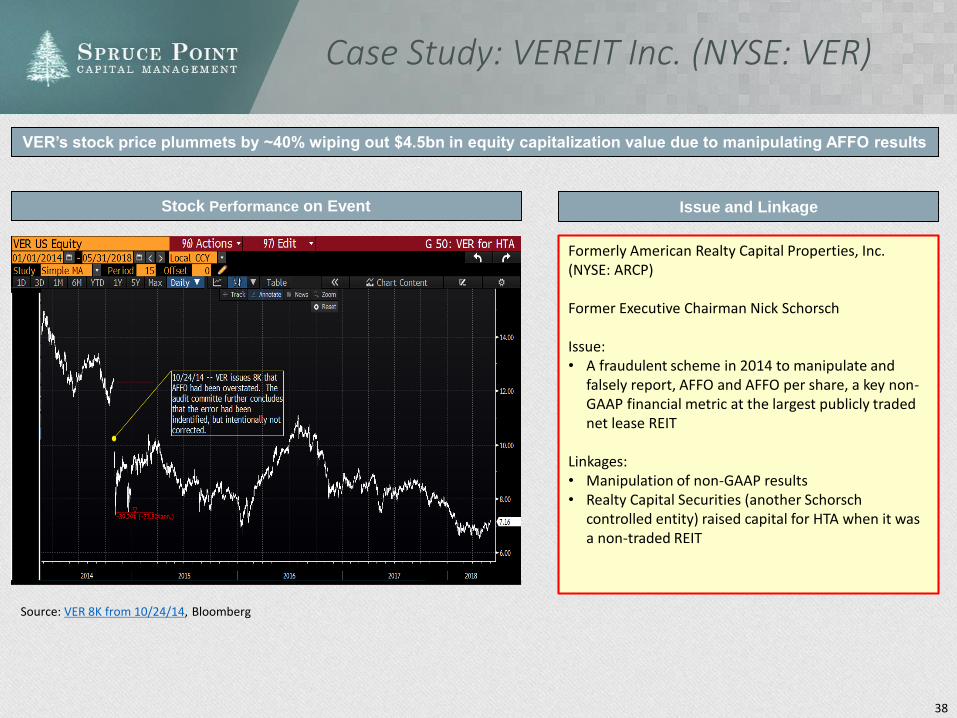
Case Study: VEREIT Inc. (NYSE: VER)
VER’s stock price plummets by ~40% wiping out $4.5bn in equity capitalization value due to manipulating AFFO results
Stock Performance on Event
Formerly American Realty Capital Properties, Inc. (NYSE: ARCP)
Former Executive Chairman Nick Schorsch
Issue: • A fraudulent scheme in 2014 to manipulate and
falsely report, AFFO and AFFO per share, a key non-GAAP financial metric at the largest publicly traded net lease REIT
Linkages:• Manipulation of non-GAAP results• Realty Capital Securities (another Schorsch
controlled entity) raised capital for HTA when it was a non-traded REIT
Issue and Linkage
Source: VER 8K from 10/24/14, Bloomberg
39
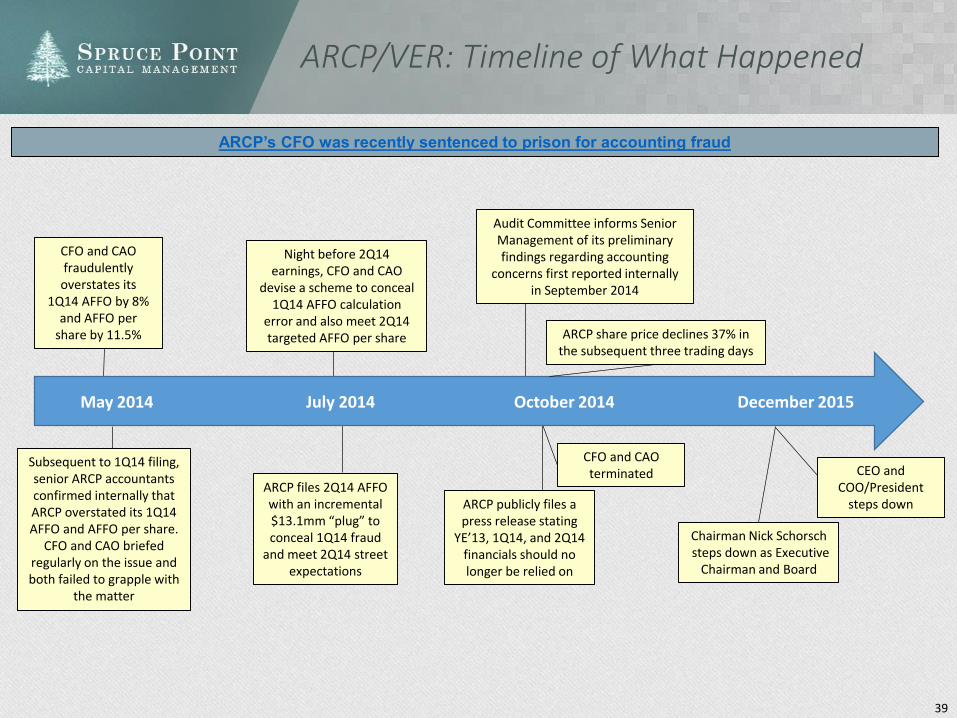
ARCP/VER: Timeline of What Happened
CFO and CAO fraudulently overstates its
1Q14 AFFO by 8% and AFFO per
share by 11.5%
Subsequent to 1Q14 filing, senior ARCP accountants confirmed internally that ARCP overstated its 1Q14 AFFO and AFFO per share.
CFO and CAO briefed regularly on the issue and both failed to grapple with
the matter
Night before 2Q14 earnings, CFO and CAO
devise a scheme to conceal 1Q14 AFFO calculation
error and also meet 2Q14 targeted AFFO per share
ARCP files 2Q14 AFFO with an incremental $13.1mm “plug” to conceal 1Q14 fraud
and meet 2Q14 street expectations
ARCP publicly files a press release stating
YE’13, 1Q14, and 2Q14 financials should no longer be relied on
Audit Committee informs Senior Management of its preliminary findings regarding accounting
concerns first reported internally in September 2014
CFO and CAO terminated
ARCP share price declines 37% in the subsequent three trading days
Chairman Nick Schorschsteps down as Executive
Chairman and Board
CEO and COO/President
steps down
May 2014 July 2014 October 2014 December 2015
ARCP’s CFO was recently sentenced to prison for accounting fraud