FULL DISSERTATION - Investigating the Effectiveness of Shared Space
60
Dave Idahosa 21223789 1 FINAL YEAR PROJECT Investigating the Effectiveness of Shared Space Dave Idahosa 21223789
-
Upload
dave-idahosa -
Category
Documents
-
view
19 -
download
2
Transcript of FULL DISSERTATION - Investigating the Effectiveness of Shared Space

Dave Idahosa 21223789
1
FINAL YEAR PROJECT
Investigating the Effectiveness of Shared Space
Dave Idahosa
21223789

Dave Idahosa 21223789
2
CONTENTS PAGE
DECLARATION ..................................................................................................................................... 4
ABSTRACT ........................................................................................................................................... 5
ACKNOWLEDGEMENTS ...................................................................................................................... 6
LIST OF FIGURES ................................................................................................................................. 7
LIST OF TABLES ................................................................................................................................... 8
1. INTRODUCTION .................................................................................................................. 9
1.1. Aim ...................................................................................................................................... 9
1.2. Objectives ............................................................................................................................ 9
2. LITERATURE REVIEW ........................................................................................................ 10
2.1. Shared Space Background ................................................................................................. 10
2.2. Purpose of Shared Space .................................................................................................. 11
2.3. Traffic Congestion ............................................................................................................. 11
2.4. Traffic Flow ........................................................................................................................ 12
2.4.1. Road User Safety & Movement ........................................................................................ 12
2.4.2. Pedestrians in Shared Space ............................................................................................. 13
2.4.3. Cyclists in Shared Space .................................................................................................... 14
2.4.4. Vehicles in Shared Space ................................................................................................... 15
2.5. Impact of the Road Surface ............................................................................................... 15
2.6. Environmental Impacts ..................................................................................................... 16
2.7. Economic Impacts ............................................................................................................. 17
2.8. Legislation ......................................................................................................................... 17
2.9. Feasibility of the Design Concept ...................................................................................... 17
2.10. Limitations ......................................................................................................................... 17
2.11. Comparative Review on Shared Space Projects................................................................ 18
2.14. Conclusion ......................................................................................................................... 22
3. METHODOLOGY ................................................................................................................ 23
3.1. Overview ........................................................................................................................... 23
3.2. Data Collection & Analysis ................................................................................................ 23
3.3. Observation ....................................................................................................................... 24
3.4. Primary Research: Survey Questionnaire ......................................................................... 27
3.5.1. Question 1 ......................................................................................................................... 27
3.5.2. Question 2 ......................................................................................................................... 28
3.5.3. Question 3 ......................................................................................................................... 29

Dave Idahosa 21223789
3
3.5.4. Question 4 ......................................................................................................................... 30
3.5.5. Question 5 ......................................................................................................................... 31
3.5.6. Question 6 ......................................................................................................................... 32
3.5.7. Question 7 ......................................................................................................................... 33
3.5.8. Question 8 ......................................................................................................................... 34
3.5.9. Question 9 ......................................................................................................................... 35
3.5.10. Question 10 ....................................................................................................................... 36
3.5.11. Question 11 ....................................................................................................................... 37
3.5.12. Question 12 ....................................................................................................................... 38
3.5.13. Question 13 ....................................................................................................................... 39
3.5.14. Question 14 ....................................................................................................................... 40
3.5.15. Question 15 ....................................................................................................................... 41
3.6. Secondary Research: Survey Questionnaire ..................................................................... 42
3.8. Survey Evaluation .............................................................................................................. 43
3.9. Pollution Rate Analysis ...................................................................................................... 44
3.10. Accident Rates and Collision Data..................................................................................... 47
3.11. Pedestrian Count & Crossing Movement .......................................................................... 49
3.12. Cyclist Flows ...................................................................................................................... 50
3.13. Secondary Observation of Vehicle Traffic ......................................................................... 51
3.14. AADT Estimation ............................................................................................................... 52
3.15. Proposal & Design Recommendations .............................................................................. 54
4. DISCUSSION & FINDINGS ................................................................................................. 56
5. CONCLUSION .................................................................................................................... 57
REFERENCES ...................................................................................................................................... 58

Dave Idahosa 21223789
4
DECLARATION
I hereby declare that the research and work done in this paper is all my own individual work and there
has been no prior submission anywhere for an award. All sources of information used in the paper
have been referenced and acknowledged accordingly.

Dave Idahosa 21223789
5
ABSTRACT
Shared space is an approach to urban design and a concept in traffic engineering that tries to reduce
the demarcation between vehicles and pedestrians, whilst integrating all road users in the specific
area. It has developed predominantly in the UK and is becoming a more uprising urban design method
through various schemes. This design approach is implemented by eliminating road markings, kerbs
and traffic lights. In many ways it would seem paradoxical, however, shared spaces can improve the
safety of road users in different ways as the perception of higher risk contributes in making the drivers
and cyclists to be more vigilant and cautious. Conversely, shared space is not merely about the street
design, but it also focuses on shifting the perception of dominance of vehicles over pedestrians and
recreating a better balance with movement and the road sociability. Some recent schemes for shared
space have revealed benefits for pedestrians such as reduction in vehicle speeds, minimised
congestion, improved road surface, lower rates in accidents and more vivacious and appealing streets.
On the contrary, concerns have been brought up addressing the issues of shared space that could
affect children, elderly people and those with disabilities or impairment, especially blind/partially
sighted pedestrians. This paper will look into some shared spaces and focus predominantly on 2
schemes that have been implemented in the UK to be able to ascertain the effectiveness of its design.

Dave Idahosa 21223789
6
ACKNOWLEDGEMENTS
First and foremost, I would like to give my deepest thanks and praise to God Almighty.
I would like to acknowledge and thank Indira Chauhan for the time, effort and support she has
provided during the project. I would also like to thank the University of West London for the guidance
and help they have offered during my studies in BEng Civil & Environmental Engineering. My upmost
thanks and biggest appreciation goes to my mother Christy Idahosa for her constant support through
this project and the entirety of my degree.

Dave Idahosa 21223789
7
LIST OF FIGURES
Figure 45 Design Proposal 2...............................................................................................55

Dave Idahosa 21223789
8
LIST OF TABLES
Dave Idahosa 21223789
9
1. INTRODUCTION
Shared spaces have had an immense growth in popularity in the UK following its initial application of
the shared street concept in the Netherlands in 1960’s. Since then, there has also been an increase in
implementation of these schemes to reduce vehicular traffic, vehicle speeds and road segregation.
The UK demand for improved roads in urban areas is continually increasing especially in congested
cities such as London, more diverse traffic engineering methods to tackle low social integration and
poor road safety is at the forefront of urban design. Therefore, renowned concepts such as Shared
Space is propelling to the frontline as a way to tackle the issues faced with conventional roads. As
population in London is rising with estimations of over 10 million by 2030, the shared space urban
design is rising as an imperative traffic engineering approach to improve the daily road safety and
sociability of road users.
1.1. AIM
The purpose of this paper is to investigate the effectiveness of the shared space designs by establishing
the main factors that affect road users and assessing these variables in relation to the effectiveness,
safety and adeptness of shared spaces. The focus will be on the major London scheme ‘Exhibition
Road’ and other shared spaces in the UK.
1.2. OBJECTIVES
To ensure the fulfilment of this aim, there are a few objectives that must be achieved systematically.
The objectives listed will be completed during the course of this paper, in order it is as follows:
Assess and review 1 or 2 shared spaces with different road layouts in order to determine the
benefits and primary issues
Use qualitative and quantitative data from surveys to realise road user views with a
comparative evaluation between Exhibition Road and Elwick Square to establish where shared
spaces are likely to operate effectively
Check its overall effectiveness by analysing accident/collision data, pollution rates, cycling and
walking statistics and conducting manual calculation of AADT giving a numerical understanding
of the redevelopment impacts
Give recommendations and proposals based on slight designs adjustments to increase the
safety and practicality for all road users including the less abled and visually impaired users

Dave Idahosa 21223789
10
2. LITERATURE REVIEW
2.1. Shared Space Background
The development of Shared Space is generally regarded to be pioneered by Hans Monderman, a
renowned Dutch traffic engineer. Hans Monderman pioneered this urban design approach between
the late 1960s – 1970s in the Friesland province of northwest Netherlands; however, the shared space
concept has had a greater impact predominantly in the UK (Moody et al, 2014). Shared Space as an
urban design can be implemented in all areas especially in busy locations or even in places of low
traffic. According to Buxton, (2015) “The term ‘shared space’ was coined in 2003 to define the evolving
paradigm of fully integrated, mixed-used streets, in contrast to conventional segregation”. The focus
of shared space is not necessarily on restricting traffic and speeds of vehicles, but more towards the
change in behaviour of the road users, assisted by the design and setting of public spaces. This design
concept is opposite of the traffic control measures from the 1980s, because the features are
prominent on removing the traffic lights, signs and kerbs so instead, it introduces open space for more
free movement with cycling and walking in the design. (Dr. Gerlach et al, 2007)
Shared space is considered to have started in the Netherlands with notable projects like ‘The Woonerf’
design in the 1960’s, but has since spread to Europe and America (Quimby et al, 2006, p.7). According
to Collarte, (2012, p.4-5), “Shared space designs like the Woonerf have increased efficiency in space
and reduced congestion” compared to traditional road designs. This is also supported with examples
in Assen, some of the roundabouts that have incorporated the shared space design have reduced
accidents within a period of 5 years between 2007 and 2012 and there were only 2 cyclist injuries.
(Hembrow, 2014).
Another contributor to the UK’s progression of shared space is Ben Hamilton-Baille who has designed
many shared space schemes and improved the safety and overall flow of busy intersections. In
addition to the older shared space designs used on roundabouts, modern UK Shared Space projects
such as the New Road in Brighton reduced traffic by 93% and created a more welcoming and vibrant
road. According to Dr. Sinnet, (2011, p.59-60), the New Road shared space construction cost equated
to around £1.75million for the entire road regeneration. The history of shared space shows its impact
in the urban road design sector and the efficiency of it is incorporated in busy intersections and busy
streets, helping to save money due to costs from maintaining traffic lights/signs and conventional road
designs. The perspectives of supporters and critics of the shared space design all point out valid points,
however there are more ways to improve the design to ensure its effectiveness.

Dave Idahosa 21223789
11
2.2. Purpose of Shared Space
Shared space is an urban design that removes segregation between pedestrians and motorists, while
creating a more attractive and socially integrated road network. The design concept aims to tackle
congestion issues, high traffic volume and slow traffic flow (Department for Transport, 2011).
Shared space merges the findings from behavioural and environmental psychology with traffic
engineering and urban design planning. The approach denotes steps for expanding the opportunities
for society and individuals to form and have an impact on the built environment through methods
that inspire uniqueness, variety, quality in urbanisation and courteousness. (Hamilton-Baille, 2008b).
2.3. Traffic Congestion
The population of the UK is continually increasing which means that congestion will continue to
become more difficult to handle due to the proportional increase in vehicles on the roads. Congestion
is defined as the interaction of vehicles and how they impede other vehicles progress or flow on the
road (Gov.uk, 2013).
The causes of congestion stem from the continuous increase in vehicles, road network overload, poor
road management, road works, weather conditions, rush hour periods and traffic disturbances such
as accidents and breakdowns (Strickland, 2015).
However, the major issue is with the amount of vehicles on the road in which the roads are not able
to adapt or adjust to the expanding volumes of vehicles. This could also be caused by lack of funding
to adjust the infrastructure and to create larger space on the road networks to accommodate variation
of vehicle types and cyclists. (Glenn et al, 2013).
Example of this is a project that was undertaken in Portishead in 2009 about 120 miles from London.
The busy intersection was rebuilt with shared space incorporated to for the purpose of increased flow
of traffic and safety regardless of the number of vehicles and pedestrians using the road in busy
periods at around 2000 and 300 per hour respectively and also Transport for London worked to
remove lights in the downtown centre (McKone, 2010).

Dave Idahosa 21223789
12
2.4. Traffic Flow
There is a common perspective that traffic flow in busy areas decelerates due to the increase in
vehicles which causes queuing. Vital data shows that 79% of traffic is from cars and taxis and only 1%
of the traffic coming from cyclists. TFL, (2010), the incorporation of multiple traffic lights and control
measures, drastically slows down the flow of traffic especially at busy intersection or at narrow roads.
The use of shared space is known to increase traffic flows compared to conventional traffic control
systems in cities which utilises traffic calming measures such as road signs, slow speed road humps,
traffic lights and bottlenecks that impede traffic flow (Cornwall Council, 2015). According to TFL,
(2010), in the traffic analysis it also shows that the Average daily traffic on major London roads with
cars/taxis in 1993 was at 24.8 to 2010’s 23.7. The Average daily traffic for cyclists increased from
1993’s 0.26 to 2010’s 0.46. Therefore, on a differing view, the data shows that there are more schemes
to smoothen traffic and emphasis on walking and cycling it is improving the traffic flow.
2.4.1. Road User Safety & Movement
It is essential that motorists and cyclists interact to allow for better flow when pedestrians and children
cross. However, this leaves blind users at risk, therefore there must be common courtesy applied in
this situation. Cyclists move smoothly by showing signs of direction. Some argue that constant flow of
vehicles could cause disruptions to other road users, there are multiple examples of it actually
improving traffic flow. According to Achilles et al, (2013, p.49) shared space’s mix various road user’s
and drivers are able to make eye contact and navigate safely across the shared space. Section 2.4 in
the Gov.uk, (2007), Manual for Streets guidance explains the movement matrix process.
Figure 1 – Movement/Place Matrix. Source: (Department for Transport, 2011)
Dave Idahosa 21223789
13
2.4.2. Pedestrians in Shared Space
According to Department for Transport, (2011) pedestrians have been able to move freely in shared
space schemes and due to the transformation of congested and busy intersections it has caused safer
intersections that accommodate heavy traffic. Manual for Streets, (2007) also suggests that 100
vehicles per hour is an hourly traffic rate that pedestrians are comfortable with.
Additionally, the perception is that when the volume of pedestrians using the street increase, the
vehicles speeds tend to reduce in proportion, showing the safety in the design. However, Holmes,
(2015, p.10) argues that “pedestrians continually reported feeling unsafe and frightened and 35% say
they will go out of their way to avoid shared spaces” This argument also stems from the basis of no
clear provision for users such as the blind, partially blind, impaired/disabled users and children.
Approximately, there are about 2 million people with sight loss in the UK which is around 1 in 30
people on average who use guide canes (RNIB, 2014). This is a possible issue for these types of
pedestrians concerning the removal of kerbs in the shared space design. Regardless of these views, a
study undertaken on seven different shared space projects from periods between 2004 to 2008,
supported by the European Interreg-IIIB North Sea Programme show that there are fewer accidents
after implementation of shared spaces compared to the conventional road layout (Allianz, 2012).
According to Living Street, (2011), some of the important parts of making a good walking environment
for pedestrians. Include measures in place to improve pedestrian comfort include the speed limits,
safe access routes to schools, traffic calming, public realm enhancements and mixed priority spaces.
Disregarding any of the concerns or issues with shared space schemes, no devastating after-effects on
people from traffic collisions have been found in shared spaces in comparison to the conventional
layouts for roads (Living Street, 2011).

Dave Idahosa 21223789
14
2.4.3. Cyclists in Shared Space
In terms of safety, cyclists are also a priority of the scheme to reduce the speeds of vehicles as they
can often be affected by the traffic flow and volume at busy crossings or at an intersection. There are
rarely any accidents between cyclists and pedestrians, besides, cyclists react to the pedestrian volume
and alter their speeds also avoiding forward action when needed. (Department for Transport, 1993).
Cycling movement is deemed more free compared to the conventional roads because of removed
traffic lights and also the overwhelming factor of vehicles dominating over the cyclists.
Another example of a successful shared space
project is from the New Road, Brighton scheme
which was able to create a commercial street
with bars, restaurants, shops, library and
theatres.
The Brighton council worked with architecture
firms to redesign the road and using high quality
granite paving across the entire area. The total
project cost was £1.75m and was carried out
during 2007.
The benefits of the shared space project range from more welcoming and vibrant area to becoming
an award winning urban design from the Civic Trust and Landscape Institute. Data shows that there
was a huge increase in pedestrian activity and integration in the area which rose by 162%. There was
93% reduction in traffic volume, with interviewees stating that the project was ‘good’ with over 90%
giving a score rating above 5 (Living Street, 2011). Figure 2 shown above on the right, displays the
before and after pictures, showing immense change.
The Dutch CROW, (2007) review states that shared spaces or streets should only be considered when
there are low vehicle volumes for example (at 600 v/h or less). Streets incorporating shared space
allow for families with children to walk and cycle comfortably this leads to complementary proceeds
giving priority to walking and cycling. (Bicycle Network, 2015).
Figure 2 - New Road, Brighton (Living Streets, 2011)

Dave Idahosa 21223789
15
2.4.4. Vehicles in Shared Space
According to Sinnet et al, (2011) from Living Street, the Dratchen junction project in Netherlands was
redesigned and showed impactful differences. The junction formerly comprised of traffic signals,
overwhelming traffic and pedestrian’s crossings with associated road signs and markings. The junction
was deemed unattractive and had a poor safety record. The shared space project took place between
2002-2003 and the objective was to produce a high quality public area within a busy intersection, and
to reduce traffic congestion and improve the overall safety. The outcomes of the project remain
positive as the traffic collisions declined from 8.3 per year between 1994-2002 to only 1 per year
in 2004-2005.
According to Department for Transport, (2011) in their research it was found that “drivers prefer
conventional road layouts because it provides them with defined areas that separate pedestrians and
vehicles” However, there are advantages to shared space as defined by DFT such as the improved
driving attentiveness and focus on surroundings with more care and less speed. Areas such as
Poynton, Cheshire and Ashford, Kent reduced by about 40-50% in the number of accidents
(Wilkinson, 2014). Therefore, the implementation of shared spaces works well particularly in busy
areas due to reduction of congestion and slow traffic flow, but on the other hand its effectiveness
and suitability on longer roads may be a concern. (Hamilton-Baille cites Jacobs, 2007) stating
“when vehicles are more aware of the pedestrian realm, both road users are safer”
2.5. Impact of the Road Surface
The shared surface is the area of ground built for the shared use of vehicles, cyclists and pedestrians.
The road surface materials are comprised of bricks and paving stone. (Hickman, 2006), Shared
space may be a higher opportunity for cycling as the wearing course surface are more quality
constructed and completely level. Cyclists tend to prefer large lanes when cycling, they also prefer
level surfaces like those used in shared spaces and well maintained infrastructure.
(Makingspaceforcycling.org). Pedestrians usually prefer well-maintained roads/foot walks and
attractive spacious streets.
According to Department for Transport, (2011), drivers prefer smooth roads and clearly defined
structures in the road layout, this can be exemplified in detail as shared spaces are an open area
similar to how ice rinks work by intentionally improving safety through cautious driving. Shared
spaces eventually has the potential to propel the increase of cycling and walking especially in
busy areas where shops and amenities are in close range. This brings health and economic
benefits as well as environmental benefits (Hamilton-Baille, 2008a).

Dave Idahosa 21223789
16
On the flipside to this; Thomas et al, (2008), argues on the safety of the road surface in relation to fully
and partially blind road users, stating that “the surface does not have established lanes or surfaces for
these types of people and that there is no cognisance in the shared space”. This is also supported by
ICE reports by Moody et al, (2014), whose findings were different to the Department for Transport in
terms of safety for the pedestrians.
2.6. Environmental Impacts
It is a renowned fact that conventional road layouts cause a colossal amount of carbon emissions from
both idling/waiting times at traffic lights, congestion from rush hour periods and fuel consumption of
vehicles. According to Cassini, (2007) there are significant impacts of signalised roads stating “due to
the traffic light road management system, waiting times account for 40% of journey times and
therefore is responsible for 25% of fuel consumption on a daily basis” As mentioned earlier, traffic
counts in London will continue to increase and currently AADT numbers still stand at over 22
(Department for Transport, 2011).
Hence, the shared space design allows for constant movement even at slow rates to reduce idling and
wasted energy and fuel consumption as carbon dioxide is a greenhouse gas which absorbs heat
causing climate change. There is also carbon footprint due to manufacturing, transportation,
installation and constant maintenance of 24-hour traffic lights which contribute to carbon emissions.
In contrast, Newman, (2012) identified that the construction of shared space schemes can also affect
the environment in short term ways for example the removal of asphalt also known as bitumen and
the milling of this material can cause emissions as it is made from petroleum. Despite, this, the
outcome of shared space can help deplete the long term environmental issues compared to
conventional roads as GLA Atmospheric Emissions Inventory Reports in 2005 stated that London has
over 7.8million tonnes of CO2. Therefore 25% of this estimated figure = 1.95 million tonnes of CO2
caused only from the idling fuel consumption during traffic signalling. The shared space model can
eradicate this amount of CO2 due to the concept alone.

Dave Idahosa 21223789
17
2.7. Economic Impacts
There are economic benefits to shared space which include startling increase in pedestrian activity
with walking and cycling. Other economic benefits include the value increase of businesses, residential
and commercial buildings. Examples of the improvements shared space brings are shown in the Exeter
City Centre, with its 10-year project to regenerate the town centre by developing a high quality city
mark, encouraging more visitors and tourists and improving the wellbeing of those intrigued with the
city centre. The area rose footfall by 30% between 2002-2010 with an increase in Zone A retail rent
from £220per square foot to £225per square foot in comparison to depreciating rents in close-by
towns (Living Street, 2011). Sheaf Square, Sheffield was formerly a busy ring road with poor crossings
was re-developed contriving new crossings, raising the gratification of arriving in the city. Pedestrians
amplified from 3,175 to 8700 between 2001-2008, with vehicles decreasing from 36,600 to 25,520,
boosting delight of visitors and accentuating the economic benefits to the city (CIHT, 2010).
2.8. Legislation
The Equality Act 2010 covers the legislation for equality and benefits for disabled people if the shared
space is designed well. Its duties are paramount in relation to disability with a focus on protecting
characteristics such as age and religion for all people to use the shared space and be comfortable.
2.9. Feasibility of the Design Concept
Crucial feasibility aspects considered in shared space consist of traffic flow, AADT, road geometry,
topography and urbanisation. Leyzerovsky, (2015) an associate with Project for Public Places (PPS.org),
states that “not every street or intersection can be a shared space as the features must fit for a safe
design” Similarly, Department for Transport, (2011) state “there is no standard for shared space
designs and each scheme is different, the performance of the shared space depends largely on the
style and characteristics of that location.” Hans Monderman believed that the main factors that impact
on driver’s behaviour are adjacent land use, buildings closeness to streets and shops. The more urban
an area is the more impact it has on the drivers to be cautious and follow the design aim.
2.10. Limitations
Despite the safety improvements mentioned above Holmes, (2015) continually argues that the shared
space design is flawed as it relies heavily on eye-contact and interaction between road users which
leaves the blind at a disadvantage. Guide Dogs, (2015), have also raised concerns that most shared
spaces have no paths with different paving surface for visually impaired pedestrians. Due to the brick
and cobblestone surface pedestrians using wheelchairs may find it difficult in the shared space as
there is no clear indication of where the sidewalk ends or where the road starts (Shareable.net, 2015).
Dave Idahosa 21223789
18
2.11. Comparative Review on Shared Space Projects
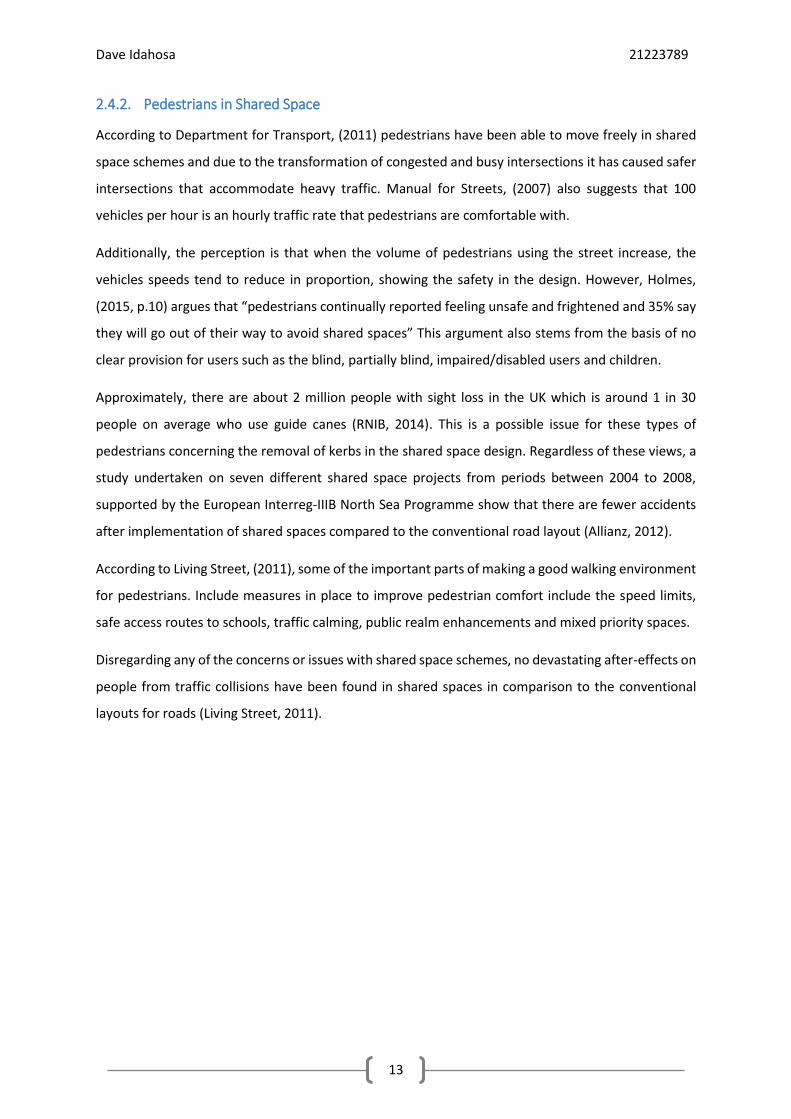
2.12. Exhibition Road, South Kensington:
The exhibition road project consists of natural granite sett paving’s over around 17000m2
incorporating tactile and contrasting paving materials (Marshalls, 2013). The project took around 2
years to complete from commencement of construction around late 2010 and completion and
opening in 2012. The exhibition road design scheme costed approx. £32m and was contracted by
Balfour Beatty with Dixon Jones as the Architect firm and the traffic loading was classed as Shared
space heavy trafficking. The road length runs at roughly over half a mile making it the longest shared
space in the UK and attracting surplus of 11 million visitors. It is also a single surface, kerb-free open
space with 2 different sections for traffic flow of pedestrians, cyclists and motorists. Steintec, (2015).
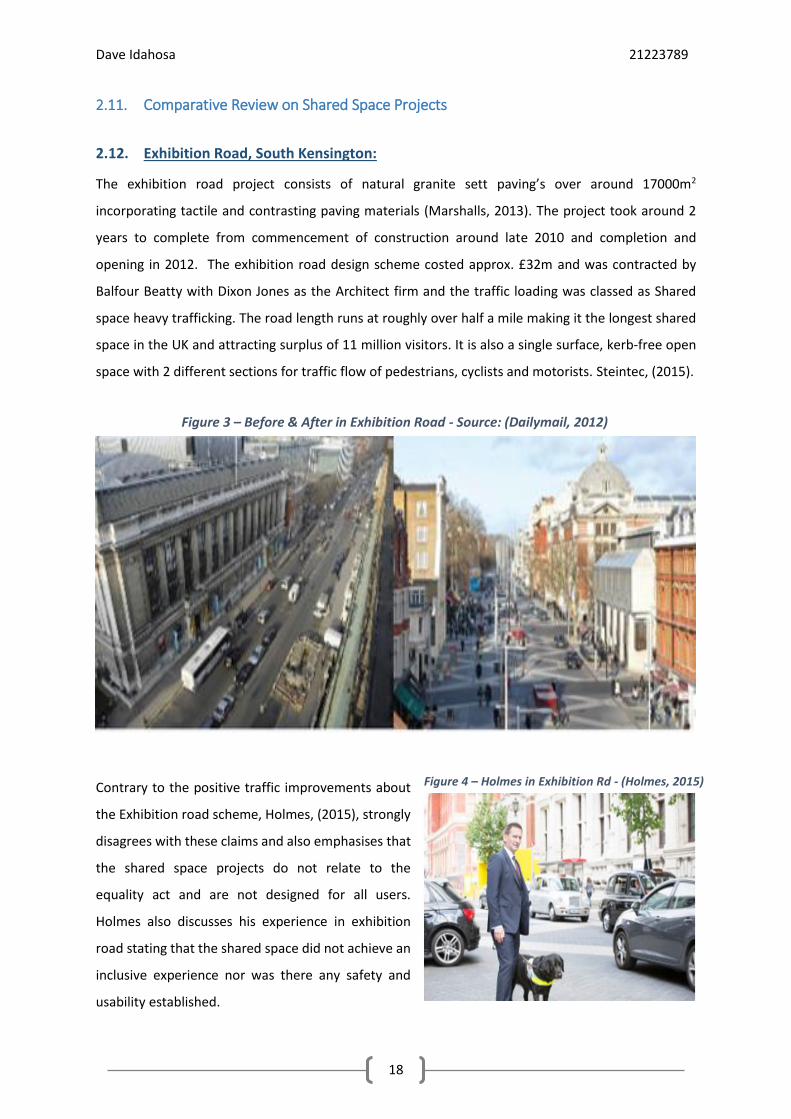
Contrary to the positive traffic improvements about
the Exhibition road scheme, Holmes, (2015), strongly
disagrees with these claims and also emphasises that
the shared space projects do not relate to the
equality act and are not designed for all users.
Holmes also discusses his experience in exhibition
road stating that the shared space did not achieve an
inclusive experience nor was there any safety and
usability established.
Figure 3 – Before & After in Exhibition Road - Source: (Dailymail, 2012)
Figure 4 – Holmes in Exhibition Rd - (Holmes, 2015)
Dave Idahosa 21223789
19
Holmes states that 63% of respondents had a negative experience with the shared space design and
35% said they would avoid the road entirely. Imrie, (2013) supports this argument from one standpoint
alluding to the fact that the shared space is premeditated with a low understanding of the
interrelationships between the design, disability and space and that part of the issues is the lack of
personified knowledge about impairment in urban design.
An accessibility group working with RBKC (Royal Borough of Kensington & Chelsea) called Whizz Kids
have been involved in the assessment and auditing of Exhibition Road with some feedback stating that
“it is crucial that there is a minimised amount of street furniture on the shared space and to
incorporate areas for easier crossings for disabled users”, nonetheless, on a more positive note the
Mayor, (2012) suggested that the development will become a prevalent area and there were reviews
also stating that the design of Exhibition Road had fairly low road clutter and it can improve the overall
wheelchair-users accessibility (RBKC.Gov, 2016)
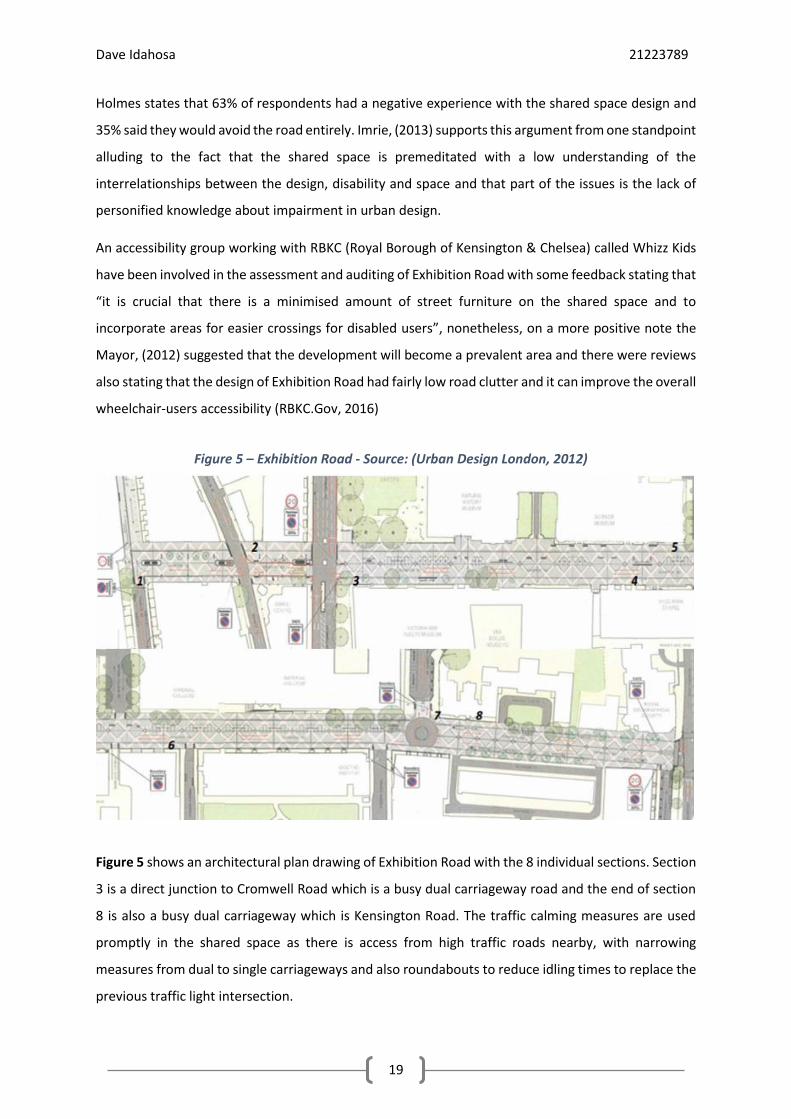
Figure 5 shows an architectural plan drawing of Exhibition Road with the 8 individual sections. Section
3 is a direct junction to Cromwell Road which is a busy dual carriageway road and the end of section
8 is also a busy dual carriageway which is Kensington Road. The traffic calming measures are used
promptly in the shared space as there is access from high traffic roads nearby, with narrowing
measures from dual to single carriageways and also roundabouts to reduce idling times to replace the
previous traffic light intersection.
Figure 5 – Exhibition Road - Source: (Urban Design London, 2012)
Dave Idahosa 21223789
20
2.13. Elwick Square, Ashford:
Elwick Square is the central area of a larger regeneration project that began in Ashford in 2008. It had
a No. 2 rank for the chosen locations on MVA consultancy’s shared space ranking (Moody et al, 2014).
The former layout of the Elwick square was simply a busy bending junction with traffic lights and
management system in place, however it was transformed into a spacious square area for free
movement and better flow of traffic. With total local funding of around £15million.
The development comprised of an integrated design team of engineers, transport/urban planners and
architects. A consultation scheme was undertaken to establish resident’s preference and framework
for localised designs. There is constant flow of traffic from the centre of the town towards the
international station and also neighbourhoods and residential areas. (Tomaney, 2015).
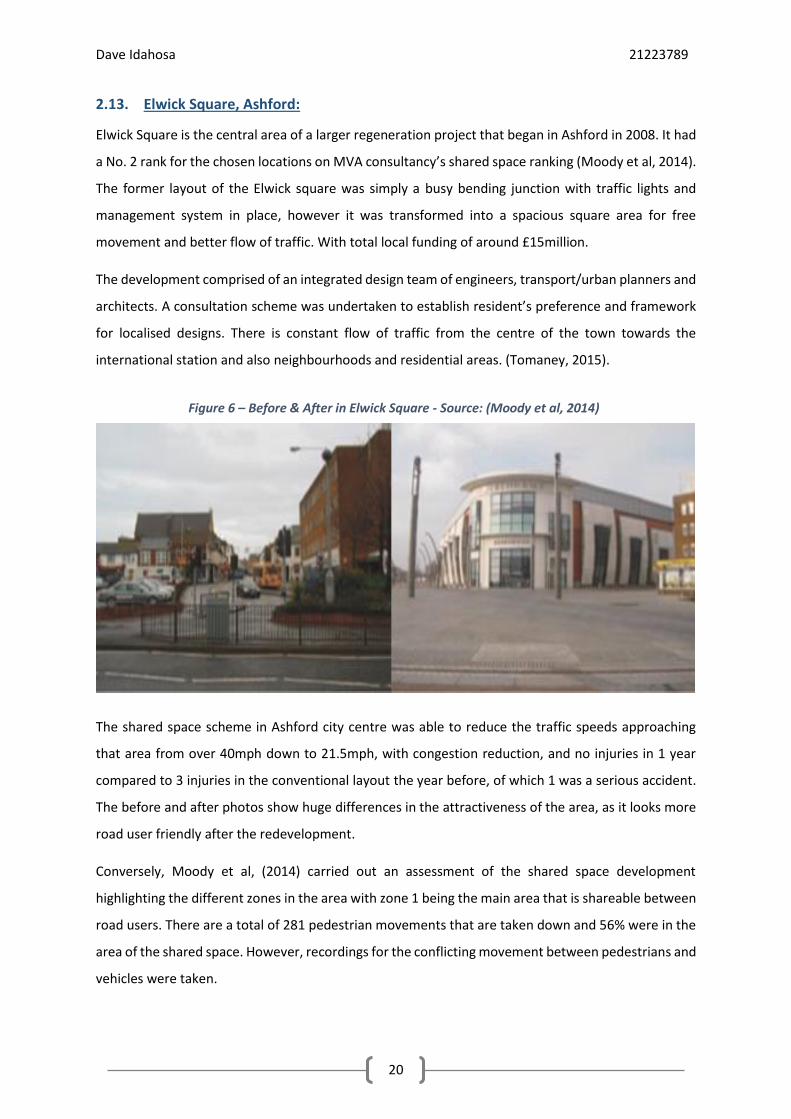
The shared space scheme in Ashford city centre was able to reduce the traffic speeds approaching
that area from over 40mph down to 21.5mph, with congestion reduction, and no injuries in 1 year
compared to 3 injuries in the conventional layout the year before, of which 1 was a serious accident.
The before and after photos show huge differences in the attractiveness of the area, as it looks more
road user friendly after the redevelopment.
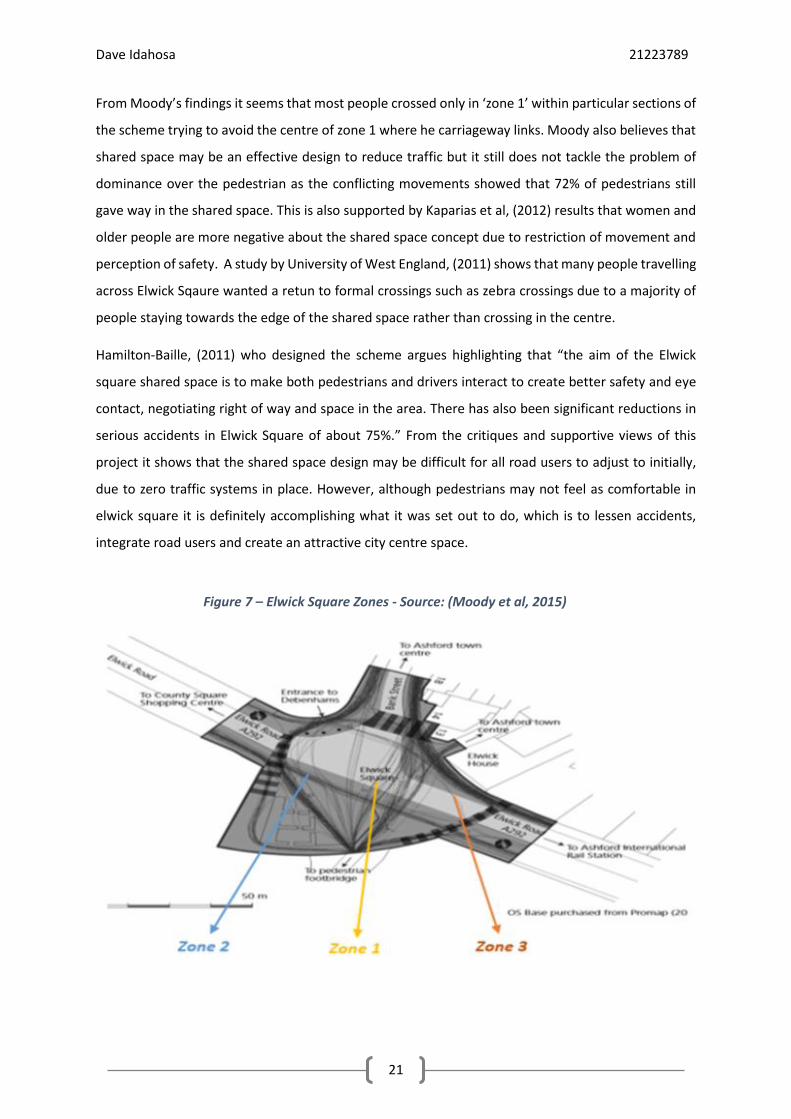
Conversely, Moody et al, (2014) carried out an assessment of the shared space development
highlighting the different zones in the area with zone 1 being the main area that is shareable between
road users. There are a total of 281 pedestrian movements that are taken down and 56% were in the
area of the shared space. However, recordings for the conflicting movement between pedestrians and
vehicles were taken.
Figure 6 – Before & After in Elwick Square - Source: (Moody et al, 2014)
Dave Idahosa 21223789
21
From Moody’s findings it seems that most people crossed only in ‘zone 1’ within particular sections of
the scheme trying to avoid the centre of zone 1 where he carriageway links. Moody also believes that
shared space may be an effective design to reduce traffic but it still does not tackle the problem of
dominance over the pedestrian as the conflicting movements showed that 72% of pedestrians still
gave way in the shared space. This is also supported by Kaparias et al, (2012) results that women and
older people are more negative about the shared space concept due to restriction of movement and
perception of safety. A study by University of West England, (2011) shows that many people travelling
across Elwick Sqaure wanted a retun to formal crossings such as zebra crossings due to a majority of
people staying towards the edge of the shared space rather than crossing in the centre.
Hamilton-Baille, (2011) who designed the scheme argues highlighting that “the aim of the Elwick
square shared space is to make both pedestrians and drivers interact to create better safety and eye
contact, negotiating right of way and space in the area. There has also been significant reductions in
serious accidents in Elwick Square of about 75%.” From the critiques and supportive views of this
project it shows that the shared space design may be difficult for all road users to adjust to initially,
due to zero traffic systems in place. However, although pedestrians may not feel as comfortable in
elwick square it is definitely accomplishing what it was set out to do, which is to lessen accidents,
integrate road users and create an attractive city centre space.
Figure 7 – Elwick Square Zones - Source: (Moody et al, 2015)
Dave Idahosa 21223789
22
2.14. Conclusion
In conclusion, it is evident that from the literature review there are many factors that play a part in
the shared space approach. Practicality of shared space in relation to imperative factors such as travel
behaviour, speed limits, road layout, traffic volume and flow and the environmental impacts are all
influential in the urban design. As there are differing perspectives on the effectiveness of the design
there must be consideration to what works well, where it works well and also its limitations.
Findings from Moody et al, (2014) suggest that pedestrians will tend to move comfortably without the
presence of vehicles and also that the probability of pedestrians crossing in the less congested area in
the centre of the shared space is higher. Other sources such as Hamilton-Baille, (2008) who is
completely in favour of the design concept accentuates the point that shared space can be imagined
as an ice rink and the more caution drivers pay towards pedestrians the safer the area will be. With
notable advantages from shared space and diminishing accident rates, the UK government intends to
fund more shared space schemes within many busy areas and even locations of low road traffic. There
are various observations that show the overall benefits such as the health advantages from increase
in walking, cycling and reduction of CO2 emissions from vehicles to the growing economic benefits like
the upsurge in visitors, tourists, augmented impel of property and business value and overall improved
footfall in the area. Moreover, the overall performance of Shared Space depends on the geometry of
the road, traffic tendencies and the urbanisation of the location.
Dave Idahosa 21223789
23
3. METHODOLOGY
3.1. Overview In this chapter of the paper, there will be identification of the methodology and analysis for the study
alongside gathering data and research methods that have been utilised. The vital phases of the
methodology are intended to achieve the aims and objectives of the study by data collection and
comparative analysis that can be evaluated accordingly.
The prime purpose of the methodology is to assess the effectiveness of selected shared space schemes
whilst considering a range of factors to observe the benefits and the limitations of the urban design
under different settings such as roads and intersections. In order to justify its overall effectiveness
there must be an analytical appraisal of the quantitative and qualitative data and use of AADT,
accident rates and CO2 emission data. to establish its effect on walking and cycling to produce an
embodied scope of where shared space works best and under what conditions. Each of these
components that will be explored contribute to the everyday safety, efficiency and social integration
of road networks.
3.2. Data Collection & Analysis Data collection is a major part of this research and consists of multiple types that can be utilised for
assessment of study. Qualitative, quantitative and combination of both are useful when comparing or
comprehending patterns for this particular topic. Qualitative data involves collecting data by gathering
perspectives to evaluate through surveys, interviews and discussions. Qualitative data on the other
hand involves collecting data that can then be rendered into numerical data by depiction of graphs
and tallies for the use of comparisons and statistical analysis that can help draw conclusions from the
data gathered.
Some quantitative and research data will be secondary from vital and pinnacle sources involved with
the study topic and the qualitative data will be primary data from questionnaires. Qualitative data was
used to get an assured viewpoint of road users and the effects shared space directly has on them when
they use it. Quantitative data was used to analyse the effects of shared space over a period of time
with multiple factors involved as this supports the analysis to yield a balanced evaluation.
Dave Idahosa 21223789
24
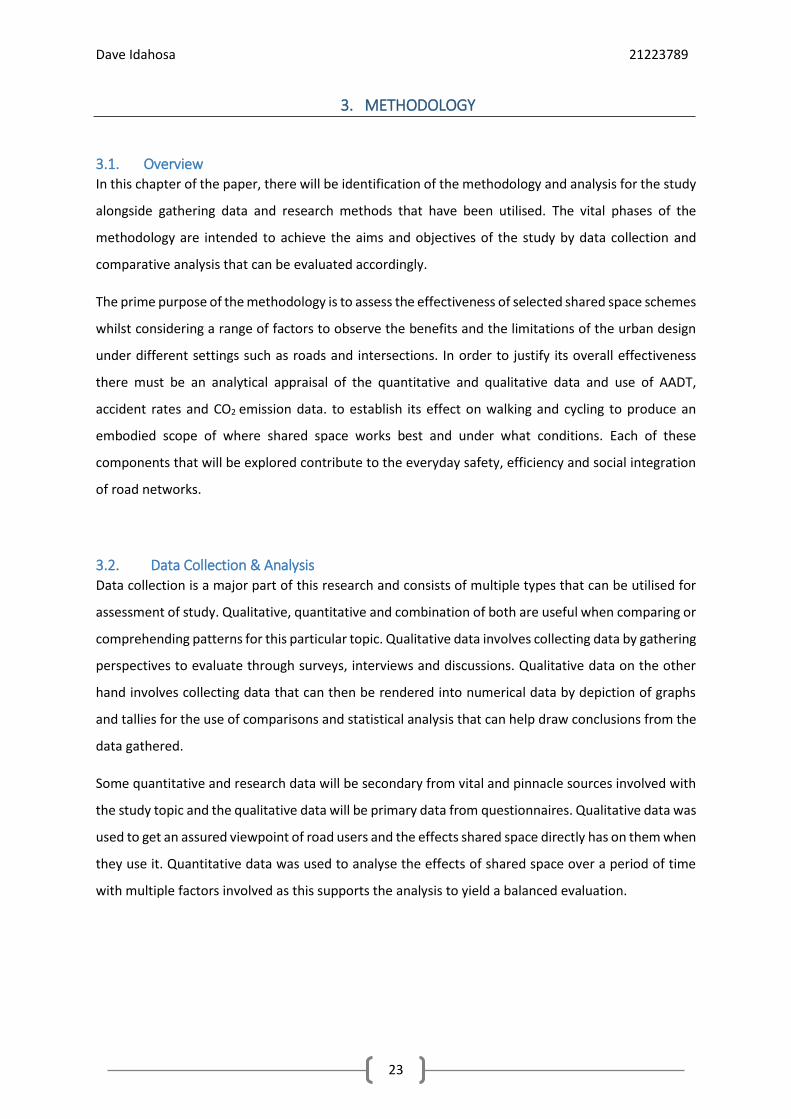
3.3. Observation
Below consists of before and after images of Exhibition Road where the improvements,
limitations and general streetscape is reviewed. The pictures taken after the reconstruction
are primary observations, in which a visit to the site was made. Observations were on a
Thursday 7/04/2016 at 11am and on a Saturday 9/04/2016. The reason for this was to see
differences in traffic flow, the overall environment and to show the changes in the area.
Figure 8 – Before redevelopment.1 - Source: Google Images, (2010)
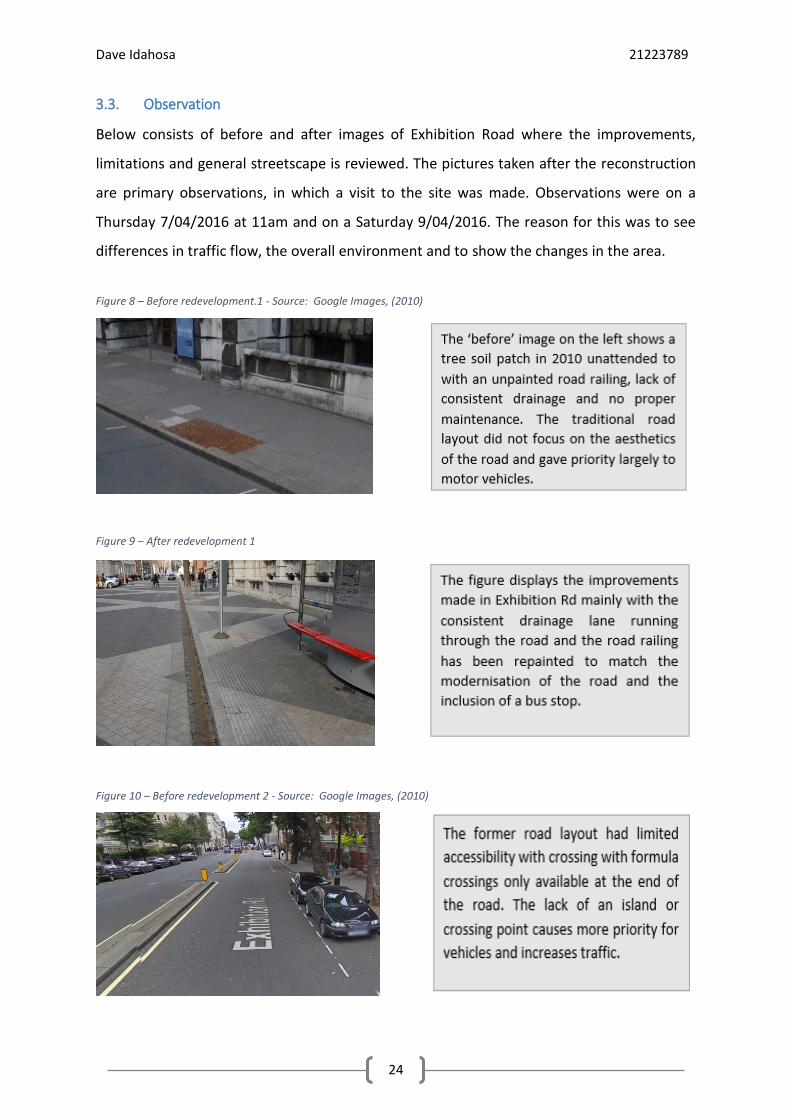
Figure 10 – Before redevelopment 2 - Source: Google Images, (2010)
Figure 9 – After redevelopment 1
Dave Idahosa 21223789
25
Figure 11 – After redevelopment 2
Figure 12 – Before redevelopment 3 - Source: Google Images, (2010)
Figure 13 – After redevelopment 3 - Source: Google Images, (2015)
Dave Idahosa 21223789
26
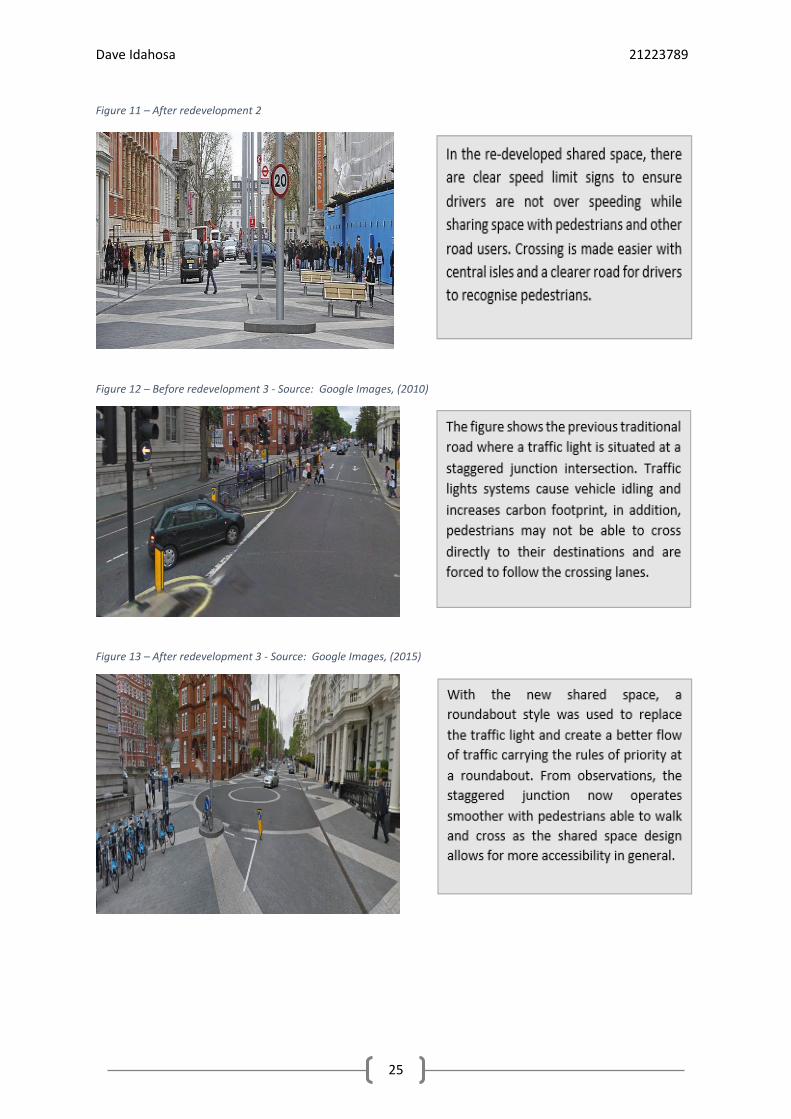
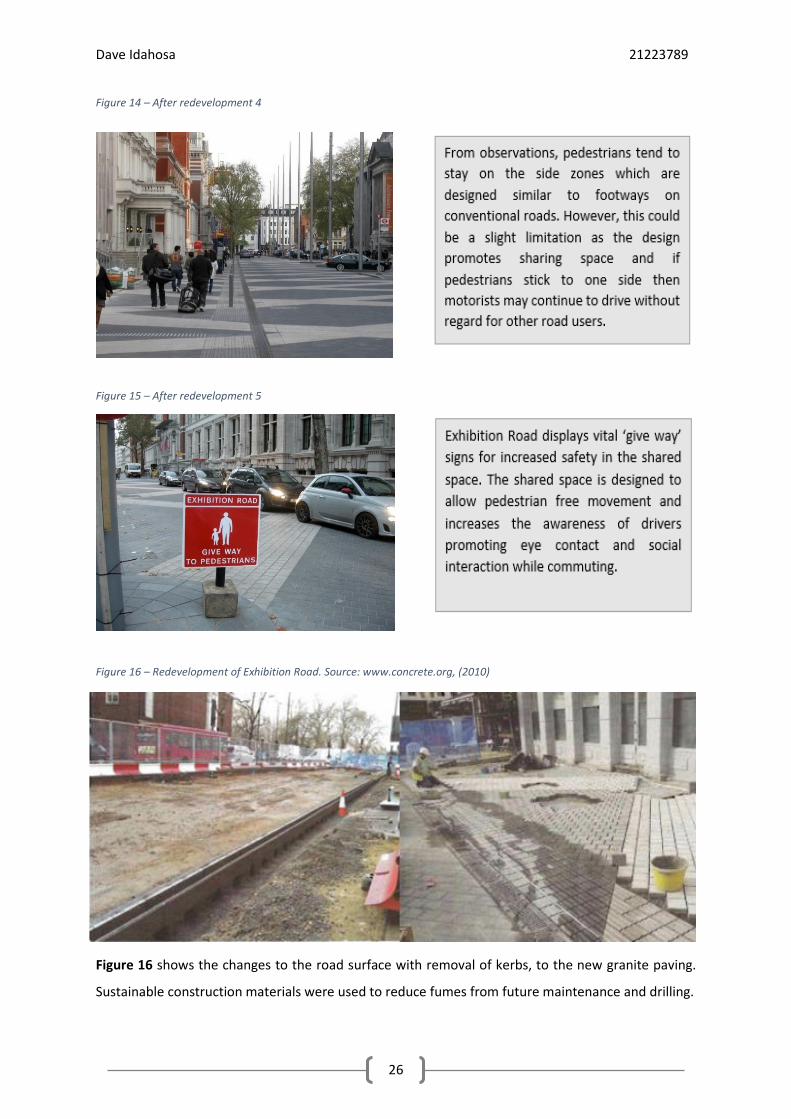
Figure 16 shows the changes to the road surface with removal of kerbs, to the new granite paving.
Sustainable construction materials were used to reduce fumes from future maintenance and drilling.
Figure 16 – Redevelopment of Exhibition Road. Source: www.concrete.org, (2010)
Figure 14 – After redevelopment 4
Figure 15 – After redevelopment 5

Dave Idahosa 21223789
27
3.4. Primary Research: Survey Questionnaire
The fundamental focus of the questionnaire is to gather a range of perspectives to determine what
the views of shared spaces are and how it affects people’s daily commuting. shared space feasibility.
Two surveys are reviewed for Exhibition Road and Elwick Square in which the results are compared to
understand which shared space is more effective in relation to their respective road layouts.
3.5. Exhibition Road Survey
3.5.1. Question 1
This question was posed to determine the locality of the participants which would help give a better
scope on the familiarity with the shared space in Exhibition Road. From the results above, evidently
the majority is 65% therefore the majority of the respondents did not live local to Exhibition road
compared to 35% of respondents who did live locally and are familiar with the area. The respondents
who live closer to the shared space road are likely to have a better understanding of the everyday
impacts of the road layout, some respondents thought living in the area would not be a problem
however it would be busy for a living area due to the urbanisation, volume of pedestrians and overall
traffic during the day.
Are you a resident or live local to Exhibition Road, South Kensington?
35%
65%
YES NO
Figure 17 – Chart representing results of question 1. Source: Authors own, (2016)
Dave Idahosa 21223789
28
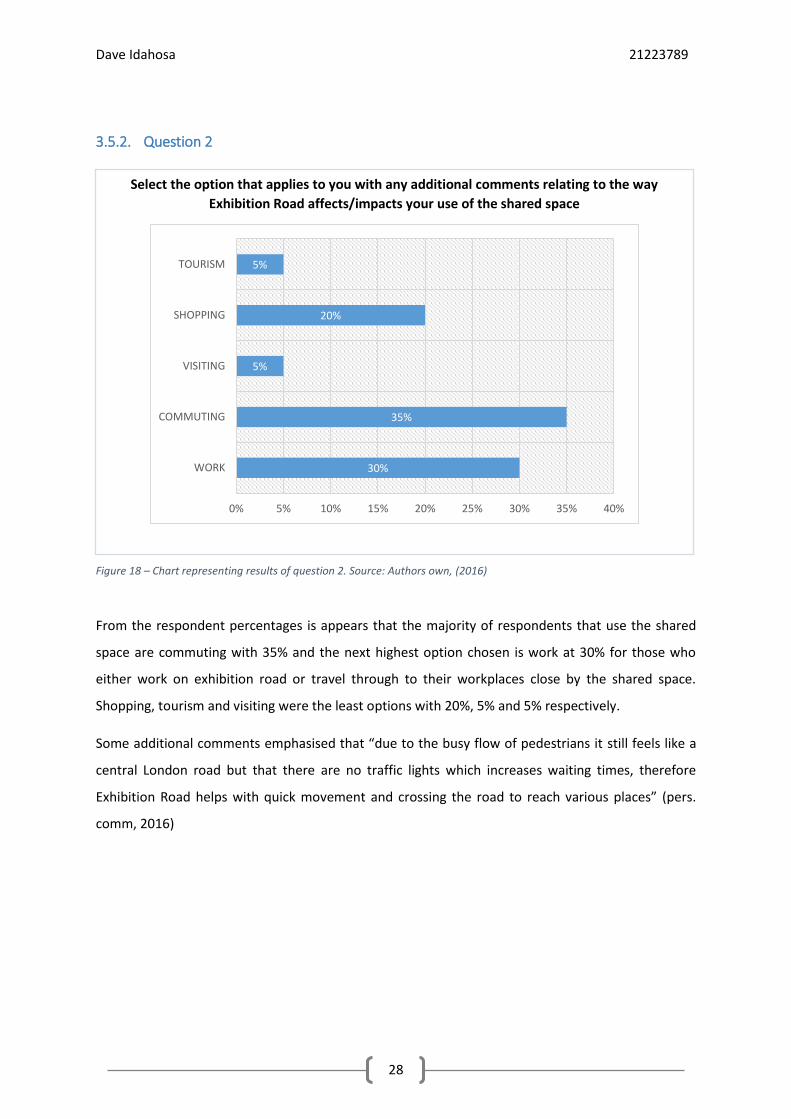
3.5.2. Question 2
From the respondent percentages is appears that the majority of respondents that use the shared
space are commuting with 35% and the next highest option chosen is work at 30% for those who
either work on exhibition road or travel through to their workplaces close by the shared space.
Shopping, tourism and visiting were the least options with 20%, 5% and 5% respectively.
Some additional comments emphasised that “due to the busy flow of pedestrians it still feels like a
central London road but that there are no traffic lights which increases waiting times, therefore
Exhibition Road helps with quick movement and crossing the road to reach various places” (pers.
comm, 2016)
Select the option that applies to you with any additional comments relating to the way
Exhibition Road affects/impacts your use of the shared space
30%
35%
5%
20%
5%
0% 5% 10% 15% 20% 25% 30% 35% 40%
WORK
COMMUTING
VISITING
SHOPPING
TOURISM
Figure 18 – Chart representing results of question 2. Source: Authors own, (2016)

Dave Idahosa 21223789
29
3.5.3. Question 3
This question relates closely with question 1 as a preliminary query to understand the familiarity
people have with the shared space. It was carried out around the area of the shared space but not
particularly in Exhibition Road for more accuracy/unbiased result and a range of responses away from
the actual premises.
The chart in figure 19 portrays that 78% responded ‘Yes’ which means the overall majority of people
are familiar with the Exhibition Road shared space and are aware of the aims of the road design to
reduce segregation between vehicles. There are 2 comments stating that the area is attractive, busy
and is a popular route for people in the heart of South Kensington (pers. comm, 2016).
The ‘aware of the area but not familiar’ category was 17% and included responses from people who
are aware of the shared space intention and aims in Exhibition Road but are not particularly familiar
with the area. The respondents who were not familiar as shown account for 5%.
Are you familiar with the shared space located in Exhibition Road, South Kensington that
decreases segregation between vehicles, pedestrians and cyclists and removes street clutter,
traffic lights and road kerbs?
78%
5%
17%
YES
NO
Aware of the Area but notFamiliar
Figure 19 – Chart representing results of question 2. Source: Authors own, (2016)
Dave Idahosa 21223789
30
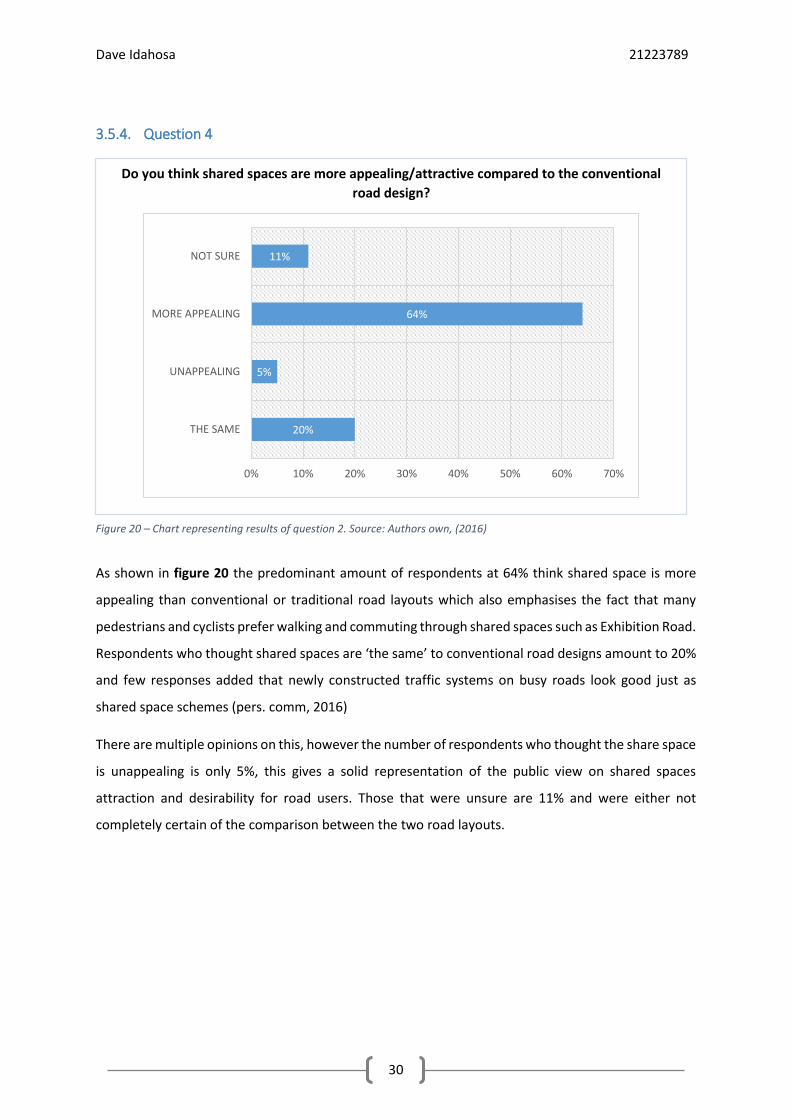
3.5.4. Question 4
As shown in figure 20 the predominant amount of respondents at 64% think shared space is more
appealing than conventional or traditional road layouts which also emphasises the fact that many
pedestrians and cyclists prefer walking and commuting through shared spaces such as Exhibition Road.
Respondents who thought shared spaces are ‘the same’ to conventional road designs amount to 20%
and few responses added that newly constructed traffic systems on busy roads look good just as
shared space schemes (pers. comm, 2016)
There are multiple opinions on this, however the number of respondents who thought the share space
is unappealing is only 5%, this gives a solid representation of the public view on shared spaces
attraction and desirability for road users. Those that were unsure are 11% and were either not
completely certain of the comparison between the two road layouts.
Do you think shared spaces are more appealing/attractive compared to the conventional
road design?
20%
5%
64%
11%
0% 10% 20% 30% 40% 50% 60% 70%
THE SAME
UNAPPEALING
MORE APPEALING
NOT SURE
Figure 20 – Chart representing results of question 2. Source: Authors own, (2016)

Dave Idahosa 21223789
31
3.5.5. Question 5
From the results shown in the figure 21 the research question delves deeper into the perspective of
the respondents and road user safety. 38% of respondents stated ‘No’ disagreeing with Department
for Transports proposition about safety and some of the comments stating “the traffic volume during
busy periods of the day it can make pedestrians uneasy, often cyclists prefer staying to a particular
place when there’s a lot of vehicles passing through” (pers. comm, 2016).
The larger portion of respondents, 47% support the urban design and its safety benefits and believe it
has complemented road users to move freely and has reduced speeds that give slightly more safety
assurance when commuting or crossing. In addition, it can be assumed that the 15% who said not sure
may not see a drastic difference and feel as though the scheme works well but not clear enough to
make a conclusion on the overall safety improvements.
In terms of your familiarity and perspective, do you think the re-development project has
improved the safety of road users?
47%
38%
15%
YES NO NOT SURE
Figure 21 – Chart representing results of question 2. Source: Authors own, (2016)
Dave Idahosa 21223789
32
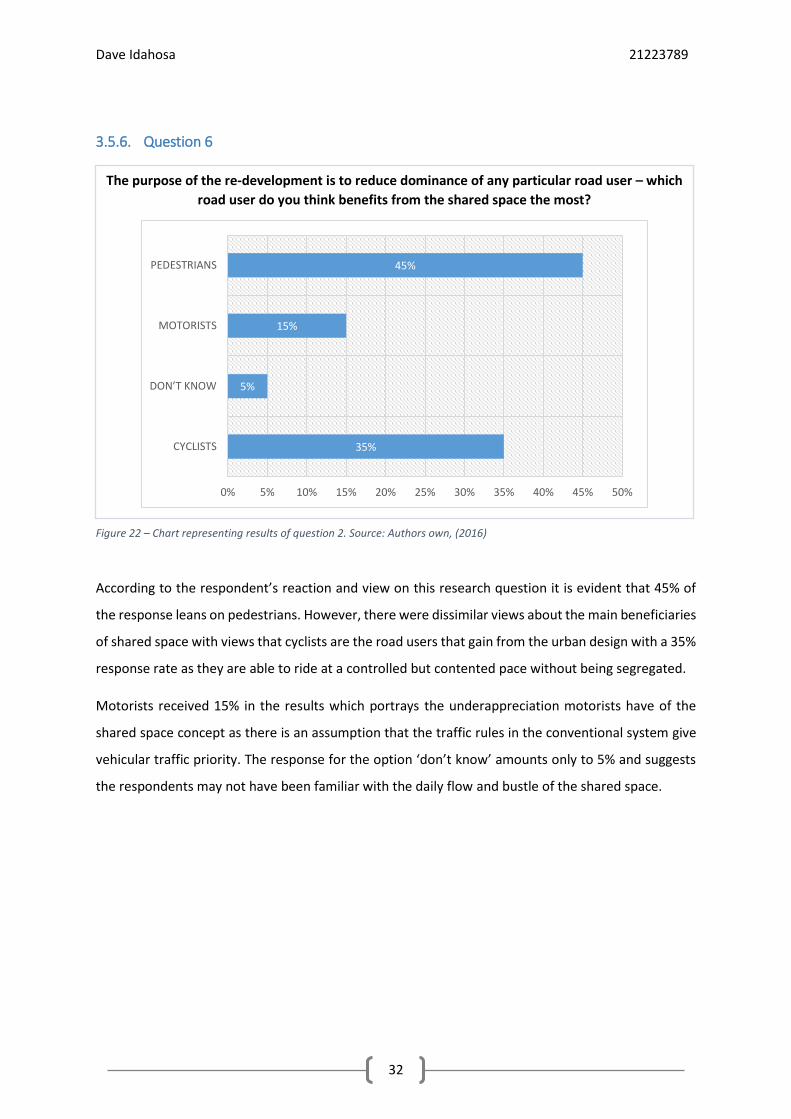
3.5.6. Question 6
According to the respondent’s reaction and view on this research question it is evident that 45% of
the response leans on pedestrians. However, there were dissimilar views about the main beneficiaries
of shared space with views that cyclists are the road users that gain from the urban design with a 35%
response rate as they are able to ride at a controlled but contented pace without being segregated.
Motorists received 15% in the results which portrays the underappreciation motorists have of the
shared space concept as there is an assumption that the traffic rules in the conventional system give
vehicular traffic priority. The response for the option ‘don’t know’ amounts only to 5% and suggests
the respondents may not have been familiar with the daily flow and bustle of the shared space.
The purpose of the re-development is to reduce dominance of any particular road user – which
road user do you think benefits from the shared space the most?
35%
5%
15%
45%
0% 5% 10% 15% 20% 25% 30% 35% 40% 45% 50%
CYCLISTS
DON’T KNOW
MOTORISTS
PEDESTRIANS
Figure 22 – Chart representing results of question 2. Source: Authors own, (2016)

Dave Idahosa 21223789
33
3.5.7. Question 7
Various concerns have been raised and continuously strained about the comfort and safety of disabled
users in shared spaces. This question was given to analyse the road users views on disabled people
and those that use wheelchairs.
As shown in the results, 47% of the respondents answered ‘No’ feel as though less abled people will
not feel more relaxed or comfortable in the shared space this can be a result of many factors such as
designated points for smoother crossing and social integration in a particular space that may leave the
less abled vulnerable.
41% responded answering ‘Yes’ and added comments saying, the traffic flow is reduced and overall
vehicle speeds is continuing to decrease (pers. comm, 2016). The 12% response supported ‘No
difference’ and indicates that 4 times the amount of these views are either in favour of the shared
space for disabled users or are completely not.
Do you think a less abled person with a push/wheel chair would feel relaxed and comfortable
using the shared space structure?
41%
47%
12%
YES NO NO DIFFERENCE
Figure 23 – Chart representing results of question 2. Source: Authors own, (2016)

Dave Idahosa 21223789
34
3.5.8. Question 8
From the information that has been collected from this research question as shown in figure 24 the
‘Extremely difficult’ category is low with only 10%, However, the majority with 55% answered that is
‘A lot easier’ to cross within the shared space compared to traditional roads. These views are also
supported by RBKC, (2016), highlighting that many of the changes brought by the development helps
for better pedestrian’s movement such as tactile lines and high quality street lighting.
A 5% feedback was collected for ‘Not sure’ implying that the responses did not have enough clarity or
experience to make a judgement between the two road layouts. A 30% response rate was given for
the option ‘About the same’ in which the results show that pedestrians who are not familiar with a
shared space layout view the arrangement as equal with traditional roads.
When walking, is it easy to cross within the shared space?
30%
5%
55%
10%
0% 10% 20% 30% 40% 50% 60%
ABOUT THE SAME
NOT SURE
A LOT EASIER
EXTREMELY DIFFICULT
Figure 24 – Chart representing results of question 2. Source: Authors own, (2016)

Dave Idahosa 21223789
35
3.5.9. Question 9
The overall optimal choices made by the respondents illustrates that comfortability in shared space
has very diversified views. However, the average score for ‘very comfortable’ is 8, this category
received the highest overall score and suggests that most people feel comfortable despite the
constant traffic flow in the shared space.
Mildly comfortable received 6 on average, an average score of 3 was given for ‘no difference in
comfort’, added comments included that travelling with children or disabled pedestrians can be
challenging within both shared spaces and conventional roads.
Uncomfortable scored slightly above the previous option with 4 on average. Very uncomfortable
results were mainly feedback from less abled users and mothers with young children. Their views are
sustained on the premise that drivers can often forget about the shared space concept and speed up
disregarding the speed limit.
Considering the different traffic flows and volumes in various periods of the day, how
comfortable do you feel on a scale between 1-10 in the Exhibition Road shared space?
0
1
2
3
4
5
6
7
8
9
VERYCOMFORTABLE
MILDLYCOMFORTABLE
NO DIFFERENCE INCOMFORT
UNCOMFORTABLE VERYUNCOMFORTABLE
Figure 25 – Chart representing results of question 2. Source: Authors own, (2016)

Dave Idahosa 21223789
36
3.5.10. Question 10
The three categories shown on figure 26 were the main and highest categories consisting of 3 different
limitations/choices. Category 1 is 48% and many respondents’ stated that due to the new shared
spaces implemented, there are more new housing developments being built nearby the urban designs
which attract increases residents. The other parts of category 1 involve uncertainty about right of way
as many pedestrians feel that adaptation is needed when using shared space (pers. comm, 2016)
Category 2, is 42% and fairly close to category 1, in addition, as there are not as much less abled users
in the shared space, the results may not depict much of their view in the category. Category 3 is the
lowest with 10% as the limitations noted in the category are usually tackled such as accidents and
overall congestion.
What are some of the challenges/limitations faced with the revitalisation of Exhibition Road?
1. Category 1 – Uncertainty about right of way, Overpopulation from new build
housing nearby shared space, lack of priority for disabled users (blind, partially
sighted and deaf)
2. Category 2 – Reduced feeling of personal safety, lower probability for disabled
users to safely navigate around with motorists and cyclists, dominance of
motorists
3. Category 3 - Challenges distinguishing footpaths and roadway, increased
accidents, traffic congestion due to design layout
48%42%
10%0%
10%
20%
30%
40%
50%
60%
Category 1 Category 2 Category 3
Figure 26 – Chart representing results of question 2. Source: Authors own, (2016)
Dave Idahosa 21223789
37
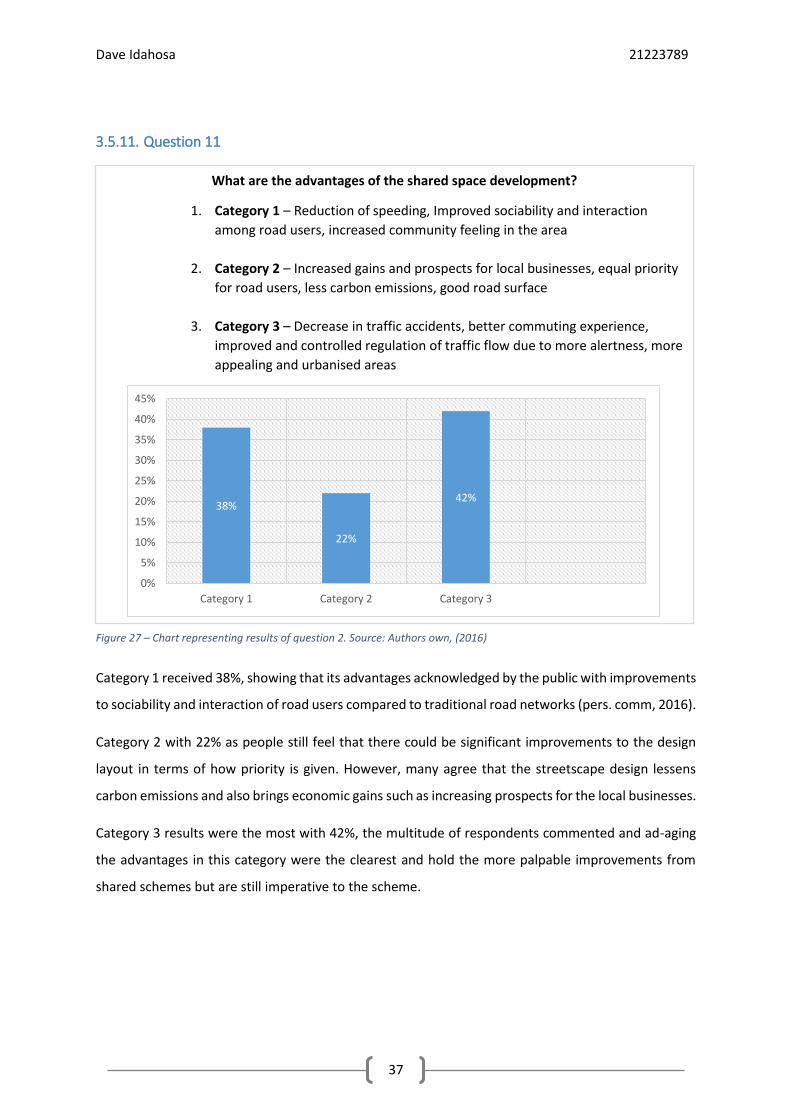
3.5.11. Question 11
Category 1 received 38%, showing that its advantages acknowledged by the public with improvements
to sociability and interaction of road users compared to traditional road networks (pers. comm, 2016).
Category 2 with 22% as people still feel that there could be significant improvements to the design
layout in terms of how priority is given. However, many agree that the streetscape design lessens
carbon emissions and also brings economic gains such as increasing prospects for the local businesses.
Category 3 results were the most with 42%, the multitude of respondents commented and ad-aging
the advantages in this category were the clearest and hold the more palpable improvements from
shared schemes but are still imperative to the scheme.
What are the advantages of the shared space development?
1. Category 1 – Reduction of speeding, Improved sociability and interaction
among road users, increased community feeling in the area
2. Category 2 – Increased gains and prospects for local businesses, equal priority
for road users, less carbon emissions, good road surface
3. Category 3 – Decrease in traffic accidents, better commuting experience,
improved and controlled regulation of traffic flow due to more alertness, more
appealing and urbanised areas
38%
22%
42%
0%
5%
10%
15%
20%
25%
30%
35%
40%
45%
Category 1 Category 2 Category 3
Figure 27 – Chart representing results of question 2. Source: Authors own, (2016)
Dave Idahosa 21223789
38
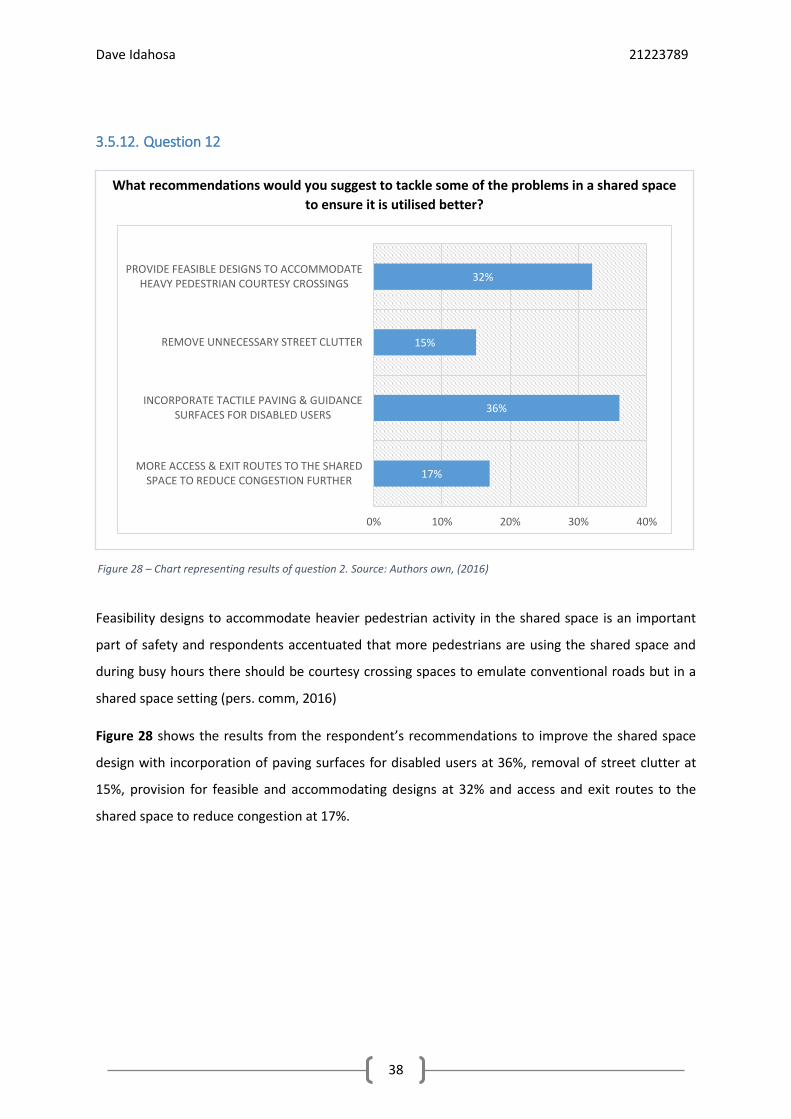
3.5.12. Question 12
Feasibility designs to accommodate heavier pedestrian activity in the shared space is an important
part of safety and respondents accentuated that more pedestrians are using the shared space and
during busy hours there should be courtesy crossing spaces to emulate conventional roads but in a
shared space setting (pers. comm, 2016)
Figure 28 shows the results from the respondent’s recommendations to improve the shared space
design with incorporation of paving surfaces for disabled users at 36%, removal of street clutter at
15%, provision for feasible and accommodating designs at 32% and access and exit routes to the
shared space to reduce congestion at 17%.
What recommendations would you suggest to tackle some of the problems in a shared space
to ensure it is utilised better?
17%
36%
15%
32%
0% 10% 20% 30% 40%
MORE ACCESS & EXIT ROUTES TO THE SHAREDSPACE TO REDUCE CONGESTION FURTHER
INCORPORATE TACTILE PAVING & GUIDANCESURFACES FOR DISABLED USERS
REMOVE UNNECESSARY STREET CLUTTER
PROVIDE FEASIBLE DESIGNS TO ACCOMMODATEHEAVY PEDESTRIAN COURTESY CROSSINGS
Figure 28 – Chart representing results of question 2. Source: Authors own, (2016)

Dave Idahosa 21223789
39
3.5.13. Question 13
From the results it can be summarised that the majority still feel that disabled users are not
accommodated well in the shared space design, despite various measures put in place by the
government. According to RBKC, (2012), most visually impaired users felt that they could use the paths
on the shared space however, the overall inference is that there are still a lot of improvements that
could be made to suit the disabled users’ needs especially visually impaired users.
These views correlate with the findings from a major survey, (Guide-dogs cites TNS-BMRB, 2010)
stating that “A survey of 500 blind and partially sighted individuals transpired that 91% were
concerned when using the shared space streetscape.
Do you think disabled/visually impaired users find this design layout more suitable for their
needs compared to conventional road layouts?
25%
40%
20%
15%
YES NO THE SAME NOT SURE
Figure 29 – Chart representing results of question 2. Source: Authors own, (2016)

Dave Idahosa 21223789
40
3.5.14. Question 14
Figure 30 shows that equal priority has a total of 30% with a close percent to pedestrians showing that
road user movement is not necessarily restrained. Pedestrians priority is at 37% this indicates that
respondents understand that the shared space concept systematically creates a way for pedestrians
to have more priority compared to traditional roads.
Cyclists have a lower rate with 20% as they would usually stop for pedestrians and less abled people.
Motorists have 15%, and are known to have priority in conventional road networks due to the traffic
systems and speed limits.
Motorists are known to have priority on conventional roads, who do you feel has priority in
the shared space?
37%
20%
13%
30%
0% 5% 10% 15% 20% 25% 30% 35% 40%
PEDESTRIANS
CYCLISTS
MOTORISTS
EQUAL PRIORITY
Figure 30 – Chart representing results of question 2. Source: Authors own, (2016)

Dave Idahosa 21223789
41
3.5.15. Question 15
Figure 31 shows that ‘Effective’ received the most responses with 40% and implies that the public
perception is that shared space is effective but not necessarily very effective due to the further
improvements that could be made for users with disability. Pedestrians are able to acknowledge the
overall safety, social blend, economic and environmental benefits as well as the attractiveness and
the welcoming feeling of the shared space environment. (pers. comm, 2016).
The responses for the ineffectiveness of the shared space are lower in total as reduced accidents,
consistency in drivers obeying speed limits and showing courtesy to other road users is highly evident.
Furthermore, the results are reflective of the public’s view and how shared spaces make pedestrians
feel during all hours. The effectiveness could be a result of the straight road layout and its locality as
suggested by DFT, (2011).
How effective do you think the shared space concept and design is?
0%
5%
10%
15%
20%
25%
30%
35%
40%
45%
VERY EFFECTIVE EFFECTIVE INEFFECTIVE VERY INEFFECTIVE DONT KNOW
Figure 31 – Chart representing results of question 2. Source: Authors own, (2016)

Dave Idahosa 21223789
42
3.6. Secondary Research: Survey Questionnaire The surveys on Elwick Square were conducted through UWE by Moody and Melia, (2014), to
understand the road user perception of the newly designed shared space. As the Elwick Square shared
space road layout is a circular area in comparison to Exhibition Road which is straight/linear and simply
a road design. The responses give a scope on the comfort and effectiveness of the shared space.
3.7. Elwick Square, Ashford Survey:
From the results in the table it is evident that the shared space scheme in Elwick Square did not receive
a complete positive feedback with the majority of respondents stating that they feel unsafe or
uncomfortable within the shared space.
According to Moody and Melia, (2014), “80% of those interviewed from the survey claimed that they
felt safer with the previous road scheme, although a few respondents preferred the new shared
space” various comments highlighted the aesthetics of the scheme stating that the area is more open
and helps the pedestrians identify the traffic better.
Table 1 – Elwick Square Questionnaire. Source: Moody and Melia, (2014)

Dave Idahosa 21223789
43
As recorded from observations, approximately 72% of the conflictions in movements resulted in the
pedestrian giving way to the vehicles and in 20% of the occurrences motorists showed courtesy and
gave way to the pedestrians within various areas in the shared space, this leaves over 50% of
conflicting movement where the pedestrian stopped at the edge of zone 2 until traffic passed by and
the area was free as shown in figure 6 of the comparative review.
Other comments that relate to this survey about Elwick Square consists of suggestions that underline
safety and general awareness regardless of the shared space, for example an older participant stated
that “despite the feeling of improved safety in the area, pedestrians still need to be cognisant and
aware that vehicles still pass through often” (Hammond and Musselwhite, 2013). The perspective of
Hammond and Musselwhite was formed to contrast Moody and Melia’s findings in which there will
be a balanced perspective and outcome on the Elwick Square shared space.
3.8. Survey Evaluation
From the results and perspectives of both surveys and case studies of 2 highly renowned and different
road layout shared spaces, it is evident that the overall feedback from the participants and general
public emphasise on the considerable safety improvements, especially for Exhibition Road. However,
through the case studies, secondary sourced surveys and further research on Elwick Square shows
that the reception for that particular shared space is not as positive as Exhibition Road.
There are many factors that have an influence on the effectiveness of a shared space, such as the
topography, location, road layout and urbanisation. The topography of the Elwick Square was said to
have slightly uneven surfaces which were designed to be used as unofficial kerbs however, mobility
impairment participants complained about the inconvenience of this compared to exhibition road as
the topography is flat and the design is a straight road compared to Elwick Square which is more
circular and covers a large perimeter with more space. Pedestrians are able to have a dedicated area
in Exhibition road whereas in Elwick Square there are more conflicts causing disruption to movement.
Dave Idahosa 21223789
44
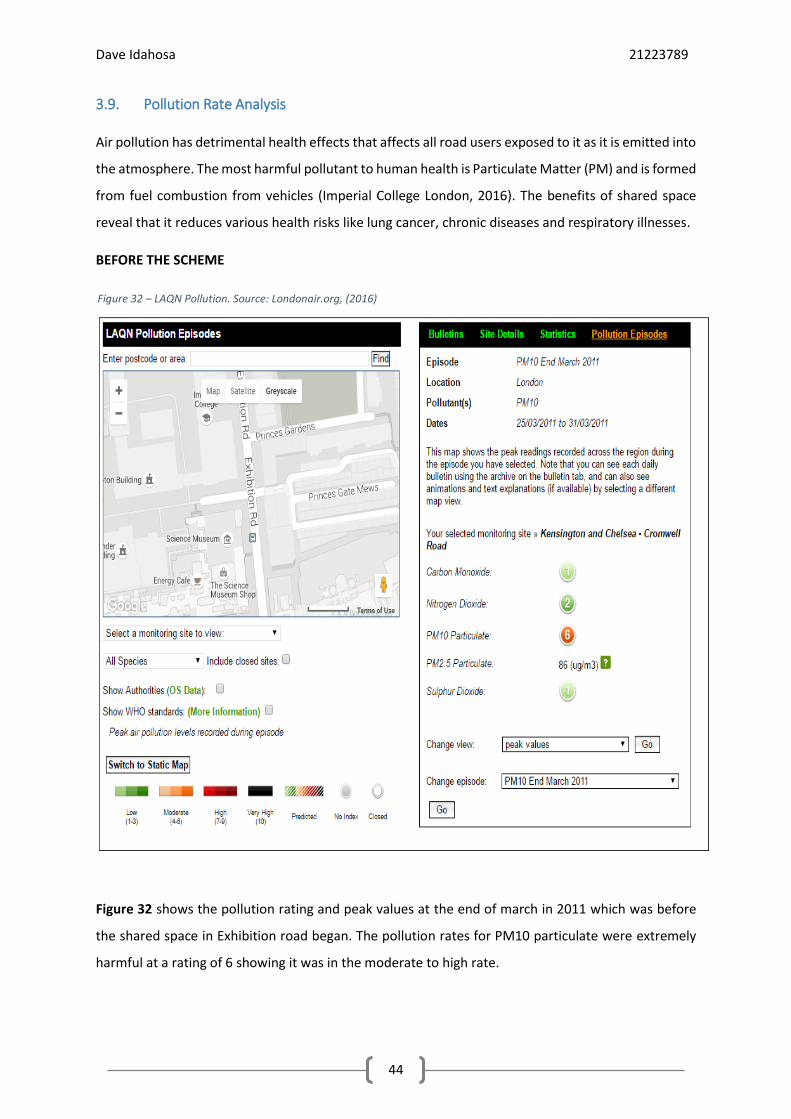
3.9. Pollution Rate Analysis
Air pollution has detrimental health effects that affects all road users exposed to it as it is emitted into
the atmosphere. The most harmful pollutant to human health is Particulate Matter (PM) and is formed
from fuel combustion from vehicles (Imperial College London, 2016). The benefits of shared space
reveal that it reduces various health risks like lung cancer, chronic diseases and respiratory illnesses.
BEFORE THE SCHEME
Figure 32 shows the pollution rating and peak values at the end of march in 2011 which was before
the shared space in Exhibition road began. The pollution rates for PM10 particulate were extremely
harmful at a rating of 6 showing it was in the moderate to high rate.
Figure 32 – LAQN Pollution. Source: Londonair.org, (2016)

Dave Idahosa 21223789
45
AFTER THE SCHEME
In Figure 33 it shows the pollution rating and peak values have drastically changed at the end of march
in 2016, 4 years after the scheme in Exhibition road began. The pollution rates for PM10 particulate
have reduced from 6 down to 3 in which Exhibition road and the general neighbouring area has a low
PM10 particulate pollution due to less vehicle carbon emissions (Londonair.org, 2016)
Figure 33 – LAQN Pollution. Source: Londonair.org, (2016)
Dave Idahosa 21223789
46
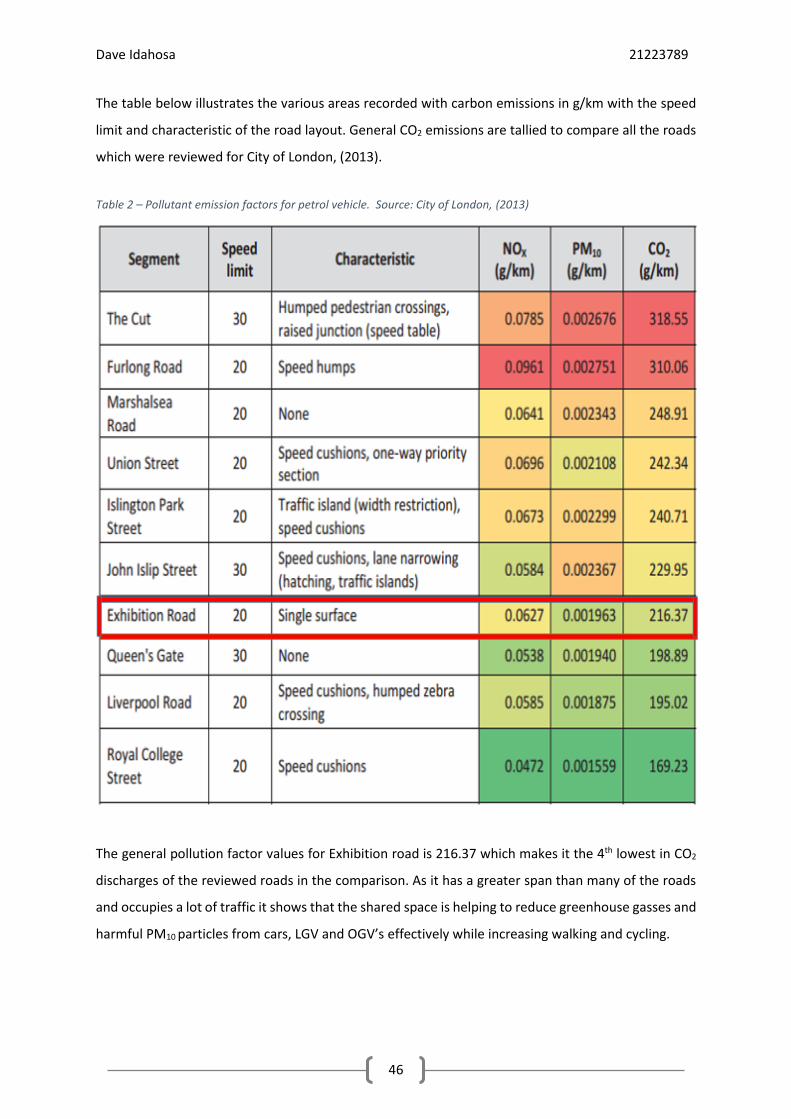
The table below illustrates the various areas recorded with carbon emissions in g/km with the speed
limit and characteristic of the road layout. General CO2 emissions are tallied to compare all the roads
which were reviewed for City of London, (2013).
The general pollution factor values for Exhibition road is 216.37 which makes it the 4th lowest in CO2
discharges of the reviewed roads in the comparison. As it has a greater span than many of the roads
and occupies a lot of traffic it shows that the shared space is helping to reduce greenhouse gasses and
harmful PM10 particles from cars, LGV and OGV’s effectively while increasing walking and cycling.
Table 2 – Pollutant emission factors for petrol vehicle. Source: City of London, (2013)

Dave Idahosa 21223789
47
3.10. Accident Rates and Collision Data
Below shows the provisional collision data provided by TFL, (2014) with the collision record between
2006 to 2014, showing the safety improvements after the scheme.
The data shows a 40% drop in total serious accidents and a drastic change of 28 less total accidents
between 2006 and 2014. However, the slight collisions are still inconsistent, the data shows that in
the opening of the Exhibition Road there were 12 slight collision incidents implying that road users
were still adapting to the new road layout, thereafter the following year in 2013 there was a reduction
of 4 slight collisions and a further drop to only 1 collision in 2014 showing the safety improvement of
the scheme.
Figure 34 – Exhibition Road personal injury collisions data. Source: TFL, (2014)

Dave Idahosa 21223789
48
Figure 35 displays a portion of Exhibition road closer to Cromwell road where major traffic is apparent.
The image is taken from crashmap.co.uk and shows that at a heavy traffic zone there is only one
serious accident which dates back to 2006 before the shared space was introduced.
Figure 36 shows Elwick square’s recent collisions, with only 1 serious incident that occurred in 2012
nearby and a few slight collisions on Elwick road. Since this project opened on 2008, it is evident that
it may not be as effective as Exhibition road as a serious accident was reported after its opening.
Figure 35 – Exhibition Road collisions data. Source: Crash map, (2016)
Figure 36 – Elwick Square collisions data. Source: Crash map, (2016)

Dave Idahosa 21223789
49
3.11. Pedestrian Count & Crossing Movement
Figure 37 is taken from The Royal Borough of Kensington and Chelsea, (2014) where a monitoring
assessment was carried out between 2012-2014. The data also shows the pedestrian counts over
various sections in Exhibition Road, with the more popular and heavy pedestrian areas between
section 4 to 8. From the graphical data it is evident that shared space increases walking with the
counts drastically improving from phase 1 to phase 4 with only a 6% drop in section 8 (2012-2014).
Figure 38 shows the Pedestrian crossing movements that are observed in sections 1-8 of Exhibition
Road and also over a period of 4 phases. It is clear that the most pedestrian crossing activity occurs
around section 8 and in phase 4 (2014). Section 1 portrays a solid increase in crossing movements with
a rise from 261 in 2012 to 651 in 2014, this signifies a 149% increase. This analysis signifies that from
the opening of the scheme until 2014 there was large increase in comfort with crossing, showing
development with social interaction and overall effectiveness to boost more walking.
Figure 37 – Pedestrian Count (2012-2014). Source: RBKC, (2014)
Figure 38 – Pedestrian Crossing Movements (2012-2014). Source: RBKC, (2014)
Dave Idahosa 21223789
50
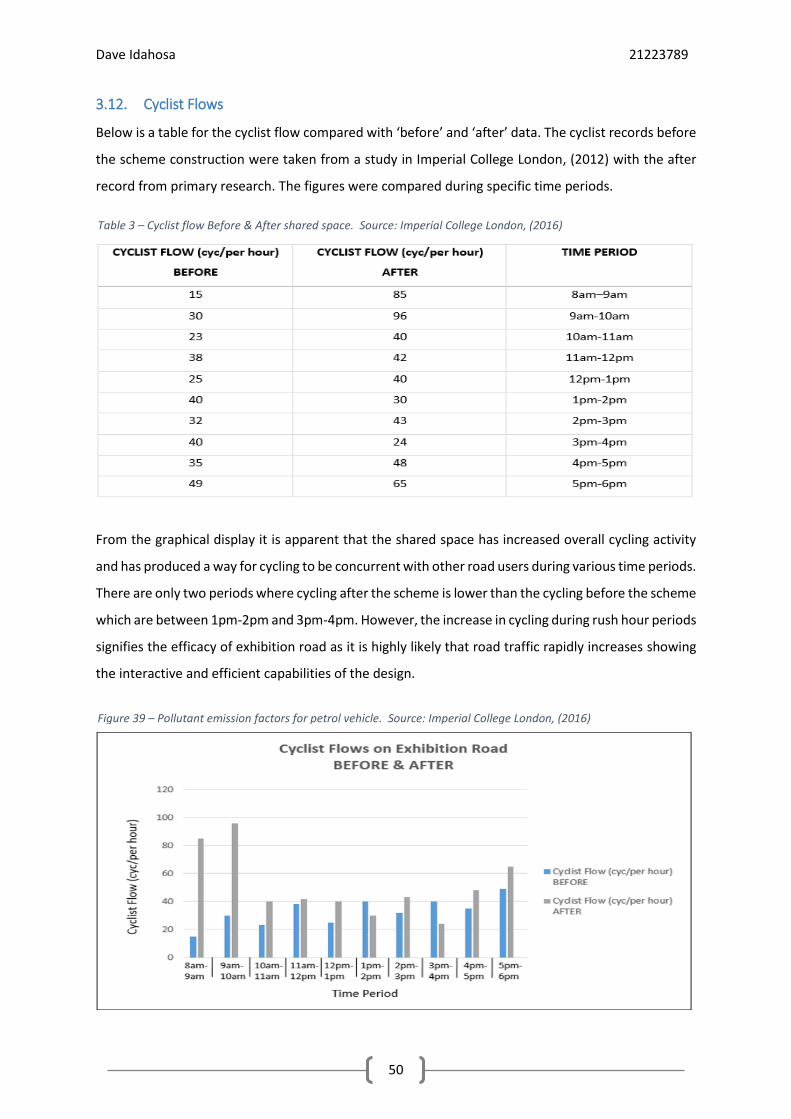
3.12. Cyclist Flows
Below is a table for the cyclist flow compared with ‘before’ and ‘after’ data. The cyclist records before
the scheme construction were taken from a study in Imperial College London, (2012) with the after
record from primary research. The figures were compared during specific time periods.
From the graphical display it is apparent that the shared space has increased overall cycling activity
and has produced a way for cycling to be concurrent with other road users during various time periods.
There are only two periods where cycling after the scheme is lower than the cycling before the scheme
which are between 1pm-2pm and 3pm-4pm. However, the increase in cycling during rush hour periods
signifies the efficacy of exhibition road as it is highly likely that road traffic rapidly increases showing
the interactive and efficient capabilities of the design.
Table 3 – Cyclist flow Before & After shared space. Source: Imperial College London, (2016)
Figure 39 – Pollutant emission factors for petrol vehicle. Source: Imperial College London, (2016)
Dave Idahosa 21223789
51
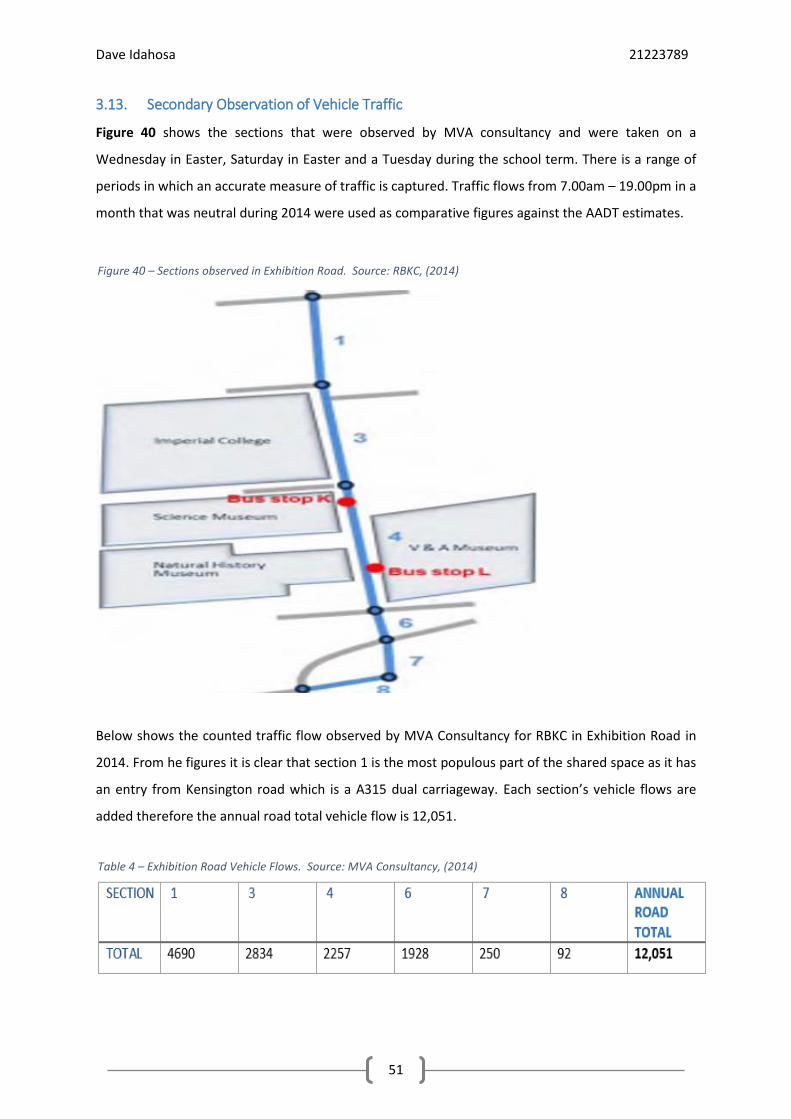
3.13. Secondary Observation of Vehicle Traffic
Figure 40 shows the sections that were observed by MVA consultancy and were taken on a
Wednesday in Easter, Saturday in Easter and a Tuesday during the school term. There is a range of
periods in which an accurate measure of traffic is captured. Traffic flows from 7.00am – 19.00pm in a
month that was neutral during 2014 were used as comparative figures against the AADT estimates.
Below shows the counted traffic flow observed by MVA Consultancy for RBKC in Exhibition Road in
2014. From he figures it is clear that section 1 is the most populous part of the shared space as it has
an entry from Kensington road which is a A315 dual carriageway. Each section’s vehicle flows are
added therefore the annual road total vehicle flow is 12,051.
Figure 40 – Sections observed in Exhibition Road. Source: RBKC, (2014)
Table 4 – Exhibition Road Vehicle Flows. Source: MVA Consultancy, (2014)

Dave Idahosa 21223789
52
3.14. AADT Estimation
Figure 41 shows the procedure in calculating the AADT flows from collection of the 12-hour traffic
flows. According to Rogers, (2003), the guide note ‘TA 79/99’ traffic capacity of urban roads (DoT,
1999) gives the maximum hourly flows for various types.
The tabular information is taken from Roger, (2008, p.133), on design traffic flows for urban roads (2
way). The peak hour flow will be multiplied by 12 to attain the estimated 12-hour traffic flow.
12-hour flow (7.00am – 19.00pm): 900 x 12 = 10,800 vehicles
E Factor to convert the 12-hour value to a 16-hour value: 10,800 x 1.15 = 12,420
M Factor to convert the 16-hour value to AADT
Therefore,
Annual Traffic = 12,420 x 360 = 4,471,200 vehicles
Annual Average Daily Traffic (AADT) = 4,471,200 ÷ 365 = 12,250 vehicles
This traffic flow falls in the range of both a (S2) single 2 lane carriageway road and a (WS2) wide single
carriageway road.
Figure 41 – Deriving AADT Flows. Source: Lancashire.gov.uk, (2016)
Table 5 – Design Traffic Flows. Source: Rogers, (2008)

Dave Idahosa 21223789
53
The map view below displays the total vehicle traffic per day with additional environmental
information. According to Clean Air in London (2014), a part of Transport for London, the daily traffic
is 13886. However, these estimates may not be close to the AADT and Secondary source results but
there is tendency for traffic to fluctuate during various seasons.
Figure 43 shows that both roads are perpendicular to Exhibition Road and have a much higher AADT
than Exhibition road which is due to Kensington Road and Cromwell Road being busy dual carriage
traditional roads compared to Exhibition road which reduces overflow of vehicles in its shared space.
MVA’s observation amounted to 12,051, the AADT manual estimation is 12,250 and the online data is
13,886. This comparison also shows that the online data is fairly close to the 2 other values, however,
the actual AADT results for exhibition road is considerably less, it can be assumed that Kensington and
Cromwell road which are both double the vehicle traffic of Exhibition road will still be much higher
even with counts and estimation. This shows a form of effectiveness in terms of reduction of vehicle
volume from its previous layout in 2010/2011 to the new shared space design from 2012-2016.
Figure 42 – Exhibition Road Total Vehicles Per Day. Source: Clean Air in London, Transport for London (2014)
Figure 43 – Kensington Rd & Cromwell Rd Vehicles Per Day. Source: Clean Air in London, TFL (2014)
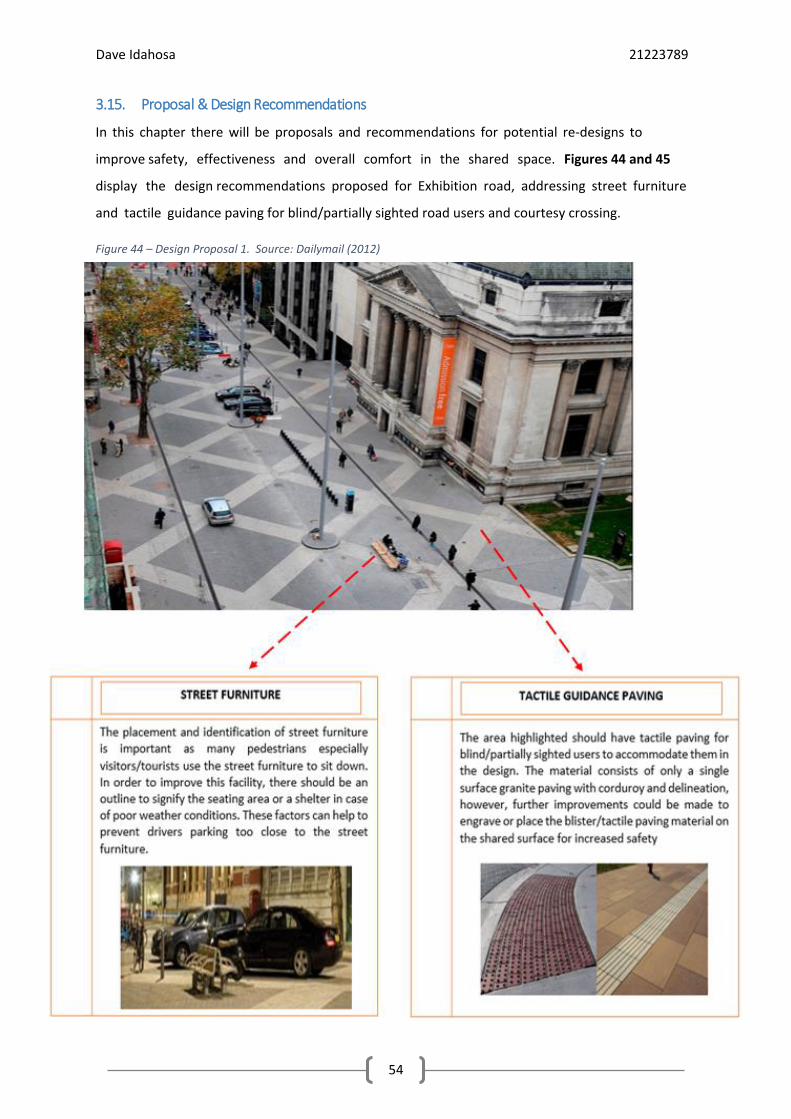
Dave Idahosa 21223789
54
3.15. Proposal & Design Recommendations
In this chapter there will be proposals and recommendations for potential re-designs to
improve safety, effectiveness and overall comfort in the shared space. Figures 44 and 45
display the design recommendations proposed for Exhibition road, addressing street furniture
and tactile guidance paving for blind/partially sighted road users and courtesy crossing.
Figure 44 – Design Proposal 1. Source: Dailymail (2012)
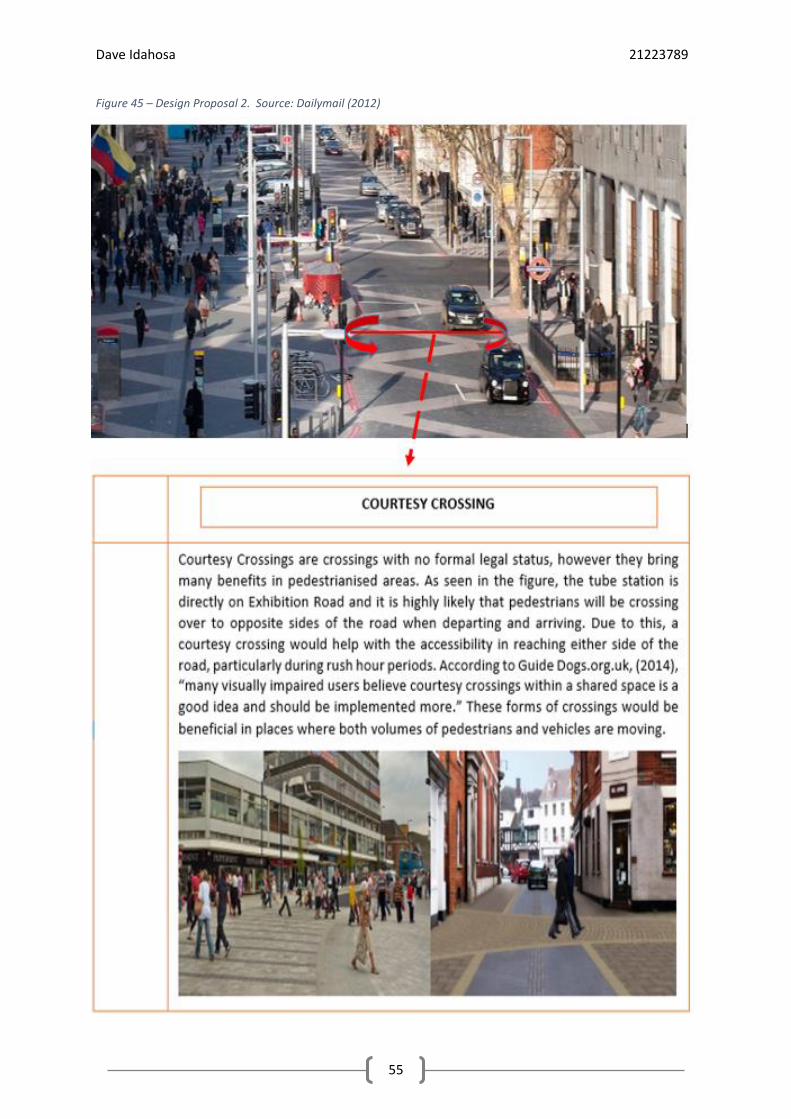
Dave Idahosa 21223789
55
Figure 45 – Design Proposal 2. Source: Dailymail (2012)

Dave Idahosa 21223789
56
4. DISCUSSION & FINDINGS
From the methodology results, it shows that the implementation of shared spaces in the selected
locations has had a drastic bearing and impact on the external and internal factors that determines a
road, intersection and areas effectiveness. By looking at the results there are cohesive thoughts on
the pros and cons of the design and common perspectives on the minute details about the shared
space that influences everyday commuting in the area. After a diverse set of questions, it is clear that
the majority of people are comfortable with the Exhibition Road shared space with only a focal
concern relating to disabled, and visually impaired users and their mobility in the urban design. The
road layout and area type of a shared space plays a vital part in how the road user interaction and
flow of movement develops.
The reduction of vehicle traffic has assisted in the environmental air quality with reduction huge
reductions PM10 pollutants and with a roundabout at a staggered junction replacing the traffic light
system and 3 side road accesses, it supports smoother flow of traffic in the shared space. Pedestrian
crossing and counts were shown to have increased throughout a 4 phase observation conducted by
MVA Consultancy in 2014. The analysis shows that the concept pushes conformity on all road users
when using a shared area. On the other hand, there are disputes on the commuting comfort in the
shared space as there is more vehicle traffic in section 1 of the shared space which starts from
Kensington Road to Imperial College London. The various areas with diverse traffic volumes are an
important aspect of establishing where effective management of traffic is necessary.
AADT results were shown in 3.14 of chapter 3 and shows that the estimated daily traffic amounts to
12,250 in close similarity with MVA Consultancy’s result of 12,051. The values were used to compare
against online database values which were 13,886 for Exhibition Road and 30270 and 44148 for
Kensington Rd and Cromwell Rd respectively which are both perpendicular to the shared space and
are also heavy traffic dual carriageway roads which Exhibition Rd was before its re-development,
showing the radical traffic improvements.
Project Limitations
After an in-depth assessment of the acquired data, it is also important to highlight that there were a
few project limitations. Review of Exhibition Road and Elwick Square were a main part of this study,
however a primary limitation was that there was no accessibility to visit the site and observe with
much of the analysis coming from a viable secondary source. The other limitation was a lack of study
from previous layouts of both schemes, this is a minor constraint however all factors are vital when
investigating effectiveness of a particular urban design.

Dave Idahosa 21223789
57
5. CONCLUSION
In conclusion, throughout the paper, multiple facets of shared space have been considered and
studied. There are many views and opinions on shared space that relate to its parameters and positive
impacts. After reviewing the literature, it shows that effectiveness of shared spaces depends largely
on several factors such as topography, urbanisation, road layout and proximity to heavy traffic areas.
Although there are many benefits with shared space, its concept may not be feasible for every specific
area or location. As seen in the study, Exhibition road was deemed successful due to its
implementation with a mitigation design to tackle conventional road issues while keeping its road
network flowing accordingly. In contrast, Elwick Square received less positive reviews from renowned
engineering educators due to its layout being an open area without dedicated zones for more
pedestrian use, which caused road users to feel ostracised. The architecture is important for the
design to transcend traffic volume and vehicle flow problems. Nonetheless, each area is inimitable
and for a shared space to be efficient in its design it must ensemble the area and its needs.
Walking and cycling is another major aspect of shared space as its increase signifies a growth
economically. Despite these advantages there is still sceptical views on safety for disabled users and
how they are accommodated into the design. Shared space schemes must acknowledge the needs of
disabled and visually impaired pedestrians to be able to improve the designs with necessary
adaptations such as guidance paving, courtesy crossings, raised levels for bus stops and possible road
narrowing/speed calming measures.
After analysing shared spaces main areas of impact, it is evident that it is an effective method of traffic
engineering. However, it is recommended that alterations to the design of shared spaces especially
Exhibition Road and Elwick Square incorporate all road users to improve equal priority and sociability.
Reduction of pollution and accidents are major benefit’s and with a feasible design that equals the
road layout it is a prospective alternative to conventional roads.

Dave Idahosa 21223789
58
REFERENCES
Achilles. M and Elzey. D. (2013), Environmental Sustainability in Translantic Perspective: A
Multidisciplinary Approach: UK: Palgrave Macmillan
Allianz, (2012), Mixing Cars, cyclists and pedestrians may appear more dangerous, but Shared Space
approaches are reducing accidents across Europe [Online] Available at:
https://www.allianz.com/en/about_us/open-knowledge/topics/mobility/articles/120416-why-
making-streets-risky-improves-road-safety.html/ [Accessed: 10/12/2015]
Ben-Joseph. E. (1995), Changing the Residential Street Scene: Adapting the shared street (Woonerf)
concept to the suburban environment, Vol. 61(4), pp.504-515
Bicycle Network, (2015), Shared Space – Cycling [Online] Available at:
https://www.bicyclenetwork.com.au/general/for-government-and-business/2838/ [Accessed:
10/12/2015]
Buxton, P. (2015), Metric Handbook: Planning & Design Data: Abingdon, UK & New York, US:
Routledge – Taylor & Francis Group
Cassini. M. (2007), Shared Space: No Idle Matter – Signal-Controlled or Signal-Free: UK: Traffic
Technology International, pp.57-59
CIHT, (2010), Manual for Streets 2 – Wider Application of the Principles: London, UK: CIHT
(Chartered Institution of Highways and Transportation
Crash Map, (2016), Incident & Casualties [Online] Available at http://crashmap.co.uk/ [Accessed:
12/04/2016]
Collarte. N, (2012) The Woonerf Concept: Re-thinking a Residential Street in Somerville, p.4-5:
Cambridge, U.S: Tufts University
Cornwall Council, (2015), Types of Traffic Calming and other Engineering Measures [Online] Available
at: https://www.cornwall.gov.uk/transport-and-streets/roads-highways-and-pavements/traffic-
calming/types-of-traffic-calming-and-other-engineering-measures/ [Accessed: 25/11/2015]
Department for Transport, (2011), Local Transport Note 1/11 – Shared Space: Norwich, UK: TSO (The
Stationery Office)
Department for Transport, Department for Communities and Local Government and Welsh
Assembly, (2007), Manual for Streets: London, UK: Thomas Telford Publishing
Dr. Gerlach. J, Dr. Methorst. R, Boenke. D and Leven. J, (2007), Shared Space: Safe or Dangerous? – A
contribution to objectification of a popular design philosophy: Toronto, Canada: Walk 21 Conference
Glenn. L and Castle. M. (2013), Cause and Effect essay: Traffic Problems of a Big City [Online]
Available at: http://www.scholaradvisor.com/essay-examples/effect-essay-traffic-problems-of-big-
city/ [Accessed: 27/11/2015]
Gov.uk, (2007), Manual for Streets: UK: Department for Transport and Department for Communities
and Local Government, pp.1-146
Guide Dogs, (2010), TNS Impact Report: Impact of shared surface streets and shared use pedestrian
cycle paths on the mobility and independence of blind and partially sighted people, pp.1-52
Dave Idahosa 21223789
59
Hamilton-Baille. B. (2008a), Shared Space: Reconciling people, places and traffic: UK: Built
Environment, Vol. 34(2), pp.161-181
Hammond. V. and Musslewhite. C, (2013), The attitudes, perceptions and concerns of pedestrians
and vulnerable road users to shared space: A case study from the UK: Bristol, UK: Journal of Urban
Designs – University of the West of England, Vol 18(1), pp. 78-97
Hebrow. D, (2014), The best roundabout design for cyclists. The safest Dutch design described and
an explanation of why this is the most suitable for adoption elsewhere [Online] Available at:
http://www.aviewfromthecyclepath.com/2014/05/the-best-roundabout-design-for-cyclists.html
[Accessed: 22/11/2015]
Hickman. R and Carson. G. (2006), Shared Space in the Kent Downs: A new approach to streetscape
design: UK: Halcrow Group & Association for European Transport and Contributors
Holmes, (2015), Accidents by Design: The Holmes Report on Shared Space in UK: The Institute of Highway Engineers Imperial College London, (2016), Air pollution: Exposomics [Online] Available at:
https://www.imperial.ac.uk/grantham/our-work/impacts-and-adaptation/health/air-pollution-
exposomics/ [Accessed: 9/04/2016]
Imrie. R. (2013), Shared Space and the Post Politics of Environmental Change: London, UK: Urban
Studies – Department of Geography, Kings College London, Vol 50(16), pp. 3446-3462
Making Space for Cycling, (2015), Making space for cycling – a guide for new developments and sreet
renewals [Online] Available at: http://www.makingspaceforcycling.org/ [Accessed: 11/12/2015]
Marshalls, (2013), Exhibition Road, The Royal Borough of Kensington & Chelsea [pdf] Available at:
http://www.marshalls.co.uk/dam-svc/AssetStore/Exhibition-Road-5457.pdf [Accessed: 24/11/2015]
Marshalls, (2013), Exhibition Road, The Royal Borough of Kensington & Chelsea [PDF] Available at:
http://www.marshalls.co.uk/dam-svc/AssetStore/Exhibition-Road-5457.pdf [Accessed: 13/12/2015]
McKone. J. (2010), ‘Naked streets’ without traffic lights improve flow and safety. The City Fix [Online]
Available at: http://thecityfix.com/blog/naked-streets-without-traffic-lights-improve-flow-and-
safety/ [Accessed: 27/11/2015]
Moody, S. and Melia, S. (2014), Shared Space: Research, policy and problems: Proceedings of the
Institution of Civil Engineers – Transport, Vol.167(6), pp.384-392
Newman, (2014), Reducing the Environmental Impact of Road Construction: Western Australia:
SBENRC – Curtin University, pp.2-82
Quimby. A. and Castle. J. (2006), A Review of Simplified Streetscape Schemes
RNIB, (2014), How many people in the UK have sight loss [Online] Available at:
https://help.rnib.org.uk/help/newly-diagnosed-registration/registering-sight-loss/statistics
[Accessed: 11/12/2015]
Shareable.net, (2015), Shared Space aims to create safer, more polite roads [Online] Available at:
http://www.shareable.net/blog/shared-space-aims-to-create-safer-more-polite-roads [Accessed:
13/11/2015]
https://www.imperial.ac.uk/grantham/our-work/impacts-and-adaptation/health/air-pollution-exposomics/

Dave Idahosa 21223789
60
Sinnet. D, Williams. K, Chatterjee. K, Cavill. N, (2011), Making the Case for Investment in the Walking
Environment: A review of the evidence, p.59-60: UK: University of the West of England, Bristol, Cavill
Associates
Strickland J. (2015), How Traffic Works [Online] Available at: http://auto.howstuffworks.com/car-
driving-safety/accidents-hazardous-conditions/traffic1.htm [Accessed: 27/11/2015]
TFL, (2014) Exhibition Road Collision Data [Online] Available at:
https://www.whatdotheyknow.com/request/road_casualties_and_collision_da [Accessed:
8/04/2016]
Thomas. C. and Wood. C. (2008), Discussion: Shared Space – Safe Space? - UK: Proceedings of the
Institution of Civil Engineers – Municipal Engineer, Vol 161(1), pp. 59-60
Tomaney. W. (2015), Case Study: A day trip to Ashford [Online] Available at:
http://www.rtpi.org.uk/media/10116/Case-Study-Ashford-Ring-Road-PDF-7.pdf [Accessed:
13/12/2015
Transport for London, (2010), Network Performance: Traffic Analysis Centre, TAC Traffic Note 1 –
Traffic Levels on Major Roads in Greater London [pdf] Available at: http://content.tfl.gov.uk/traffic-
note-1-traffic-levels-in-greater-london-2010.pdf [Accessed: 25/11/2015]
Wilkinson.D, (2014), Britains town centre roads need more shared spaces, expert says: The
Telegraph [Online] Available at: http://www.telegraph.co.uk/motoring/road-
safety/11072664/Britains-town-centre-roads-need-more-shared-spaces-expert-says.html
Williams. D, (2013) An evaluation of the estimated impacts of a 20mph speed restriction in Central
London (prepared for City of London): London, UK: Transport and Environmental Analysis Group,
Centre for Transport Studies, Imperial College London
Wordpress, (2013), Lessons from exhibition road [Online] Available at:
https://aseasyasridingabike.wordpress.com/2013/01/21/lessons-from-exhibition-road/ [Accessed:
13/12/2015]
Clean Air in London, TFL, (2014), How Polluted is my Road [Online] Available a:
http://www.howpollutedismyroad.org.uk/roads.php [Accessed: 13/04/2016]
Maynard. S and Ridout. A, (2010), Renovation of Exhibition Road: UK: Concrete.org.uk – Repair and
Strengthening