
Full Design
53
1 Airport Cooperative Research Program (ACRP) University Design Competition Life-Cycle Assessment of Airport Pavement Design Alternatives for Energy and Environmental Impacts Xiaodan Chen Chinmay Thakkar
Transcript of Full Design

1
Airport Cooperative Research Program (ACRP) University Design Competition
Life-Cycle Assessment of Airport Pavement
Design Alternatives for Energy and
Environmental Impacts
Xiaodan Chen
Chinmay Thakkar

2
Executive Summary
Almost 20000 airports are located throughout the United States today. Of those, approximately
8700 feature paved runways, taxiways, and ramps/aprons need regular maintenances to ensure
safety and daily operations. As one of the main infrastructure that occupied large area of the
airport, the adversely environmental problem associated with construction and rehabilitation
activities of the paved airport surface should not be neglected. Our team proposes an evaluating
method to improve the quantification of energy and environmental impact of airport runway
pavement design using life-cycle assessment approach. We also developed an Excel based LCA
tool to facilitate the quantification of energy consumption and greenhouse gas emission of
pavement project which is applicable to any airport runway design. In the LCA method, life-
cycle inventory data were compiled from literature database and field surveys to contractors. The
data variations in the material-related energy and emission rates were considered for sensitivity
analysis. The impact assessment focused on the cumulative energy demand and greenhouse gas
emission in the material, construction, and maintenance phases of pavement life-cycle. A
methodology was developed to consider upstream components related to process fuels in the
impact assessment. The results indicate that the expected pavement service life and maintenance
treatments significantly affect the comparison between hot-mix asphalt and Portland cement
concrete pavements. Although there are no general conclusions on pavement type selection, the
research findings bring awareness to airport authorities on the impact of pavement type on
energy consumption and greenhouse gas emission. The project-level analysis is suggested to be
conducted for selecting the sustainable design alternatives in the airport planning process.

3
Table of Contents
Contents 1. Problem Statement and Background .................................................................................................... 4
2. Summary of Literature Review ............................................................................................................. 6
3. Problem Solving Approach .................................................................................................................... 8
4. Description of the Technical Aspects .................................................................................................. 12
5. Safety Risk Assessment ...................................................................................................................... 36
6. Projected Impacts ............................................................................................................................... 37
7. Interactions with airport operators and industry experts .................................................................. 38
Appendix A. List of Complete Contact Information ................................................................................ 42
Appendix B. Description of the University .............................................................................................. 43
Appendix C. Description of Non-University Partners .............................................................................. 44
Appendix D. Sign-Off from for Faculty Advisor and Department Chair .................................................. 45
Appendix E. Evaluation of the Educational Experience Provided by the Project ................................... 47
Appendix F. Reference List with Full Citations ........................................................................................ 51
4
1. Problem Statement and Background
Construction and rehabilitation of airfield pavements produce significant impacts on energy
conservation and climate change resulting from the consumption of large amounts of
construction material and the operation of construction equipment. Currently, there is no
comprehensive solution to quantify environmental sustainability in airport pavement design and
maintenance to support decision making process and guide the future growth with respect to
economic consideration and performance requirements.
Almost 20000 airports are located throughout the United States today. Of those,
approximately 8700 feature paved runways, taxiways, and ramps/aprons. With the continuous
increase of air traffic volumes and the development of heavy wide-body aircraft, airfield
pavements require frequent maintenance and rehabilitation activities in order to provide
sufficient structure capacity and satisfactory surface characteristics. As one of the main
infrastructure that occupied large area of the airport, the adversely environmental problem such
as energy consumption and climate changes associated with construction and maintenance
activities of the paved airport surface should not be neglected.
Specific policy and regulation related to environmental sustainability evaluation of
airport pavement type selection and rehabilitation strategy are rarely seen. The factors affecting
the selection of pavement type and rehabilitation strategy may include agency experience, the
long-term performance of alternatives, the impact on airport operations, construction and
maintenance costs, and environmental and sustainability considerations (Hallin et al.). The life-
cycle cost analysis (LCCA) has been mandated by the Federal Aviation Administration (FAA)
Advisory Circular to be the part of the pavement type or treatment selection process. The LCCA

5
is mostly used to aid airport planners in identifying the most cost-effective pavement
construction and rehabilitation strategies.
Although efforts have been brought into assessing and reducing GHG emission in order
to alleviate the undesirable environmental burden generated by pavement construction and usage,
most of the pavement environmental studies are focused on highway roads but a very few on
airport runways. Life cycle assessment (LCA) is a well-developed and widely used to measure
an object’s environmental impact through its entire life. When it is utilized in road construction
projects, it can take all the GHG emission generated from construction to end of life into
consideration and quantifies the environmental impact within a defined system boundary.
Traditionally, a life cycle assessment includes material, construction, usage, maintenance and
rehabilitation, and end of life. Lots of research and studies have been conducted on each
component. However, most of the work focuses on one or two aspects (such as material and
construction, or maintenance alone) rather than building a complete framework. What's more, the
previous studies only concentrate on carbon dioxide (CO2), while the other emission factors like
methane (CH4) and nitrous (N2O) are not addressed, which turn out to have a great impact on
climate change.
Therefore, an assessment methodology and a user friendly LCA tool to properly quantify
environmental sustainability in airport pavement design and rehabilitation processes is needed
for airport authorities to support decision making process. The LCA tool is intended to assist
decision-makers, planners and researchers to achieve a more environmentally conscious
decision. The study results can be used for decision making among different runway pavement
design and rehabilitation alternatives.
6
2. Summary of Literature Review
Recently, LCA studies have been widely used to evaluate environmental impacts of
pavements occurred at various stages. The objective of LCA studies vary in a wide range, such
as development of model for pavement construction and maintenance [3], evaluation of low-
energy warm mix asphalt [4], analysis of concrete pavement with industry by-product [5],
quantification of environmental benefits of in-place recycling [6], and analysis of pavement
rolling resistance on GHG emission [7]. The process-based, economic input-output-based, and
hybrid approaches have been used for conducting pavement LCA.
The review here focused on the LCA studies that focused on comparing the
environmental impacts of different types of pavements (flexible vs. rigid). Previous researches
reported mixed findings between asphalt and concrete pavement design strategies and a lack of
consistency was found among the study results. For example, Hakkinen and Makela (1996)
performed a study based on pavement structures in Finland and found that concrete pavement
produced 40-60% more CO2 emission as compared to asphalt pavement [8]. Horvath and
Hendrickson (1998) performed a study using EIO-LCA (Economic Input- Output Life Cycle
Assessment) model and concluded that the asphalt pavement consumes 40% more energy than
the concrete pavement [9]. Treloar et al. (2004) performed a hybrid LCA analysis and concluded
that the un-doweled JPCP had the lowest energy input, while the full depth asphalt had the
highest energy input [10]. Zapata and Gambatese (2005) concluded that the CRCP consumed
more energy in comparison to asphalt pavement [11]. Weiland and Muench (2010) analyzed
three different pavement rehabilitation alternatives and found that energy consumption is highest
in the HMA option while the global warming impact is highest in the PCC option [12].

7
There are many factors that may affect the LCA results, such as system boundaries, the
quality and source of inventory data, inconsistent pavement designs, and geographic locations.
The type of concrete pavement (Jointed Plain Concrete Pavement [JPCP], Jointed Reinforced
Concrete Pavement [JRCP], and Continuously Reinforce Concrete Pavement [CRCP]) was
found having significant effects on the environment impact due to the existence of steel. The
comparison was complicated by the assumption of pavement service life and maintenance
history used in the analysis. Few previous studies on pavement LCA considered maintenance
treatments along with the initial construction. The definition of analysis period varied from the
pavement service life for the initial construction to the specific design life with scheduled
maintenance treatments. Therefore, general conclusions derived from literature studies may not
be applicable for specific pavement projects.

8
3. Problem Solving Approach
3.1 LCA Method
Life-Cycle Assessment (LCA) is used in this study, which a technique to assess environmental
effects associated with a product’s life cycle with flexibility and comprehensiveness [13]. The
process-based LCA method is usually used for construction projects since the methodology can
disaggregate the projects into individual processes or activities independently [14]. The life-cycle
of pavement can be divided into different stages including raw material extraction, material
processing and manufacturing, transportation, construction, maintenance, and end-of-life.
This study follows the basic steps of life cycle assessment: goal definition and scope, inventory
analysis, impact assessment and interpretation as defined by International Organization for
Standardization (ISO) 14044 (3). The goal is to quantify energy consumption and environmental
impacts of airport pavement design alternatives. The study scope includes design alternatives for
both new pavement design and pavement overlays on existing runway pavements. The pavement
structures considered include the surface layer constructed with Portland cement concrete or
asphalt concrete over base layers or existing pavement layers. The function unit is defined as
one-mile runway with 200-ft width that is designed to carry the aircraft traffic mix in the analysis
Goal, Definition & Scope
Inventory Analysis
Impact Assessment
Interpretation

9
period at the major hub airport. The system boundary covers the material, construction and
maintenance stages of the pavement life cycle. The end-of-life stage was not considered here due
to the complexity involved between different pavement types. Concrete runway pavements are
usually left in place as base layer for new overlays; while asphalt runway pavements are
removed and used as base or sub-base material at other areas of airfield.
The inventory analysis is limited to energy consumption and greenhouse gas emissions (GHG);
as a result, the impact assessment determines the cumulative energy demand (CED) and global
warming scores of the GHG emissions. The greenhouse gases considered in this study include
Carbon Dioxide (CO2), Methane (CH4) and Nitrous Oxide (N2O). The global warming potential
(GWP) of a greenhouse gas is defined as the ratio of the time-integrated radiative forcing from
the instantaneous release of 1 kilogram (kg) of a trace substance relative to that of 1 kg of a
reference gas [15]. The CO2 was used as reference gas in this study, and the GWP weighted
emissions were measured in CO2 equivalent (CO2 Eq.) using the GWP equivalency factors.
The unit inventory data for material-related energy consumption and GHG emission were
extracted from up-to-dated articles and research papers and the uncertainty of data sources were
analyzed. Contractor survey and field observations were conducted to obtain the operation
efficiency of construction equipment for runway construction. Direct energy consumptions and
GHG Emissions were obtained from fuel combustion and electricity consumption for various
material acquisition and process operations in the system boundary. Consideration of energy and
emissions associated with the production of process fuels and electricity in the upstream process
was included to account for the indirect energy consumption and GHG emission.
10
3.2 Development of LCA Tool
The goal of developing the LCA tool is to carry out quantitative assessment of
environmental impacts for the LCA stages in the pavement life cycle- raw material extraction,
plant production, construction and maintenance. An excel based tool, Pavement Project Energy
and Emission Calculator (PPEEC) has been developed to facilitate the quantification of energy
consumption and GHG emission of pavement project life cycle based on the user input.
Furthermore, the tool reports a database of life cycle inventory values from pertinent studies.
The tool is intended to give airport agencies a highly customizable tool to assist them in
quantitatively assessing the total environmental footprint of their procedures, strategies and
decisions regarding the construction and maintenance airfield pavements at project level. The
tool enables the user to assess the environmental impacts and resources consumption of
alternative solutions for pavement design and maintenance throughout the different phases of life
cycle.
The system boundaries of the proposed pavement LCA model entails six pavement life
cycle phases, modeled through individual but interconnected modules. The LCA phases included
are: (1) extraction of materials and production, consisting of the acquisition and processing of
raw materials and the mixing process of HMA mixtures in plants; (2) construction and M&R,
including all construction and M&R procedures and related construction equipment usage; (3)
transportation of materials, accounting for the transportation of materials to and from the
construction site and between intermediate facilities (e.g. transportation of aggregates from the
quarries to HMA mixing plants).

11
The pavement system considers the pavement structure including the subbase, base,
wearing course and surface course. The pavement system does not consider draining, lighting,
and tack coats. The pavement system evaluated included upstream (indirect) processes along
with combustion (direct) processes.
Figure 1 summarizes the system boundaries for the study.
aw aterial lant
roduction
Transportation onstruction aintenance
aw
material
extraction
aw
aterial
ac uisition
lant
operation
aw
material
extraction
rom
roduction
lant to ite
emoval aintenance
activities
arthwor
ehabilitatio
n activities
lacement

12
4. Description of the Technical Aspects
4.1 Life-Cycle Stages
In order to quantify energy consumption and emission of pavement, the first step is to
determine the material components and manufacturing processes for each material or process in
the pavement life-cycle. Materials are obtained in raw forms and then manufactured to the final
form as required by the construction demand. For the asphalt concrete (AC) pavement and
jointed plain concrete pavement (JPCP) considered in this study, raw materials contain asphalt,
cement, aggregate, slag cement, polymer additive, and steel (dowel bar in JPCP). Manufacturing
of material includes handling, drying, mixing and preparation of materials for placement, such as
production of hot-mix asphalt (HMA) and cement concrete.
In this study, life inventory data of raw material and manufacturing process were
collected from published reports from literature. Although multiple data sources are available for
life-cycle inventory data of typical construction materials and processes for pavements,
discrepancies may exit due to different geographic locations, technologies, and system
boundaries. To address this, baseline analysis was conducted using the inventory data identified
as the most appropriate for this analysis. The inventory data used in the baseline analysis were
selected from the previous studies conducted in U.S. as compared to a relatively larger set of
inventory data reported by European researchers. The extreme ranges of inventory data
(minimum and maximum values) reported in the literature were also used in the analysis to
investigate the sensitivity of analysis results to the variation of inventory data. Table 1 lists the
material-related life-cycle inventory data with references from various data sources including the
baseline values based on the studies conducted in U.S., respectively, for energy consumption and
GHG emission values. It is noted that the documented LCI data for raw materials are selected

13
without considering upstream components, which will be calculated separately using a uniform
approach in this study.
There are three transport stages in the pavement life-cycle: 1) transportation of raw
materials from the extraction site to the processing facility, such as transport of crude oil to
refinery; 2) transportation of processed materials to manufacturing plants, such as transport of
asphalt from refinery to the hot-mix asphalt plant or transport of aggregate products from quarry
to the mixing plant, 3) transportation of manufactured materials from the production site to the
construction job site. The first transport stage was included in the life-cycle inventory of raw
material in most studies. Although it is ideal to consider the specific transport distance of
processed materials to manufacturing plants, these were not considered in this study due to lack
of data availability. This assumption was considered not affecting the comparison results because
previous studies have concluded that the contribution of transportation stage is usually small as
compared to other stages if no extreme transport distance was observed [28, 29]. However, the
transportation of hot-mix asphalt or cement concrete from the plant to the job site was
considered. The one-way transport distance from the asphalt plant to the job site is about 20
miles, while the transport distance is only 2 miles for the on-site concrete batch plant. The
transportation of milled material from the existing asphalt pavement was negligible because the
project allowed for reuse of the removed pavement as subbase materials for new taxiways
instead of trucking it off site for recycling or disposal.

14
Table 1 Material-Related Life-Cycle Inventory for Asphalt and Concrete Pavements
Material / Process
Baseline Value Other LCI Data from Literature
Energy
Consumption
(MJ/t)
Emissions
CO2 eq.
(kg/t)
Energy Consumption
(MJ/t)
Emissions
CO2 eq. (kg/t)
Asphalt Binder 5810 [16] 480 [16] 6000 [8], 3634 [17],
5812 [18], 3980 [19]
330 [8], 173 [17], 377
[18], 244 [19]
Portland Cement 4340 [20] 928 [20] 5350 [8], 4776 [17],
5232 [21]
799 [8] ,806 [17],
670 [21]
Sand or Gravel 21 [20] 0.0728 [20] 24 [8], 6 [17],
68.6 [21]
1.74 [8], 0.07 [17],
6.1 [21]
Crushed Stone 32 [20] 1.42 [20] 52 [8], 38 [17] 2.0 [8], 6 [21]
Steel 21520 [22] 1578 [22] 21800 [17],
11300 [21]
241 [17],
232 [21]
Polymer Additive 76742 [19] 3715 [19] N/A
Slag Cement 644 [23] 7.42 [23] N/A
HMA Manufacturing 266 [24] 16.4 [24] 485 [8], 432 [17] 34.8 [8], 21.9 [17],
15.1 [25]
PCC Manufacturing 18 [26] 0.72 [26] 40 [17], 110 [21], 56 [27] 1.67 [17], 7.70 [21],
9.54 [27]
The manufactured material will then be transported to the construction site for placement.
Placement of materials depends on types of construction requirement on the project site and it is
accomplished using different types of equipment. In the construction phase, the environmental
burdens are due to the combustion-related emissions from construction equipment usage. The
NONROAD (nonroad engines, equipment, and vehicles) 2008 model developed by Environment
Protection Agency (EPA) was used to calculate CO2 emission (in g/hour) for off-road equipment
by its function, horsepower, and fuel type [30]. Since NONROAD cannot directly provide
energy consumption, the energy consumption was calculated based on the heating value of diesel
fuel and the emission factors for CO2, as shown in Equation 1 [31, 32]. After the energy
consumption rate is known, the emission rates for CH4 and N2O can be obtained in as similar
way using Equation 1.

15
renergy = remission ×HV
f(emission) (1)
Where, renergy is energy rate in MJ/hour;
remission is emission rate in g/hour (obtained from NONROAD for CO2, but solved for
CH4 and N2O after energy rate is known);
HV is heating value, 138.451 MJ/gallon for diesel fuel; and
f(emission) is fuel-specific emission factor for CO2, CH4, or N2O in g/gallon.
In order to calculate the energy consumption and emissions generated in the construction
process, contractor surveys and field observations were conducted to determine the productivity
for each type of equipment and operation hours of equipment can be calculated based on the total
tonnage or volume of material that is needed to construct one-mile runway with 200-ft width.
Table 2 summarizes the construction activities with the equipment used, horsepower rating, and
operation efficiency.
Table 2 Construction Equipment and Operation Efficiency for Pavement
Construction
Construction activity Equipment Horsepower
(hp) rating Productivity
HMA
Paving Vogele Super 2100-
2 250 1,500-2,000 tons/12 hours
Rolling compaction HAMM HD+140 155 Same as paving
(5-10 passes)
PCC
Front Paver
(Placer/Spreader) GOMACO PS-2600 275 275 yards/hour
Middle Paver (Slip Form
Paver) GOMACO GP-4000 440 275 yards/hour
Back Finishing Paver
(Texture/Cure) GOMACO TC-600 60 275 yards/hour
Concrete Saw cutting Edco SS-26 31D 31 8000 linear feet/10 hours
Drilling Dowel Bar EZ Drill 210B-4 20 800 bars/10 hours
Joint Sealant 10 8000 linear ft./10 hours
General
Milling Wirtgen 250i 990 1000 cubic yards/12 hours
shift
Grooving Lincon Electric
10,000 Plus 23
10,000 square yards/ 12
hours
Articulated Dump Truck Caterpillar 740 445 40-ton capacity

16
4.2 Consideration of Upstream Components
The overall environmental impact of a process depends on both the combustion (direct) energy
and emissions for operating equipment and vehicles, and the upstream energy requirements for
producing and delivering the energy source. The upstream (indirect) emissions are generated
from processing fuel consumed during various processes from material extraction to
construction. Energy is required to produce fuels and electricity used in the downstream
processes. Therefore, in addition to the energy use and emission of direct use of fuels and
electricity, the energy and emissions associated with the production of these fuels and electricity
were considered in the analysis.
To incorporate the upstream (indirect) values, the GREET 2013 model developed by
Argonne National Laboratory was used. The GREET model is a life-cycle modeling tool to
evaluate the impact of fuel use including all fuel production processes from oil exploration to
fuel use (from well to wheels) [33] For process fuels such as coal, natural gas, gasoline, fuel oil,
liquefied petroleum gases (LPG), etc., upstream values can be extracted for each specific fuel
type. The mix of energy source for production of electricity was obtained for the northeast states
of U.S. from the fuel cycle model in GREET and used to calculate the upstream values for
electricity. Table 3 lists the energy usage profile for production of raw materials and
manufacturing processes of PCC and HMA as reported by different literature sources. The
process fuel used for transportation and construction can be directly determined from the fuel
type used by the specific transport vehicle and construction equipment.
The calculation of upstream energy consumption and emission for a particular material or
process can be shown in Equation 2, where the unit upstream energy consumption and GHG

17
emission extracted from the GREET 2013 model are then multiplied with the energy usage
profile of process fuels and electricity.
UEE = ∑ CE ∙ PEi ∙ UEEini=1 (2)
Where,
UEE = Upstream energy consumption (BTU/ton) or emission (g/ton);
CE = Combustion energy (MMBTU/ton);
PEi = Percent of the ith type of energy in the energy matrix;
UEEi = Upstream energy consumption (BTU/MMBTU) or emission (g/MMBTU) for the ith type
of energy (calculated from GREET);
i = Type of energy including coal, diesel, gasoline, liquefied petroleum gas, natural gas, distillate
oil, petroleum coke, residual oil, and electricity; and
n = Total number of energy type.
Table 3 Energy Usage Profiles for Production of Raw Materials and Manufacturing
Processes of PCC and HMA
Process fuels
(Reference)
Asphalt
[34]
Cement
[20]
Sand
[20]
Crushed
Stone
[20]
Steel
[35]
Slag
Cement
[23]
Polymer
[19]
HMA
plant
[24]
PCC
plant
[20]
Coal 0.04% 56.58% 0 1.89% 1.42% 0 9.75% 0 0
Diesel 0 0 0 0 0 0 0 0 0
Gasoline 1.05% 0.04% 3.41% 3.85% 0.25% 0 0 0 0
LPG 0.51% 0.02% 0 0 0 0 0 0 0
Natural Gas 72.54% 0.85% 6.87% 11.63% 33.2% 77.56% 53.9% 80% 39.3%
Distillate
Fuel Oil 0.15% 3.45% 39.1% 42.40% 0 0.09% 36.35% 20% 26.2%
Petroleum
Coke 18.39% 18.12% 0 0 18.4% 0 0 0 0
Residual Oil 0.47% 0.09% 9.46% 7.11% 2.23% 0 0 0 0
Nuclear
Power 0 9.26% 0 0 0 0 0 0 0
Electricity 4.25% 11.58% 41.2% 33.1% 17.8% 22.35% 0 0 34.5%

18
4.3 JFK Case Study Result and Discussion
4.3 Comparison between Different Pavement Materials
The analysis was conducted using the standard mixture designs that were used at airfield
pavements and the baseline values in the life-cycle inventory database. The material-related
energy consumption and GHG emission were shown in Table 4, respectively, for combustion
and upstream components of each raw material and manufacturing process (plant operation for
producing mixtures). The relative energy consumption and GHG emission values (shown in the
parentheses in Table 4) were calculated as the energy or emission resulted from each material
component with respect to the total energy or emission of HMA or PCC. The combustion (direct)
values are generated in the processes for raw material acquisition and manufacturing process;
while the upstream values are related to the type and quantify of process fuel that is consumed in
the combustion process. The results show that the upstream components play significantly to the
total environmental burdens, although the exact values of upstream components vary depending
on the percentage of process fuel and electricity.
Table 4 Material-Related Energy Consumption and GHG Emssion (One Ton of HMA and
PCC)
Raw material Energy consumption
(MJ)
GHG emission
(CO2 eq. ton)
Material Mass percentage Combustion Upstream Combustion Upstream
Asphalt 4.93% 286.4
(48%)*
87.7
(50%)
23.7
(62%)
6.1
(51%)
Aggregate 94.7% 25.3
(4%)
26.1
(15%)
0.59
(2%)
1.1
(9%)
Polymer 0.37% 283.9
(48%)
63.1
(36%)
13.7
(36%)
4.8
(40%)
Total 100% 595.7 176.9 38 12
HMA Manuracturing 266 58.9 16.4 4.7
Portland 6.1% 265 93 56.7 8.2

19
cement (87%) (75%) (99%) (85%)
Slag cement
3.5%
22
(7%)
15
(12%)
0.3
(0.5%)
0.7
(8%)
Aggregate
58.6%
17
(6%)
17
(13%)
0.6
(1%)
0.7
(8%)
Water 31.8% 0 0 0 0
Toal 100% 304 125 58 10
PCC Manufacturing 18 18 17 0.7
*Numbers in the parentheses indicate percentages.
For both hot-mix asphalt and Portland cement concrete, the binding agent (asphalt binder
or Portland cement) with small mass percentages has the most significant component in the
energy consumption and GHG emission for raw material. The typical process of producing
asphalt binder is divided into four stages: crude oil extraction, transport, production in refinery,
and storage (DOE). The manufacturing process of Portland cement mainly includes quarry and
crush, raw meal preparation, pyroprocess, and finishing grind. It is noted that Portland cement
has roughly the same energy consumption but twice the GHG emission due to the clinker process
in cement kilns. Although the polymer content is small in HMA, its impact is significant due to
the energy-demanding process in polymer production process. The use of slag cement as partial
replacement of Portland cement significantly reduces energy consumption and GHG emission.
Slag cement is produced when the molten slag (by-product produced during iron production) is
rapidly quenched with water in a controlled process and then ground into fine powder.
On the other hand, aggregates contribute to the total energy consumption and GHG
emission in a much less degree as compared to asphalt binder or Portland cement. Aggregates
contribute to the total energy consumption in a more significant role as compared to the GHG
emission. Crushed aggregate requires mechanical breaking after acquisition or quarrying; while
natural aggregates (sand or gravel) are obtained by dredging.

20
As expected, the manufacturing of HMA consumes much more energy and generates
more GHG emission than the production of PCC. Asphalt production includes mixing of asphalt
binder, aggregate and other additives at the required temperature, where energy consumption and
emission are mainly generated from heating and mixing. The exact amount of heat energy varies
depending on the moisture content in the aggregate and the discharge temperature of HMA. On
other hand, concrete is produced by mixing cement with fine aggregate (sand), coarse aggregate
(crushed stone), and water without heating requirements. This causes much less energy
consumption in the concrete plant as compared to the HMA plant.
It is noted that energy consumption and GHG emission for steel production are counted
separately for concrete pavement. Dowel bars were used to improve load transfer efficiency
between concrete slabs. Totally there are 24,000 dowel bars are needed for concrete pavements
of the whole runway. The steel production process includes ore recovery, ore pelletizing &
sintering, coke production, blast furnace, basic oxygen processing, electric arc furnace, sheet
production, and rolling and stamping, which causes significant amount of environmental burdens
that cannot be neglected.
4.4 Comparison between Runway Rehabilitation Strategies
Since differences in properties of asphalt concrete and cement concrete can have strong
influences on pavement structure design and quantities of material usage, it is critical to conduct
LCA of different pavement types with the same performance standard. In an early study
conducted by FAA, field data collected from 30 airports in U.S. concluded that flexible and rigid
pavements designed based on FAA standards have structure condition index (SCI) values at or

21
above 80 after 20 years. While the structural performance of flexible and rigid pavements was
found comparable, differences in functional performance was noted [36].
In this study, the two design alternatives for resurfacing runway 13R-31L at the JFK
airport were based on the analysis of existing pavement condition data and the past experience,
as shown in Table 5. Each design alternative is expected to sustain the desired performance level
over the runway’s life cycle although they varied significantly due to consideration of pavement
life and rehabilitation needs. The experience at JFK airport with asphalt surfaced runway was no
longer lasting over 10 years before rehabilitation was required. Hence, the asphalt pavement was
designed to require significant overlay treatments every eight years in the 40-year design life. On
the other hand, only concrete repair was required for concrete pavements every eight years. The
concrete repair treatments mainly include patching and partial-depth repair.Based on the
experience in the PANY&NJ, the concrete repair usually takes2% of initial construction cost.
The same percentage was used for calculation of energy consumption and environmental impact.
This is considered as the best approximation since it is difficult to predict the exact number of
occurrences for repair treatments.
Table 5 Design Alternatives for Resurfacing Runway Pavement
Stage Year Rigid Overlay Flexible Overlay
Initial
Construction
0 Milling 6-inch asphalt +
overlay 2-inch asphalt Milling 3-inch asphalt
0 18-inch Concrete Overlay 9-inch Asphalt Overlay
Maintenance
8 Concrete Repair Milling 3-inch + overlay 4-inch
asphalt
16 Concrete Repair Milling 6-inch + overlay 7-inch
asphalt
24 Concrete Repair Milling 3-inch + overlay 4-inch
asphalt
32 Concrete Repair Milling 6-inch + overlay 7-inch
asphalt

22
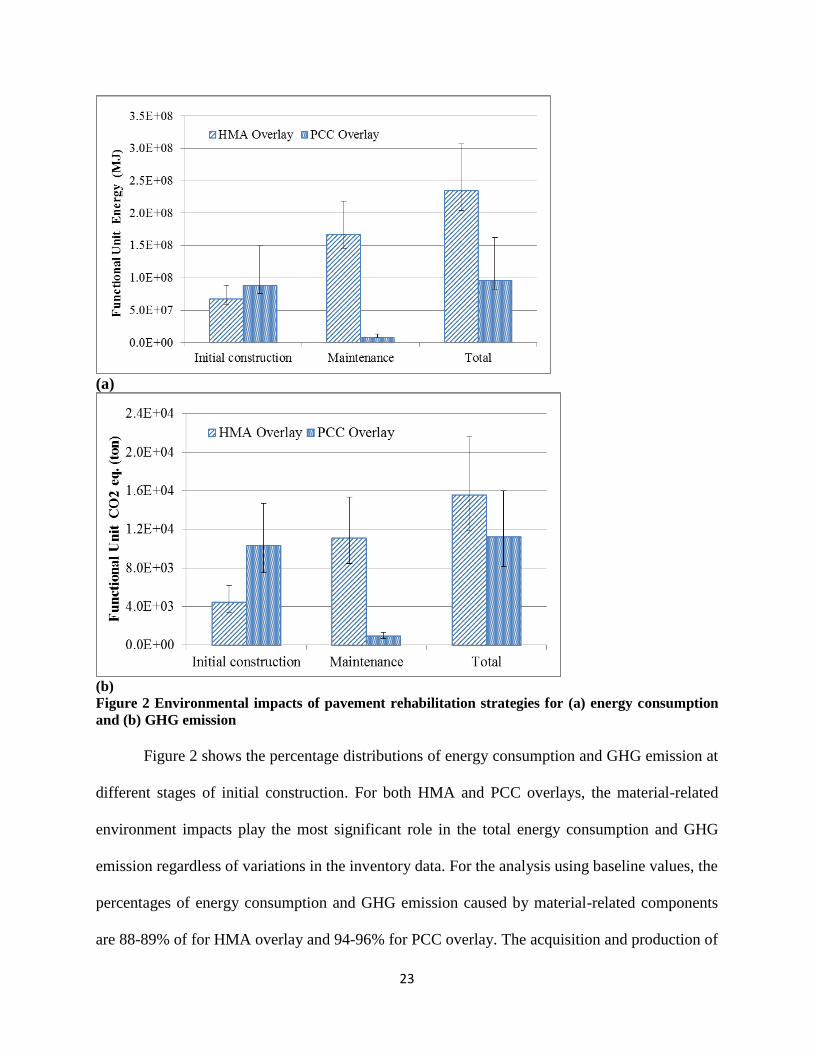
Figures 1 (a) and (b) compare the environmental impacts of two rehabilitation strategies
with HMA and PCC overlays, respectively, for energy consumption and GHG emission. The
impact assessment results using the baseline values in the life-cycle inventory database are show
in the column values and the variation of results are displayed in error bars representing the
minimum and maximum values.
The results show that the HMA overlay causes greater energy consumption and GHG
emission, as compared to the PCC overlay. The similar trend can be observed considering the
variations in the inventory data. The maintenance stage constitutes the major component in the
life-cycle energy consumption and GHG emission for the HMA overlay, although the HMA
overlay has less impact during the initial construction stage compared to the PCC overlay. It is
noted that this comparison was performed for two rehabilitation strategies in a 40-year analysis
period that is different from the pure comparison between HMA and PCC materials. For
example, the PCC overlay design includes two-inch asphalt overlay after 6-inch milling of
existing asphalt layer in addition the 18-inch concrete overlay.
23
(a)
(b)
Figure 2 Environmental impacts of pavement rehabilitation strategies for (a) energy consumption
and (b) GHG emission
Figure 2 shows the percentage distributions of energy consumption and GHG emission at
different stages of initial construction. For both HMA and PCC overlays, the material-related
environment impacts play the most significant role in the total energy consumption and GHG
emission regardless of variations in the inventory data. For the analysis using baseline values, the
percentages of energy consumption and GHG emission caused by material-related components
are 88-89% of for HMA overlay and 94-96% for PCC overlay. The acquisition and production of

24
raw materials consume 85% of total energy and generates 92% of total GHG emission for PCC
overlay; while only 63% of total energy and 62% of total GHG emission for HMA overlay.
Figure 3 Percentage distributon of energy consumption and GHG emission at different
stages of initial construction using (a) baseline (b) minimun and (c) maximum values
The on-site transportation component is minor due to the short transport distance to the
HMA plant and the on-site concrete batch plant. The construction equipment causes 7% energy
consumption for HMA overlay but only 4% for PCC overlay. This is because significant amount
of milling and paving operation for multi-lifts of HMA overlay as compared to the one-lift slip-
form paving process for PCC overlay. These findings clearly illustrate that LCA can identify the
material and process with high impact in the pavement life-cycle and help develop action plans
for impact mitigation.

25
4.5 LCA Tool Development
The proposed Pavement Project Energy and Emission Calculator (PPEEC) was developed on
Microsoft Excel platform consisting of multiple excel worksheets following the LCA framework.
The worksheets have an allocated input area for the user to create an easy to use interactive
interface primarily designed for agency decision-makers to benchmark and estimate the energy
consumption and emissions. The PPEEC tool also reports all relevant material production energy
consumption and emission values as inventory database and its variation. The following section
describes the overall framework and architecture of the PPEEC.
The framework for PPEEC tool follows three main life cycle stages relevant to pavements:
materials, construction and maintenance. The PPEEC Tool is a collection of spreadsheets and
allows for different inputs at a project level, including geometry of the pavement, frequency of
maintenance activities, mix design for material, equipment operating rate for construction tasks.
The user first inputs basic geometric information (length, width and thickness) and general life
cycle characteristics (construction year, structure, maintenance activities) of the pavement
project in the General Project Information worksheet. These geometries and characteristics are
used throughout the PPEEC to calculate the volume related quantities. The series of worksheets
guide the user through the stages of LCA. Each pavement life cycle phase has its own inputs and
outputs.
The inputs for PPEEC tool are split into Primary Inputs and Secondary Inputs that the user can
specify; however, they are interrelated. The Primary Inputs is the desired inputs at a project level,
including geometry of the pavement, frequency of maintenance activities, mix design for
material, equipment operating rate for construction tasks. The Secondary Input is the advanced

26
input for analyzing the energy consumption and emission value variation among the inventory
database from relevant publication sources. It also provides an alternative for the input of user
defined unit energy consumption and emission values.
The combustion (direct) and upstream (indirect) CED and GWP results of the pavement LCA are
displayed in the Results worksheet and Summary Report worksheet which has numerical and
graphical representation.
Figure 4 System Architecture

27
4.51 Worksheet Categories
The PPEEC consist of thirteen worksheets as shown in Table 4.1. The input parts of the
worksheets are interactive to the user, and other supporting parts of the worksheet are ready-only
for the user.
Table 6 Worksheet categories for the PPEEC tool
Worksheet Primary Input Secondary Input
General Project
Information
Project Title, Location, Project
Type, Design Life, Pavement
Structure Dimensions, Maintenance
Schedule and Activity
Material Mix Design
Production Plant Production Type
Plant Properties: Ambient Temperature,
Heating Temperature, % Moisture
Content
Transportation Capacity of Truck, Distance to &
From site, Operating Speed of Truck
Construction Equipment type based on HP,
Operating Quantity, Operating Rate
Results - -
Reports - -
Material
Inventory
Select Relevant Publication Source
from Inventory Database, User Defined
unit energy consumption and emission
values
Production
Inventory
Select Relevant Publication Source
from Inventory Database, User Defined
unit energy consumption and emission
values
Transportation
Inventory - -
Construction
Inventory - -
Upstream
Inventory
Energy Matrix for Materials and Plant
Production

28
The PPEEC Tool desires inputs at a project level, including geometry of the pavement,
frequency of maintenance activities, mix design for material, equipment operating rate for
construction tasks etc. which are termed as Primary Inputs. These Primary Inputs correspond to
the following worksheets:
General Info Worksheet
The General Project Information worksheet (Figure) functions as the main input for the tool and
the user can enter basic geometric information and general life cycle characteristics of the
pavement project. These inputs include the title and location, project type, pavement dimensions,
layer type and thickness, maintenance schedule and activities. The maintenance activities only
consider flexible overlay, rigid Overlay and unplanned maintenance (% impact of initial
construction). These geometries and characteristics are used throughout the tool to calculate the
volume-related quantities.
Figure 5 General Info Worksheet

29
Materials Worksheet
The Materials worksheet (Figure) is associated with raw material extraction phase. For each
layer in the pavement structure, the user can specify the mix design (percentage by weight or
tonnage) for the respective material type. Raw materials included in the worksheet are asphalt
bitumen, polymer additive, emulsion additive, cement, slag, steel, sealant, fine aggregate, coarse
aggregate and recycled asphalt pavement (RAP). The user defined input helps analyze the effect
of using different mix designs for material selection in projects. This allows users to quantify the
impacts of sustainable practices like using RAP and slag cement. The Materials worksheet has
separate mix design inputs for initial construction and maintenance.
Figure 6 Materials Worksheet

30
Production Worksheet
The Production worksheet (Figure) lets the user select plant production operations like hot-mix
asphalt, cement concrete, user defined HMA/WMA, and user defined HMA with RAP. If the
user-defined alternatives are chosen, the user has to input plant parameters like ambient
temperature, heating temperature, and moisture content. The Production worksheet is also split
into initial construction and maintenance.
Figure 7 Production Worksheet
Transportation Worksheet
The Transportation Worksheet (Figure) relates to the transportation of paving material from the
plant to the job site. For each layer, the user has to input properties like capacity of truck,
distance to and from site and operating speed of truck.

31
Figure 8 Transportation Worksheet
Construction Worksheet
The Construction Worksheet (Figure) corresponds to the construction activity for initial
construction and maintenance. For each construction activity (e.g. paving, milling, rolling,
grooving etc.), the user has to select the equipment type based on horse power (HP), specify the
operating quantity for a selected unit (e.g. ton, sq. ft, cu. ft etc.) and the operating rate for the
selected unit per hour (e.g. ton/hr, sq. ft/hr, cu. ft/hr etc.).

32
Material Inventory Worksheet
The material inventory worksheet reports inventory database for energy consumption and
emission values collected from relevant published sources. Raw materials included are asphalt
bitumen, polymer additive, emulsion additive, cement, slag, steel, joint sealant, fine aggregate,
and coarse aggregate. By default setting the recommended values (sources with an asterisk (*)
mark) are selected. However, the user is allowed to choose any energy consumption and
emission value from the inventory database source for any corresponding material. The user can
also enter ‘user defined’ unit energy consumption and emission values from any relevant source
outside the database.
Figure 9 Construction Worksheet

33
Production Inventory Worksheet
The production inventory worksheet reports inventory database for energy consumption values
and emission values collected from relevant published sources. Production plant includes HMA
plant and cement concrete plant. By default setting the recommended values (sources with an
asterisk (*) mark) are selected. However, the user is allowed to choose any energy consumption
and emission value from the inventory database source for any corresponding production plant.
The user can also enter ‘user defined’ unit energy consumption and emission values from any
relevant source outside the database.
Transportation Inventory Worksheet
The transportation inventory worksheet reports inventory database for energy consumption
values and emission values for truck transportation based on NONROAD model as discussed in
section 5.3.2
Construction Inventory Worksheet
The construction inventory worksheet reports inventory database for energy consumption values
and emission values for seventeen different construction equipments (Table 3.16) obtained from
NONROAD model based on equipment type and horse power as discussed in section 5.3.2
Upstream Worksheet
The upstream inventory worksheet reports inventory database for energy consumption values
and emission values for all phases of material, production transportation and construction. The
upstream energy and emissions of process fuel and electricity (Table 3.19, 3.20) are extracted

34
from GREET. The energy usage profile for raw material and plant production process of PCC
and HMA (Table 5.3) from various sources are listed, which can be changed by the user.
Results Worksheet
Calculations are performed in hidden formulas across the tool but the Results worksheet
summarizes the energy consumption and GHG emissions across the life cycle phases.
Furthermore, it also variation among different inventory database values for the material and
production stages. Based on the user input the impacts are linked to the unit process from the
inventory database and then, using the tool, the impacts are consequently summed at different
phases and levels.
Reports Worksheet
The reports worksheet provides the user with a printable format of the results. This worksheet is
intended for agencies and decision makers to summarize the results at various phases of LCA at
the pavement project level. The benefits of report worksheet are that it provides an overview of
the LCA for the pavement projects; the generated reports for different structures, materials, and
construction and maintenance options can be easily compared and benchmarked.

35
4.52 Inventory Values and Impact Assessment
Available literature includes various sets of data sources for the various materials, representing
different geographic conditions, procedures, technologies and system boundaries. Ideally, these
data should be checked for representativeness (technological, geographical and time related),
completeness (regarding impact category coverage in the inventory), precision/uncertainty (of
the collected remodeled inventory data), and methodological appropriateness and consistency.
However, the literature sources do not always describe all the processes accounted for in the
cradle-to-gate LCI of some materials. This introduces difficulties in assessing whether the
system boundaries associated with available data fully match the goal and scope.
The environmental indicators are used in the tool: energy consumption and GHG emissions
(GWP from greenhouse gases: Carbon Dioxide (CO2), Methane (CH4) and Nitrous Oxide
(N2O)). Most of the data are from existing up-to-dated studies, and certain indicators are
calculated according to proper methodology. One advantage of this tool is the use of different
environmental indicators for various relevant sources. The LCI data available from various
relevant sources helps the user access the variation in environmental impact of pavement projects
for the phases of material production and plant processing. Because of the highly customizable
nature throughout the various modules of the tool, the user is not constrained to predefined
conditions and assumptions. The tool allows the user to choose from different materials,
structures, construction techniques and maintenance plans. Further, the user has an option to
input ‘user defined’ inventory values or choose from the listed inventory data sources, which
makes the life cycle analysis more relevant to the goal and scope of the respective pavement
project.

36
5. Safety Risk Assessment
The proposed Life Cycle Assessment approach to quantify energy and environmental
impact of airport runway pavement design. The excel-based tool - Pavement Project Energy and
Emission Calculator (PPEEC) is intended to give airport agencies a highly customizable tool to
assist them in quantitatively assessing the total environmental footprint of their procedures,
strategies and decisions regarding the construction and maintenance airfield pavements.
According to FAA Safety Management System Manual, the work itself does not contain
any inherent risks, but rather helps to mitigate indirect risk from environmental impact. Since
more natural resources and energy consumption makes significant contribution to greenhouse
gas emission which directly related to climate change such as more extreme weather conditions
and natural disasters. By exactly quantifying the total environmental footprint, more
environmental friendly pavement design and maintenance strategy will be highlighted.

37
6. Projected Impacts The design and tool we developed assessed the cumulative energy demand (CED) and
greenhouse gas (GHG) emission of different airport pavement design alternatives using a LCA
approach. The results indicate that the expected pavement service life and maintenance
treatments significantly affect the comparison between HMA and PCC pavements. The
consideration of energy and emissions associated with the production of process fuels and
electricity in the upstream process cannot be neglected. The implementation of LCA approach
enables decision makers to quantify energy consumption and GHG emissions among alternative
pavement designs.
We found out that the environmental impact among different pavement design
alternatives significantly depend upon pavement type, design assumptions, and maintenance
strategies. Although there are no general conclusions on pavement type selection, the comparison
of energy consumption and GHG emission due to upstream, construction, and maintenance
stages brings awareness to the airport authorities on the impact of pavement type selection. The
project-level analysis need be conducted for selecting the sustainable design alternative in the
airport planning process considering performance, economic cost, and environment impacts.
Since our design is LCA method used to quantify environmental impact of airport
pavement and an excel-based tool, the cost of this product might be the resources for method and
tool improvement including personal salary and advertisement. However, benefit can be
quantified as time saving for airport related organization to develop their own environmental
impact quantification methods and tools.

38
7. Interactions with airport operators and industry experts
The Interaction with airport operators and industry experts is through a technical survey
distributed on line and with regular meetings with our project partner of Port Authority of NY &
NJ. There valid responses to the questionnaire were received and analyzed.
Non university advisors:
Guy Zummo
Chief Civil Engineer
Larrazabal, Ernesto
Assistant Chief Engineer
Engineering/Architecture Design Division
The Port Authority of NY &NJ
4 World Trade Center
150 Greenwich Street, 20th Floor
212-435-6161
JFK Airport reconstruction
http://www.georgetownclimate.org/resources/jfk-airport-runway-13r-31l-rehabilitation-john-f-kennedy-
international-airport-new-york-ci
39
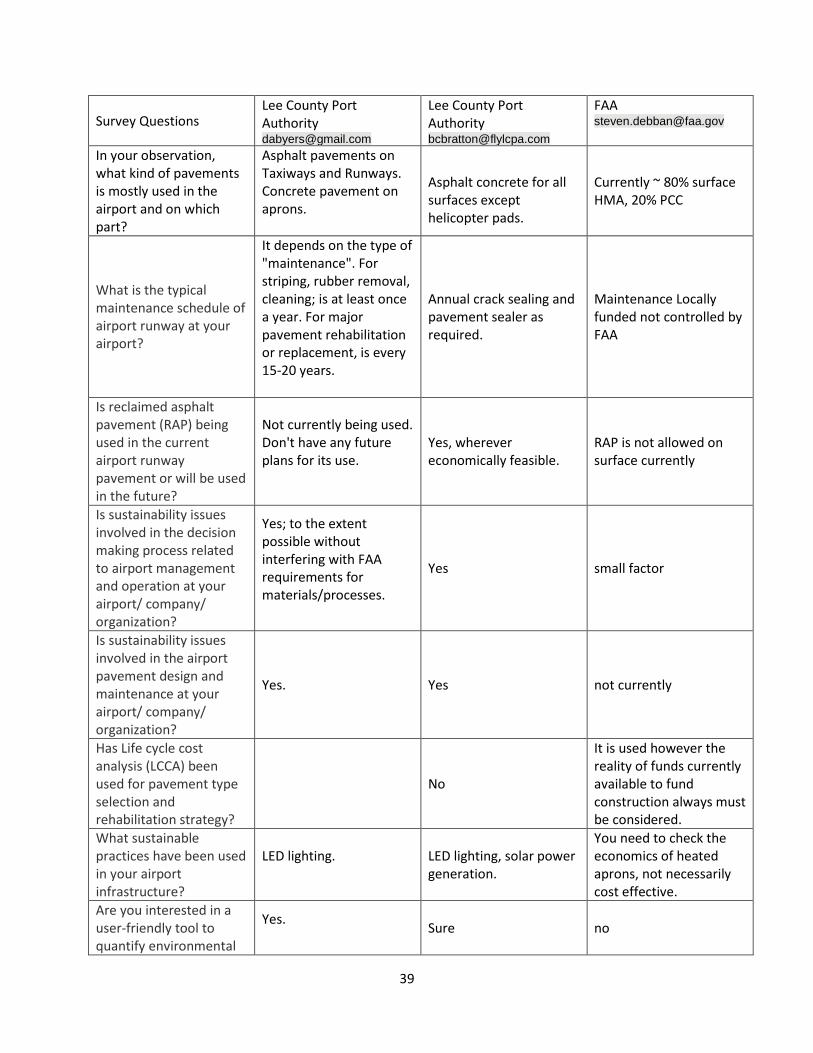
Survey Questions Lee County Port Authority [email protected]
Lee County Port Authority [email protected]
In your observation, what kind of pavements is mostly used in the airport and on which part?
Asphalt pavements on Taxiways and Runways. Concrete pavement on aprons.
Asphalt concrete for all surfaces except helicopter pads.
Currently ~ 80% surface HMA, 20% PCC
What is the typical maintenance schedule of airport runway at your airport?
It depends on the type of "maintenance". For striping, rubber removal, cleaning; is at least once a year. For major pavement rehabilitation or replacement, is every 15-20 years.
Annual crack sealing and pavement sealer as required.
Maintenance Locally funded not controlled by FAA
Is reclaimed asphalt pavement (RAP) being used in the current airport runway pavement or will be used in the future?
Not currently being used. Don't have any future plans for its use.
Yes, wherever economically feasible.
RAP is not allowed on surface currently
Is sustainability issues involved in the decision making process related to airport management and operation at your airport/ company/ organization?
Yes; to the extent possible without interfering with FAA requirements for materials/processes.
Yes small factor
Is sustainability issues involved in the airport pavement design and maintenance at your airport/ company/ organization?
Yes. Yes not currently
Has Life cycle cost analysis (LCCA) been used for pavement type selection and rehabilitation strategy?
No
It is used however the reality of funds currently available to fund construction always must be considered.
What sustainable practices have been used in your airport infrastructure?
LED lighting.
LED lighting, solar power generation.
You need to check the economics of heated aprons, not necessarily cost effective.
Are you interested in a user-friendly tool to quantify environmental
Yes.
Sure no

40
impact related to airport runway pavement?
Figure 10 Regular Meeting with Experts of Port Authority of NY&NJ on April 12,
2016

41
Figure 11 Field Visit to JFK International Airport and Data Collection

42
Appendix A. List of Complete Contact Information
1. Advisor
Name: Hao Wang
Affiliates: Assistant Professor Civil and Environmental Engineering
Address: Department of Civil & Environmental Engineering, Rutgers, the State
University of New Jersey
Phone: 848-445-2874
Email: [email protected]
2. Student 1
Name: Xiaodan Chen
Affiliates: Graduate Research Assistant
Address: Department of Civil & Environmental Engineering, Rutgers, the State
University of New Jersey
Phone:732-322-1210
Email: [email protected]>
2. Student 1
Name: Chinmay Thakkar
Affiliates: Graduate Research Assistant
Address: Department of Civil & Environmental Engineering, Rutgers, the State
University of New Jersey
Phone:
Email: [email protected]

43
Appendix B. Description of the University
Rutgers, The State University of New Jersey, is a leading national research university and
the state of New Jersey’s preeminent, comprehensive public institution of higher education.
Established in 1766 and celebrating a milestone 250th anniversary in 2016, the university is the
eighth oldest higher education institution in the United States. More than 67,000 students and
22,000 faculty and staff learn, work, and serve the public at Rutgers locations across New Jersey
and around the world.
University Mission
As the premier comprehensive public research university in the state’s system of higher
education, Rutgers, The State University of New Jersey, has the threefold mission of
providing for the instructional needs of New Jersey’s citizens through its
undergraduate, graduate, and continuing education programs;
conducting the cutting-edge research that contributes to the medical,
environmental, social, and cultural well-being of the state, as well as aiding the
economy and the state’s businesses and industries; and
performing public service in support of the needs of the citizens of the state and
its local, county, and state governments.
ach component of the university’s mission reinforces and supports the other two.
Rutgers is dedicated to teaching that meets the highest standards of excellence, to
conducting research that breaks new ground, and to providing services, solutions, and clinical
care that help individuals and the local, national, and global communities where they live.

44
Appendix C. Description of Non-University Partners
The Port Authority of New York and New Jersey (PANYNJ) is a joint venture between
the U.S. states of New York and New Jersey, established in 1921 through an interstate compact
authorized by the United States Congress. The Port Authority oversees much of the regional
transportation infrastructure, including bridges, tunnels, airports, and seaports, within the
geographical jurisdiction of the Port of New York and New Jersey. This 1,500-square-mile
(3,900 km²) port district is generally encompassed within a 25-mile (40 km) radius of the Statue
of Liberty National Monument. The Port Authority is headquartered at 4 World Trade Center.

45
Appendix D. Sign-Off from for Faculty Advisor and Department Chair
University Rutgers, the State University of New Jersey _____________________________________________
List other partnering universities if appropriate: __________________________________________________
________________________________________________________________________________________
Design Developed by: Individual Student Student Team
If individual student:
Name ____________________________________________________________________________________
Permanent Mailing Address __________________________________________________________________
________________________________________________________________________________________
Permanent Phone Number _________________________ Email ____________________________________ If student team:
Student Team Lead: Xiaodan Chen _____________________________________________________________
Permanent Mailing Address 4409 CPO WAY, NEW BRUNSWICK, 08901 ________________________________
________________________________________________________________________________________
Permanent Phone Number 7323221210 Email [email protected] ____
Competition Design Challenge Addressed:
Challenge 3 Airport Environmental Interactions __________________________________________________
________________________________________________________________________________________
I certify that I served as the Faculty Advisor for the work presented in this Design submission and that the work was done by the student participant(s).
Signed _________________________ Date 4/29/2016 _______________________
Name Hao Wang ___________________________________________________________________________
University/College Rutgers, the State University of New Jersey ______________________________________
Department(s) Department of Civil & Environmental Engineering ________________________________
Street Address 96 Frelinghuysen Road, Room 607 _________________________________________________

46
City Piscataway, _____________________________ State NJ ___ ZIP code 08854 _______________________
Telephone 848-445-2232 ____________________________ Fax ____________________________________

47
Appendix E. Evaluation of the Educational Experience Provided by the Project
Faculty Evaluation
l. Describe the value of the educational experience for your student(s) participating in this
competition submission.
The students were able to conduct life-cycle assessment analysis and develop a useful tool for
decision making through the design competition. This is invaluable experience for them in
addition to what they learned in the classroom. They applied the knowledge into the real case
scenarios through data collection and analysis. I believe the experience from this design
competition will polish their analysis skills but also engage their career interests into aviation
field.
2. Was the learning experience appropriate to the course level or context in which the
competition was undertaken?
Yes. The learning experience matches the level of graduate course that I am currently teaching
at Rutgers University, such as the new graduate course on Sustainable Transportation
Infrastructure. The students learned the life-cycle assessment and life-cycle cost analysis
method, collected data from literature and field survey, conducted impact assessment analysis
with different scenarios, and developed an EXCEL-based user-friendly tool.
3. What challenges did the students face and overcome?
There are several challenges faced by the student, such as the learning curve of life-cycle
assessment, the collection of accurate life-inventory data for material and construction, and the
development of tool in a short-time period. The students were able to conquer the problems

48
through the close communication with the project partners (PANY&NJ) and the faculty advisor.
Several meetings were held jointly to discuss the analysis plan, check the project progress, and
provide feedback. In addition, the students devoted a lot of time to this project and this made a
lot of difference for the project outcome.
4. Would you use this competition as an educational vehicle in the future? Why or why not?
Yes, I will definitely incorporate the design competition into the graduate and undergraduate
course I am currently teaching. It seems that the best way is to encourage the students to select
the relevant topics is through the class project, which will make the students engaged to the
design competition and also get them excited. Another way is to enhance education experience is
to engage more aviation industry partners working with the design competition.
5. Are there changes to the competition that you would suggest for future years?
The competition provides an excellent opportunity for students getting to know aviation industry
and developing certain experience through the project process. I will definitely support the
continuation of the design competition in future years.

49
Student Evaluation (Chinmay & Xiaodan Chen)
1. Did the Airport Cooperative Research Program (ACRP) University Design Competition for Addressing
Airports Needs provide a meaningful learning experience for you? Why or why not?
Airport Cooperative Research Program (ACRP) University Design Competition provided an excellent
opportunity for us to learn Life Cycle Assessemnt method applied in airport pavement to quantify the
environmental impact. We also learn team work spirit to complete a design project while overcoming a
lot of difficulties.
2. What challenges did you and/or your team encounter in undertaking the competition? How did you
overcome them?
We both have many course works and the time management became a big challenge for us. After
talking with our advisor, we try to learn a better time management skills such as setting goals once a
week, being organized with all profiles, and deconstruct complex problem into small objects.
3. Describe the process you or your team used for developing your hypothesis.
The resources on Airport Cooperative Research Program (ACRP) University Design Competition website
are very inspiring and helpful to setup our design outline. After discussing with our advisor, doing
literature review and consulting with our project partner, we had a very clear hypothesis.
4. Was participation by industry in the project appropriate, meaningful and useful? Why or why not?
We get most of our feedback from the regular meeting with Port Authority of NY &NJ. For example, the
tool is not that user friendly at the very beginning, but after numeral revision, the tool can be
understand and use by non-technical person.

50
5. What did you learn? Did this project help you with skills and knowledge you need to be successful for
entry in the workforce or to pursue further study? Why or why not?
The competition extremely broadened our knowledge on environmental impact study. Furthermore, we
learned something more important than knowledge is to be an responsible team member and how to
interact with professionals efficiently and maturely.

51
Appendix F. Reference List with Full Citations
1. Hallin JP and et al., Guide for pavement-type selection, NCHRP Report 703, Transportation
Research Board, Washington D.C., 2011.
2. Federal Aviation Administration (FAA), Airport pavement design and evaluation, Advisory
Circular 150/5320-6E, Washington, D.C., Federal Aviation Administration, Washington,
D.C., 2009.
3. Huang Y, Bird R, and Heidrich O, Development of a life cycle assessment tool for
construction and maintenance of asphalt pavements, Journal of Cleaner Production, 17( 2),
2009, pp. 283–296
4. Almeida-Costa A, and Benta A, Economic and environmental impact study of warm mix
asphalt compared to hot mix asphalt, Journal of Cleaner Production, 112(4), 2016, pp. 2308–
2317
5. Jamshidi A, Kurumisawa K, Nawa T, and Hamzah MO, Analysis of structural performance
and sustainability of airport concrete pavements incorporating blast furnace slag, Journal of
Cleaner Production, 90, 2015, pp.195–210
6. Turk J and et al. Environmental comparison of two alternative road pavement rehabilitation
techniques: cold-in-place-recycling versus traditional reconstruction, Journal of Cleaner
Production, 121, 2016, pp. 45–55
7. Wang T and et al. Life cycle energy consumption and GHG emission from pavement
rehabilitation with different rolling resistance, Journal of Cleaner Production, 33, 2012, pp.
86–96
8. Hakkinen T., Makela K., Environmental impact of concrete and asphalt pavements in
environmental adaptation of concrete. Technical Research Center of Finland, 1996.
9. Horvath A and Hendrickson C, Comparison of environmental implications of asphalt and
steel-reinforced concrete pavements, Transportation Research Record. No. 1626,
Transportation Research Board, 1998, pp. 105-113.
10. Zapata P. and Gambatese JA, Energy consumption of asphalt and reinforced concrete
pavement materials and construction. Journal of Infrastructure Systems. 11(1), 2005, pp. 9-
20.
11. Treloar GJ, Love PED, and Crawford RH, Hybrid life-cycle inventory for road construction
and use. Journal of Construction Engineering and Management. 130(1), 2004, pp. 43-49.
12. Weiland C, and Muench S, Life-cycle assessment of reconstruction options for Interstate
highway pavement in Seattle, Washington. Transportation Research Record, No. 2170,
Transportation Research Board, 2010, pp. 18–27.
13. ISO 14044, Environmental management – life cycle assessment – requirements and
guidelines, Geneva, Switzerland: International Organization for Standardization, 2006.
14. Santero N., Masanet E., and Horvath A., Life-cycle assessment of pavements: a critical
review of existing literature and research, SN3119a, Portland Cement Association, Skokie,
Illinois, USA, 2010
15. IPCC: Climate change 2007: synthesis report. Contribution of Working Groups I, II and III to
the Fourth Assessment Report of the Intergovernmental Panel on Climate Change,
Switzerland, 2007

52
16. Yang RY, Development of a pavement life cycle assessment tool utilizing regional data and
introducing an asphalt binder model, Master Thesis, University of Illinois at Urbana-
Champaign, 2014
17. Stripple H, Life cycle assessment of road, a pilot study for inventory analysis, Second
Revised Edition. IVL Swedish National Road Administration. Gothenburg, Sweden. 2001
18. Athena Sustainable Materials Institute (Athena). A life cycle inventory for road and roofing
asphalt. Prepared by Franklin Associates. Ottawa, Canada, 2001.
19. Eurobitume, Life cycle inventory: bitumen, Eurobitume, 2012
20. Marceau ML, Nisbet MA, &Vangeem MG, Life cycle inventory of Portland cement concrete
(No. SN2011). Portland Cement Association. Skokie, Illinois, 2007.
21. Athena Sustainable Materials Institute (Athena). Cement and structural concrete products:
life cycle inventory update #2. Ottawa, Canada, 2005.
22. Argonne National Laboratory, GREET 2.7 vehicle cycle model, Argonne National
Laboratory, 2007.
23. Marceau ML and VanGeem MG, Life cycle inventory of slag cement manufacturing process,
CTL Project Number 312012, Construction Technology Laboratories, Skokie, IL, 2003.
24. ProwellB and et al. Effects of WMA on plant energy and emissions and worker exposures to
respirable fumes, NHCRP 9-47A Defat Final Report, Vol. II, Transportation Research Board
of the National Academies, Washington, D.C, 2014
25. EPA, Emissions factors & AP 42, compilation of air pollutant emission factors, 2010.
26. MarceauML, Nisbet MA, and Vangeem MG, Life Cycle Inventory of Portland Cement
Manufacture (No. SN2095b). Portland Cement Association. Skokie, Illinois, 2006.
27. Choate WT, Energy and emission reduction opportunities for the cement industry. Office of
Energy Efficiency and Renewable Energy, U.S. Department of Energy, 2003.
28. 27. Weiland, C. and S. T. Muench, Life-cycle assessment of reconstruction options for
Interstate highway pavement in Seattle, Washington, Transportation Research Record, No.
2170, Transportation Research Board, Washington, D.C., 2010, pp. 18–27.
29. 28. Muench, S. T., Roadway construction sustainability impacts review of life-cycle
assessments, Transportation Research Record, No. 2151, Transportation Research Board,
Washington, D.C., 2010, pp. 36–45
30. A, User’s Guide for the final NONROAD2005 model, 2005.
31. EPA, Direct emissions from mobile combustion sources, 2008
32. EPA, Development of emission rates for heavy-duty vehicles in the motor vehicle emissions
simulator MOVES2010, Final Report, 2012.
33. Wang MQ, GREET 1.5 - transportation fuel-cycle model, volume 1: methodology,
development, use, and results, Argonne National Laboratory, 1999.
34. Skone TJ and Gerdes K, Development of baseline data and analysis of life cycle greenhouse
gas emissions of petroleum-based fuels, DOE/NETL-2009/1346, National Energy
Technology Laboratory, 2004
35. U.S. Energy Information Administration (EIA), Steel industry analysis, Accessed at
http://www.eia.gov/consumption/manufacturing/briefs/steel/
36. Garg N, Guo E and McQueen, R, Operational life of airport pavements, Report No.
DOT/FAA/AR-04/46, Federal Aviation Administration, 2004
37. Fuselier, GK, Grubbs JS, McQueen RD, The life cycle of a runway pavement: a case study of
runway 1L-19R at the Washington Dulles International Airport, Proceedings of the 2008
Airfield and Highway Pavements Conference, 2008, pp. 334-345.

53
38. Celauro C, Corriere F, Guerrieri M, and Lo Casto B, Environmentally appraising different
pavement and construction scenarios: a comparative analysis for a typical local road,
Transportation Research Part D: Transport and Environment, 34, 2015, pp. 41-51.
39. Anthonissena J, Braetb J, and Bergha WV, Life cycle assessment of bituminous pavements
produced at various temperatures in the Belgium context, Transportation Research Part D:
Transport and Environment, 41, 2015, pp. 306-317.