FULL COMBINED
125
Page | 1 RETROFITTING PROCESS OF EXISTING BUILDING WITH RESPECT TO SEISMIC CONSIDERATION IN BANGLADESH AYESHA BINTA ALI MUNSHI MD. RASEL MD. MOINUL ISLAM MD. ASIF RAHMAN DEPARTMENT OF CIVIL ENGINEERING AHSANULLAH UNIVERSITY OF SCIENCE & TECHNOLOGY APRIL 2013
-
Upload
mdasif-rahman -
Category
Documents
-
view
138 -
download
4
Transcript of FULL COMBINED

Page | 1
RETROFITTING PROCESS OF EXISTING BUILDING WITH
RESPECT TO SEISMIC CONSIDERATION IN BANGLADESH
AYESHA BINTA ALI
MUNSHI MD. RASEL
MD. MOINUL ISLAM
MD. ASIF RAHMAN
DEPARTMENT OF CIVIL ENGINEERING
AHSANULLAH UNIVERSITY OF SCIENCE & TECHNOLOGY
APRIL 2013

Page | 2
RETROFITTING PROCESS OF EXISTING BUILDING WITH
RESPECT TO SEISMIC CONSIDERATION IN BANGLADESH
A Thesis
Submitted by
Ayesha Binta Ali Student No.: 10.01.03.033
Munshi Md. Rasel Student No.: 10.01.03.075
Md. Moinul Islam Student No.: 10.01.03.076
Md. Asif Rahman Student No.: 10.01.03.108
In partial fulfillment of the requirements for the degree of
Bachelor of Science in Civil Engineering
Under the supervision of
Dr. Md. Mahmudur Rahman
Professor
Department of Civil Engineering
AHSANULLAH UNIVERSITY OF SCIENCE & TECHNOLOGY
April 2013

Page | 3
DECLARATION
We declare that the topics material which is presented in this thesis paper is the outcome
of our hard work. We also declare that neither this paper nor any complete part of it is
being submitted elsewhere for any other purpose to award of any degree. Where other
sources are used, appropriate references are made.
……………………………………. …………………………………
Ayesha Binta Ali Munshi Md. Rasel
(10.01.03.033) (10.01.03.075)
……………………………………. …………………………………
Md. Moinul Islam Md. Asif Rahman
(10.01.03.076) (10.01.03.108)
I do hereby agree to the approach and content of the present exposition.
………………………………….
Dr. Md. Mahmudur Rahman
Professor
Department of Civil Engineering
AHSANULLAH UNIVERSITY OF SCIENCE & TECHNOLOGY
April 2013

Page | 4
ACKNOWLEDGEMENT
First of all we would like to express our sincere gratitude to the Almighty Allah for
giving us this opportunity and enabling to complete the task peacefully.
We would like to express our sincere gratitude and indebtedness to our thesis supervisor
Dr. Mahmudur Rahman, Department of Civil Engineering, Ahsanullah University of
Science and Technology, for providing us excellent guidance and continuous assistance
throughout the study. His constant criticism, advice, assertions, appreciation were very
vital and irrevocable. Without his motivation it wouldn’t have been possible for us to
finish our paper. We have received endless support and guidance from him, right from
the development of ideas, methodology of work and this presentation. We are thankful
to him for his encouragement throughout the study.
We would also like to thank all of the faculty members specially A.S.M. Fahad Hossain,
Lecturer and Md. Mashfiqul Islam, Assistant Professor of Civil Engineering
Department, who also have provided us valuable guidance, unstinted support and
endless encouragement in this study. Indeed this page of acknowledgement shall never
be able to touch the horizon of generosity of those who tendered their help to us.

Page | 5
ABSTRACT
There might be many buildings in Bangladesh which do not meet the current seismic
requirement and as a result may suffer much damage during the earthquake. Especially
the older buildings which were constructed without the consideration of proper seismic
forces should be evaluated for seismic load and retrofitted accordingly. If remedial
measures are taken based on seismic evaluation, much damage can be overcome. In this
research study, a typical existing building in Dhaka city constructed before 1990 is
considered for seismic evaluation.
The objective of the research here is to evaluate the existing building for earthquake
performance. For applying earthquake loads, Equivalent Static Force Method is used
according to BNBC 1993. Reinforcement details of our considered building were not
available. For the purpose of study, in the first step an analysis is done applying only
Dead and Live Loads according to BNBC 1993. The building is then designed for Dead
Load and Live Load only without the consideration of seismic or wind load. In the
second step, the building is analyzed for seismic loading in addition to Dead Load and
Live Load with proper load factor. Three dimensional analyses is done using design
software STAAD-Pro. The Demand Capacity Ratio (DCR) is carried out for beams and
columns in order to evaluate the member for seismic loads. DCR is the ratio between
the Demand and Capacity where Demand is the amount of force or deformation
imposed on an element or component and Capacity is the permissible strength or
deformation of a structural member or system. From the Demand obtained from step-2
and Capacity from step-1, DCR is calculated. If Demand is more than Capacity, the
member is considered failed and vice versa. Then retrofitting is carried out for the failed

Page | 6
beams and columns. Steel Plating Retrofitting Method is applied for the beams and
Concrete Jacketing Retrofitting Method is applied for the columns. The comparisons
between Static and Dynamic behavior are also shown in this paper.
It is found that a number of beams and columns failed when seismic load is applied to
the structure. It is recommended that the buildings which were not built with seismic
consideration can be evaluated and retrofitted following the thesis procedure presented
in this study.

Page | 7
CONTENTS
Title Page
Declaration i
Acknowledgement ii
Abstract iii
Contents v
List of Figures ix
List of Tables xii
CHAPTER 1: INTRODUCTION 1
1.1: General 2
1.2: Earthquake in Bangladesh 3
1.2.1: Geometric Position and Tectonic Plates 3
1.2.2: Building Collapse Due to Shoddy Construction in Bangladesh 7
1.3: Objective of the Study 12
1.4: Scope of the Study 13
1.5: Necessity of Seismic Evaluation 14

Page | 8
CHAPTER 2: REVIEW OF LITERATURE 16
CHAPTER 3: METHODOLOGY 26
3.1: General 27
3.2: Seismic Evaluation 28
3.3: Seismic Retrofitting 32
3.3.1: Steel Plating 33
3.3.2: Concrete Jacketing 34
CHAPTER 4: BUILDING GEOMETRY AND MANUAL
STRUCTURAL ANALYSIS 38
4.1: General 39
4.2: Load Analysis and Design without Seismic Load 42
4.2.1: Design of Slab 42
4.2.2: Design of Beam 45
4.2.3: Design of Column 49
4.2.4: One Way Slab Design 55
4.3: Seismic Load Calculation 56

Page | 9
CHAPTER 5: 3D STRUCTURAL SOFTWARE ANALYSIS AND
RETROFITTING 65
5.1: General 66
5.2: Geometric Model and Design Parameters 67
5.3: Loads 70
5.4: Check for Beams 74
5.5: Check for Columns 79
5.6: Retrofitting 84
5.6.1: Retrofitting of Beam by Steel Plating 84
5.6.2: Retrofitting Of Column by Concrete Jacketing 86
5.7: Dynamic Analysis (Time History Analysis) 93
5.7.1: Introduction to EL-CENTRO COMP S90W Ground Motion 93
5.7.2: Structural Models and Their Top Floor Time History Displacement 95
5.7.3: Comparison of Displacements of Different Floors of Structure between
Dynamic and Static Earthquake Analysis 96
5.7.4: Comparison of Story Drifts Of Different Floors of Structure between
Dynamic and Static Earthquake Analysis 98
5.7.5: Comparison of Story Moment of Different Floors of Structure between
Dynamic and Static Earthquake Analysis 100

Page | 10
CHAPTER 6: CONCLUSION AND RECOMMENDATION 102
CHAPTER 7: REFERENCES 105

Page | 11
LIST OF FIGURE
Title Page
Figure 1.2.1: Regional Tectonic Setup of Bangladesh With Respect To Plate
Configuration 4
Figure 1.2.2: Digital Elevation Model (DEM) Of Bangladesh and Surroundings
Showing Geological Faults – Potential Sources of Major Earthquakes in Bangladesh
5
Figure 1.2.3: Seismic Zone of Bangladesh 6
Figure 1.2.4: Building Collapse in Christchurch Earthquake 10
Figure 1.2.5: Building Collapse in Turkey 11
Figure 1.2.6: Building Collapse in Mexico City 12
Figure 3.3.1: Jacketing of RC Columns 36
Figure 4.1.1: Layout of Plan 40
Figure 4.1.2: Layout of Plan with Grid Line 41
Figure 5.2.1: Plan of Building 67
Figure 5.2.2: Side View of Building 67
Figure 5.2.3: Whole Building with Member Properties Applied To All the Members (3-
D View) 68

Page | 12
Figure 5.3.1: Dead Load on Building 71
Figure 5.3.2: Dead Load on First Floor (Load of Walls on Beam + Self-Wt.) 72
Figure 5.3.3: Dead Load on First Floor (Floor Finish + Self-Wt.) 72
Figure 5.3.4: Live Load on Building 73
Figure 5.3.5: Live Load on first Floor 74
Figure 5.4.1: Concrete Design of Beam in STAAD Pro 75
Figure 5.4.2: Beam of First Floor Eligible for Steel Plating 79
Figure 5.5.1: Concrete Design of Column in STAAD Pro 81
Figure 5.5.2: Column Eligible for Concrete Jacketing 84
Figure 5.6.1: Concrete Jacketing of Exterior Column A2 87
Figure 5.6.2: Concrete Jacketing of Interior Column B3 88
Figure 5.6.3: Concrete Jacketing of Corner Column A1 90
Figure 5.6.4: Concrete Jacketing of Corner Column A1 91
Figure 5.7.1: EL-CENTRO COMP S90W Ground Motion with PGA Scaled To 0.21g
and Duration Equal to 47.56 Seconds 94
Figure 5.7.2: Time History Displacement of the Highlighted Node of Structure 95
Figure 5.7.3: Comparison of Displacements along Z-Direction between Dynamic and
Static Earthquake Analysis 97

Page | 13
Figure 5.7.4: Comparison of Story Drift along Z-Direction between Dynamic and
Static Earthquake Analysis 99
Figure 5.7.5: Comparison of Story Moment along Z-Direction between Dynamic and
Static Earthquake Analysis (A4 column) 101

Page | 14
LIST OF TABLE
Title Page
Table 1.2.1: Seismic Zoning of Bangladesh 6
Table 4.1: Column Dimensions 39
Table 4.2.1: Slab Load Calculation 43
Table 4.2.2: Moment Calculation of Slabs 44
Table 4.2.3: Beam Load Calculation 47
Table 4.2.4: Column Load Calculation 54
Table 4.3.1: Seismic Load Calculation for Each Grid 58
Table 4.3.2: Total Seismic Load Calculation 62
Table 5.2.1: Column Dimensions 69
Table 5.4.1: Level 01 Beam Check with Seismic Loads 77
Table 5.4.2: Level 01 Beam Check without Seismic Loads 78
Table 5.5.1: Parameters for Column Check 80
Table 5.5.2: Column Check 82
Table 5.6: Concrete Jacketing 92
Table 5.7.1: Comparison of Displacements of Different Floors of Structure between
Dynamic and Static Earthquake Analysis 96

Page | 15
Table 5.7.2: Comparison of Story Drifts of Different Floors of Structure between
Dynamic and Static Earthquake Analysis 98
Table 5.7.3: Comparison of Story Moment of Different Floors of Structure between
Dynamic and Static Earthquake Analysis 100

Page | 16
CHAPTER 1
INTRODUCTION

Page | 17
1.1: General
An earthquake (also known as a quake, tremor or temblor) is the result of a sudden
release of energy in the Earth’s crust that creates seismic waves. The seismicity or
seismic activity of an area refers to the frequency, type and size of earthquakes
experienced over a period of time. In most general sense, the word earthquake is used
to describe any seismic event — whether natural or caused by humans — that generates
seismic waves. Earthquakes are caused mostly by rupture of geological faults, but also
by other events such as volcanic activity, landslides, mine blasts, and nuclear tests.
Earthquakes are measured using observations from seismometers. The moment
magnitude is the most common scale on which earthquakes larger than approximately
5 are reported for the entire globe. The more numerous earthquakes smaller than
magnitude 5 reported by national seismological observatories are measured mostly on
the local magnitude scale, also referred to as the Richter scale.
The buildings which do not fulfill the requirements of seismic design, may suffer
extensive damage or collapse if shaken by a severe ground motion. Seismic Evaluation
and Retrofit of existing buildings describes deficiency-based and systematic procedures
that use performance-based principles to evaluate and retrofit existing buildings to
withstand the effects of earthquakes.
In this research an existing building is evaluated for earthquake performance. For
applying earthquake loads, Equivalent Static Force Method is used according to BNBC
1993. Reinforcement details of our considered building were not available. For the
purpose of study, in the first step an analysis is done applying only Dead and Live Loads

Page | 18
according to BNBC 1993. The building is then designed for Dead Load and Live Load
only without the consideration of seismic or wind load. In the second step, the building
is analyzed for seismic loading in addition to Dead Load and Live Load with proper
load factor. Three dimensional analyses is done using design software STAAD-Pro.
The Demand Capacity Ratio (DCR) is carried out for beams and columns in order to
evaluate the member for seismic loads. DCR is the ratio between the Demand and
Capacity where Demand is the amount of force or deformation imposed on an element
or component and Capacity is the permissible strength or deformation of a structural
member or system. From the Demand obtained from step-2 and Capacity from step-1,
DCR is calculated. If Demand is more than Capacity, the member is considered failed
and vice versa. Then retrofitting is carried out for the failed beams and columns. Steel
Plating Retrofitting Method is applied for the beams and Concrete Jacketing
Retrofitting Method is applied for the columns. The comparisons between Static and
Dynamic behavior are also shown in this paper.
1.2: Earthquake in Bangladesh
1.2.1: Geometric Position and Tectonic Plates
Bangladesh, a densely populated country in South Asia, is located in the northeastern
part of the Indian sub-continent at the head of the Bay of Bengal. Tectonically,
Bangladesh lies in the northeastern Indian plate near the edge of the Indian carton and
at the junction of three tectonic plates – the Indian plate, the Eurasian plate and the
Burmese micro plate. These form two boundaries where plates converge– the India-
Eurasia plate boundary to the north forming the Himalaya Arc and the India-Burma
plate boundary to the east forming the Burma Arc.

Page | 19
Figure 1.2.1: Regional Tectonic Setup of Bangladesh With Respect To Plate
Configuration.
Bangladesh is surrounded by the regions of high seismicity which include the
Himalayan Arc and SHILLONG PLATEAU in the north, the Burmese Arc, Arakan Yoma
anticlinorium in the east and complex Naga-Disang-Jaflong thrust zones in the
northeast. It is also the site of the Dauki Fault system along with numerous subsurface
active faults and a flexure zone called Hinge Zone. These weak regions are believed to
provide the necessary zones for movements within the basin area.

Page | 20
Figure 1.2.2: Digital Elevation Model (DEM) Of Bangladesh and Surroundings
Showing Geological Faults – Potential Sources of Major Earthquakes in Bangladesh.
The 1993 Bangladesh National Building Code provides guidelines for earthquake
resistant design. On the basis of distribution of earthquake epicenters and morph
tectonic behavior of different tectonic blocks Bangladesh has been divided into three
generalized seismic zones. The northeastern folded regions of Bangladesh are the most
active zones and belong to the zone-I. The seismic coefficient of this zone is 0.075. The
zone II consists of the regions of recent uplifted Pleistocene blocks of the Barind and
Madhupur and the western extension of the folded belt and the coefficient for this zone

Page | 21
is 0.15. The southwest Bangladesh is seismically quiet zone and represented by zone
III with coefficient 0.25. Ground condition (firm or soft) has not been taken into
consideration during the seismic zonation of Bangladesh. Characteristic features of
seismic zonation of Bangladesh are presented in the Table 1.2.1.
Table 1.2.1: Seismic Zoning of Bangladesh
Zoning Area Mercalli Scale
I North and eastern regions of Bangladesh (Seismically most
active)
II Lalmai, Barind, Madhupur Tracts, Dhaka, Comilla, Noakhali
and western part of Chittagong Folded belt.
III Khulna division S-E Bangladesh (Seismically relatively
quiet)
Figure 1.2.3: Seismic Zone of Bangladesh.

Page | 22
Dhaka is surrounded by the old Brahmaputra floodplain in the north and east, by the
Ganges-Meghna flood plain in the south and by the Jamuna flood plain in the west.
Dhaka is slightly elevated above the surrounding floodplains and represents mostly flat
land with minor undulations. Topographically Dhaka is of low relief with many low
depressions. According to Alam (1988), the Madhupur Tract is structurally controlled.
The Pleistocene sediments of Madhupur Tract have been affected by numerous
episodes of faulting. These faults are probably the branch out surface faults from the
low dipping western extension of Burma Arc detachment fault. Dhaka lies within 50 to
500 km distances from the seism genic faults and sits on the Burma Arc detachment
fault. Dhaka city falls in seismic zone II of the seismic zoning map of Bangladesh.
1.2.2: Building Collapse Due to Shoddy Construction in
Bangladesh
The construction industry of Bangladesh is not quite good. Here workmanship of
worker is low and also many owner and construction contractors are looking for cheap,
low quality work for more savings. Many building of the major cities like Dhaka and
Chittagong were constructed and still constructing disobeying rules of local and
government authority.
Rana plaza incident can be considered here. Officials have blamed the collapse on
shoddy construction methods. The upper four floors of the plaza, for example, were
reportedly constructed illegally without permits, and a crack was seen on the building
exterior a day before the collapse. The building was not built in compliance with the
[safety] rules and regulations. These types of accidents are a common problem in

Page | 23
developing countries, where construction materials can be expensive and building
inspections infrequent.
Uneven Footing
Henri Gavin, a civil and environmental engineer at Duke University, speculated that
the building's foundation was substandard. It could be that one edge of the building was
on much softer soil than the other, so that part of the building settled down a little bit
more. That could easily lead to an instability that would precipitate a collapse.
Another possibility is that weight on the top factory floors—where the crack was
spotted—was unevenly distributed.
When designing a building, engineers are supposed to consider different combinations
of how loads are placed in the structure. The intention is to require the engineer to
consider as many cases as possible. Such modeling is easy to do—if one has the right
computer and software. In developing countries such as Bangladesh, however,
calculating different load distributions can be a time-consuming process, and as a result
might be skipped.
Construction Problems
Poor building design is only one part of the problem, however. The best building design
in the world is for naught if a construction firm doesn't follow the plans precisely. That
may have been the case with Rana Plaza, which appears to have been built largely out
of concrete.

Page | 24
Concrete buildings require large amounts of reinforcing steel, called rebar, to prevent
excessive cracking. Depending on the country, steel can be costly. “In developing
countries, steel is relatively expensive in comparison to the labor and concrete," said
Dan Jansen, a civil engineer at California Polytechnic State University. But in
developing countries, less steel is often used than is recommended because of the cost.
Reducing or changing the reinforcing steel without the building official's approval is
never acceptable. But enough rebar was not used in Rana Plaza. So the amount of
reinforcing steel used didn't allow it to transfer the load from one section to another. In
addition to possibly being under-reinforced, the concrete mix may not have had enough
cement. Investigations following this earthquake revealed that the concrete had more
sand and less cement than required by typical design standards.
A Fatal Crack
A crack in a concrete building by itself is not necessarily a cause for alarm. There's a
saying: There are two kinds of concrete, there's cracked concrete and concrete that
hasn't cracked yet. Cracks are not a cause for concern unless you can see it moving over
time or it seems to be excessive.
The number one thing that structural engineers in the U.S. are trying to avoid is sudden,
catastrophic failure. We design structures to fail, but they must fail in a controlled
manner. Concrete structures that include an adequate amount of rebar are more likely
to yield in a ductile behavior, rather than folding like a deck of cards.
If Rana Plaza lacked redundancy because it was built with insufficient rebar, then the
building would have been a disaster waiting to happen.

Page | 25
It also appears as if sections of the plaza were still under construction when the disaster
happened. Some floors lacked walls, for example, and exposed columns with
protruding rebar are visible on the upper levels. It looks like the building was partially
built and used. Occupying a building under construction is just a recipe for disaster.
This building was used as garments factories of several owners with markets and office
spaces for institutions like bank etc. Being commercial building, to have uninterrupted
electricity supply, several generator were used there. BGMEA confirmed that during
collapse 3122 workers were working and a total 5000 workers were employed in
different floors of garments factories.
Figure 1.2.4: Building Collapse in Christchurch Earthquake.

Page | 26
The image above is taken from the collapse in Christchurch earthquake, which
resembles somewhat to Rana plaza. The difference is that there was a release of huge
strain energy due to deformation of plate boundary below South Islands (Australian
plate and Pacific plate). The energy released by this earthquake was 6.3 (in magnitude
scale). In Savar not such agitation was felt. The structure was collapsed due to service
loads, unexpected vibrations and its own weight.
Figure 1.2.5: Building Collapse in Turkey.
This image above is taken from Erics, Turkey; this failure seems more close to Savar
collapse. But this collapse was also associated with an earthquake of magnitude 7.1.

Page | 27
Figure 1.2.6: Building Collapse in Mexico City.
The last figure above is taken from Mexico City. Here we can notice that bottom five
floors were sandwiched. But this was due to one the great earthquake of the world;
Magnitude 8.1 Mexico earthquake. The bottom floors had mass irregularity and
sandwiched.
1.3: Objective of the Study
The main objective of this study is to assess the seismic vulnerability of an existing RC
structure and to provide for retrofit in case the members fail. The comparison between
Static and Dynamic behavior of the structure are also shown in this paper.

Page | 28
The objectives of this research paper are:
To design the structure considering only Dead Load and Live Load
To create the model of the structure using STAAD Pro and applying Seismic
Load
To compute the DCR (Demand to Capacity Ratio)
To provide retrofit for the failed members- Steel Plating for beams and Concrete
Jacketing for columns
To show the comparison between Static and Dynamic behavior for the structure
1.4: Scope of the Study
The building under study in this project is an existing multi-storied residential building
in Dhaka City. Since the reinforcement details of the building were not available, so
that a design is prepared applying only Dead Load and Live Load according to BNBC
1993. In the Equivalent Static procedure of seismic analysis, the Seismic Loads are
applied to the center of mass of the story, but in STAAD Pro it is assumed that the
Seismic Loads to be nodal loads and applied it to nodes dividing the total lateral story
loads in equal proportion per node and not at the exact center of mass of the story. While
considering retrofit measures for the structure, Concrete Jacketing and Steel Plating are
applied. It is assumed that there would be sufficient adhesion between plates and
concrete so that there is no failure due to bonding.
1.5: Necessity of Seismic Evaluation

Page | 29
It is known that damaging earthquakes are very often followed by a series of aftershocks
and sometimes by other main shocks. Past earthquakes have shown that when urban
areas are hit by damaging earthquakes, a significant percentage of structures attain light
to moderate damage. Moreover, it is known that structures that sustained some damages
prior to seismic event may collapse during a succeeding event. Such unfortunate events
have claimed many lives. Therefore, these structures impose a potential risk to human
life, economic assets and the environment. Thus, making decisions regarding the post-
earthquake functionality and repair of the damaged structures is a critical part of the
post-earthquake recovery process. Also, from the effects of significant earthquakes that
has struck the different parts of country, it is concluded that the seismic risks in urban
areas are increasing and are far from socio-economically acceptable levels. Therefore
there is an urgent need to reverse this situation and it is believed that one of the most
effective ways of doing this is through: (1) The seismic evaluation of existing stuck off
structures. (2) The development of more reliable seismic standards and code provisions
than those currently available with their stringent implementation for the complete
engineering of new engineering facilities. Therefore, an accurate estimation of the
performance of structure during an earthquake is crucial for estimating the actual effects
of that earthquake on the existing RC structures.
The vulnerability of the structure can be assessed with a higher accuracy and better
informed decisions can be made on the possible improvement of the seismic resistance
of existing RC structures. For example, the critical components of the structure that are
likely to sustain significant damages during future earthquake ground motions may be
identified. Accordingly, the required immediate structural interventions may be
designed to reduce the deformation demands on these components. Subsequently, the

Page | 30
overall behavior of the structure may be improved to achieve a satisfactory overall
seismic performance during a future earthquake.
CHAPTER 2

Page | 31
REVIEW OF LITERATURE
Prior to the introduction of modern seismic codes in the late 1960s for developed
countries (US, Japan etc.) and late 1970s for many other parts of the world (Turkey,
China etc.),many structures were designed without adequate detailing and
reinforcement for seismic protection. In view of the imminent problem, various

Page | 32
research works has been carried out. State-of-the-art technical guidelines for seismic
assessment, retrofit and rehabilitation have been published around the world - such as
the ASCE-SEI 41 and the New Zealand Society for Earthquake Engineering (NZSEE)'s
guidelines
For many older facilities, one mitigation option to protect against seismic hazards is the
seismic rehabilitation of existing structural elements. An example of the benefit of such
mitigation measures can be found through an analysis of the case of North Hall at the
University of California at Santa Barbara. The North Hall facility is a three-story
reinforced concrete structure, designed and built in 1960. It was originally thought that
the building was designed to the 1958 seismic load resistance building code, which did
not prescribe the more modern types of earthquake resistant construction. However, a
1973 engineering investigation discovered that the building was instead designed for
only one-tenth of the 1958 requirements, creating unsafe conditions at the facility.
Fortunately, the construction work to correct the original design errors occurred at about
the same time that the Uniform Building Code was being revised to include substantial
earthquake resistance provisions. The facility was partially rebuilt in 1975 by adding
interior and exterior shear walls to provide additional seismic resistance. The decision
was then made to rebuild the structure according to the provisions of the revised
building code; the upgrade made the North Hall Building the only building on campus
built to that advanced level of seismic standards.
Chandrasekaran and Rao (2002) investigated the design of multi- storied RCC buildings
for seismicity. Reinforced concrete multi-storied buildings are very complex to model

Page | 33
as structural systems for analysis. Usually, they are modeled as two-dimensional or
three-dimensional frame systems using finite beam elements. However, no guidelines
are available for the rational computation of sectional properties incorporating the
effects of reinforcements in concrete members and the analysis is full of
approximations.
Shunsuke Otani (2004) studied earthquake resistant design of RCC Buildings (Past and
Future). This paper briefly reviews the development of earthquake resistant design of
buildings. Measurement of ground acceleration started in 1930’s, and the response
calculation was made possible in 1940’s. Design response spectra were formulated in
the late 1950’s to 1960’s. Non-linear response was introduced in seismic design in
1960’s and the capacity design concept was introduced in 1970’s for collapse safety.
The damage statistics of RCC buildings in 1995 Kobe disaster demonstrated the
improvement of building performance with the development of design methodology.
Buildings designed and constructed using outdated methodology should be upgraded.
Performance basis engineering should be emphasized, especially for the protection of
building functions following frequent earthquakes.
Durgesh C. Rai (2005) gave the guidelines for seismic evaluation and strengthening of
buildings. This document is developed as part of project entitled ―Review of Building
Codes and Preparation of Commentary and Handbooks‖ awarded to Indian Institute
of Technology Kanpur by the Gujarat State Disaster Management Authority (GSDMA),
Gandhinagar through World Bank finances. This document is particularly concerned
Page | 34
with the seismic evaluation and strengthening of existing buildings and it is intended
to be used as a guide.
Another thesis paper was presented by Prof. Pravin B. Waghmare of Acharya
Shrimannarayan (2005), Polytechnic Pipri (M)- Wardha-Maharashtra entitled “A
Comparative Study of Retrofitting Of R.C. Building Using Steel Bracing And Infill Walls”
.The objective of his study was to identify an efficient retrofitting method for existing
open ground story reinforced concrete frame buildings. Failure of several soft-stored
buildings in the past earthquakes underscores the need to retrofit existing soft-story
buildings. During the Bhuj (Gujarat) earthquake of 6thJanuary 2001 several soft
storied building failed there by confirming the vulnerability of such buildings to
earthquake loading. That underscores the need to retrofit existing soft story buildings
to prevent their total collapse. The existing building structures, which were designed
and constructed according to early coda provisions, do not satisfy requirements of
current seismic code and design practices. A two dimensional R.C. frame designed
with linear elastic dynamic analysis using response spectrum method. The computer
software package STAAD Pro–2005 was used for dynamics analysis technique was
used to assess the performance of a (G + 4) reinforced concrete buildings, of which
the ground story was a parking facility the ground story was 3.5m high while the upper
stories giving a total height of 15.5 m. the building was located in Seismic Zone IV.
Devesh et al. (2006) agreed on the increase in drift demand in the tower portion of
set-back structures and on the increase in seismic demand for buildings with

Page | 35
discontinuous distributions in mass, strength and stiffness. The largest seismic
demand was found for the combined stiffness and strength irregularity.
It was found out that seismic behavior is influenced by the type of model.
Sadjadi et al. (2007) presented an analytical approach for seismic assessment of RC
frames using nonlinear time history analysis and push-over analysis. The analytical
models were validated against available experimental results and used in a study to
evaluate the seismic behavior of these 5-story frames.
It was concluded that both the ductile and the less ductile frames behaved very well
under the earthquake considered, while the seismic performance of the GLD structure
was not satisfactory. The retrofitted GLD frame had improved seismic performance.
Lee and Ko (2007) subjected three 1:12 scale 17-story RC wall building models having
different types of irregularity at the bottom two stories to the same series of simulated
earthquake excitations to observe their seismic response characteristics. The first
model had a symmetrical moment-resisting frame (Model 1), the second had an in
filled shear wall in the central frame (Model 2), and the third had an in filled shear wall
in only one of the exterior frames (Model 3) at the bottom two stories. The total
amounts of energy absorption by damage are similar regardless of the existence and
location of the in filled shear wall. The largest energy absorption was due to
overturning, followed by the shear deformation.
Karavasilis et al. (2008) studied the inelastic seismic response of plane steel moment-
resisting frames with vertical mass irregularity. The analysis of the created response

Page | 36
databank showed that the number of stores, ratio of strength of beam and column
and the location of the heavier mass influence the height-wise distribution and
amplitude of inelastic deformation demands, while the response does not seem to be
affected by the mass ratio.
Athanassiadou (2008) concluded that the effect of the ductility class on the cost of
buildings is negligible, while performance of all irregular frames subjected to
earthquake appears to be equally satisfactory, not inferior to that of the regular ones,
even for twice the design earthquake forces. DCM frames were found to be stronger
and less ductile than the corresponding DCH ones. The over strength of the irregular
frames was found to be similar to that of the regular ones, while DCH frames were
found to dispose higher over strength than DCM ones. Pushover analysis seemed to
underestimate the response quantities in the upper floors of the irregular frames.
Kim and Elnashai (2009) observed that buildings that are seismically designed to
contemporary codes would have survived the earthquake. But, the vertical motion
would have significantly reduced the shear capacity in vertical members.
Abu Lego (2010) studied the Design of earthquake resistant building using Site
Response spectra method. According to the Indian standard for Earthquake resistant
design (IS: 1893), the seismic force depends on the zone factor (Z) and the average
response acceleration coefficient (Sa/g) of the soil types at thirty meter depth with
suitable modification depending upon the depth of foundation. In the present study an
attempt has been made to generate response spectra using site specific soil parameters

Page | 37
for some sites in seismic zone V, i.e. Arunachal Pradesh and Meghalaya and the
generated response spectra is used to analyze some structures using commercial
software STAAD Pro.
Sarkar et al. (2010) proposed a new method of quantifying irregularity in vertically
irregular building frames, accounting for dynamic characteristics (mass and stiffness).
The salient conclusions were as follows:
(1)A measure of vertical irregularity, suitable for stepped buildings, called ‗regularity
index‘, is proposed, accounting for the changes in mass and stiffness along the height
of the building.
(2) An empirical formula is proposed to calculate the fundamental time period of
stepped building, as a function of regularity index.
Saptadip Sarkar (2010) studies the Design of Earthquake resistant multi stories RCC
building on a sloping ground which involves the analysis of simple 2-D frames of
varying floor heights and varying no of bays using a very popular software tool STAAD
Pro. Using the analysis results various graphs were drawn between the maximum axial
force, maximum shear force, maximum bending moment, maximum tensile force and
maximum compressive stress being developed for the frames on plane ground and
sloping ground. The graphs used to drawn comparison between the two cases and the
detailed study of ―Short Column Effect‖ failure was carried up. In addition to that the
detailed study of seismology was undertaken and the feasibility of the software tool to
be used was also checked.

Page | 38
Rajeeva and Tesfamariam (2012) Fragility based seismic vulnerability of structures
with consideration of soft -story (SS) and quality of construction (CQ) was
demonstrated on three, five, and nine story RC building frames designed prior to 1970s.
Probabilistic seismic demand model (PSDM) for those gravity load designed structures
was developed, using non-linear finite element analysis, considering the interactions
between SS and CQ. The response surface method is used to develop a predictive
equation for PSDM parameters as a function of SS and CQ. Result of the analysis shows
the sensitivity of the model parameter to the interaction of SS and CQ.
Mr. Ankur Agrawal (2012) presented a thesis paper entitled ―Seismic evaluation of
institute building” of NIT Rourkela. This project is similar to our project. The objective
was to evaluate the existing building for earthquake performance. Firstly preliminary
evaluation was done and then detailed evaluation was carried out. For applying
earthquake loads, equivalent static lateral force method was used according to IS
1893(Part 1):2002. The Demand Capacity Ratio (DCR) was carried out for beams and
columns in order to evaluate the member for seismic loads. Since the reinforcement
details of the building were not available as it was more than 50 years old, Design-1
was prepared applying only DEAD and LIVE loads according to IS 456:2000. That
helps in estimating the reinforcement present in the building and in assuming that that
much reinforcement is present. In Design-2 seismic loads were applied and from that
demand obtained from design-2 and capacity from design -1, the DCR was calculated.
STAAD-Pro V8i was used for loading and designing the building.
Page | 39
A paper on Prediction of potential damage due to severe earthquakes by Yucemen,
M.S., Ozcebe, G., and Pay, A.C (Department of Civil Engineering, Middle East
Technical University, Ankara 06531, Turkey and Department of Civil Engineering,
Purdue University). Here a statistical model is developed to estimate the seismic
vulnerability of low- to mid-rise reinforced concrete buildings. The model is based on
a novel utilization of the discriminant analysis technique of multivariate statistics.
A thesis on A New Methodology for Seismic Vulnerability Assessment of Existing
Buildings in Turkey by PAY, Ali Cihan, M.S.Thesis Supervisor: Prof. Dr. Güney
ÖZCEBE. In this study, a new methodology is presented to predict the seismic
vulnerability of reinforced concrete structures by statistical analysis based on a number
of structural parameters selected on the basis of engineering judgment and observations.
The available data collected after the 17 August and 12 November 1999 earthquakes in
Bolu, Düzce, and Kaynasli are examined by utilizing “discriminant analysis”.
A thesis on Seismic Retrofit Of Brick In filled R/C Frames With Lap Splice Problem
In Columns By AKGUZEL, Umut M.S. Thesis, Supervisor: Prof. Dr. Turan Ö TURAN.
Recent earthquakes revealed that many existing structures located in seismically active
regions of Turkey have inadequate lateral strength, stiffness or ductility. Lately, a
significant amount of research has been devoted to the study of various strengthening
techniques to enhance the seismic performance of the predominant structural system of
the region, which is reinforced concrete frames with unreinforced masonry infill. In this
context, an alternative strengthening method consists of externally applied carbon fiber
reinforced polymers (CFRP) over the brick in filled reinforced concrete frames has been
proposed and investigated.

Page | 40
Another article, subtitled “Keeping Preservation in the Forefront”, was posted on the
Old House Blog. It describes the unique problems faced when seismically retrofitting
an old home. The case studies concern older homes in Northern California. The authors
are David W. Look, AIA, Terry Wong, PE, and Sylvia Rose Augustus.
CHAPTER 3
METHODOLOGY

Page | 41
3.1: General
The purpose of this project is to assess the seismic vulnerability of an existing RC
structure and to provide for retrofit in case the members fail. The building under study
is an existing multi-storied residential building in Bangladesh. For applying earthquake
loads, Equivalent Static Force Method is used according to BNBC 1993. Reinforcement
details of our considered building were not available. For the purpose of study, in the
first step an analysis is done applying only Dead and Live Loads according to BNBC

Page | 42
1993. The building is then designed for Dead Load and Live Load only without the
consideration of seismic or wind load. In the second step, the building is analyzed for
seismic loading in addition to Dead Load and Live Load with proper load factor. Three
dimensional analyses is done using design software STAAD-Pro. The Demand
Capacity Ratio (DCR) is carried out for beams and columns in order to evaluate the
member for seismic loads. DCR is the ratio between the Demand and Capacity where
Demand is the amount of force or deformation imposed on an element or component
and Capacity is the permissible strength or deformation of a structural member or
system. From the Demand obtained from step-2 and Capacity from step-1, DCR is
calculated. If Demand is more than Capacity, the member is considered failed and vice
versa. Then retrofitting is carried out for the failed beams and columns. Steel Plating
Retrofitting Method is applied for the beams and Concrete Jacketing Retrofitting
Method is applied for the columns. The comparisons between Static and Dynamic
behavior are also shown in this paper.
The methodology of this study can be shown by the following flow chart-

Page | 43
3.2: Seismic Evaluation
Seismic Evaluation is a major tool in earthquake engineering which is used to
understand the response of buildings due to seismic excitations in a simpler manner.
In the past the buildings were designed just for gravity loads and seismic analysis is a
recent development. It is a part of structural analysis and a part of structural design
where earthquake is prevalent.
Seismic evaluation methods:
1. Preliminary Investigation
2. Detailed Evaluation
Designing the structure considering only Dead Load and Live Load
Modeling the structure using STAAD Pro and applying Seismic Load
Computing the DCR (Demand to Capacity Ratio)
Providing retrofit for the failed membes-Steel plating for beams and Concrete
jacketing for columns
Showing the comparision between Static and Dynamic behavior for the structure

Page | 44
Preliminary Investigation
The preliminary evaluation is a quick procedure to establish actual structural layout
and assess its characteristics that can affect its seismic vulnerability. It is an
approximate method based on conservative parameters to identify the potential
earthquake risk of a building and can be used for screening of buildings for detailed
evaluation. It also helps the design engineers to get acquainted with the building, its
potential deficiencies and behavior. A site visit is done as a part of preliminary
investigation in order to familiarize with the building and take note of the ground
conditions which are not reported in the drawings.
Detailed Evaluation
There are different types of detailed earthquake analysis methods. Some of them used
in the project are-
I. Equivalent Static Analysis
II. Response Spectrum Analysis
III. Time History Analysis
Equivalent Static Analysis
The Equivalent Static Analysis procedure is essentially an elastic design technique. It
is, however, simple to apply than the multi-model response method, with the absolute
simplifying assumptions being arguably more consistent with other assumptions
absolute elsewhere in the design procedure.

Page | 45
The Equivalent Static Analysis procedure consists of the following steps:
1. Estimate the first mode response period of the building from the design
response spectra.
2. Use the specific design response spectra to determine that the lateral base
shear of the complete building is consistent with the level of post-elastic
(ductility) response assumed.
3. Distribute the base shear between the various lumped mass levels usually
based on an inverted triangular shear distribution of 90% of the base shear
commonly, with 10% of the base shear being imposed at the top level to allow
for higher mode effects.
Response Spectrum Analysis
This approach permits the multiple modes of response of a building to be taken into
account. This is required in many building codes for all except for very simple or very
complex structures. The structural response can be defined as a combination of many
modes. Computer analysis can be used to determine these modes for a structure. For
each mode, a response is obtained from the design spectrum, corresponding to the
modal frequency and the modal mass, and then they are combined to estimate the
total response of the structure. In this the magnitude of forces in all directions is
calculated and then effects on the building are observed.
Following are the types of combination methods:

Page | 46
Absolute - peak values are added together
Square root of the sum of the squares (SRSS)
Complete quadratic combination (CQC) - a method that is an improvement on
SRSS for closely spaced modes
The result of a RSM analysis from the response spectrum of a ground motion is
typically different from that which would be calculated directly from a linear dynamic
analysis using that ground motion directly, because information of the phase is lost in
the process of generating the response spectrum.
In cases of structures with large irregularity, too tall or of significance to a community
in disaster response, the response spectrum approach is no longer appropriate, and
more complex analysis is often required, such as non-linear static or dynamic analysis.
Time History Analysis
Time History Analysis techniques involve the stepwise solution in the time domain of
the multi degree-of-freedom equations of motion which represent the actual
response of a building. It is the most sophisticated analysis method available to a
structural engineer. Its solution is a direct function of the earthquake ground motion
selected as an input parameter for a specific building. This analysis technique is usually
limited to checking the suitability of assumptions made during the design of important
structures rather than a method of assigning lateral forces themselves.

Page | 47
The steps involved in Time History Analysis are as follows:
1. Calculation of Modal matrix
2. Calculation of effective force vector
3. Obtaining of Displacement response in normal coordinate
4. Obtaining of Displacement response in physical coordinate
5. Calculation of effective earthquake response forces at each story
6. Calculation of maximum response
3.3: Seismic Retrofitting
Seismic Retrofitting is a modification of the structural and nonstructural components in
a building that aims to improve a building’s performance in future earthquakes.
Seismic strengthening or retrofitting is generally carried out in the following ways.
Structure Level or Global Retrofit Methods
Member Level or Local Retrofit Methods
Structure Level or Global Retrofit Methods
In structure level or global retrofit methods two approaches are used for structure level
retrofitting.
i) Conventional methods based on increasing the seismic resistance of existing
structure.
ii) Nonconventional methods based on reduction of seismic demands.

Page | 48
Conventional methods of retrofitting or strengthening are used to enhance the seismic
resistance of existing structures by eliminating or reducing the adverse effects of design
or construction. The methods include the options like adding of shear wall, infill walls
or steel braces.
In case of non-conventional methods, seismic base isolation and addition of
supplemented device techniques are the most popular. These techniques proceed with
quite different philosophy in the sense that it is fundamentally conceived to reduce the
horizontal seismic forces.
Member Level or Local Retrofit Methods
The member level retrofit or local retrofit of strengthening approach is to upgrade the
strength of the members, which are seismically deficient. This approach is more cost
effective as compared to the structure level retrofit. The most common method of
enhancing the individual member strength is jacketing. It includes the addition of
concrete, steel or fiber reinforced polymer (FRP) jackets for use in confining reinforced
concrete columns, beams, joints and foundations.
3.3.1: Steel Plating
In the present study, a series of experiments were conducted attempting to retrofit deep
reinforced concrete coupling beams using a bolted steel plate. In addition to the control
specimen, the other specimens were bolted with a steel plate on the side face to improve
the shear strength and inelastic behavior. A mechanical device was added to two
specimens to restrain plate buckling. Moreover, the plate buckling-restrained specimen
with a sufficient number of bolts in the anchor regions had a more stable response and

Page | 49
better inelastic performance under reversed cyclic loads. These findings can help
designers to a better understanding of this type of composite coupling beam.
In steel plating, steel plates are glued to beams to improve their flexural and shear
capacities. It increases the strength and stiffness of the beams and reduces the crack
width.
Advantages of Steel Plating:
Addition of steel plates is simple and can be rapidly applied
Does not reduce the story clear height significantly
Can be applied while the building is still in use
Relatively small increase in size of the existing section
3.3.2: Concrete Jacketing
Jacketing is the most popularly used method for strengthening of building columns. The
most common types of jackets are steel jacket, reinforced concrete jacket, fiber
reinforced polymer composite jacket, jacket with high tension materials like carbon
fiber, glass fiber etc.
Reinforced concrete jacketing can be employed as are pair or strengthening scheme.
Damaged regions of the existing members should be repaired prior to their jacketing.
There are two main purposes of jacketing of columns:
i) Increase in the shear capacity of columns in order to accomplish a strong
column-weak beam design and

Page | 50
ii) To improve the column's flexural strength by the longitudinal steel of the
jacket made continuous through the slab system are anchored with the
foundation.
Details for Reinforced Concrete Jacketing
Properties of Jackets:
Match with the concrete of the existing structure.
Compressive strength greater than that of the existing structures by
5 N/mm2 or at least equal to that of the existing structure.
Minimum Width of Jacket:
10 cm for concrete cast-in-place and 4 cm for shot Crete.
If possible, four-sided jacket should be used.
A monolithic behavior of the composite column should be assured.
Narrow gap should be provided to prevent any possible increase in
flexural capacity.
Minimum Area of Longitudinal Reinforcement:
3Afy, where, A is the area of contact in cm2 and fy is in kg/cm2.
Spacing should not exceed six times of the width of the new elements
(the jacket in the case) up to the limit of 60 cm.
Percentage of steel in the jacket with respect to the jacket area should be
limited between 0.015and 0.04.
At least, 12 mm bar should be used at every corner for a four sided
jacket.
Minimum Area of Transverse Reinforcement:

Page | 51
Designed and spaced as per earthquake design practice.
Minimum bar diameter used for ties is not less than 10 mm or 1/3 of the
diameter of the biggest longitudinal bar.
The ties should have 135-degree hooks with 10bar diameter anchorage.
Due to the difficulty of manufacturing 135-degree hooks on the field,
ties made up of multiple pieces, can be used.
Connectors:
Connectors should be anchored in both the concrete such that it may
develop at least80% of their yielding stress.
Distributed uniformly around the interface, avoiding concentration in
specific locations.
It is better to use reinforced bars (rebar) anchored with epoxy resins of
grouts.

Page | 52
Figure 3.3.1: Jacketing of RC Columns.
Limitations:
There are some disadvantages associated with the column jacketing techniques. They
are as follows:
In some cases the presence of beams may require majority of new longitudinal
bars to be bundled into the corners of the jacket;
With the presence of the existing column it is difficult to provide cross ties for
new longitudinal bars which are not at the corners of the jackets;
Jacketing is based mostly on engineering judgment as there is a dearth of
guidelines.

Page | 53
CHAPTER 4
BUILDING GEOMETRY AND
MANUAL STRUCTURAL ANALYSIS

Page | 54
4.1: General
A 9 story residential building is considered in this research study. The building has two
units. For simplification of work one unit is taken here. In Figure 4.1.1 the Layout of
Plan is shown and in Figure 4.1.2 the Layout of Plan with Grid Line is shown. Beam
size is same at all story. But there is difference in column sizes. In total six types of
column sizes are used in the building. The Column Dimensions are shown in the
following Table 4.1.
Table 4.1: Column Dimensions
Location Level 01 to 05 Level 06 to 09
Interior 23”*23” 15”*15”
Exterior 20”*20” 13”*13”

Page | 55
Corner 17”*17” 11”*11”
Dimension of beam: 12”*22” and 12”*18”.

Page | 56
Figure 4.1.1: Layout of Plan.

Page | 57
Figure 4.1.2: Layout of Plan with Grid Line.
Dimension of beam: 12”*22” and 12”*18”.
Dimension of column: Exterior column- 20”*20”, Interior column- 23”*23”, Corner column- 17”*17” for G to 4th floor and
Exterior column- 13”*13”, Interior column- 15”*15”, Corner column- 11”*11” for 5th to 8th floor.

Page | 58
4.2: Load Analysis and Design without Seismic Load
4.2.1: Design of Slab
Slab AB34 is taken for showing the detailed calculation. After calculating Dead Load
and Live Load for slab AB34 total load is found 0.271 ksf. In Table 4.2.1 total load for
all slabs are calculated. Then using ACI moment coefficient method, moment of slab
AB34 is calculated. In Table 4.2.2 moment calculation for all slabs are shown.
Given,
fc’ = 3 ksi, fy= 50 ksi
Live Load = 40 psf (BNBC 93, Table 6.2.3)
Floor Finish = 30 psf
Partition Wall = 40 psf (BNBC 93, Table 6.2.2)
Brick Wall Load = 0.5 kip/ft
Slab ID = AB34
Thickness =Perimeter
180 =
2(20+25)
180*12 = 6 inch
Load Calculation:
Dead Load, DL = (6
12*150+30+40)*1.4 = 203 psf
Live Load, LL = (40*1.7) = 68 psf
Total Load, w = 271 psf
= 0.271 ksf

Page | 59
Table 4.2.1: Slab Load Calculation
m= 𝐴
𝐵 =
20
25 = 0.8 (Case 4)
+MA(Pos) = CA DLWDL A2 + CA LLWLL A2
= (0.039*203
1000 *202) + (0.048 *
68
1000 *202)
= 4.4724 k-ft/ft
+MB(Pos) = CB DLWDL B2 + CB LLWLL B2
= (0.016*203
1000 *252) + (0.020 *
68
1000 *252)
= 2.88 k-ft/ft
Similarly,
- MA(Neg) = -0.071*271
1000 *202 = -7.6964 k-ft/ft
- MB(Neg) = -0.029*271
1000 *252 = -4.912 k-ft/ft
No
Slab
ID
La
(short)
ft
Lb
(long)
ft
m
t
(eqv.)
ft
Wself
k/ft2
FF
(eqv.)
k/ft2
DL
(ult)
k/ft2
LL
k/ft2
LL
(ult)
k/ft2
Wu
(total)
k/ft2
1 12AB 20.00 25.00 0.80 0.50 0.075 0.07 0.203 0.04 0.068 0.271
2 BC12 15.00 20.00 0.75 0.50 0.075 0.07 0.203 0.04 0.068 0.271
3 DC12 15.00 20.00 0.75 0.50 0.075 0.07 0.203 0.04 0.068 0.271
4 23AB 10.00 25.00 0.40 0.50 0.075 0.07 0.203 0.04 0.068 0.271
5 23BC 10.00 15.00 0.67 0.50 0.075 0.07 0.203 0.04 0.068 0.271
6 23CD 10.00 15.00 0.67 0.50 0.075 0.07 0.203 0.04 0.068 0.271
7 34AB 20.00 25.00 0.80 0.50 0.075 0.07 0.203 0.04 0.068 0.271
8 BC34 15.00 20.00 0.75 0.50 0.075 0.07 0.203 0.04 0.068 0.271
9 CD34 15.00 20.00 0.75 0.50 0.075 0.07 0.203 0.04 0.068 0.271

Page | 60
Table 4.2.2: Moment Calculations of Slabs
No
Slab
I.D.
La
ft
Lb
ft
case
Ca
(neg)
Cb
(neg)
Ca
(pos)
DL
Cb
(pos)
DL
Ca
(pos)
LL
Cb
(pos)
LL
DL(ult)
k/ft2
LL(ult)
k/ft2
Ma
(neg)
k-ft/ft
Ma
(pos)
k-ft/ft
Mb
(neg)
k-ft/ft
Mb
(pos)
k-ft/ft
1 1,2,A,B 19 24 4 0.071 0.029 0.039 0.016 0.048 0.020 0.203 0.068 6.95 4.04 4.53 2.65
2 B,C,1,2 14 19 9 0.078 0.014 0.031 0.007 0.046 0.013 0.203 0.068 4.14 1.85 1.37 0.83
3 D,C,1,2 14 19 4 0.076 0.024 0.043 0.013 0.052 0.016 0.203 0.068 4.04 2.40 2.35 1.35
4 2,3,B,C 9 14 2 0.076 0.015 0.031 0.006 0.052 0.011 0.203 0.068 1.67 0.80 0.80 0.39
5 2,3,C,D 9 14 9 0.082 0.009 0.034 0.005 0.053 0.010 0.203 0.068 1.81 0.84 0.48 0.34
6 3,4,A,B 19 24 4 0.071 0.029 0.039 0.016 0.048 0.020 0.203 0.068 6.95 4.04 4.53 2.65
7 B,C,3,4 14 19 6 0.088 0.000 0.048 0.012 0.055 0.016 0.203 0.068 4.67 2.64 0.00 1.27
8 C,D,3,4 14 19 4 0.076 0.024 0.043 0.013 0.052 0.016 0.203 0.068 4.04 2.40 2.35 1.35

Page | 61
d- Check:
ρ = 0.85ß fc’
fy
Ɛu
Ɛu+Ɛt
= 0.85*0.85*3
50*
0.003
0.003+0.004
= 0.0186
Now, d = √Mmax
Øρfyb(1−0.59ρfy/fc’)
= √7.6964∗12
0.9∗0.0186∗50∗12∗(1−0.59∗0.0186∗50
3)
= 3.35 inch <dmin= (6-1) = 5 inch
So, OK
So, Thickness = 6 inch
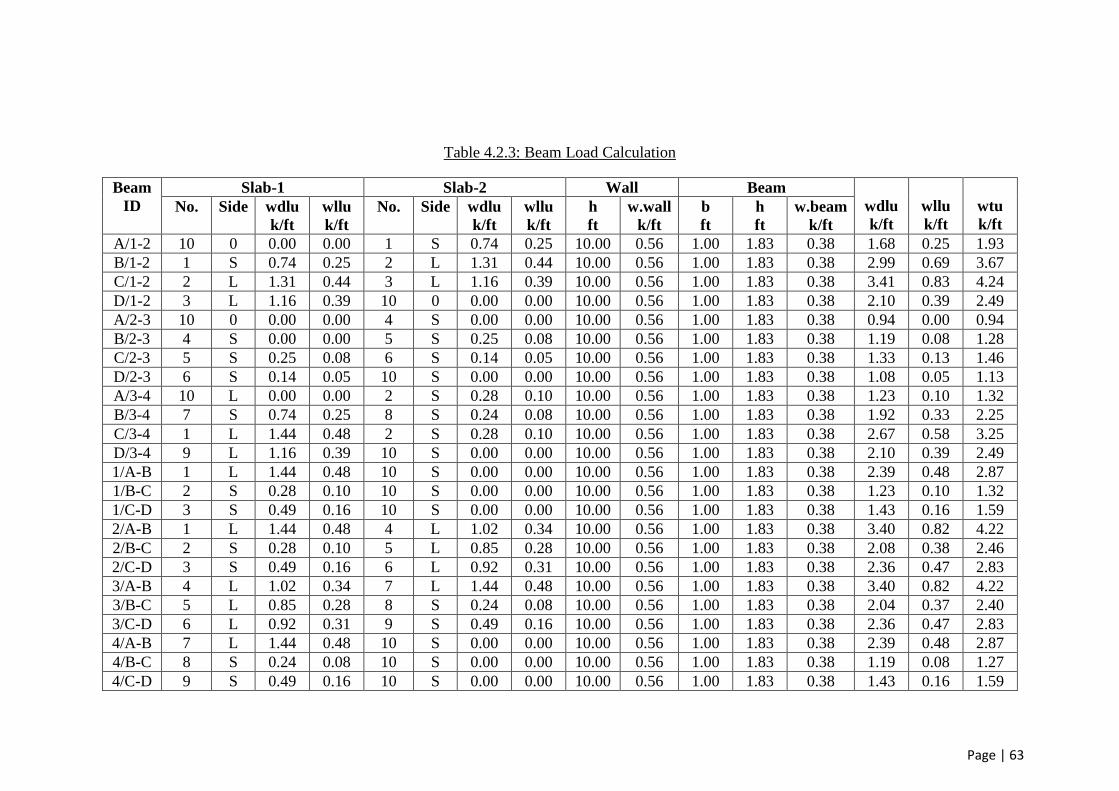
4.2.2: Design of Beam
A detailed calculation for beam A3B3 is shown here as a sample calculation. For
beam A3B3 load on beam is calculated. Then in Table 4.2.3 load calculation for all
beams has been done. Finally by using ACI coefficient method beam size is
calculated.
Beam ID = A3B3
Slab Area = (5*25) + 1
2(5+25)*10
= 275 ft2

Page | 62
Slab Load, w = 0.271 ksf
So, Load on Slab = (0.271*275) k = 74.525 k
Let the size of the Beam is 12" * 22"
Beam Load = Load for self-weight + Wall load
= {(12∗22
144 *25*
150
1000 ) + (
5
12 *10*
120
1000∗ 25)}1.4
= 27.125 k
So, Load on Beam = Load from Slab + Beam load
= 74.525+27.125
= 101.65 k/25ft
= 4.1 k/ft
Page | 63
Table 4.2.3: Beam Load Calculation
Beam
ID
Slab-1 Slab-2 Wall Beam
wdlu
k/ft
wllu
k/ft
wtu
k/ft No.
Side
wdlu
k/ft
wllu
k/ft
No.
Side
wdlu
k/ft
wllu
k/ft
h
ft
w.wall
k/ft
b
ft
h
ft
w.beam
k/ft
A/1-2 10 0 0.00 0.00 1 S 0.74 0.25 10.00 0.56 1.00 1.83 0.38 1.68 0.25 1.93
B/1-2 1 S 0.74 0.25 2 L 1.31 0.44 10.00 0.56 1.00 1.83 0.38 2.99 0.69 3.67
C/1-2 2 L 1.31 0.44 3 L 1.16 0.39 10.00 0.56 1.00 1.83 0.38 3.41 0.83 4.24
D/1-2 3 L 1.16 0.39 10 0 0.00 0.00 10.00 0.56 1.00 1.83 0.38 2.10 0.39 2.49
A/2-3 10 0 0.00 0.00 4 S 0.00 0.00 10.00 0.56 1.00 1.83 0.38 0.94 0.00 0.94
B/2-3 4 S 0.00 0.00 5 S 0.25 0.08 10.00 0.56 1.00 1.83 0.38 1.19 0.08 1.28
C/2-3 5 S 0.25 0.08 6 S 0.14 0.05 10.00 0.56 1.00 1.83 0.38 1.33 0.13 1.46
D/2-3 6 S 0.14 0.05 10 S 0.00 0.00 10.00 0.56 1.00 1.83 0.38 1.08 0.05 1.13
A/3-4 10 L 0.00 0.00 2 S 0.28 0.10 10.00 0.56 1.00 1.83 0.38 1.23 0.10 1.32
B/3-4 7 S 0.74 0.25 8 S 0.24 0.08 10.00 0.56 1.00 1.83 0.38 1.92 0.33 2.25
C/3-4 1 L 1.44 0.48 2 S 0.28 0.10 10.00 0.56 1.00 1.83 0.38 2.67 0.58 3.25
D/3-4 9 L 1.16 0.39 10 S 0.00 0.00 10.00 0.56 1.00 1.83 0.38 2.10 0.39 2.49
1/A-B 1 L 1.44 0.48 10 S 0.00 0.00 10.00 0.56 1.00 1.83 0.38 2.39 0.48 2.87
1/B-C 2 S 0.28 0.10 10 S 0.00 0.00 10.00 0.56 1.00 1.83 0.38 1.23 0.10 1.32
1/C-D 3 S 0.49 0.16 10 S 0.00 0.00 10.00 0.56 1.00 1.83 0.38 1.43 0.16 1.59
2/A-B 1 L 1.44 0.48 4 L 1.02 0.34 10.00 0.56 1.00 1.83 0.38 3.40 0.82 4.22
2/B-C 2 S 0.28 0.10 5 L 0.85 0.28 10.00 0.56 1.00 1.83 0.38 2.08 0.38 2.46
2/C-D 3 S 0.49 0.16 6 L 0.92 0.31 10.00 0.56 1.00 1.83 0.38 2.36 0.47 2.83
3/A-B 4 L 1.02 0.34 7 L 1.44 0.48 10.00 0.56 1.00 1.83 0.38 3.40 0.82 4.22
3/B-C 5 L 0.85 0.28 8 S 0.24 0.08 10.00 0.56 1.00 1.83 0.38 2.04 0.37 2.40
3/C-D 6 L 0.92 0.31 9 S 0.49 0.16 10.00 0.56 1.00 1.83 0.38 2.36 0.47 2.83
4/A-B 7 L 1.44 0.48 10 S 0.00 0.00 10.00 0.56 1.00 1.83 0.38 2.39 0.48 2.87
4/B-C 8 S 0.24 0.08 10 S 0.00 0.00 10.00 0.56 1.00 1.83 0.38 1.19 0.08 1.27
4/C-D 9 S 0.49 0.16 10 S 0.00 0.00 10.00 0.56 1.00 1.83 0.38 1.43 0.16 1.59

Page | 64
Now,
+M = 1
14wL2 =
1
14*3.4*252 = 151.79 k-ft
-M = 1
10wL2 =
1
10*3.4*252 = 212.5 k-ft
ρ = 0.85Øfc’
fy
Ɛu
Ɛu+Ɛt
= 0.85*0.85*3
50*
0.003
0.003+0.004
= 0.0186
d = √Mmax
Øρfyb(1−0.59ρfy/fc’)
=√212.5∗12
0.9∗0.0186∗50∗12∗(1−0.59∗0.0186∗50
3)
= 17.62 inch
= (17.62+2.5) inch
= 20.13 inch < 22inch
So, OK
So, Beam size = 12" * 22"

Page | 65
4.2.3: Design of Column
In Table 4.2.4 column load calculations is shown. Manually the column load of B3 is
shown here. After calculating the load a column size is assumed and the total load is
found by including the self-weight. Then the gross area of column is calculated and
suitable column size is selected.
Column Name = B3
Load Calculation on Column from Roof Slab:
Thickness of Slab = 6 inch;
Live Load = 30psf
Lime Concrete = 30psf;
Dead Load, DL= (6
12*150+30)*1.4 = 147 psf
Live Load, LL = (30*1.7) = 51 psf
Total Load on Slab, w = 198 psf
= 0.198 ksf
= 0.2 ksf
Beam A3B3:
Slab Load = {(25*5)+1
2(5+25)10}*0.2 = 55k
Beam Load = (12∗22
144 *25*
150
1000 ) 1.4 = 9.625k
So Load on Beam = 55+9.625
25 = 2.585 k/ft

Page | 66
Beam B2B3:
Slab Load = {(10*12.5)+1
2*10*5}*0.2 = 30k
Beam Load = (12∗22
144 *10*
150
1000 ) 1.4 = 3.85k
So Load on Beam = 30+3.85
10 = 3.385 k/ft
Beam B3B4:
Slab Load = {(1
2 *20*10)+
1
2(20+5)7.5}*0.2 = 38.75k
Beam Load = (12∗22
144 *20*
150
1000 ) 1.4 = 7.68k
So Load on Beam = 38.75+7.68
20 = 2.32 k/ft
Beam B3C3:
Slab Load = {(1
2 *15*7.5)+
1
2(5+15)5}*0.2 = 21.25k
Beam Load = (12∗22
144 *15*
150
1000 ) 1.4 = 5.775k
So Load on Beam = 21.25+5.775
15 = 1.80 k/ft
Now,
Load on Column = 2.585*25
2 +3.385*
10
2 +2.32*
20
2 +1.80*
15
2
= 85.85 k

Page | 67
Load Calculation on Column from Floor Slab:
Total Load on Slab, w = 0.271 ksf
Beam A3B3:
Slab Load = {(25*5)+1
2(5+25)10}*0.271 = 74.525k
Beam Load = (12∗22
144 *25*
150
1000 ) 1.4 = 9.625k
So Load on Beam = 74.525+9.625
25 = 3.366 k/ft
Beam B2B3:
Slab Load = {(10*12.5)+1
2*10*5}*0.271 = 40.65k
Beam Load = (12∗22
144 *10*
150
1000 ) 1.4 = 3.85k
So Load on Beam = 40.65+3.85
10 = 4.45 k/ft
Beam B3B4:
Slab Load = {(1
2 *20*10)+
1
2(20+5)7.5}*0.271 = 52.51k
Beam Load = (12∗22
144 *20*
150
1000 ) 1.4 = 7.68k
So Load on Beam = 52.51+7.68
20 = 3 k/ft
Beam B3C3:
Slab Load = {(1
2 *15*7.5)+
1
2(5+15)5}*0.271 = 28.79k
Beam Load = (12∗22
144 *15*
150
1000 ) 1.4 = 5.775k

Page | 68
So Load on Beam = 28.79+5.775
15 = 2.30 k/ft
Now,
Load on Column = 3.366*25
2 +4.45*
10
2 +3*
20
2 +2.30*
15
2
= 111.575 k
Assuming Column size 12" * 12" from 5th to 8th Floor
Self-Weight of Column = 12∗12
144 *10*
150
1000
= 1.5 k
8th Floor = 85.85 k
7th Floor = 85.85+111.575+1.5 = 198.925
6th Floor = 85.85+(111.575*2)+(1.5*2) = 312.00 k
5th Floor = 85.85+(111.575*3)+(1.5*3) = 425.075 k
Assuming Column size 15" * 15" from GF to 4th Floor
Self-Weight of Column = 15∗15
144 *10*
150
1000
= 2.34 k

Page | 69
4th Floor = 85.85+(111.575*4)+(1.5*3)+2.34 = 538.99 k
3rd Floor = 85.85+(111.575*5)+(1.5*3)+(2.34*2) = 652.905 k
2nd Floor = 85.85+(111.575*6)+(1.5*3)+(2.34*3) = 766.82 k
1st Floor = 85.85+(111.575*7)+(1.5*3)+(2.34*4) = 880.735 k
GF = 85.85+(111.575*8)+(1.5*3)+(2.34*5) = 994.65 k
In Table 4.2.4 axial load for each floor of B3 column has been shown. For manual
calculation it is found that at GF column load is 994.65 kip and from Table 4.2.4 the
load is 977.24 kip at GF. So, it can be said that the design is approximately ok.

Page | 70
Table 4.2.4: Column Load Calculation
Level
Slab-1 Slab-2 Wall-1 Wall-2 Beam Column Accumulated
Load
kip
l1
ft
l2
ft
t
ft
w
kip
l1
ft
l2
ft
t
ft
w
kip
h
ft
l
ft
w
kip
h
ft
l
ft
w
kip
l
ft
w
kip
h
ft
w
kip
Fl. 9 20 15 0.7 31.5 0 0 0 0.00 10 20 10.00 10 15 7.50 35 9.61 10 2.65 101.07
Fl. 8 20 15 0.7 31.5 0 0 0 0.00 10 20 10.00 10 15 7.50 35 9.61 10 2.65 207.23
Fl. 7 20 15 0.7 31.5 0 0 0 0.00 10 20 10.00 10 15 7.50 35 9.61 10 2.65 313.40
Fl. 6 20 15 0.7 31.5 0 0 0 0.00 10 20 10.00 10 15 7.50 35 9.61 10 2.65 419.56
Fl. 5 20 15 0.7 31.5 0 0 0 0.00 10 20 10.00 10 15 7.50 35 9.61 10 6.49 531.10
Fl. 4 20 15 0.7 31.5 0 0 0 0.00 10 20 10.00 10 15 7.50 35 9.61 10 6.49 642.63
Fl. 3 20 15 0.7 31.5 0 0 0 0.00 10 20 10.00 10 15 7.50 35 9.61 10 6.49 754.17
Fl. 2 20 15 0.7 31.5 0 0 0 0.00 10 20 10.00 10 15 7.50 35 9.61 10 6.49 865.70
Fl. 1 20 15 0.7 31.5 0 0 0 0.00 10 20 10.00 10 15 7.50 35 9.61 10 6.49 977.24

Page | 71
From 5th to 8th Floor, Pu = 425.075 k
Pu = 0.8Ø[0.85 fc’ (Ag-Ast)+fyAst]
Or, 425.075 = 0.80*0.70*[0.85*3*(Ag-0.015Ag)+50*0.015Ag]
Or, 425.075 = 1.83Ag
Or, Ag = 232.28 in2
So, √232.28 = 15.24 inch
So, Column size = 15" * 15"
From GF to 4th Floor, Pu = 994.65 k
Or, 994.65 = 1.83Ag
Or, Ag = 543.52 in2
So, √543.52 = 23.31 inch
So, Column size = 23" * 23"
4.2.4: One Way Slab Design
There is a one way slab in this building. So, the load and moment for one way slab is
calculated separately.

Page | 72
Slab ID = AB23
Load Calculation:
Dead Load, DL = (6
12*150+30+40)*1.4 = 203 psf
Live Load, LL = (40*1.7) = 68 psf
Total Load, w = 271psf = 0.271 ksf
Moment Calculation:
+M(short) = wL2/8 = 0.271*102/8
= 3.39 k-ft/ft
4.3: Seismic Load Calculation
Static Equivalent Earthquake Method is used for seismic load calculation of the
considered building. This building is situated in Zone 2. In Table 4.3.1 and Table 4.3.2
seismic load calculation for each grid of different floors are shown.
We know, V= 𝑍𝐼𝐶
𝑅*w
Where:
Z= 0.15 (Dhaka Seismic Zone 2)
I = 1.0 (Standard Occupancy Structure, Residential Building)
R= 5

Page | 73
Now,
T= Ct (hn)3/4
= 0.049*(87
3.28)3/4
= 0.573
∴ C = 1.25S / T2/3
= (1.25*1.5) / (0.573)2/3
= 2.17
W = Dead load of Column for each Grid
Now, Ft = 0 as T < 0.7
In Table 4.3.1 Seismic Load Calculation for Each Grid are shown.
And then in Table 4.3.2: Total Seismic Load Calculation is presented.

Page | 74
Table 4.3.1: Seismic Load Calculation for Each Grid
Grid A
Floor A1 Colm A2 Colm A3 Colm A4 Colm Colm
Load(k)
Total
Wi(k)
Height,
Hi(ft)
Wihi(k-ft)
Load(k) Wi(k) Load(k) Wi(k) Load(k) Wi(k) Load(k) Wi(k)
Fl. 9 33.2 39.4547 43.64 43.64 43.64 43.64 33.2 33.2 153.68 159.9347 87 13914.3
Fl. 8 66.41 33.21 87.28 43.64 87.28 43.64 66.41 33.21 307.38 153.7 77 11834.9
Fl. 7 99.61 33.2 130.92 43.64 130.92 43.64 99.61 33.2 461.06 153.68 67 10296.6
Fl. 6 132.82 33.21 174.56 43.64 174.56 43.64 132.82 33.21 614.76 153.7 57 8760.9
Fl. 5 169.86 37.04 222.03 47.47 222.03 47.47 169.86 37.04 783.78 169.02 47 7943.94
Fl. 4 206.9 37.04 269.51 47.48 269.51 47.48 206.9 37.04 952.82 169.04 37 6254.48
Fl. 3 243.94 37.04 316.99 47.48 316.99 47.48 243.94 37.04 1121.86 169.04 27 4564.08
Fl. 2 280.98 37.04 364.46 47.47 364.46 47.47 280.98 37.04 1290.88 169.02 17 2873.34
Fl. 1 318.02 37.04 411.94 47.48 411.94 47.48 318.02 37.04 1459.92 169.04 7 1183.28
SUM 67625.8

Page | 75
Grid B
Floor B1 Colm B2 Colm B3 Colm B4 Colm Colm
Load(k)
Total
Wi(k)
Height,
Hi(ft)
Wihi(k-ft)
Load(k) Wi(k) Load(k) Wi(k) Load(k) Wi(k) Load(k) Wi(k)
Fl. 9 46.89 46.89 61.26 61.26 61.261 61.261 46.89 46.89 216.30095 216.30095 87 18818.2
Fl. 8 93.78 46.89 122.52 61.26 122.522 61.2609 93.78 46.89 432.6018 216.30085 77 16655.2
Fl. 7 140.67 46.89 183.783 61.2627 183.783 61.2609 140.67 46.89 648.9053 216.3035 67 14492.3
Fl. 6 187.55 46.88 245.044 61.2609 245.044 61.2609 187.55 46.88 865.187 216.2817 57 12328.1
Fl. 5 238.28 50.73 310.141 65.0971 310.141 65.0971 238.28 50.73 1096.8412 231.6542 47 10887.7
Fl. 4 289 50.72 375.238 65.0971 375.238 65.0971 289 50.72 1328.4754 231.6342 37 8570.47
Fl. 3 339.73 50.73 440.335 65.0971 440.335 65.0971 339.73 50.73 1560.1296 231.6542 27 6254.66
Fl. 2 390.45 50.72 505.432 65.0971 505.432 65.0971 390.45 50.72 1791.7638 231.6342 17 3937.78
Fl. 1 441.18 50.73 570.529 65.0971 570.529 65.0971 441.18 50.73 2023.418 231.6542 7 1621.58
SUM 93566

Page | 76
Grid C
Floor C1 Colm C2 Colm C3 Colm C4 Colm Colm
Load(k)
Total
Wi(k)
Height,
Hi(ft)
Wihi(k-ft)
Load(k) Wi(k) Load(k) Wi(k) Load(k) Wi(k) Load(k) Wi(k)
Fl. 9 37.77 37.77 49.51 49.51 49.51 49.51 37.77 37.77 174.56 174.56 87 15186.7
Fl. 8 75.53 37.76 99.03 49.52 99.03 49.52 75.53 37.76 349.12 174.56 77 13441.1
Fl. 7 113.3 37.77 148.54 49.51 148.54 49.51 113.3 37.77 523.68 174.56 67 11695.5
Fl. 6 151.06 37.76 198.05 49.51 198.05 49.51 151.06 37.76 698.22 174.54 57 9948.78
Fl. 5 192.67 41.61 251.4 53.35 251.4 53.35 192.67 41.61 888.14 189.92 47 8926.24
Fl. 4 234.27 41.6 304.75 53.35 304.75 53.35 234.27 41.6 1078.04 189.9 37 7026.3
Fl. 3 275.87 41.6 358.1 53.35 358.1 53.35 275.87 41.6 1267.94 189.9 27 5127.3
Fl. 2 317.47 41.6 411.45 53.35 411.45 53.35 317.47 41.6 1457.84 189.9 17 3228.3
Fl. 1 359.07 41.6 464.8 53.35 464.8 53.35 359.07 41.6 1647.74 189.9 7 1329.3
SUM 75909.6

Page | 77
Grid D
Floor D1 Colm D2 Colm D3 Colm D4 Colm Colm
Load(k)
Total
Wi(k)
Height,
Hi(ft)
Wihi(k-ft)
Load(k) Wi(k) Load(k) Wi(k) Load(k) Wi(k) Load(k) Wi(k)
Fl. 9 24.08 24.08 31.89 31.89 31.89 31.89 24.08 24.08 111.94 111.94 87 9738.78
Fl. 8 48.16 24.08 63.78 31.89 63.78 31.89 48.16 24.08 223.88 111.94 77 8619.38
Fl. 7 72.25 24.09 95.68 31.9 95.68 31.9 72.25 24.09 335.86 111.98 67 7502.66
Fl. 6 96.33 24.08 127.57 31.89 127.57 31.89 96.33 24.08 447.8 111.94 57 6380.58
Fl. 5 124.25 27.92 163.3 35.73 163.3 35.73 124.25 27.92 575.1 127.3 47 5983.1
Fl. 4 152.17 27.92 199.09 35.79 199.09 35.79 152.17 27.92 702.52 127.42 37 4714.54
Fl. 3 180.01 27.84 234.75 35.66 234.75 35.66 180.01 27.84 829.52 127 27 3429
Fl. 2 208 27.99 270.48 35.73 270.48 35.73 208 27.99 956.96 127.44 17 2166.48
Fl. 1 235.92 27.92 306.21 35.73 306.21 35.73 235.92 27.92 1084.26 127.3 7 891.1
SUM 49425.6

Page | 78
Table 4.3.2: Total Seismic Load Calculation
Floor
Hx(ft)
Fx (kip)
Grid A Grid B Grid C Grid D Total
8th 87 18.792 26.4915 21.4542 13.9026 161.281
7th 77 16.632 23.4465 18.9882 12.3046 142.743
6th 67 14.472 20.4015 16.5222 10.7066 124.205
5th 57 12.312 17.3565 14.0562 9.1086 105.667
4th 47 11.1625 15.322 12.6101 8.5399 95.269
3rd 37 8.7875 12.062 9.9271 6.7229 74.999
2nd 27 6.4125 8.802 7.2441 4.9059 54.729
1st 17 4.0375 5.542 4.5611 3.0889 34.459
GF 7 1.6625 2.282 1.8781 1.2719 14.189
Grid A:
W = A1 + A2 + A3 +A4
= 318.02+411.94+411.94+318.02
= 1459.92 kip
V = 𝑍𝐼𝐶
𝑅*w
= 0.15∗1.0∗2.17
5 * 1459.92
= 95.04 kip
Fx = (𝑉−𝐹𝑡)𝑊𝑥ℎ𝑥
⅀𝑊𝑖ℎ𝑖
For GF to 4th floor, Fx = (95.04 −0)∗169.04∗ℎx
67625.8 = 0.238hx
For 5th to 8th floor, Fx = (95.04 −0)∗153.7∗ℎx
67625.8 = 0.216hx

Page | 79
Grid B:
W = B1 + B2 + B3 +B4
= 441.18+570.53+570.53+441.18
= 2023.42 kip
V = 𝑍𝐼𝐶
𝑅*w
= 0.15∗1.0∗2.17
5 * 2023.42
= 131.72 kip
Fx = (𝑉−𝐹𝑡)𝑊𝑥ℎ𝑥
⅀𝑊𝑖ℎ𝑖
For GF to 4th floor, Fx = (131.72−0)∗231.6542∗ℎx
93565.98 = 0.326hx
For 5th to 8th floor, Fx = (131.72−0)∗216.3035∗ℎx
93565.98 = 0.305hx
Grid C:
W = C1 + C2 + C3 +C4
= 359.07+464.80+464.80+359.07
= 1647.74 kip
V = 𝑍𝐼𝐶
𝑅*w
= 0.15∗1.0∗2.17
5 * 1647.74

Page | 80
= 107.27 kip
Fx = (𝑉−𝐹𝑡)𝑊𝑥ℎ𝑥
⅀𝑊𝑖ℎ𝑖
For GF to 4th floor, Fx = (107.27 −0)∗189.9∗ℎx
75909.58 = 0.268hx
For 5th to 8th floor, Fx = (107.27 −0)∗174.54∗ℎx
75909.58 = 0.247hx
Grid D:
W = D1 + D2 + D3 +D4
= 235.92+306.21+306.21+235.92
= 1084.26 kip
V = 𝑍𝐼𝐶
𝑅*w
= 0.15∗1.0∗2.17
5 * 1084.26
= 70.59 kip
Fx = (𝑉−𝐹𝑡)𝑊𝑥ℎ𝑥
⅀𝑊𝑖ℎ𝑖
For GF to 4th floor, Fx = (70.59 −0)∗111.94∗ℎx
49425.62 = 0.1598hx
For 5th to 8th floor, Fx = (70.59 −0)∗127.3∗ℎx
49425.62 = 0.182hx
So, Total Load = (Load from Grid A + Grid B + Grid C + Grid D)*2

Page | 81
CHAPTER 5
3D STRUCTURAL SOFTWARE
ANALYSIS AND RETROFITTING

Page | 82
5.1: General
The design philosophy adopted in the code is to ensure that structure possess minimum
strength to resist minor earthquake, moderate earthquake and major earthquake. Actual
forces on structures during earthquake are much higher than the design forces specified
in the code.
A 9 story RC structure is considered here. The building is mainly a residential
apartment. Since the reinforcement details were not available a design is prepared in
the first step to estimate the reinforcement of the building considering Dead Load and
Live Load only. For concrete design ACI code is followed. In the second step, another
design is prepared in which seismic loads are also applied following Equivalent Static
Force Method. Designing software STAAD Pro is used for designing purpose with full
confidence on it. Supports are fixed. Then checks for beams and columns are done
according to DCR (Demand to Capacity Ratio) concept. Then retrofitting is carried out
for the failed members. Steel Plating Retrofitting Method is applied for beams and
Concrete Jacketing Retrofitting Method for columns. The comparisons between Static
and Dynamic behavior are also shown.

Page | 83
5.2: Geometric Model and Design Parameters
Figure 5.2.1: Plan of Building.
Figure 5.2.2: Side View of Building.

Page | 84
Figure 5.2.3: Whole Building with Member Properties Applied To All the Members
(3-D View).
Member:
There are 450 beams in our structure.
Beams:
Dimension of beam in our structure is 12”*22” and 12”*18”.
Columns:
There are 288 columns in our structure.

Page | 85
Table 5.2.1: Column Dimensions
Dimension
Exterior Interior Corner
G to 4th 20"*20" 23"*23" 17"*17"
5th to 8th 13"*13" 15"*15" 11"*11"
Design Parameters:
Building type: Reinforced concrete frame.
Usage: Residential apartment.
BNBC’93 code is followed.
Grade of concrete, fc=3 ksi.
Type of steel used- Mild Steel implies, fy=50 ksi.
Live load= 30 psf at roof (accessible)
40 psf at all other floors (BNBC’93; Table 6.2.3).
Cover provided = 2.5” for beams.
Cover provided = 2” for columns.
Brick load=0.5 k/ft.
Floor load= 30 psf ( BNBC’93).
Location: Dhaka.
Plan dimension: 120’*50’
Building height: 90 ft.

Page | 86
5.3: Loads
Members are loaded with dead and live load as per BNBC’93 load combinations is
applied.
Load Combinations:
DL
LL
1.4 * DL+ 1.7 * LL
0.75(1.4DL+1.7LL+1.87EQ)
1.4(DL+LL+EQ)
Dead Load:
Includes self-weight of all members + Brick Load + Floor load from slabs
Brick load due to 10 ft high brick wall and 5 inch thick and of 120 lb/ft3 density
= (5/12)*10*120=500 lb/ft udl.

Page | 87
Figure 5.3.1: Dead Load on Building.

Page | 88
Figure 5.3.2: Dead Load on First Floor (Load of Walls on Beam + Self-Wt.).
Figure 5.3.3: Dead Load on First Floor (Floor Finish + Self-Wt.).

Page | 89
Live Load:
30 psf at roof (accessible)
40 psf at all other floors (BNBC’93; Table 6.2.3)
Figure 5.3.4: Live Load on Building.

Page | 90
Figure 5.3.5: Live Load on first Floor.
5.4: Check for Beams
Steps:
The maximum moment induced on beam is obtained from Step- 2.
The capacity of members is calculated from the reinforcement obtained from
Step- 1.
Demand Capacity Ratio= Max. Moment/ Capacity.
If the value of DCR<1 then the members is considered PASS i.e. it can take the
moment induced by seismic loading.
If the value of DCR>1 then the member is considered Fail i.e. it can’t take the
load due to earthquake.

Page | 91
Sample Calculation of Level 01 Beam Check with Seismic:
Beam ID: A12
Beam No: 84 (According to STAAD Pro)
Moment capacity of beam,
M=ΦAsfy(d- 𝑎
2)
= 0.9*1.58*50*(19.5-2.5
2)
= 1297.58 k-inch
Maximum –ve moment: -1297.58 k-in or -108.13 k-ft (Capacity)
Maximum +ve moment: 1297.58 k-in or 108.13 k-ft (Capacity)
Figure 5.4.1: Concrete Design of Beam in STAAD Pro.

Page | 92
Maximum –ve moment: -143.99 k-ft (Demand)
Maximum +ve moment: 58.71 k-ft (Demand)
So, DCR= Demand / Capacity
For +ve moment DCR= 58.71/108.13 = 0.543(DCR<1) [Pass]
For -ve moment DCR= 143.99/108.13 = 1.33(DCR>1) [Fail]
Beam checks for all beams with seismic load and without seismic load are shown in the
following Table 5.4.1 and 5.4.2 respectively.

Page | 93
Table 5.4.1: Level 01 Beam Check with Seismic Loads
Beam
ID
Beam
No
Demand Capacity DCR Result
Max -Ve
Moment
(k-ft)
Max +Ve
Moment
(k-ft)
Max -Ve
Moment
(k-ft)
Max +Ve
Moment
(k-ft)
Max -Ve
Moment
(k-ft)
Max +Ve
Moment
(k-ft)
Max -Ve
Moment
(k-ft)
Max +Ve
Moment
(k-ft)
1AB 81 -118.78 72.35 -120.667 108.5 0.984 0.667 pass pass
1BC 82 -39.56 15.93 -120.667 108.5 0.328 0.147 pass pass
1CD 83 -46.12 19.37 -62.75 62.75 0.735 0.309 pass pass
A12 84 -143.99 58.71 -108.13 108.13 1.33 0.543 fail pass
B12 85 -143.99 68.77 -134.25 108.5 1.073 0.634 fail pass
C12 86 -143.99 67.86 -134.25 108.5 1.073 0.625 fail pass
D12 87 -143.99 58.71 -108.5 108.5 1.327 0.541 fail pass
2AB 88 -162.95 92.26 -192.25 134.25 0.848 0.687 pass pass
2BC 89 -54.19 23.7 -192.25 134.25 0.282 0.177 pass pass
2CD 90 -49.97 26.01 -84.0833 84.08333 0.594 0.309 pass pass
A23 91 -142.7 113.51 -108.5 108.5 1.315 1.046 fail fail
B23 92 -142.7 138.17 -134.25 108.5 1.063 1.273 fail fail
C23 93 -142.7 142.03 -134.25 108.5 1.063 1.309 fail fail
D23 94 -142.7 123.9 -108.5 108.5 1.315 1.142 fail fail
3AB 95 -163.01 92.27 -192.25 134.25 0.848 0.687 pass pass
3BC 96 -163.01 23.73 -192.25 134.25 0.848 0.177 pass pass
3CD 97 -45.73 26.46 -84.0833 84.08333 0.544 0.315 pass pass
A34 98 -143.14 56.46 -108.5 108.5 1.319 0.520 fail pass
B34 99 -143.14 65.91 -134.25 108.5 1.066 0.607 fail pass
C34 100 -143.14 66.62 -134.25 108.5 1.066 0.614 fail pass
D34 101 -147.45 60.55 -108.5 108.5 1.359 0.558 fail pass
4AB 102 -119.06 72.37 -120.667 108.5 0.987 0.667 pass pass
4BC 103 -40.07 15.56 -120.667 108.5 0.332 0.143 pass pass
4CD 104 -34.38 19.42 -62.75 62.75 0.548 0.309 pass pass

Page | 94
Table 5.4.2: Level 01 Beam Check without Seismic Loads
Beam
ID
Beam
No
Demand Capacity DCR Result
Max -Ve
Moment
(k-ft)
Max +Ve
Moment
(k-ft)
Max -Ve
Moment
(k-ft)
Max +Ve
Moment
(k-ft)
Max -Ve
Moment
(k-ft)
Max +Ve
Moment
(k-ft)
Max -Ve
Moment
(k-ft)
Max +Ve
Moment
(k-ft)
1AB 81 -119.91 73.66 -120.667 108.5 0.994 0.679 pass pass
1BC 82 -40.21 15.24 -120.667 108.5 0.333 0.140 pass pass
1CD 83 -34.52 21.19 -62.75 62.75 0.550 0.338 pass pass
A12 84 -68.33 44.24 -108.5 108.5 0.631 0.409 pass pass
B12 85 -99.42 62.11 -134.25 108.5 0.741 0.572 pass pass
C12 86 -96.83 59.92 -134.25 108.5 0.721 0.552 pass pass
D12 87 -68.33 44.24 -108.5 108.5 0.630 0.408 pass pass
2AB 88 -151.51 -159.2 -192.25 134.25 0.788 -1.186 pass pass
2BC 89 -54.62 23.26 -192.25 134.25 0.284 0.173 pass pass
2CD 90 -47.68 27.14 -84.0833 84.08333 0.567 0.323 pass pass
A23 91 -17.36 0.45 -108.5 108.5 0.160 0.004 pass pass
B23 92 -20.49 3.48 -134.25 108.5 0.153 0.032 pass pass
C23 93 -20.66 3.59 -134.25 108.5 0.154 0.033 pass pass
D23 94 -19.89 24.98 -108.5 108.5 0.183 0.230 pass pass
3AB 95 -159.25 93.28 -192.25 134.25 0.828 0.695 pass pass
3BC 96 -54.58 23.34 -192.25 134.25 0.284 0.174 pass pass
3CD 97 -48.75 27.98 -84.0833 84.08333 0.580 0.333 pass pass
A34 98 -68.23 44.23 -108.5 108.5 0.629 0.408 pass pass
B34 99 -99.58 62.11 -134.25 108.5 0.742 0.572 pass pass
C34 100 -97.02 59.88 -134.25 108.5 0.723 0.552 pass pass
D34 101 -65.63 41.86 -108.5 108.5 0.605 0.386 pass pass
4AB 102 -107.53 73.68 -120.667 108.5 0.891 0.679 pass pass
4BC 103 -40.68 15.5 -120.667 108.5 0.337 0.143 pass pass
4CD 104 -33.34 21.28 -62.75 62.75 0.531 0.339 pass pass

Page | 95
Figure 5.4.2: Beam of First Floor Eligible for Steel Plating.
5.5: Check for Columns
Steps:
The maximum axial load induced on beam is obtained from Step- 2.
The capacity of members is calculated from the reinforcement obtained from
Step- 1.
Demand capacity Ratio= Maximum load/ Axial capacity.
If the value of DCR<1 then the members is considered PASS i.e. it can take the
load induced by seismic loading.
If the value of DCR>1 then the member is considered Fail i.e. it can’t take the
load due to earthquake.

Page | 96
Sample Calculation of Level 01 Interior Column Check with Seismic:
Column ID: B3
Column No: 74 (According to STAAD Pro)
Table 5.5.1: Parameters for Column Check
Width, W(in) 23 C. cover, cc (in) 2
Height, H(in) 23 Total layer, NL 4
Agross, Ag(in²) 529 Steel area, As(in²) 14.72622
Bar dia, db(in) 1.25 Steel ratio, p(%) 2.784
Factor, ρh 0.7 Alpha = 0.8
Nominal Axial load capacity, Pn = As*fy + 0.85 fc’ * (Ag – As)
= 14.72622*50 + 0.85*3*(529-14.72622)
= 2047.71 kip
Ult. Axial Strength, Pult = 0.8*0.7*Pn= 0.8*0.7*2047.71= 1146.72 kip
Maximum Load: 1146.72 kip (Capacity)

Page | 97
Figure 5.5.1: Concrete Design of Column in STAAD Pro.
Maximum Load: 1260.51 kip (Demand)
So, DCR= Demand / Capacity
= 1260.51/1146.72
= 1.09923(DCR>1) [Fail]
Column checks for all levels are shown in the following Table 5.5.2. Check is done for
one exterior, one interior and one corner column for each level.

Page | 98
Table 5.5.2: Column Check
Exterior Column A2 Check
Level Demand(k) Capacity(k) DCR Result
9 78.46 335.25 0.23403 pass
8 166.597 335.25 0.49693 pass
7 254.348 335.25 0.75868 pass
6 341.79 335.25 1.01951 fail
5 432.084 821.64 0.52588 pass
4 522.532 821.64 0.63596 pass
3 612.921 821.64 0.74597 pass
2 703.343 821.64 0.85602 pass
1 793.79 821.64 0.96611 pass

Page | 99
Interior Column B3 Check
Level Demand(k) Capacity(k) DCR Result
9 122.31 532.6 0.22964 pass
8 243.87 532.6 0.45789 pass
7 366.927 532.6 0.68894 pass
6 491.46 532.6 0.92276 pass
5 635.046 1146.72 0.55379 pass
4 784.9 1146.72 0.68447 pass
3 939.469 1146.72 0.81927 pass
2 1098.346 1146.72 0.95782 pass
1 1260.51 1146.72 1.09923 fail
Corner Column A1 Check
Level Demand(k) Capacity(k) DCR Result
9 55.38 236.7 0.23398 pass
8 120.081 236.7 0.50731 pass
7 184.326 236.7 0.77873 pass
6 248.181 236.7 1.0485 fail
5 314.978 579.65 0.54339 pass
4 382.237 579.65 0.65943 pass
3 449.209 579.65 0.77497 pass
2 516.065 579.65 0.8903 pass
1 582.65 579.65 1.00518 fail

Page | 100
Exterior Column A2 Interior Column B3 Corner Column A1
Figure 5.5.2: Column Eligible for Concrete Jacketing.
5.6: Retrofitting
5.6.1: Retrofitting of Beam by Steel Plating
Beam ID: D34 (Level 01)
Size: 12″×18″
Original Capacity = 108.5 k-ft
Target Capacity = 147.45 k-ft

Page | 101
Steel plate of thickness 1.5 mm i.e. 0.06 inch is added to both tension and compression
face.
So, Depth of steel plate, dp= 0.06 inch
Effective depth of beam, d = Depth of beam – Depth of cover, dc
= (18-2.5) inch
= 15.5 inch
Stress in steel plate in compression and tension, fpc= fpt= 50 ksi
Providing width of steel plate, b = Width of beam – 2(2 inch side cover)
= 12 – 2(2)
= 8 inch
We know,
Strength added by steel plating = compression side + tension side
Compression side = fpc× Apc (𝑑𝑝
2 +d)
Tension side = fpt× Apt (𝑑𝑝
2 + dc)
So, Strength added by steel plating
= [fpc× Apc (𝑑𝑝
2 +d)] + [fpt× Apt (
𝑑𝑝
2 + dc)]
= [50 × (2×0.06×8) × (0.06
2+15.5)] + [50 × (2×0.06×8) × (
0.06
2+2.5)]
=866.88 k-in =72.24 k-ft
Page | 102
So, Capacity after steel plating = Original capacity + 72.24 k-ft
= (108.5+72.24) k-ft
= 180.74k-ft>Target capacity (147.45k-ft)
So, OK
5.6.2: Retrofitting Of Column by Concrete Jacketing
Exterior Column:
Column ID: A2
Level: 06
Size: 13″×13″
Extra gross area for jacketing, Ag= (212 - 132) inch2 = 272 inch2
Capacity increased by concrete jacketing,
Pu= 0.8Φ [0.85fc' (Ag – Ast) + fyAst]
= 0.8×0.7 [0.85×3 (272 – 1.5
100 272) + 50×
1.5
100 272]
= 496.83 kip
Total capacity increased by concrete jacketing
= Original capacity + 496.83 kip
= (335.25 + 496.83) kip

Page | 103
=832.08 kip > Demand (341.79 kip) OK.
Required reinforcement for concrete jacketing,
Ast(required)=1.5
100 272=4.08 inch2
Use 8#7, Ast(provided) = 4.8 inch2> 4.08 inch2 OK.
Figure 5.6.1: Concrete Jacketing of Exterior Column A2.
Interior Column:
Column ID: B3
Level: 01
Size: 23″×23″
Extra gross area for jacketing, Ag= (312 - 232) inch2 = 432 inch2
Capacity increased by concrete jacketing,

Page | 104
Pu= 0.8Φ [0.85fc' (Ag – Ast) + fyAst]
= 0.8×0.7 [0.85×3 (432 – 1.5
100 432) + 50×
1.5
100 432]
= 789.08 kip
Total capacity increased by concrete jacketing
= Original capacity + 789.08 kip
= (1146.72 + 789.08) kip
=1935.80 kip > Demand (1260.51 kip) OK.
Required reinforcement for concrete jacketing,
Ast(required)=1.5
100 432=6.48 inch2
Use 12#7, Ast(provided) = 7.2 inch2> 6.48 inch2 OK.
Figure 5.6.2: Concrete Jacketing of Interior Column B3.

Page | 105
Corner Column:
Column ID: A1
Level: 01
Size: 17″×17″
Extra gross area for jacketing, Ag= (252 - 172) inch2 = 336 inch2
Capacity increased by concrete jacketing,
Pu= 0.8Φ [0.85fc' (Ag – Ast) + fyAst]
= 0.8×0.7 [0.85×3 (336 – 1.5
100 336) + 50×
1.5
100 336]
= 613.73 kip
Total capacity increased by concrete jacketing,
= Original capacity + 613.73 kip
= (579.65 + 613.73) kip
=1193.38 kip > Demand (582.65 kip) OK.
Required reinforcement for concrete jacketing,
Ast(required)=1.5
100 336=5.04 inch2
Use 12#6, Ast(provided) = 5.28 inch2> 5.04 inch2 OK.

Page | 106
Figure 5.6.3: Concrete Jacketing of Corner Column A1.
Corner Column:
Column ID: A1
Level: 06
Size: 11″×11″
Extra gross area for jacketing, Ag= (192 - 112) inch2 = 240 inch2
Capacity increased by concrete jacketing,
Pu= 0.8Φ [0.85fc' (Ag – Ast) + fyAst]

Page | 107
= 0.8×0.7 [0.85×3 (240 – 1.5
100 240) + 50×
1.5
100 240]
= 438.38 kip
Total capacity increased by concrete jacketing,
= Original capacity + 438.38 kip
= (236.7 + 438.38) kip
=675.08 kip > Demand (248.181 kip) OK.
Required reinforcement for concrete jacketing,
Ast(required)=1.5
100 240=3.6 inch2
Use 12#5, Ast(provided) = 3.72 inch2> 3.6 inch2 OK.
Figure 5.6.4: Concrete Jacketing of Corner Column A1.

Page | 108
The detailed calculations of Concrete Jacketing as well as Capacity Check are shown in the following Table 5.6.
Table 5.6: Concrete Jacketing
Position
of
Column
Level Width(in) Height(in) Area(in²)
Total Area
after
Jacketing(in²)
Extra
Gross
Area
(in²)
Capacity
Increased(k)
Original
Capacity(k)
Total
Capacity
Increased(k)
Demand(k) Check
Exterior 6 13 13 169 441 272 496.83 335.25 832.08 341.79 OK
Interior 1 23 23 529 961 432 789.083 1146.7 1935.8 1260.5 OK
Corner 1 17 17 289 625 336 613.731 579.65 1193.38 582.65 OK
Corner 6 11 11 121 361 240 438.379 236.7 675.079 248.18 OK
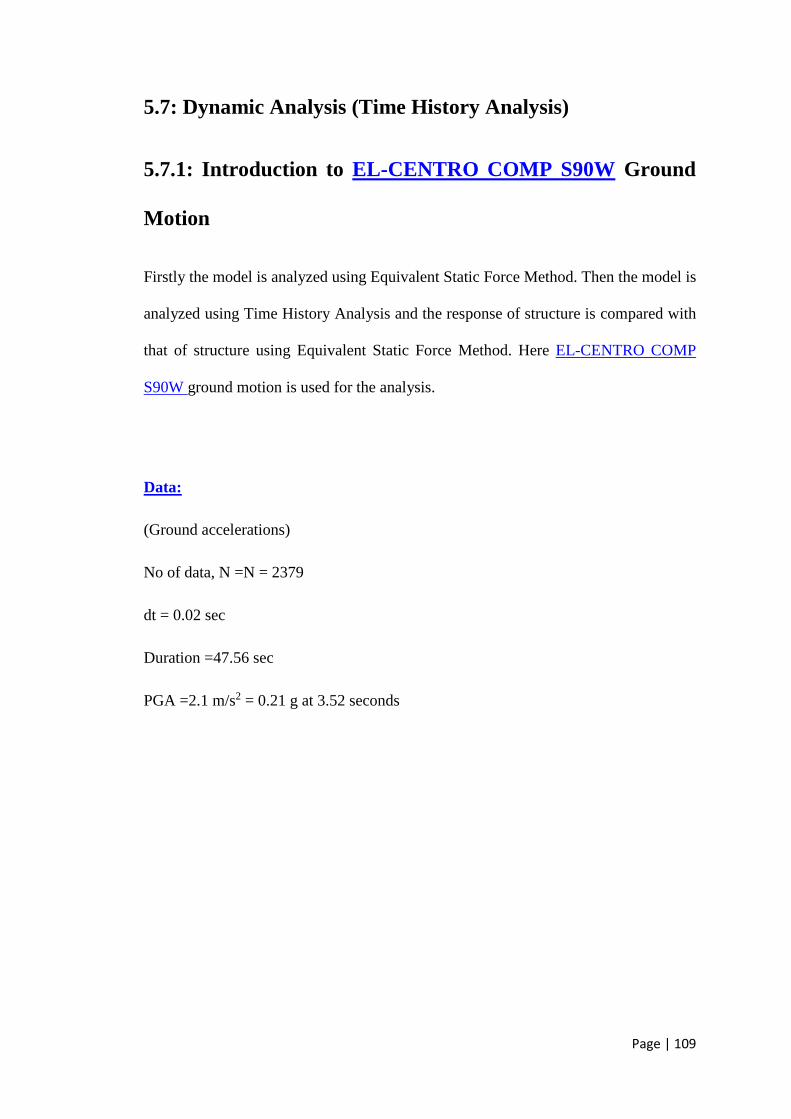
Page | 109
5.7: Dynamic Analysis (Time History Analysis)
5.7.1: Introduction to EL-CENTRO COMP S90W Ground
Motion
Firstly the model is analyzed using Equivalent Static Force Method. Then the model is
analyzed using Time History Analysis and the response of structure is compared with
that of structure using Equivalent Static Force Method. Here EL-CENTRO COMP
S90W ground motion is used for the analysis.
Data:
(Ground accelerations)
No of data, N =N = 2379
dt = 0.02 sec
Duration =47.56 sec
PGA =2.1 m/s2 = 0.21 g at 3.52 seconds

Page | 110
Figure 5.7.1: EL-CENTRO COMP S90W Ground Motion with PGA Scaled To 0.21g and Duration Equal to 47.56 Seconds.

5.7.2: Structural Models and Their Top Floor Time History
Displacement
Figure 5.7.2: Time History Displacement of the Highlighted Node of Structure.
The above figure shows the time history displacement of the topmost node of the
structure. Similarly time history displacements obtained for other floors in the structure
and the maximum displacement is plotted in the graph. The graphs of structure using
Time History Analysis are compared with that of structure analyzed using Equivalent
Static Force Method.

5.7.3: Comparison of Displacements of Different Floors of
Structure between Dynamic and Static Earthquake Analysis
Table 5.7.1: Comparison of Displacements of Different Floors of Structure between
Dynamic and Static Earthquake Analysis
Level
Displacement(in)
Dynamic Static
9 5.682 3.226
8 5.198 3.047
7 4.491 2.757
6 3.701 2.369
5 2.937 1.897
4 2.425 1.571
3 1.876 1.215
2 1.312 0.838
1 0.731 0.458
Base 0.178 0.12

Figure 5.7.3: Comparison of Displacements along Z-Direction between Dynamic and
Static Earthquake Analysis.
Here in case of top floor level Dynamic Analysis displacement is much greater than
that of Static Analysis. For higher story, displacement will be more for Dynamic
Analysis. So in case of high rise building Time History Analysis should be used to
check the displacement within the limit.
1
2
3
4
5
6
7
8
9
10
0 1 2 3 4 5 6
Flo
or
Leve
l
Displacement(in)
dynamic
static

5.7.4: Comparison of Story Drifts of Different Floors of
Structure between Dynamic and Static Earthquake Analysis
Table 5.7.2: Comparison of Story Drifts of Different Floors of Structure between
Dynamic and Static Earthquake Analysis
Story Drift
Level Dynamic Static
9 0.484 0.179
8 0.707 0.29
7 0.79 0.388
6 0.764 0.472
5 0.512 0.326
4 0.549 0.356
3 0.564 0.377
2 0.581 0.38
1 0.553 0.338

Figure 5.7.4: Comparison of Story Drift along Z-Direction between Dynamic and
Static Earthquake Analysis.
Story Drift is the drift of one level of a multistory building relative to the level below.
The greater the drift, the greater the likelihood of damage. According to BNBC
allowable Story Drift at zone 2 is 0.025hsx. hsx is the story height below level x. Here
Story Drift for Static Analysis at top story is 0.179 inch and for Dynamic Analysis it is
0.484 inch. Allowable Story Drift for Static Analysis is 0.25inch which is greater than
0.484 inch in case of Dynamic Analysis. So again it can be said that in case of high rise
building Dynamic Time History Analysis should be performed.
1
2
3
4
5
6
7
8
9
10
0 0.2 0.4 0.6 0.8 1
Flo
or
Leve
l
Story Drift(in)
dynamic
static

5.7.5: Comparison of Story Moment of Different Floors of
Structure between Dynamic and Static Earthquake Analysis
Table 5.7.3: Comparison of Story Moment of Different Floors of Structure between
Dynamic and Static Earthquake Analysis
Story Moment (kip-ft)
Level Dynamic Static
9 76.37 62.43
8 115.97 68.99
7 142.3 83.41
6 154.25 92.98
5 124.9 110.76
4 137.69 112.88
3 136.8 117.14
2 139.2 121.86
1 155.38 115.76

Figure 5.7.5: Comparison of Story Moment along Z-Direction between Dynamic and
Static Earthquake Analysis (A4 column).
From the figure it is seen that moment due to Dynamic Analysis is greater than the
Static Analysis. Here at level 06 there is a huge jump of moment due to Dynamic Time
History Analysis. Member fails in maximum reinforcement. So member size should be
increased. Similarly other columns are also analyzed and it is found that member exceed
its maximum reinforcement limit.
1
2
3
4
5
6
7
8
9
10
0 50 100 150 200
Flo
or
Leve
l
Moment(k-ft)
dynamic
static

CHAPTER 6
CONCLUSION AND
RECOMMENDATION

In this research study seismic evaluation and retrofitting are done for a typical existing
building in Dhaka city which was constructed before 1990. As the reinforcement details
of the building were not available, firstly the design of the building is carried out for
Dead Load and Live Load only without the consideration of seismic or wind load.
Secondly the building is analyzed considering Seismic Load in addition to Dead Load
and Live Load. Equivalent Static Force Method is used according to BNBC 1993 for
applying Earthquake Load. Design software STAAD-Pro is used for 3D analysis. Then
Demand Capacity Ratio (DCR) is calculated to evaluate the members for Seismic
Loads. Retrofitting procedure is done for the members that are failed under Seismic
Loads. Finally the comparisons between Dynamic and Static behavior are also shown.
Based on the seismic evaluation carried out in this study, the following important
conclusions can be made-
All of the beams and columns in one unit were checked for vulnerability due to
seismic loads. In total, there are 216 beams in the building in one unit. Among
them 64 beams are failed after applying earthquake force. It means 29.63%
beams are failed.
On the other hand there are 144 columns in the building in one unit. Among
them 21 columns are failed after applying earthquake force. It means 14.58%
columns are failed.
Maximum DCR for beams is found to be 1.373 at Level 02 which is 37.3%
greater than the capacity. Similarly maximum DCR for column is found 1.09923
at Level 01 which is 9.923% greater than the capacity.

For providing retrofitting measures of the deficient members Steel Plating
Method is applied for the beams and Concrete Jacketing Method is applied for
the columns.
In case of retrofitting of beam by Steel Plating it is found that the capacity
achieved by retrofitting method is 180.74 k-ft which is more than the target
capacity of 147.45 k-ft. The capacity increase is 22.58%.
On the other hand, in case of retrofitting of interior column by Concrete
Jacketing, the capacity achieved by retrofitting method is 1935.80 kip which is
more than the demand 1260.51 kip. The capacity increase is 53.57%.
Finally based on this research study, it is recommended that the buildings which were
not built with seismic consideration can be evaluated and retrofitted following the thesis
procedure presented in this study.
`

CHAPTER 7
REFERENCES

1. Design Of Concrete Structures
Thirteen Edition
Written by Arthur H. Nilson, David Darwin and Charles W. Dolan.
2. BNBC (Bangladesh National Building Code) 1993.
3. http://Theconstructor.Org/Structural-Engg/Strengthening-Of-R-C-
Beams/1930/
4. http://news.nationalgeographic.com/news/2013/13/130425-bangladesh-dhaka-
building-collapse-world/
5. Seismic Evaluation Of Institute Building NIT Rourkela,
Ankur Agrawal
Department Of Civil Engineering
National Institute Of Technology (09th May 2012).
6. Earthquake Resistant Design Of Structures
Pankaj Agarwal, Manish Shrikhande
PHI Learning Private Limited, 2011.
7. Seismic Evaluation And Retrofitting Of Buildings And Structures
N. Lakshmanan
ISET Journal of Earthquake Technology,
Paper No. 469, 31-48, March-June 2006.

8. Seismic Evaluation And Retrofit Of Reinforced Concrete Buildings
Applied Technology Council (1996)
Report ATC 40 / SSC 96–01, Palo Alto.
9. Structural Analysis, Modeling, And Design Of A Reinforced Concrete Afghan
School Under Severe Earthquake Motions
Mohammad Zekria
Master Of Science In Civil Engineering
San Diego State University, 2011.
10. Seismic Evaluation Of Existing Reinforced Concrete Building
Dinesh J.Sabu, Dr. P.S. Pajgade (June-2012).
11. Seismic Evaluation And Strengthening Of Existing Buildings
Durgesh C. Rai
IITK-GSDMA –EQ24-V2.0.
12. Standard Methods For Seismic Analyses
Joao Luis Domingues Costa
Report BYG.DTU R-064, 2003.
13. Seismic Design Of Building Structures(9th edition)
Lindeburge, M. R., and K. M. Mcmullin
A Professional’s Introduction to Earthquake Forces and Design Details
Saddle River, New Jersey: Professional Publications, 2008.

14. A National Policy For Seismic Vulnerability Assessment Of Buildings And
Procedure For Rapid Visual Screening Of Buildings For Potential Seismic
Vulnerability
Prof. Ravi Sinha And Prof. Alok Goyal
Department Of Civil Engineering, Indian Institute Of Technology Bombay,
2011.
15. Design Of Earth-Quake Resistant
Multi-Storied Rcc Building On A Sloping Ground
Saptadip Sarkar
Department Of Civil Engg.
National Institute Of Technology, Rourkela (2010)
16. A Major Project Report On Effect Of Configuration Of R.C.C. Building
Subjected To Seismic Loading
Abhishek Kumar Gupta
M. E. (Structural Engineering)
Department Of Civil &Environment Engineering
Delhi College Of Engineering (Now Known As Delhi Technological University
(2011)

17. Seismic Evaluation And Retrofit Of A Rc Frame Structure
Praval Priyaranjan
B.Tech
Department Of Civil Engineering
N.I.T Rourkela (May, 2012)
……….The End..........