SIM POH CHING A thesis submitted in fulfillment ofthe requirements ...

Redesign and Shock Analysis of HALIFAX Class Frigate Gas Turbine Uptake Structure
by
Simon A. Summers
B.Eng. Mechanical Engineering Royal Military College of Canada, 2003
SUBMITTED TO THE DEPARTMENT OF MECHANICAL ENGINEERING IN PARTIAL
FULFILLMENT OF THE REQUIREMENTS FOR THE DEGREES OF
MASTER OF SCIENCE IN NAVAL ARCHITECTURE AND MARINE ENGINEERING
AND
MASTER OF SCIENCE IN MECHANICAL ENGINEERING
AT THE MASSACHUSETTS INSTITUTE OF TECHNOLOGY
June 2008
© 2008 Her Majesty the Queen in Right of Canada. All Rights Reserved.
MIT is hereby granted permission to reproduce and to distribute publicly paper and electronic
copies of this thesis document in whole or in part in any medium now known or hereafter created.
Signature of Author: __________________________________________________________ Department of Mechanical Engineering
May 12, 2008
Certified by: _________________________________________________________________ Tomasz Wierzbicki
Professor of Applied Mechanics Thesis Supervisor
Accepted by: __________________________________________________________________
Lallit Anand Professor
Chairman, Committee on Graduate Students


3
Redesign and Shock Analysis of HALIFAX Class Frigate Gas Turbine Uptake Structure
by
Simon A. Summers
Submitted to the Department of Mechanical Engineering on May 12, 2008 in Partial Fulfillment of the
Requirements for the Degrees of Master of Science in Naval Architecture and Marine Engineering and Master of Science in Mechanical Engineering
ABSTRACT
The gas turbine exhaust uptakes in the HALIFAX class frigates of the Canadian Navy have experienced thermally-induced fatigue cracking since soon after the commissioning of these ships. The uptake structure is heavily stiffened in order to meet shock resistance requirements. Unfortunately, the result has been that thermal expansion of the uptake shell is constrained, thus every flash-up and shut-down of a gas turbine results in a fatigue cycle of its uptake with extremely high stresses. Among the methods proposed to address the problem is the structural redesign of the uptakes within the constraints of the original mounting arrangements. Any such redesign would be required to reduce thermal stresses while still meeting the shock resistance requirements. This work presents the redesign of the uptakes such that they continue to meet shock requirements while incorporating design aspects, developed in the literature, which are anticipated to reduce thermal stresses. The original intention was to use the modal-based design response spectrum method to assess shock resistance. However, due to excessive stresses in the original model and in all subsequent modifications using this method, the less-rigorous base acceleration method was primarily used. Thesis Supervisor: Tomasz Wierzbicki Title: Professor of Applied Mechanics


5
CONTENTS
Abstract ........................................................................................................................................... 3 Contents .......................................................................................................................................... 5 List of Tables .................................................................................................................................. 7 List of Figures ................................................................................................................................. 7 Acknowledgements ......................................................................................................................... 9 1. Introduction ............................................................................................................................... 11 2. Background ............................................................................................................................... 13 3. Prior Work ................................................................................................................................ 14
3.1 HALIFAX Class Frigates .................................................................................................... 14 3.2 Oliver Hazard Perry Class Frigates ..................................................................................... 15 3.3 Other Ships .......................................................................................................................... 16
4. Objectives ................................................................................................................................. 18 4.1 Design Iteration ................................................................................................................... 18
5. Design Analysis Methods ......................................................................................................... 20 5.1 Design Response Spectrum Analysis .................................................................................. 20
5.1.1 Design Spectra .............................................................................................................. 21 5.1.2 Mode Shapes and Frequencies ..................................................................................... 22 5.1.3 Application ................................................................................................................... 24 5.1.4 Damping ....................................................................................................................... 25
5.2 Base Acceleration Method .................................................................................................. 25 5.3 Time-History Analysis ........................................................................................................ 25
6. Models....................................................................................................................................... 27 6.1 General Model Definition ................................................................................................... 27
6.1.1 Boundary Conditions .................................................................................................... 27 6.1.2 Material Definition ....................................................................................................... 28 6.1.3 Insulation ...................................................................................................................... 30 6.1.4 Damping ....................................................................................................................... 31
6.2 Analysis Methods Definition .............................................................................................. 32 6.2.1 Design Spectra .............................................................................................................. 32 6.2.2 Base Acceleration ......................................................................................................... 34 6.2.3 Time-History Analysis ................................................................................................. 36
7. Evaluation ................................................................................................................................. 38

6
7.1 Design Criterion .................................................................................................................. 38 7.2 Design Spectrum Results .................................................................................................... 38 7.3 Base Acceleration Results ................................................................................................... 47
7.3.1 Design Iteration ............................................................................................................ 48 7.3.2 Buckling Predictions..................................................................................................... 52
7.4 Time-History Results .......................................................................................................... 56 7.5 Final Design ........................................................................................................................ 57
8. Future Work .............................................................................................................................. 60 9. Conclusion ................................................................................................................................ 61 References ..................................................................................................................................... 62 Appendix A: DNV Cylinder Buckling Criteria ............................................................................ 64
7
LIST OF TABLES
Table 6.1. Steel Properties ........................................................................................................... 30 Table 6.2. Non-Structural Mass Representation of Insulation Components ............................... 31 Table 7.1. Original Model, DRS Method, X-Direction Dominant Shock Modes ....................... 44 Table 7.2. Original Model, DRS Method, Y-Direction Dominant Shock Modes ....................... 45 Table 7.3. Original Model, DRS Method, Z-Direction Dominant Shock Modes ........................ 45 Table 7.4. Final Design Stress Results Comparison .................................................................... 58
LIST OF FIGURES
Figure 1.1. Uptake Description .................................................................................................... 12 Figure 6.1. Uptake Boundary Conditions .................................................................................... 28 Figure 6.2. Stress-Strain Curve, AISI 316L Stainless Steel, 500°C ............................................ 30 Figure 6.3. Standard Grade 1 Vertical Shock Design Spectrum (from (3)) ................................ 33 Figure 6.4. Base Acceleration Curves, Grade 1 Equipment Located Below the Waterline ........ 35 Figure 6.5. Displacement and Acceleration Time-History .......................................................... 36 Figure 6.6. Pseudo-Acceleration Design and Response Spectra ................................................. 37 Figure 7.1. DRS Method, Original Model ................................................................................... 40 Figure 7.2. DRS Method, Minimum Model ................................................................................ 41 Figure 7.3. DRS Method, Final Model ........................................................................................ 41 Figure 7.4. DRS Method, Stresses Mapped to Plastic Curve ...................................................... 42 Figure 7.5. Original Model, DRS Method, Modal Deformations ................................................ 42 Figure 7.6. Original Model, DRS Method, Ranked Modal Deformations .................................. 43 Figure 7.7. Original Model, DRS Method, Modal Deformations Ranked by Direction ............. 43 Figure 7.8. Original Model, DRS Method, X-Direction Shock Dominant Mode Shapes ........... 46 Figure 7.9. Original Model, DRS Method, Y-Direction Shock Dominant Mode Shapes ........... 46 Figure 7.10. Original Model, DRS Method, Z-Direction Shock Dominant Mode Shapes .......... 47 Figure 7.11. Uptake Design Modification Tree ........................................................................... 49 Figure 7.12. Detached Main Stiffener Modifications .................................................................. 51 Figure 7.13. Critical Buckling Elements ...................................................................................... 53 Figure 7.14. Buckling Critical Stress Ratios, Model 1 ................................................................ 54 Figure 7.15. Buckling Critical Stress Ratios, Model 1.1.1.1 ....................................................... 54 Figure 7.16. Buckling Critical Stress Ratios, Model 1.1.1.2.1 .................................................... 54 Figure 7.17. Buckling Critical Stress Ratios, Model 1.2.1.1 ....................................................... 55 Figure 7.18. Buckling Critical Stress Ratios, Model 1.2.1.2 ....................................................... 55 Figure 7.19. Buckling Critical Stress Ratios, Model 1.3.1 .......................................................... 55 Figure 7.20. Original Model, Time-History Analysis .................................................................. 56 Figure 7.21. Final Design, Time-History Analysis ...................................................................... 57 Figure 7.22. Final Design Description ......................................................................................... 58


9
ACKNOWLEDGEMENTS
I give my deepest thanks to my loving wife Shannon, without whose constant support,
understanding, and sacrifice of so much this work would not have been possible. Also, thanks to Professor Tomasz Wierzbicki, to LCdr Ken Hill, and to Laurie Balan at Fleetway, Inc.


11
1. INTRODUCTION
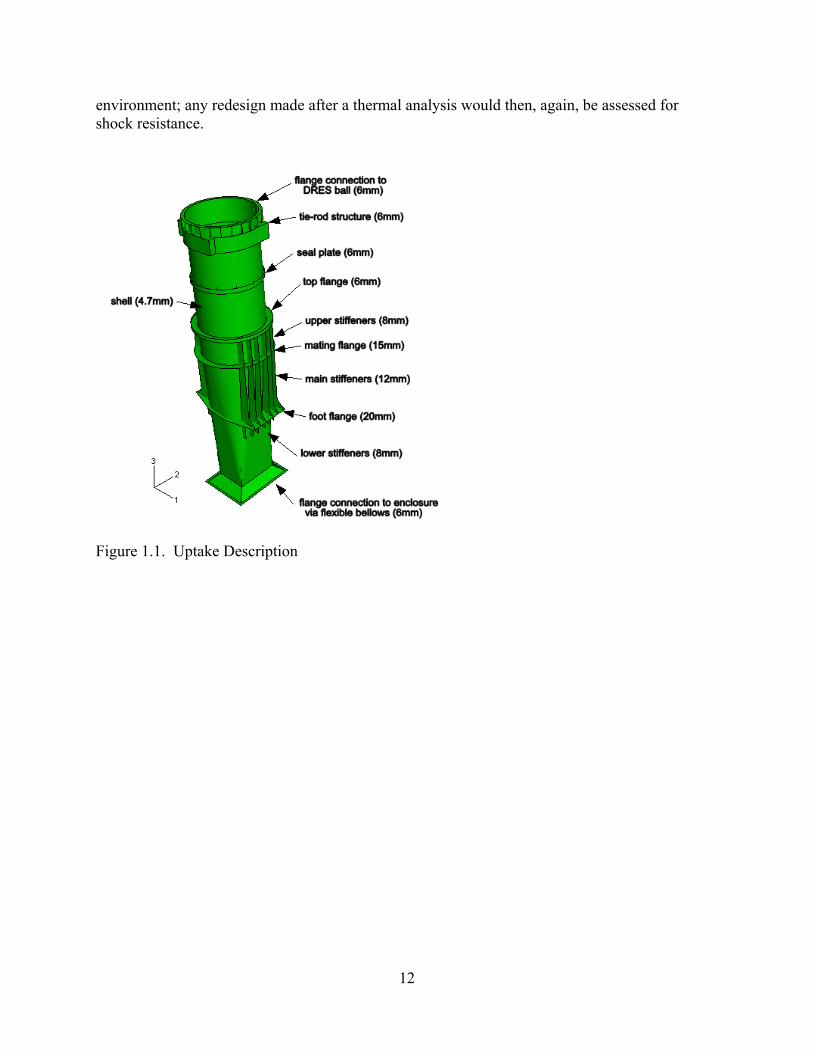
The HALIFAX class frigates of the Canadian Navy are driven by three propulsion engines: one Pielstick V-20 diesel cruise engine and two General Electric (GE) LM2500 gas turbine main engines. The exhaust gases of the gas turbines exit the ship through the gas turbine uptakes, which each take gases from their respective engine enclosure to the atmosphere. The main structure of the uptake is approximately a vertical cylinder 10 meters tall and 2 meters wide, with an air eductor, called the DRES Ball, approximately 2 meters in height securely bolted to the top of the uptake [1,2]. The original uptake with the component thicknesses is shown in Figure 1.1. The gas turbine uptakes have experienced cracking due to thermally-induced, low-frequency, high-amplitude fatigue stress. The original design was built to withstand the severe shocks that might be experienced in combat situations, and thus included the considerable stiffening structure shown in the figure. However, this structure contributed directly to constraining the thermal expansion of the shell. Because the interior of the shell is washed directly with hot exhaust gases while the exterior structure is in a near-ambient atmosphere, large thermal gradients are established every time a gas turbine is flashed up or shut down. The result has been cracking, first along the vertical welds of the main stiffeners, then later between the stiffeners along the circumferential flanges.
There are a number of significant effects of the uptake cracking:
a) The strength of the structure is considerably reduced. Though the result is not its immediate failure, the shock resistance is reduced, possibly to the extent that the structure would fail in a typical shock event;
b) It has been shown that exhaust gases have been escaping into the main engine room and the other spaces that surround the uptakes. This poses a health hazard to personnel working in these spaces, particularly because this exhaust gas is untreated; and
c) Thermal cracking has been repaired as it has occurred and been discovered. These repairs have been very expensive, consume shipyard resources that would otherwise be expended on other repairs, and require time alongside that could otherwise be better devoted towards operational or other requirements.
It is therefore considered very important that a viable solution to this problem be developed. There are two main sets of criteria to which any solution must conform. The first is that the cracking due to thermal fatigue stress should be eliminated or reduced to an acceptable level. The second is that the solution must conform to the naval shock specifications. A final design may require some iteration between solutions meeting each set of requirements in order to converge on an acceptable design.
The work presented here has been to develop a design that is deemed to explicitly meet the shock requirements, while incorporating design features that are anticipated to result in a reduction in thermally-induced stresses. This is a starting point for the structural redesign of the uptake structure. Further work would be required to check the final model in a thermal
12
environment; any redesign made after a thermal analysis would then, again, be assessed for shock resistance.
Figure 1.1. Uptake Description

13
2. BACKGROUND
In order to ensure survivability in the event of an explosion in the vicinity of a warship, the design of onboard systems and components must conform to shock requirements. In the Canadian Navy, these are dictated by Canadian Forces Technical Order (CFTO) D-03-003-007/SF-000 Issue 4: Specification for Design and Test Criteria for Shock Resistant Equipment in Naval Ships [3]. This specification describes a number of methods that can be used in shock design: physical testing, base acceleration method using static body loads, time-history dynamic analysis, or design response spectrum (DRS) analysis. The latter is cited as the preferred method, as it should normally result in a design that is both lighter and more likely to pass a physical shock test than components designed using the other methods [3].
The original uptake design employs considerable stiffening in order to ensure that the shock requirements are met, which appears to be the result of applying the base acceleration method using the values of acceleration given in the design drawings [2]. The use of this method was likely driven by the limited computational power available for finite element analysis (FEA) at the time the uptakes were designed, which is required to implement the DRS method for complex structures such as these.
The consequence of the highly stiffened structure has been the appearance of thermal cracking, beginning only a few years after the first ships of this class were commissioned. The shell of the uptake has a thickness of 4.7 mm, while the thickness of the supporting structure, welded directly to the shell, ranges from 8 mm to 20 mm thick [4]. The interior of the uptake is washed directly with exhaust gases, and reaches temperatures of approximately 500°C, while the ambient temperature surrounding the uptake is near room temperature [4,5,6]. Thus, considerable thermal gradients are established when the gas turbine is running. This problem is exacerbated by the fact that insulation is mounted on the exterior of the uptake, with thickness from 100 mm to 200 mm [7], primarily in order to achieve the required level of sound attenuation. This prevents the dissipation of heat from the shell, resulting in higher temperatures than if little or no insulation was used.
The thermal cracking appears in two general areas: at the horizontal connections of
circumferential flanges welded to the shell, and at the vertical connections of vertical stiffeners welded to the shell and to the circumferential flanges. In both cases, it has been surmised that the mechanism is high-amplitude, low-frequency, thermally-induced fatigue stress. This is caused by the thermal expansion of the shell, which attempts to expand to a greater extent than the considerably cooler supporting structure. Where these are welded together, the shell deflects outwards, creating large bending stresses at the weld toes. On cooling, the reverse of this process occurs, creating bending stresses opposite to the original stresses. This therefore causes cyclic loading of the uptake, with a cycle occurring every time the gas turbine is flashed up and shut down [4].

14
3. PRIOR WORK
3.1 HALIFAX CLASS FRIGATES
The uptake thermal cracking problem was first addressed in 1995. The recommendations from the initial analyses were that either the constraints on the uptakes should be reduced, or else the uptakes should be insulated internally; this would require insulation at least 1.5 inch thick between the original shell and a sheet metal liner fitted in each uptake. The former recommendation was rejected due to the considerable design work and physical alterations that would be required to reduce the constraints on the uptake; this would likely have required a completely new mounting arrangement. Instead, a variation of the second recommendation was implemented in which liners with insulation 0.5 inch thick were inserted internal to each of the three flanges supporting the vertical stiffeners. Unfortunately, this repair only slowed the rate of crack growth, and did not eliminate it [4,8]. The previous work specific to this problem identified the fact that the heavily stiffened structure is likely self-defeating from a shock perspective. The considerable weight of the stiffened uptake would result in much larger inertial effects in shock than a lighter structure, with the likely consequence of greater stresses. Also, it is the heavy structure in conjunction with high thermal gradients that causes the thermal cracking; this cracking in turn reduces the shock resistance of the structure. Thus, recent efforts have sought to either reduce the dimensions of the stiffening components so as to reduce weight, or else to achieve the same ends by entirely redesigning the stiffening structure, exclusive of the mounting arrangement [4,8]. Specifically, non-linear finite element analysis was used to evaluate the performance of the original uptake structure and a number of redesigned models in shock, using the base acceleration method described below. The modifications to the original uptakes in each of the redesigned models were [4,9]:
a) Reduction by 25% of the radial dimensions of the circumferential flanges and vertical stiffeners;
b) Reduction by 50% of the radial dimensions of the flanges and stiffeners;
c) Reduction by 50% of the radial dimensions of the flanges and stiffeners and increase in their thicknesses by 100%;
d) Original design with removal of the DRES Ball; and
e) New design of stiffening structure with stiffener length reduced to 450 mm, stiffeners added to the sides of the uptake, and with a new flange added at their upper end. This model was not evaluated in thermal loading.
In shock loading, the models that were minimal variations of the original design, models
(a) to (d) above, all showed reduced maximum stresses relative to the original model. Von Mises stresses were reduced from 98 MPa in the original design to 68 MPa in design (a) and 76 MPa in design (b) [4]. This illustrates the balance required in shock design between reducing the weight of the structure to reduce inertia effects, while at the same time retaining adequate stiffness; the design with the lowest stresses due to shock was neither the stiffest nor the lightest model. A separate comparison of the original model against model (e) showed an increase of maximum

15
stress in shock from 115 MPa to 155 MPa [9]. In all cases here, the yield stress was taken as 193 MPa, indicating that all models remained in the elastic region in shock loading.
Two models were analyzed in thermal loading using non-linear finite element analysis,
the original model and model (b) above. In thermal loading, the stresses determined were much greater than in shock loading, due to temperature differences between different parts of the structure in excess of 300°C in some areas. The original model was shown to experience stresses in excess of four times the yield stress; in the modified model, though stresses were reduced, these were still greater than three times the yield stress. In both cases, the greatest stresses occurred in the most restrained area, in the uptake shell between the vertical stiffeners [4]. Given that a reduction of 50% of the dimensions of the stiffening structure resulted in only a 25% reduction in the stresses due to thermal loading, it could be surmised that it is the physical constraints rather than the dimensions or weight of material that govern the stresses in this case. Thus, modifications would be likely to be effective only when considerably reducing the constraints.
3.2 OLIVER HAZARD PERRY CLASS FRIGATES
The thermal/shock problem is not unique to Canadian warships. The United States Navy (USN) addressed a similar cracking issue in the original FFG-7 Oliver Hazard Perry (OHP) class frigates, which were also fitted with GE LM2500 gas turbine engines. The uptakes in these ships were similar to those in the HALIFAX class frigates: approximately 12m in height; the shell was 3/16 inch thick (4.76 mm); they employed an all-welded stiffening structure on the exterior of the uptake shell; and they were constructed from AISI 316L stainless steel. However, the stiffening structure was even more constraining than that of the HALIFAX class ships, as it consisted of a gridwork of flat and angle bars. Also, the transition of the uptake trunking from a square to a circular section started above 01 Level, whereas in the Canadian ships this section is immediately above the gas turbine enclosure [10,11]. As shown in the results of this work, the non-circular sections typically experienced greater stresses than the circular sections. Numerical analyses were conducted to evaluate and redesign the supporting structure. In the original configuration, thermal loading was found to induce stresses as high as 135 ksi (931 MPa), which were reduced to a maximum of 60 ksi (414 MPa) and, in most areas, to approximately 5 ksi (34 MPa). The primary recommended modifications to the original design in order to reduce thermal stresses were [10]:
a) Reducing the lengths of stiffeners;
b) Detaching stiffeners that were originally welded to the uptake shell and instead creating an air gap that allows for expansion, which was implemented where stiffeners were located:
i) At corners; and
ii) Horizontally, where also welded to larger vertical stiffeners at their ends.
c) Eliminating vertical stiffeners; and

16
d) Ensuring that deck securing arrangements allowed for thermal expansion of the entire structure.
The investigation also made the following recommendations for future uptake designs
[10]:
a) Use internal insulation to limit the duct wall temperatures;
b) Allow for thermal expansion by avoiding restraints such as external stiffening and square corners;
c) Ensure that the uptake transitions to a circular cross-section as close as possible to the point where gases leave the gas turbine enclosure; and
d) Ensure that the supporting boundary conditions allow for thermal expansion of the entire structure.
In other work, a redesigned uptake structure that included both internal and external
insulation was evaluated numerically. The initial redesign had the internal liner supported by continuous circumferential brackets, which, under thermal loading, resulted in stresses as high as 128 ksi (883 MPa). An alternative design reduced the constraint in the circumferential direction, which could be accomplished by fabricating the bracket from separate segments, or by cutting radial slots into the continuous bracket. The result was a reduction in maximum stress to 16.5 ksi (114 MPa). General recommendations from this analysis were again that stiffening structure should not be welded directly to the uptake wall, if possible, or else that, if unavoidable, these components should have low transient thermal stresses. Where both vertical and circumferential stiffeners are required, it was recommended that the former be welded to the latter at their ends, and not to the shell [11].
The redesigned uptake was also subjected to shock analysis using the dynamic design analysis method (DDAM), similar to the DRS method described below. The finite element model that was used approximated the uptake using beam elements, attached vertically end to end to represent the uptake from top to bottom. The Navy Research Laboratory (NRL) summation method was used, which is described below as it is also used in the DRS method. The analysis indicated a maximum stress in shock of 20.5 ksi (141 MPa), less than the allowable yield stress of 25.5 ksi (176 MPa). Buckling stress in shock loading was also considered, for both local and column buckling, and the redesigned uptake was found to possess sufficient strength [11].
3.3 OTHER SHIPS
The specific problem of thermal stress in uptakes has been addressed in the uptakes of a number of other ships. The USN Arleigh Burke (DDG-51) class destroyers also use GE LM2500 gas turbines. The uptakes in these ships are again of all-welded construction using AISI 316L stainless steel, but the stiffening structure is internal gridwork of Inconel 625. A number of methods were implemented in the original design, or were later recommended, which would reduce thermal stresses [11]:

17
a) The welds securing the stiffening structure to the shell are intermittent, rather than continuous;
b) Each uptake consists of structurally separate sections connected vertically by flexible expansion joints, each section secured to the ship structure using a single support constrained in all six degrees of freedom;
c) It was noted that decreasing the thickness of the external insulation by 50% would decrease the thermal gradient across the supporting structure by 31%, thereby decreasing associated stresses. However, the original thickness was determined by noise attenuation rather than by thermal insulation requirements.
In the USN Avenger (MCM-1) mine countermeasures ships, the uptakes consist of a
rectangular section with internal insulation supported by an internal liner. The internal liner is attached to vertical and horizontal Z-bar stiffeners. As in the FFG-7 class ships, high stresses were shown to develop in the supports near the corners; a recommendation was made to move the supports away from the corners, which was shown to reduce stresses by up to 25% [11].
It has been noted that, while the USN, the Royal Navy, and the Canadian Navy typically use hard-mounted uptakes which require a heavily stiffened structure in order to meet shock requirements, other mounting methods are available. It is much more common for other European navies to employ flexible shock mounting of engine uptakes [12], similar to that used to support other components, from engines to electronic systems. This would reduce the accelerations experienced by uptakes in shock loading, which would preclude the need for heavy stiffening structure; this, in turn, would allow for designs with a considerable decrease in the number of inherent mechanisms that might cause excessive thermal stresses.
Another effective design used trunnion mounting in place of hard mounting or shock mounting. This involved supporting the uptake on A-frames, with pivots at the top of the frame connected to the uptake and at the bottom of each leg connected to the ship structure. The design was originally implemented because of the need to address a separate thermal issue in glass fibre ships, whereby the excessive heat transfer through the supporting structure of a conventional design would have caused thermal degradation of the ship structure. In the trunnion mounting arrangement, the supporting frame was of sufficient length so as to ensure that heat was dissipated to the ambient air by convection faster than it could be conducted along the length of the frame components to the ship structure. Due to the use of only pivot connections, bending stresses in the uptake were eliminated, reducing or eliminating the stiffening required, in turn reducing weight, and in turn reducing the inertia effects in shock. Also, the mounting arrangement eliminated constraints to thermal expansion. This design was implemented in the Danish Navy StanFlex ships, and a design was also produced for the Royal Navy’s Type 23 frigates [12].
18
4. OBJECTIVES
The specific objective of this work was to redesign the uptake structure of the HALIFAX frigate in accordance with the following criteria:
a) As a minimum, the uptake must be designed to meet the shock requirements dictated by CFTO D-03-003-007/SF-000 Issue 4: Specification for Design and Test Criteria for Shock Resistant Equipment in Naval Ships, preferably using the modal-based design response spectrum criteria;
b) Drawing on the current body of knowledge concerning the design of uptakes and similar structures, the redesigned uptake should qualitatively include aspects that would be anticipated to reduce thermal stresses;
c) In order to minimize the cost of implementation, the design should require the minimum possible modification of the original structure, using existing components while avoiding the addition of new components, where possible; and
d) In order to preclude the need for gas flow analysis and to prevent changing the engine operating characteristics, the design must not require alteration of the internal flow path.
Though only one final design was required, it was recognized that the design process might
yield a number of distinct concepts; and that, without quantitative thermal analysis, the single concept which would be the most likely to minimize thermal stresses might not be entirely obvious. Therefore, if appropriate, it was recognized that the results of this work might include multiple, distinct uptake designs, each optimized for shock resistance.
4.1 DESIGN ITERATION
In order to converge on an appropriate design that would meet the requirements and also be as light as possible, it was originally intended that the design process would follow the iterative procedure described here:
a) Assess the shock resistance of the original model using the design response spectrum method;
b) Assess the shock resistance of the ‘minimum’ model, which would be the original model with all possible vertical stiffeners and circumferential flanges removed;
c) Based on the deformation and stress results from (a) and (b), and based on recommendations and practices given in the literature for designing this type of structure, at least one concept would be conceived that would be anticipated to meet the shock requirements;
d) Assess the concept model from (c), and alter and reassess the model as necessary in order to realize an optimum design;
e) Repeat (c) and (d) as necessary to find at least one acceptable redesign concept and, if appropriate based on a multiplicity of appreciably different options, a number of final redesign concepts; and

19
f) In the case of doubt as to the validity of the use of the design response spectrum method, for instance due to geometric or material non-linearity, then the final concept(s) would be reassessed using another method, such as a time-history analysis.
20
5. DESIGN ANALYSIS METHODS
The CFTO defines three methods that can be used in shock design, other than physical testing of equipment. Given the size and cost of the uptakes, and given that there are only 24 of these in total in the 12 HALIFAX class frigates, physical testing would be prohibitive. Also, the fact that the uptakes are currently in use in these operational ships implies that the most economical means of altering their design would be to perform the modifications in situ. Thus, the uptakes are not likely to be removed from the ships, and would not be available for physical testing.
5.1 DESIGN RESPONSE SPECTRUM ANALYSIS
The basis for all of the design methods is the design response spectrum (DRS) method; the CFTO dictates that the requirements for the DRS method and time-history analyses must conform to the spectrum given therein, and the requirements of the base acceleration method are based on the pseudo-acceleration values from the spectrum [3]. The DRS method is described here [13,14,15]. The DRS method is essentially an application in the naval environment of the design spectrum method used to design land-based structures to withstand seismic events. Both earthquakes and the underwater shocks encountered by warships induce irregular displacement time-histories on their respective structures. Also, as with earthquakes, the potential shock time-history is not unique, but rather there are an infinite number of possibilities of motions that could be caused, dependent on the type and location of explosion relative to the ship, the local conditions, and the geometry of the ship itself. Thus, to show that a given piece of equipment in a ship would survive any probable shock event using the time-history method directly, it would be necessary to analyze the equipment under a large number of different displacement time-histories. Considering that, in a design process, this would be conducted for every potential design tested against the shock requirements, a considerable amount of time and computational capacity would be required for the analysis, and still would not explicitly show that the equipment would survive all possible shocks. The DRS method addresses the problem of not being able to design to a unique event by giving conservative design requirements that approximate the maximum expected response to a shock event. The basis for this method is that it gives the maximum deformation, in response to expected shock events, of modes with natural frequencies spanning the relevant range of excitation. These deformations are applied to the natural modes of the structure, and an empirical method is used to sum the contributions of the different modes. This design method gives the benefit of previous dynamic analysis of single degree of freedom systems in a representative set of possible characteristic motions, and precludes the need for explicit dynamic analysis of equipment being evaluated. One limitation of the method is that, because it is implicit in that it relies on finding the mode shapes and natural frequencies of the model, it can only be used to evaluate models in the range of linear response, both geometric and material. If the model enters the plastic region, the actual mode shapes and frequencies become dependent on the current state of the model, and the design spectrum method no longer predicts the actual response of the model.
21
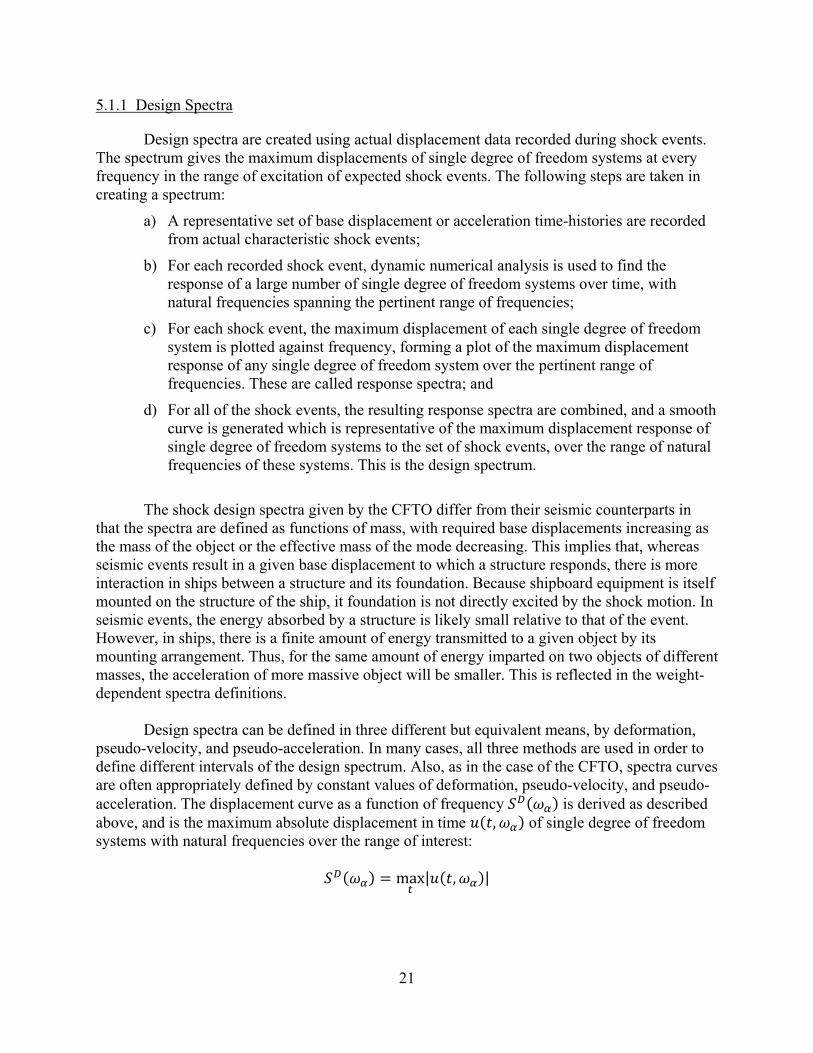
5.1.1 Design Spectra
Design spectra are created using actual displacement data recorded during shock events. The spectrum gives the maximum displacements of single degree of freedom systems at every frequency in the range of excitation of expected shock events. The following steps are taken in creating a spectrum:
a) A representative set of base displacement or acceleration time-histories are recorded from actual characteristic shock events;
b) For each recorded shock event, dynamic numerical analysis is used to find the response of a large number of single degree of freedom systems over time, with natural frequencies spanning the pertinent range of frequencies;
c) For each shock event, the maximum displacement of each single degree of freedom system is plotted against frequency, forming a plot of the maximum displacement response of any single degree of freedom system over the pertinent range of frequencies. These are called response spectra; and
d) For all of the shock events, the resulting response spectra are combined, and a smooth curve is generated which is representative of the maximum displacement response of single degree of freedom systems to the set of shock events, over the range of natural frequencies of these systems. This is the design spectrum.
The shock design spectra given by the CFTO differ from their seismic counterparts in
that the spectra are defined as functions of mass, with required base displacements increasing as the mass of the object or the effective mass of the mode decreasing. This implies that, whereas seismic events result in a given base displacement to which a structure responds, there is more interaction in ships between a structure and its foundation. Because shipboard equipment is itself mounted on the structure of the ship, it foundation is not directly excited by the shock motion. In seismic events, the energy absorbed by a structure is likely small relative to that of the event. However, in ships, there is a finite amount of energy transmitted to a given object by its mounting arrangement. Thus, for the same amount of energy imparted on two objects of different masses, the acceleration of more massive object will be smaller. This is reflected in the weight-dependent spectra definitions. Design spectra can be defined in three different but equivalent means, by deformation, pseudo-velocity, and pseudo-acceleration. In many cases, all three methods are used in order to define different intervals of the design spectrum. Also, as in the case of the CFTO, spectra curves are often appropriately defined by constant values of deformation, pseudo-velocity, and pseudo-acceleration. The displacement curve as a function of frequency is derived as described above, and is the maximum absolute displacement in time , of single degree of freedom systems with natural frequencies over the range of interest:
max| , |

22
Plotted against natural frequency, this gives the maximum deformation curve, a definition of a response spectrum. If the values from this curve are multiplied by their respective circular natural frequencies , the result is a quantity with units of velocity:
Again, these values can be plotted against natural frequency to give a definition of the same curve but with different units. This is called the maximum pseudo-velocity spectrum, as it does not represent the actual maximum velocity of any single degree of freedom system in response to the shock events. Again, the values of this curve can be multiplied by natural frequency:
This gives yet another curve describing the same spectrum, this time with units of acceleration, called the maximum pseudo-acceleration curve . As with the pseudo-velocity curve, this does not actually represent the maximum acceleration of any of the original single degree of freedom systems used to generate the maximum deformation curve. These different curves are useful, both for describing spectra and for considering the effects of the motion on the modes of a system. When plotted against double-logarithmic axes of frequency and displacement, a constant deformation curve is a horizontal line, a constant pseudo-acceleration curve is a vertical line, and a constant pseudo-velocity curve is a line at an angle of 45 degrees with positive slope. Thus, axes for pseudo-velocity and pseudo-acceleration can be superimposed on the frequency-deformation plot such that they yield the correct values as given by the relationships above. This is shown below in Figure 6.3, which gives the requirement from the CFTO.
Spectra are usually described with, at a minimum, one of each of these curves, as this is typically the most general set of curves that encompass the results from analysis of the original shock motions. This is not arbitrarily so, but can be considered in relation to the physical behavior of systems subjected to shock motions. Systems with high natural frequencies are stiff. In the limit of high frequency, in a given motion the system mass will experience the same movement as the base motion, independent of the natural frequency of the system, and will experience little deformation with respect to the base. Thus, the acceleration will be nearly the same as that of the base, regardless of frequency, which is the basis for the constant pseudo-acceleration curve at high frequency. At values of low natural frequency, systems are very flexible. The system mass will stay essentially stationary while the base motion will induce in the system deformations nearly equal to the base displacement. This is the basis for the constant deformation curve at low frequencies. In the range of intermediate values of frequency, system response is described best by a constant pseudo-velocity curve.
5.1.2 Mode Shapes and Frequencies
In order to apply the design spectrum, the natural frequencies and mode shapes of the model must be determined. In the present case where the uptake is represented by a finite

23
element model, the mass matrix M and the stiffness matrix K describe the state of the displacements of the nodes within the dynamic model where inertia effects are important:
M K 0 In the linear model, the natural frequencies of small vibrations about the equilibrium state are found by assuming sinusoidal motion of the nodes.
sin Then the equilibrium equation becomes
M sin K sin 0 This is the eigenproblem
K M 0 Then, for the non-trivial solution, the determinant of the matrix on the left must equal zero, which yields the eigenvalues, or the squares of the natural frequencies, of the model. Solving for the vector on the right for each eigenvalue yields the eigenvectors , which give the relative displacement of each node when oscillating at a given frequency, called the mode shapes. When finding the mode shapes and natural frequencies of the model, the modal effective mass of each relevant mode is required in order to apply the spectrum. First the generalized mass
is determined for each mode :
M The modal participation factor Γ in each direction is calculated as
Γ1
M
Here, indicates the rigid body motion of each node in response to motion of the entire model in the global direction. In this case, where the spectra are only applied in the displacement directions, and not in the rotational directions, is a vector of value unity. Finally, for every mode the modal effective mass in each direction is calculated as
Γ A property of the effective mass is that, when summed over all modes in a given direction, the total should equal the free mass in that direction, which excludes that mass associated with constrained nodes. Thus, in dynamic modal applications, a measure of how effectively the model represents the actual structure is the fraction of mass represented by the
24
modal effective masses. Generally, a value of at least 80 percent is assumed to give good accuracy [16].
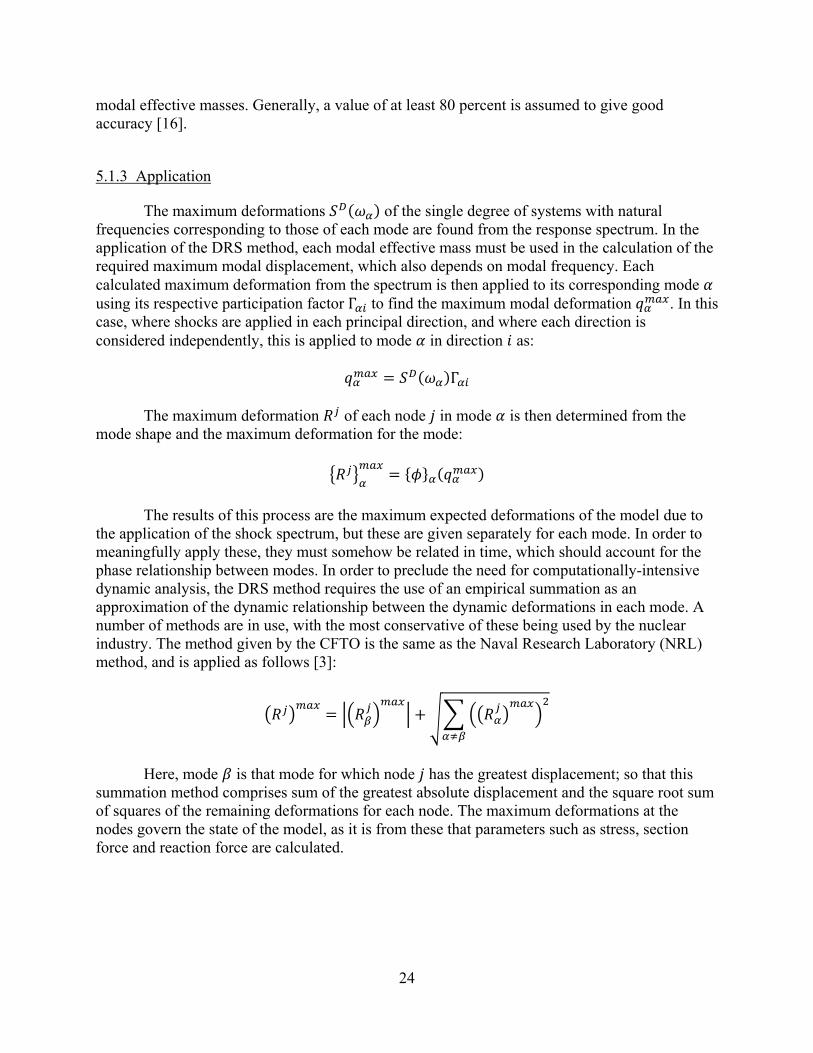
5.1.3 Application
The maximum deformations of the single degree of systems with natural frequencies corresponding to those of each mode are found from the response spectrum. In the application of the DRS method, each modal effective mass must be used in the calculation of the required maximum modal displacement, which also depends on modal frequency. Each calculated maximum deformation from the spectrum is then applied to its corresponding mode using its respective participation factor Γ to find the maximum modal deformation . In this case, where shocks are applied in each principal direction, and where each direction is considered independently, this is applied to mode in direction as:
Γ The maximum deformation of each node in mode is then determined from the mode shape and the maximum deformation for the mode:
The results of this process are the maximum expected deformations of the model due to the application of the shock spectrum, but these are given separately for each mode. In order to meaningfully apply these, they must somehow be related in time, which should account for the phase relationship between modes. In order to preclude the need for computationally-intensive dynamic analysis, the DRS method requires the use of an empirical summation as an approximation of the dynamic relationship between the dynamic deformations in each mode. A number of methods are in use, with the most conservative of these being used by the nuclear industry. The method given by the CFTO is the same as the Naval Research Laboratory (NRL) method, and is applied as follows [3]:
Here, mode is that mode for which node has the greatest displacement; so that this summation method comprises sum of the greatest absolute displacement and the square root sum of squares of the remaining deformations for each node. The maximum deformations at the nodes govern the state of the model, as it is from these that parameters such as stress, section force and reaction force are calculated.

25
5.1.4 Damping
The method by which damping is represented in design spectrum analyses is through the use of spectra defined as functions of the fraction of critical damping. When this method is used, the process of deriving spectra described above is repeated for single degree of freedom systems with different damping values, and each spectrum is defined for a given fraction of critical damping. Once the eigenvalues and mode shapes of the model have been found, modal damping values are estimated, often based on experience. Then, for each mode and assigned damping value, the maximum modal deformation is taken from the spectrum as defined at the same damping value. Where a spectrum is not explicitly defined at a required value of modal damping, the necessary maximum deformation is interpolated using the appropriate spectra with adjacent values of critical damping. The CFTO only provides the criteria for defining spectra as functions of mass, and does not discuss damping at all [3]. Therefore, the common method for applying damping described here cannot be used, as it must be assumed that the deformation of any structure is governed by the appropriate spectrum, regardless of damping. For structures designed to this specification, this will result in a conservative design, because the inclusion of damping would lower the maximum deformations and thus lower the associated stresses.
5.2 BASE ACCELERATION METHOD
This method is a much less-rigorous application of the parameters of the DRS method. A constant acceleration is applied to the static model as a body load, and the resulting stresses are determined. The CFTO gives parameters for this method based on type of equipment, weight of equipment, location, and direction of applied shock. Less vital equipment is required to survive a lower value of acceleration. Also, lower acceleration values are given for equipment mounted away from submerged part of the hull. It can be seen that the parameters given for the base acceleration parameters are fairly close to those given in the constant pseudo-acceleration part of design spectra, and it is likely they were derived from the spectra. This implies that the base acceleration method treats the model as a single degree of freedom system that will move stiffly with the base motion.
5.3 TIME-HISTORY ANALYSIS
This method involves solving for the response of the model in time to a specified base motion. Though not invalid, this is not as general as the DRS method. It can be used to show that the model would withstand a specific characteristic shock event, but does not show that it is likely to survive all possible expected events. The CFTO allows for design using a time-history, as long as the associated response spectrum meets the requirements of the appropriate design spectrum in both positive and negative acceleration [3]. Small deviations from this requirement are allowed where these do not exceed a 15% reduction in the specified pseudo-acceleration. Where a single time-history that meets the requirements cannot be derived, it is permissible to use multiple time-histories such that the envelope of their combined response spectra meet the DRS requirements.

26
One advantage of the time-history analysis is that the effects of damping can be taken into account. This can be important because damping will reduce the motions of the structure while absorbing energy, thereby reducing stresses. Thus, evaluating models that include damping is likely to lead to a less conservative and potentially to a lighter design.
27
6. MODELS
6.1 GENERAL MODEL DEFINITION
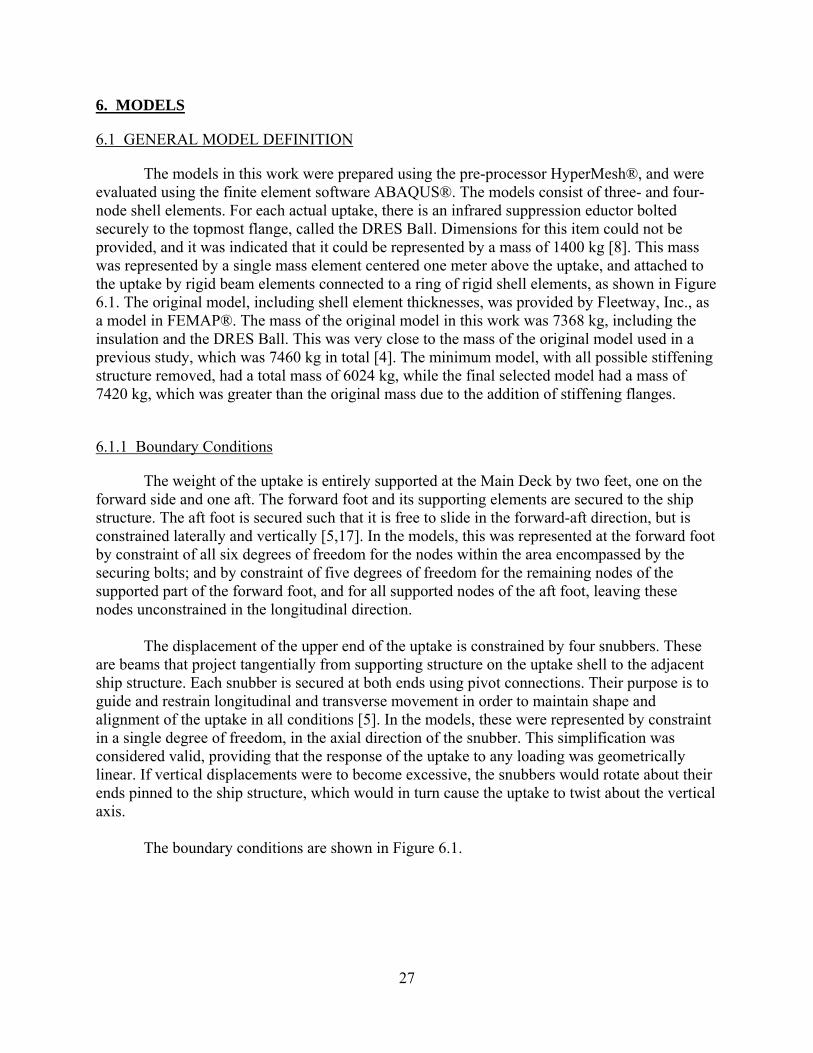
The models in this work were prepared using the pre-processor HyperMesh®, and were evaluated using the finite element software ABAQUS®. The models consist of three- and four- node shell elements. For each actual uptake, there is an infrared suppression eductor bolted securely to the topmost flange, called the DRES Ball. Dimensions for this item could not be provided, and it was indicated that it could be represented by a mass of 1400 kg [8]. This mass was represented by a single mass element centered one meter above the uptake, and attached to the uptake by rigid beam elements connected to a ring of rigid shell elements, as shown in Figure 6.1. The original model, including shell element thicknesses, was provided by Fleetway, Inc., as a model in FEMAP®. The mass of the original model in this work was 7368 kg, including the insulation and the DRES Ball. This was very close to the mass of the original model used in a previous study, which was 7460 kg in total [4]. The minimum model, with all possible stiffening structure removed, had a total mass of 6024 kg, while the final selected model had a mass of 7420 kg, which was greater than the original mass due to the addition of stiffening flanges.
6.1.1 Boundary Conditions
The weight of the uptake is entirely supported at the Main Deck by two feet, one on the forward side and one aft. The forward foot and its supporting elements are secured to the ship structure. The aft foot is secured such that it is free to slide in the forward-aft direction, but is constrained laterally and vertically [5,17]. In the models, this was represented at the forward foot by constraint of all six degrees of freedom for the nodes within the area encompassed by the securing bolts; and by constraint of five degrees of freedom for the remaining nodes of the supported part of the forward foot, and for all supported nodes of the aft foot, leaving these nodes unconstrained in the longitudinal direction.
The displacement of the upper end of the uptake is constrained by four snubbers. These are beams that project tangentially from supporting structure on the uptake shell to the adjacent ship structure. Each snubber is secured at both ends using pivot connections. Their purpose is to guide and restrain longitudinal and transverse movement in order to maintain shape and alignment of the uptake in all conditions [5]. In the models, these were represented by constraint in a single degree of freedom, in the axial direction of the snubber. This simplification was considered valid, providing that the response of the uptake to any loading was geometrically linear. If vertical displacements were to become excessive, the snubbers would rotate about their ends pinned to the ship structure, which would in turn cause the uptake to twist about the vertical axis. The boundary conditions are shown in Figure 6.1.

28
Figure 6.1. Uptake Boundary Conditions
6.1.2 Material Definition
The entire uptake is constructed of AISI 316L stainless steel [5]. The maximum operating temperature is approximately 500°C [4,5,6]. Because this work did not explicitly address thermal loading, the specific temperature distribution of each model was not available. Also, any temperature distribution would anyway be a function of the specific operating conditions and recent loading history of the engine, and would not be unique. Thus, as a conservative design measure, the material properties at 500°C were used for the entire model.
It was found that a single reference was not available to describe both a full range stress-strain curve for the uptake material, and the behavior of the metal at elevated temperatures and in the plastic region. Also, different sources give a wide range of values for the same properties of this material. The full-range stress-strain definition used was given by Rasmussen [18], because this curve is a very accurate representation of experimental data for this metal. The temperature dependence used was given by Euro Inox and The Steel Construction Institute (SCI) [19].
Rasmussen gives a set of two equations to fully describe the strain as a function of stress up to the ultimate strength at the ultimate strain . This description is in terms of the

29
initial Young’s modulus , the 0.2% proof stress . , the 0.2% tangent modulus . , the 0.2% total strain . , the Ramberg-Osgood parameter , and the additional parameter :
0.002.
.
.
.
.
.. .
The parameters of these equations are defined as:
1 3.5 .
. 1 0.002 ⁄
.
. 0.002 .
The temperature dependence from Euro Inox & SCI is given in terms of retention factors, which are ratios of each relevant parameter at the temperature of interest to the value of the parameter at the reference temperature :
. ,. ,
.
,,
,,
Euro Inox & SCI give retention factors for an AISI 316 grade equivalent stainless steel,
but not for an AISI 316L grade equivalent. ASM International indicates that, where properties for AISI 316L stainless steel are not available, those for AISI 316 should be used [20]. Also, a retention factor is not given for the ultimate strain , though the stress-strain curve from Rasmussen is dependent on this parameter. However, Rasmussen shows that large errors in ultimate stress and strain result in small errors stresses up to 2% strain, such that an error of 40% in results in only a 2.7% error in stress at 2% strain. Therefore, it is reasonable to use the original value for ultimate strain .

30
The values used for each parameter are given in Table 6.1, while Figure 6.2 shows the resulting stress-strain curve up to 10% strain, and also shows the points used in the linear approximation of the curve in the finite element analysis.
Table 6.1. Steel Properties
Parameter Value ( 500°C 190 GPa
. 316 MPa 5.88 0.51 616 MPa
. , 0.63 , 0.80 , 0.79
Figure 6.2. Stress-Strain Curve, AISI 316L Stainless Steel, 500°C
6.1.3 Insulation
A layer of insulation covers the entire exterior of the uptake, which is used as both a thermal and an acoustic barrier. Thermal fibrous insulation is used, provided by Roxul Inc. or Fibrex Insulation Inc. [6], with a density of 96 kg/m3 [21]. In general, the insulation thickness is 100mm over the exposed shell of the uptake, and is 200mm thick over flanges and other structural components [7]. This was approximated as a non-structural weight in the finite element model. Where the insulation was lined over the shell or a flat flange, it was approximated as a mass per unit area based on its thickness and density. Where the insulation was spread over more

31
complicated structure such as a group of stiffeners, it was approximated as a mass, based on its volume and density.
A prior modification to the uptakes required the insert of a layer of insulation between the uptake shell and an internal steel liner [6,17]. The liner is 16 gauge (1.5875mm) AISI 316L stainless steel, while the insulation is 0.5in (12.7mm) BGFMAT high temperature glass fiber insulation provided by BGF Industries, with a density of approximately 10 lb/cuft (155 kg/m3) [22]. The liner and the insulation were modeled separately as non-structural masses per unit area. Figure 6.3 gives the values used for all of the non-structural masses discussed here, some of which were dependent on the dimensions of particular components of each model.
Table 6.2. Non-Structural Mass Representation of Insulation Components
Material Density (kg/m3) Component Thickness
(mm) Length l (mm)
Width w (mm)
Flange width f (mm)
Type Value
External Insulation 96
Shell 100 _ _ _ mass/ area
9.6 kg/m2
Snubber structure, enclosure
flange
200 _ _ _ mass/ area
19.2 kg/m2
Mating flange 415 _ 306 206 mass/
area 59.6
kg/m2 Upper flange 500 2612π 306 _ mass 120.5
kg Foot flange
sides 400 _ 180 80 mass/ area
9.6 kg/m2
Main and upper
stiffeners 200 l w _ mass 19.2l
w kg
Lower stiffeners 100 l w _ mass 9.6lw
kg
Gussets 200 2412π 310 mass 45.1 kg
Internal Insulation 155 Shell 12.7 _ _ _ mass/
area 1.96
kg/m2 Internal Liner 8000 Shell 1.5875 _ _ _ mass/
area 12.7
kg/m2
6.1.4 Damping
Damping values were not found specifically for insulated welded steel structures. For welded steel structures, recommended values of damping as a fraction of critical damping were given as 2 to 3 percent up to approximately half of the yield stress, and 5 to 7 percent above this

32
point and up to yield stress [13]. A significant portion of research investigating the damping properties of insulation concerns the behavior of piping systems in nuclear plants during seismic events. The resulting recommendations are that, where piping is insulated, the critical damping ratio be increased by approximately 0.5-1%, though in some cases the effect of damping has been shown to be much greater than this [23,24]. In another applicable area of research, damping values have been recommended for use in modeling ships in shock events. Didoszak et al showed that there is good correlation between actual shock events and finite element modeling of these events for a damping value of 4% critical damping [25]. However, better results were achieved using Rayleigh damping parameters. From curve-fitting of data recorded during real shock events, the values derived were 19.2 for α and 2.09E-06 for β. Though the damping of a ship may be different from that of a given component therein, the use of these values is somewhat substantiated by the fact that they are similar in magnitude to the values given by other sources for similar structures, such as those described above for steel structures and insulated pipes. Also, these values were derived from data over the range 0 to 250 Hz; this is similar to the range required by the CFTO, 5 to 300 Hz, further validating their use. The Rayleigh damping parameters given here were used in all dynamic modeling in this work.
6.2 ANALYSIS METHODS DEFINITION
6.2.1 Design Spectra
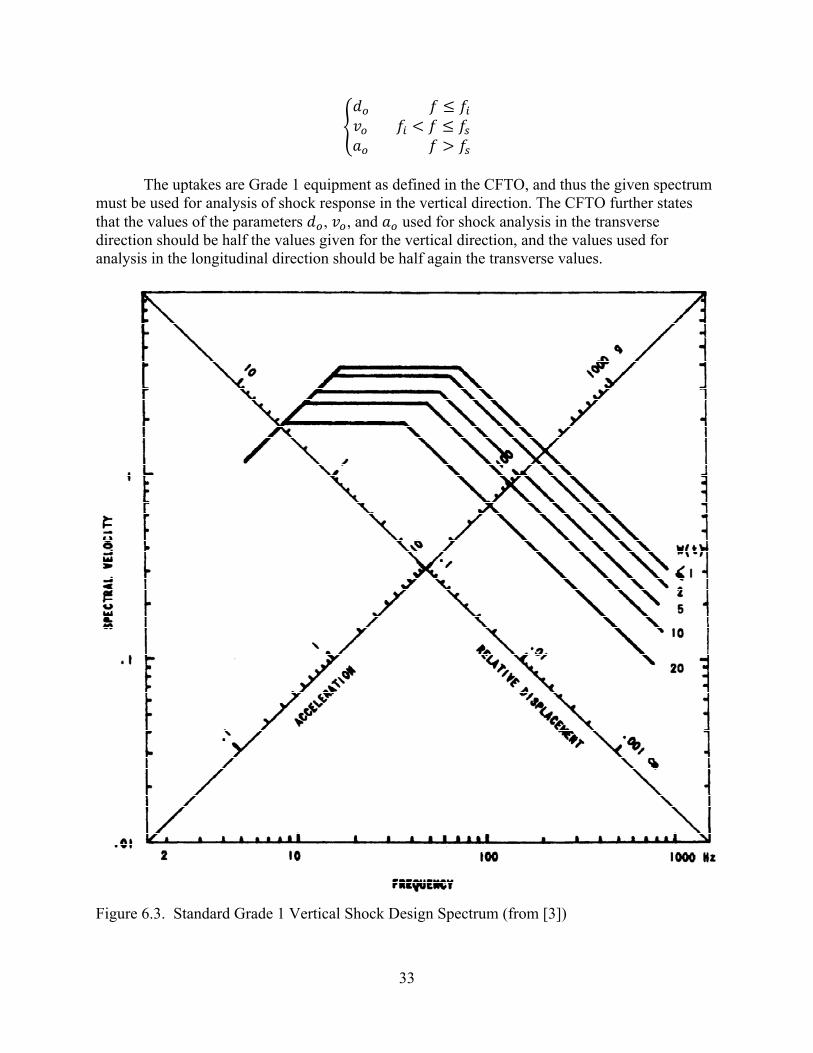
When using the design spectrum method, the CFTO requires that equipment be subjected to three independent shock events, one in the vertical direction, one in the longitudinal direction, and one in the transverse direction. The vertical design spectrum is defined by an upper transition frequency and a lower transition frequency , with a constant displacement curve in the low frequency range, a constant pseudo-velocity curve in the medium frequency range, and a constant pseudo-acceleration curve in the high frequency range. The defining equations are:
0.035 m
3.93. . m/s
200
. . g
17.9. . Hz
79.5
. . Hz
Here, is the modal effective mass in tonnes. The spectrum curves, which are functions of weight, are given in Figure 6.3, and are described in terms of the modal frequencies by:
33
The uptakes are Grade 1 equipment as defined in the CFTO, and thus the given spectrum
must be used for analysis of shock response in the vertical direction. The CFTO further states that the values of the parameters , , and used for shock analysis in the transverse direction should be half the values given for the vertical direction, and the values used for analysis in the longitudinal direction should be half again the transverse values.
Figure 6.3. Standard Grade 1 Vertical Shock Design Spectrum (from [3])

34
6.2.2 Base Acceleration
The base acceleration curves from the CFTO for the particular location and grade of the uptakes were not available. A similar curve for equipment secured below the waterline is given in Figure 6.4, showing the relationship between values to be used when evaluating the shock response in each direction, and also showing how these values are similar to those from the constant pseudo-acceleration curves used in the design spectrum method. As with the DRS method, it is required that the responses in each direction be evaluated independently. Though the actual weight-based values were not available, the parameters used in the original design were available in the drawings. Given that the weight changes between the different models evaluated were not extreme, it was considered adequate to evaluate every model at the values for base acceleration used in the initial design, which were 44g (431.64 m/s2) in the vertical direction, 21g (206.01 m/s2) in the transverse direction, and 11g (107.91 m/s2) in the longitudinal direction [2]. Also, because the mass of the final selected model was nearly identical to that of the original model, as described above, the use of these values was justified in this case, and was not simply an approximation of the design requirements.

35
Figure 6.4. Base Acceleration Curves, Grade 1 Equipment Located Below the Waterline
(from [3])

36
6.2.3 Time-History Analysis
The time-history analyses were conducted in order to assess the actual response of each structure in time and to compare these results to the results from the other two design methods. Strictly speaking, success in a success in a single time-history analysis does not guarantee that a structure will survive similar shock events. A different time-history, while meeting the same criteria, may excite different modes to different degrees, possibly with the result of greater deformations due to more detrimental modal phasing or modal summations.
Information was not available on the actual shape of characteristic shock event time-histories in the naval environment; this information is typically classified. However, the CFTO only requires that, when the time-history is transformed into a response spectrum, both the positive and negative pseudo-accelerations meet or exceed the design spectrum. Deviations from this requirement are allowed over limited frequency intervals, as long as the pseudo-acceleration does not fall more than 15 percent lower than the value given by the design spectrum [3].
The time-history was constructed through trial and error until a suitable event was described. The shock event was first created as a discrete displacement time-history, in order to ensure the creation of a realistic event with zero final displacement and velocity. The corresponding acceleration history was then found by taking the second derivative of the displacement in time. These are shown in Figure 6.5.
Figure 6.5. Displacement and Acceleration Time-History
Subsequently, MATLAB® was used to evaluate the response to this acceleration of a
large number of single degree of freedom systems, using the central difference method as described by Chopra [13]. Four hundred eighty single degree of freedom systems were used, logarithmically spaced over the frequency range specified by the CFTO, 5 to 300 Hz. To ensure accuracy in the numerical analysis, the time step used was 1/3 ms, which is one tenth the

37
minimum period at 300 Hz [13]. For each system, the maximum positive, negative, and absolute displacements were recorded. These values, plotted over the range of frequencies, gave the response spectrum for the time-history, shown in Figure 6.6. Also shown is the design spectrum for a mass of six tonnes. The figure shows that the absolute response spectrum meets the requirements of the CFTO for this mass. At the very highest frequencies, the positive spectrum falls below the requirement, but not below the less 15 percent limit. Again at the lowest frequencies, the negative spectrum drops very slightly below the requirement. The response spectrum shows that the time-history is generally very conservative; in terms of pseudo-acceleration, the value of the response spectrum at some frequencies is more than five times greater than the required design spectrum. Also, all models evaluated using this method had masses greater than six tonnes, as described above. Because the mass-based DRS requirements are less stringent for structures with greater masses, this again made the time-history described here conservative.
Figure 6.6. Pseudo-Acceleration Design and Response Spectra

38
7. EVALUATION
7.1 DESIGN CRITERION
The critical design criterion was that, regardless of the method used, the stresses, on the basis of an accepted yield criterion, should not exceed the 0.2% offset stress. The yield criterion selected was the von Mises equivalent stress, and the 0.2% offset stress was taken as 199.08 MPa based on the material definition above. Small deviations from this requirement may be permitted where it can be shown that most of the material is lightly loaded and that a small amount of plastic response will not affect the functionality of the equipment, such as in a beam of circular cross section in pure bending [3].
7.2 DESIGN SPECTRUM RESULTS
As stated above, the CFTO stipulates that the preferred method of design is the DRS method, thus the original intention was to evaluate all models using this method. The following steps were taken to evaluate models using the DRS method:
a) ABAQUS® was used to determine the modes and natural frequencies of the model in the range 5 to 300 Hz, as required by the CFTO;
b) MATLAB® was used to read the natural frequencies and the modal effective masses, calculate the value of the design spectrum for each frequency in each shock direction, and write the three resulting spectra to a file readable by ABAQUS®. At this stage, further analysis was conducted in MATLAB® in order to better visualize the contributions of each mode; and
c) ABAQUS® was used to read in the spectra created in MATLAB® and to determine the response of the uptake to each shock input based on the NRL summation method.
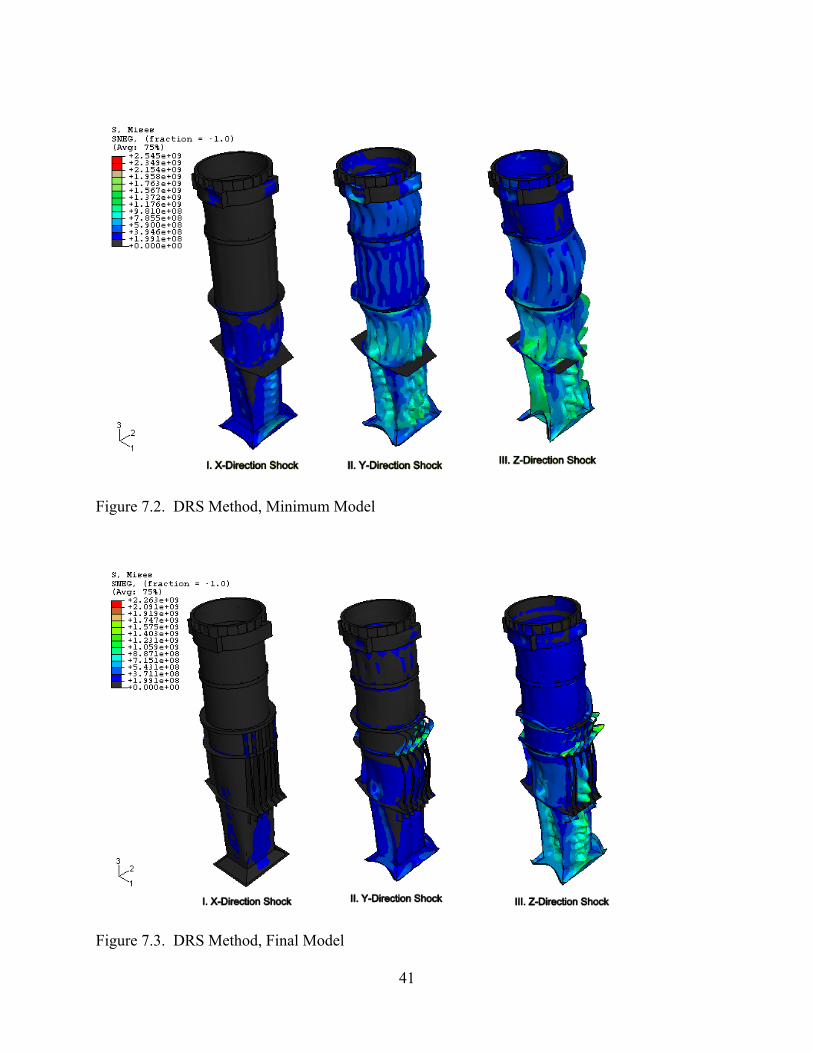
The response is of the original, the minimum, and the final models to the three DRS
method shock events applied independently in each direction are shown in Figure 7.1, Figure 7.2, and Figure 7.3, respectively. The figures show the von Mises equivalent stress superimposed on the deformed model, with the deformation scaled by a factor of ten so that the deformed shapes can be seen. The contours indicate stresses greater than the permissible 0.2% offset yield stress, while the dark regions indicate areas of the model that remained in the elastic region.
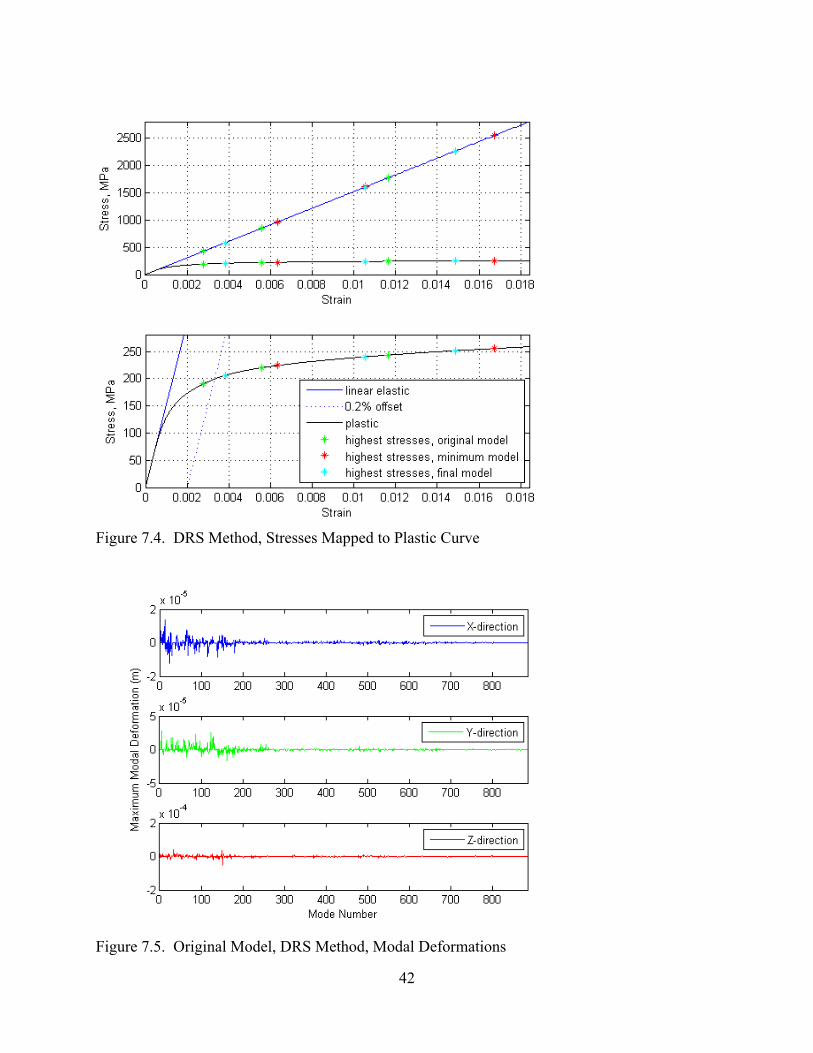
It was shown using the DRS method that the stresses in all of the analyzed models exceeded the allowable limit. In fact, Figure 7.1 shows that, even in the original model, the stresses exceeding eight times the yield stress. However, this must be interpreted correctly in order to be meaningful. While the method certainly showed yielding, the DRS method uses only the initial Young’s modulus, and does not accommodate non-linear plastic softening. An estimation of the actual stresses to which the model would be subjected was made by mapping the ‘elastic’ stresses to the plastic curve at the same strain. Figure 7.4 shows this mapping; for the results for each models shown, the lowest mapped stress corresponds to the longitudinal shock, the highest value to the vertical shock, and the remaining value to the transverse shock. The figure shows that the maximum strain in the original model, occurring in response to the

39
vertical shock, could be estimated as being less than 1.2 percent, with a corresponding plastic maximum stress less than 250 MPa. Given that this steel is ductile, with an ultimate strength of approximately 485 MPa at 51 percent strain at 500°C, it is conceivable that the uptake might sustain some plastic damage during a shock event while remaining functional. Similarly, the minimum and the final models, while experiencing seemingly excessive stresses, are shown to result in maximum strains of less than two percent in the worst case, with most stresses corresponding to much lower strains than this.
The deformations and stress distribution in the models are the result of the summation of the components of hundreds of modes with natural frequencies in the range 5 – 300 Hz, thus the principle contributions are not immediately obvious. The original model had 884 modes in this range, the minimum model 855, and the final model 1027 modes. Figure 7.5 plots the values of the maximum modal deformation of each mode for each shock spectra for the original model, where greater mode numbers correspond to modes with higher natural frequencies. This shows that, generally, the greatest contributions to the response were from modes at the lower end of the frequency range. However, modal responses did not strictly decrease with increasing frequency; this was due to the variations in the modal effective masses, which resulted from the complicated geometry of the model. Figure 7.6 shows the absolute value of these contributions ranked from greatest to smallest contribution. As would be expected, the modal contributions were larger the more severe the shock spectrum. In the first plot in Figure 7.7, the modal deformations for all shock directions are ordered in terms of the ranked response to the longitudinal shock. The second and third plots repeat this in terms of the ranked response to the transverse and vertical shocks, respectively. These plots show the relationship between modal responses in each direction, and are useful in determining which modal responses it would be most important to address when altering the model. The first and third plots show general correlation between the modal responses in the longitudinal and the vertical directions. This behavior is likely explained by the fact that the uptake is angled aft, such that its axis lies in the X-Z plane; thus, excitation in the vertical direction affected similar modes to those excited in the longitudinal direction. This means that a redesign that improved the response in either one of these directions would be likely improve the response in the other. All of the plots show little correlation between the response to the transverse shock and the responses to the vertical and longitudinal shocks.
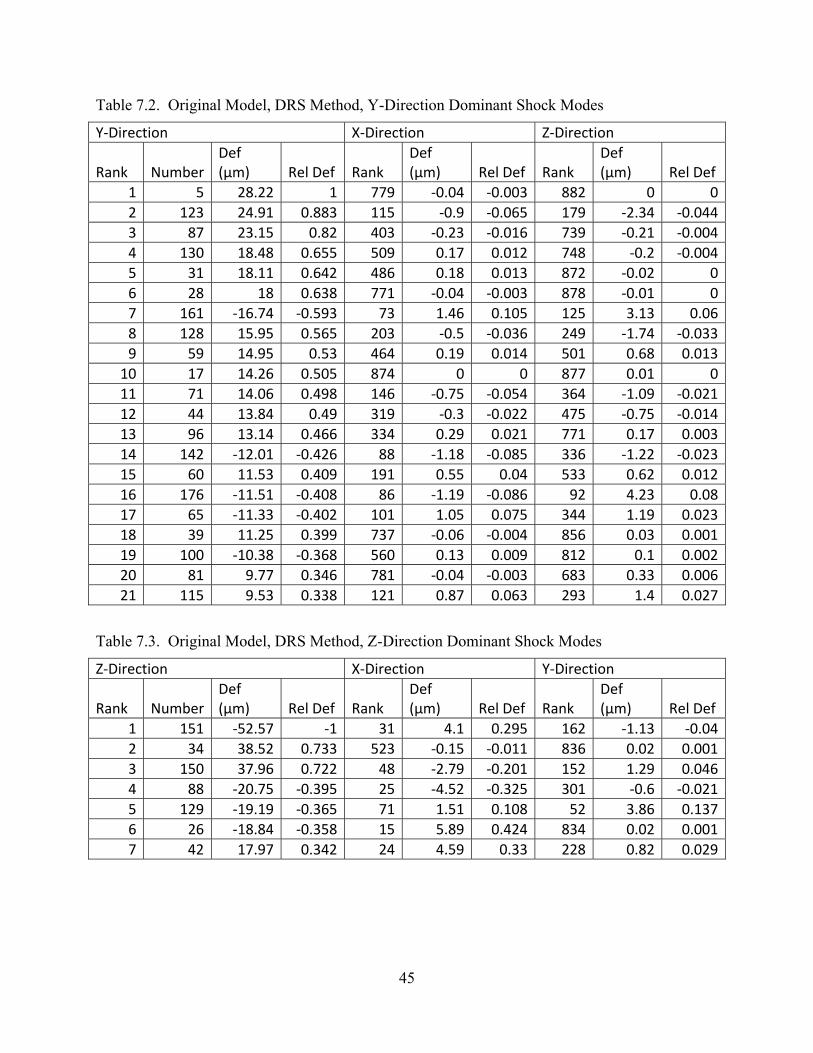
Table 7.1, Table 7.2, and Table 7.3 give the modes with the two-thirds greatest response in the longitudinal, transverse, and vertical directions, respectively, for the original model, and give in tabular form the relationship discussed above between modal responses in the different directions. It can be seen here again that a number of identical modes ranked relatively highly in terms of deformation in both the vertical and longitudinal directions, while the transverse dominant modes had little contribution in the other directions, and vice versa. It is also important to note that it was a very small number of the total 884 modes in the relevant frequency range that dominated the response; given that the summation method involved a square root sum of squares, the contribution of modes with relatively small responses would be very small, and nearly negligible for most modes. Figure 7.8, Figure 7.9, and Figure 7.10 show the shapes of the four modes that had the greatest contributions in the longitudinal, transverse, and vertical directions, respectively. One point of note is that, though the stiffened part of the cylinder was the focus of design modifications due to the appearance there of thermal cracking, it was the

40
lower transition section that consistently contributed significantly to the total deformation using the DRS method. This was consistent with the recommendation cited above from a previous study that uptakes should be designed to transition to circular sections as near as possible to their lower ends [10]. Though the original intention was to evaluate all models using the DRS method, the original model failed the design criteria using this method, and subsequent modifications were shown to result in even higher stresses than in the original model. This was a consequence of the fact that the original uptakes were designed using the base acceleration method. Though it would be more meaningful to conduct the redesign using this method, it was improbable that a successful design would be achieved. Thus the DRS method was abandoned in favor of the base acceleration method for the remainder of the design process. For purposes of comparison, the minimum model and the final design were also evaluated using the DRS method.
Figure 7.1. DRS Method, Original Model
41
Figure 7.2. DRS Method, Minimum Model
Figure 7.3. DRS Method, Final Model
42
Figure 7.4. DRS Method, Stresses Mapped to Plastic Curve
Figure 7.5. Original Model, DRS Method, Modal Deformations

43
Figure 7.6. Original Model, DRS Method, Ranked Modal Deformations
Figure 7.7. Original Model, DRS Method, Modal Deformations Ranked by Direction

44
Table 7.1. Original Model, DRS Method, X-Direction Dominant Shock Modes
X‐Direction Y‐Direction Z‐Direction
Rank Number Def (μm) Rel Def Rank
Def (μm) Rel Def Rank
Def (μm) Rel Def
1 1 13.9 1 883 0 0 8 16.55 0.3152 2 13.87 0.998 877 0 0 118 ‐3.28 ‐0.0623 13 13.43 0.967 439 ‐0.41 ‐0.014 575 0.56 0.0114 23 ‐11.94 ‐0.859 876 0 0 32 11.02 0.215 11 9.54 0.686 884 0 0 154 2.63 0.056 139 ‐8.57 ‐0.617 369 ‐0.49 ‐0.017 34 ‐10.92 ‐0.2087 116 ‐8.13 ‐0.585 719 0.12 0.004 25 ‐11.95 ‐0.2278 69 ‐7.81 ‐0.562 131 ‐1.47 ‐0.052 26 ‐11.94 ‐0.2279 64 7.59 0.546 122 ‐1.56 ‐0.055 27 11.76 0.224
10 29 ‐7.58 ‐0.545 763 0.08 0.003 61 7.06 0.13411 19 ‐7.03 ‐0.506 848 0.02 0.001 14 ‐14.83 ‐0.28212 67 7 0.504 788 ‐0.07 ‐0.002 23 12.58 0.23913 85 ‐6.64 ‐0.478 409 0.44 0.016 35 ‐10.79 ‐0.20514 181 ‐6 ‐0.432 103 1.8 0.064 24 12.15 0.23115 26 5.89 0.424 834 0.02 0.001 6 ‐18.84 ‐0.35816 27 5.62 0.405 845 0.02 0.001 469 0.76 0.01517 95 ‐5.51 ‐0.397 679 0.16 0.006 11 14.94 0.28418 25 ‐5.23 ‐0.377 843 ‐0.02 ‐0.001 67 ‐5.92 ‐0.11319 8 5.23 0.376 873 0 0 398 0.96 0.01820 66 4.91 0.353 601 ‐0.23 ‐0.008 47 8.88 0.16921 15 ‐4.89 ‐0.352 850 ‐0.02 ‐0.001 39 9.87 0.18822 149 4.73 0.34 793 0.06 0.002 30 ‐11.32 ‐0.21523 153 ‐4.71 ‐0.339 338 ‐0.54 ‐0.019 10 15.34 0.292
45
Table 7.2. Original Model, DRS Method, Y-Direction Dominant Shock Modes
Y‐Direction X‐Direction Z‐Direction
Rank Number Def (μm) Rel Def Rank
Def (μm) Rel Def Rank
Def (μm) Rel Def
1 5 28.22 1 779 ‐0.04 ‐0.003 882 0 02 123 24.91 0.883 115 ‐0.9 ‐0.065 179 ‐2.34 ‐0.0443 87 23.15 0.82 403 ‐0.23 ‐0.016 739 ‐0.21 ‐0.0044 130 18.48 0.655 509 0.17 0.012 748 ‐0.2 ‐0.0045 31 18.11 0.642 486 0.18 0.013 872 ‐0.02 06 28 18 0.638 771 ‐0.04 ‐0.003 878 ‐0.01 07 161 ‐16.74 ‐0.593 73 1.46 0.105 125 3.13 0.068 128 15.95 0.565 203 ‐0.5 ‐0.036 249 ‐1.74 ‐0.0339 59 14.95 0.53 464 0.19 0.014 501 0.68 0.013
10 17 14.26 0.505 874 0 0 877 0.01 011 71 14.06 0.498 146 ‐0.75 ‐0.054 364 ‐1.09 ‐0.02112 44 13.84 0.49 319 ‐0.3 ‐0.022 475 ‐0.75 ‐0.01413 96 13.14 0.466 334 0.29 0.021 771 0.17 0.00314 142 ‐12.01 ‐0.426 88 ‐1.18 ‐0.085 336 ‐1.22 ‐0.02315 60 11.53 0.409 191 0.55 0.04 533 0.62 0.01216 176 ‐11.51 ‐0.408 86 ‐1.19 ‐0.086 92 4.23 0.0817 65 ‐11.33 ‐0.402 101 1.05 0.075 344 1.19 0.02318 39 11.25 0.399 737 ‐0.06 ‐0.004 856 0.03 0.00119 100 ‐10.38 ‐0.368 560 0.13 0.009 812 0.1 0.00220 81 9.77 0.346 781 ‐0.04 ‐0.003 683 0.33 0.00621 115 9.53 0.338 121 0.87 0.063 293 1.4 0.027
Table 7.3. Original Model, DRS Method, Z-Direction Dominant Shock Modes
Z‐Direction X‐Direction Y‐Direction
Rank Number Def (μm) Rel Def Rank
Def (μm) Rel Def Rank
Def (μm) Rel Def
1 151 ‐52.57 ‐1 31 4.1 0.295 162 ‐1.13 ‐0.042 34 38.52 0.733 523 ‐0.15 ‐0.011 836 0.02 0.0013 150 37.96 0.722 48 ‐2.79 ‐0.201 152 1.29 0.0464 88 ‐20.75 ‐0.395 25 ‐4.52 ‐0.325 301 ‐0.6 ‐0.0215 129 ‐19.19 ‐0.365 71 1.51 0.108 52 3.86 0.1376 26 ‐18.84 ‐0.358 15 5.89 0.424 834 0.02 0.0017 42 17.97 0.342 24 4.59 0.33 228 0.82 0.029

46
Figure 7.8. Original Model, DRS Method, X-Direction Shock Dominant Mode Shapes
Figure 7.9. Original Model, DRS Method, Y-Direction Shock Dominant Mode Shapes

47
Figure 7.10. Original Model, DRS Method, Z-Direction Shock Dominant Mode Shapes
7.3 BASE ACCELERATION RESULTS
The use of the base acceleration method allowed the inclusion of both geometric and material non-linearity. Material non-linearity proved to be important because, where the elastic response of some models would indicate stress concentrations above the design criterion, plastic softening caused these stresses to be somewhat dissipated, and resulted in lower stresses at the same strain, thus resulting in acceptable stress levels. The plastic curve used was given above in Figure 6.2. Geometric non-linearity was important in order for the model be checked for buckling. Two methods were used to predict buckling. The first was the use of a stabilized non-linear method using the finite element software. This method allowed the capture of local buckling, which can cause redistribution of load due to non-linear deformation of the structure without necessarily causing global buckling. This was important because second method, described below, was developed in order to somewhat empirically address the buckling of conventionally stiffened and supported cylinders; this was not strictly the case considering the geometry of the models analyzed here, thus other buckling modes may have been important but might not have otherwise been predicted.
The second method for predicting buckling involved using rules and guidelines given by Det Norske Veritas (DNV), a ship classification society [26]. In many of the designs, some or all

48
of the vertical stiffeners were either detached from the shell or completely removed. This left unstiffened cylindrical and near-cylindrical sections. For each model, the unstiffened sections between adjacent ring stiffeners such as flanges were considered as separate unstiffened cylinders for the purposes of these calculations. Also, only the axial loading mechanism was considered, because the required value of base acceleration in the vertical direction was greater than for the other two directions, and because the uptake is nearly vertical, thus incurring minimal bending moments in vertical acceleration. The detailed equations for determining buckling are given in Appendix A. This method was applied by first using ABAQUS® to generate the von Mises, axial, circumferential and shear stresses resulting from the applied base acceleration for each relevant section of the uptake. The software MATLAB® was then used to read these values and apply the equations from DNV at each integration point of each relevant element of the finite element model, in order to find those elements at which the actual stress exceeded the critical buckling stress, and by what ratio.
7.3.1 Design Iteration
The design process used was iterative, using the results from prior designs in the process to address aspects that led to their failing to meet the design criterion. Figure 7.11 gives the primary modifications to the existing uptakes that were made in an attempt to produce a design that would meet the criterion. Also given in the figure are the highest stresses using the base acceleration method in the vertical direction. After a number of models had been analyzed, it was found that the vertical base acceleration shock consistently produced the greatest stresses, as was expected due to the fact that the greatest values of acceleration were required in this direction. The figure shows those models with maximum stresses below the design criterion of 199.08 MPa in green; those with stresses no more than five percent greater than this in orange; and all other failing models are shown in red. Also of note is the fact that the minimum model, that is, the model with all stiffeners and all non-essential flanges removed, resulted in a maximum stress of 300 MPa, well above the design criterion.

49
Figure 7.11. Uptake Design Modification Tree
1.
Original Model
142.5 MPa
1.1
Remove Top & Bottom Stiffeners
1.1.1
Detach Stiffeners
244.7 MPa
1.1.1.1
16mm Stiffeners
184.6 Mpa
1.1.1.2
Remove Outer 2 Stiffeners
1.1.1.2.1
24mm Stiffeners
197.6 MPa
1.1.1.2.2
Add 5cm Flange
239.6 MPa
1.1.1.3
Remove Outer 4 Stiffeners
1.1.1.3.1
48mm Stiffeners
232.1 MPa
1.1.1.3.2
Add 5cm Flange
325.7 MPa
1.1.1.4
Add 5cm Flange
204.9 MPa
1.1.1.4.1
Add 10 cm Flange
204.5 MPa
1.1.1.4.2
Add 2x 5cm Flanges
201.6 MPa
1.1.1.5
Detach Stiffeners to Lower Ends
1.1.1.5.1
Add 5cm Flange
239.6 MPa
1.1.1.5.2
Gap at Stiffener Ends
223.5 MPa
1.2
Remove Bottom Stiffeners
1.2.1
Detach Stiffeners
234.8 MPa
1.2.1.1
16mm Main Stiffeners
199.2 MPa
1.2.1.2
Add 5cm Flange
194 MPa
1.3
Detach Stiffeners
208.2 MPa
1.3.1
Add 5cm Flange
162.3 MPa

50
In order to incorporate the recommendations derived from the previous work and summarized above, and considering that the minimum model failed the design criterion, the intent of the design path was to remove as much material as possible and to remove as much of the constraint on the uptake shell as possible, while providing the stiffening required to meet the criterion. This was accomplished as follows:
a) Removed upper and lower and detach main stiffeners. In branch 1.1 of the figure, all models had the upper and lower vertical stiffeners removed and had the main stiffeners detached from the uptake shell, leaving them secured only to the mating flange and the foot flange at their upper and lower ends, respectively. Also, branches 1.1.1.2 and 1.1.1.3 had the outer two and four main stiffeners, respectively, removed from both the forward and the aft side of the uptake. The following modifications were then used to attempt to stiffen the structure to the required degree:
i) Increased stiffener thickness. The thickness of the stiffeners in each of these models was increased from its original value of 12mm. In model 1.1.1.1, with all main stiffeners remaining, a thickness of 16mm resulted in permissible stresses, and this was achieved with a thickness of 24mm for model 1.1.1.2.1, with the outer two flanges removed on each side. However, with the outer four flanges removed in model 1.1.1.2.2, subsequent increases in stiffener thickness had little effect on the stresses, with maximum values above 230 MPa even with stiffeners of 48mm thickness;
ii) Added stiffener flanges. It was anticipated that adding flanges to one or both sides of the outer edges of the stiffeners would greatly increase the stiffness of the supporting structure, essentially creating either angle- or T-beams. This was not very effective in the models with reduced numbers of main stiffeners, models 1.1.1.2.2 and 1.1.1.3.2. In the model with all main stiffeners remaining, adding a flange to one side of the stiffeners resulted in stresses only marginally outside the design criterion at 204.9 MPa. However, increasing this stiffening, by adding these flanges to both sides of the stiffeners in model 1.1.1.4.2 or by doubling the size of this flange in model 1.1.1.4.1, had nearly negligible effect on the values of the highest stresses. The largest flanges described here would leave a 15cm gap between the stiffeners to allow for welding the back side of the flanges. Larger flanges were not evaluated because it was anticipated that these would not be practical for fabrication;
iii) Detached stiffeners at lower ends. It was observed that the highest stresses in these models were consistently at the shell side of the lower ends of the main stiffeners. When detaching the stiffeners from the shell, the width of each stiffener was reduced by 2.5cm at its inside edge, except at each end, where it tapered out to meet shell, show in Figure 7.12 (I). The mechanism causing the high stress at this point was that a considerable part of the weight of the uptake was supported here where the uptake is attached to the foot flange. The foot flange could deflect easily in bending, while the perpendicular stiffener was being made to bend in plane. To address this, the tapered lower end of the stiffener was eliminated so that it did not come in direct contact with the shell, shown in Figure 7.12 (II) for model 1.1.1.5.1. The intent of this modification

51
was that the foot flange would be allowed to deflect somewhat without requiring in-plane deflection of the stiffener. However, this only allowed greater displacement and rotation of the foot flange, which again cause high stresses in the stiffener, not significantly reduced from their original values. Finally, in order to eliminate the displacement of the foot flange where it was connected to the corner of the stiffener, a gap was created in the foot flange at each of these points, shown in Figure 7.12 (III) for model 1.1.1.5.2. This had some effect in reducing the maximum stresses relative to the original detached stiffener model, but the stresses still exceeded the design criterion.
b) Removed lower and detached upper and main stiffeners. It was expected that leaving the main and upper stiffeners in the model would result in an improved load path such that the more of the weight of the structure would be supported by the stiffeners. It was anticipated that this would in turn reduce the maximum stresses in the model. This was the case for model 1.2.1, which resulted in lower stresses than model 1.1.1, though these still exceeded the design criterion. In model 1.2.1.1, however, the stresses were greater than in model 1.1.1.1, which was not expected. In both cases, however, the maximum stresses were acceptable; and
c) Detached upper and main stiffeners. In model 1.3, with no components removed, there was insufficient strength, but adding flanges to the main stiffeners in model 1.3.1 resulted in the lowest stresses of any of the modifications.
Figure 7.12. Detached Main Stiffener Modifications
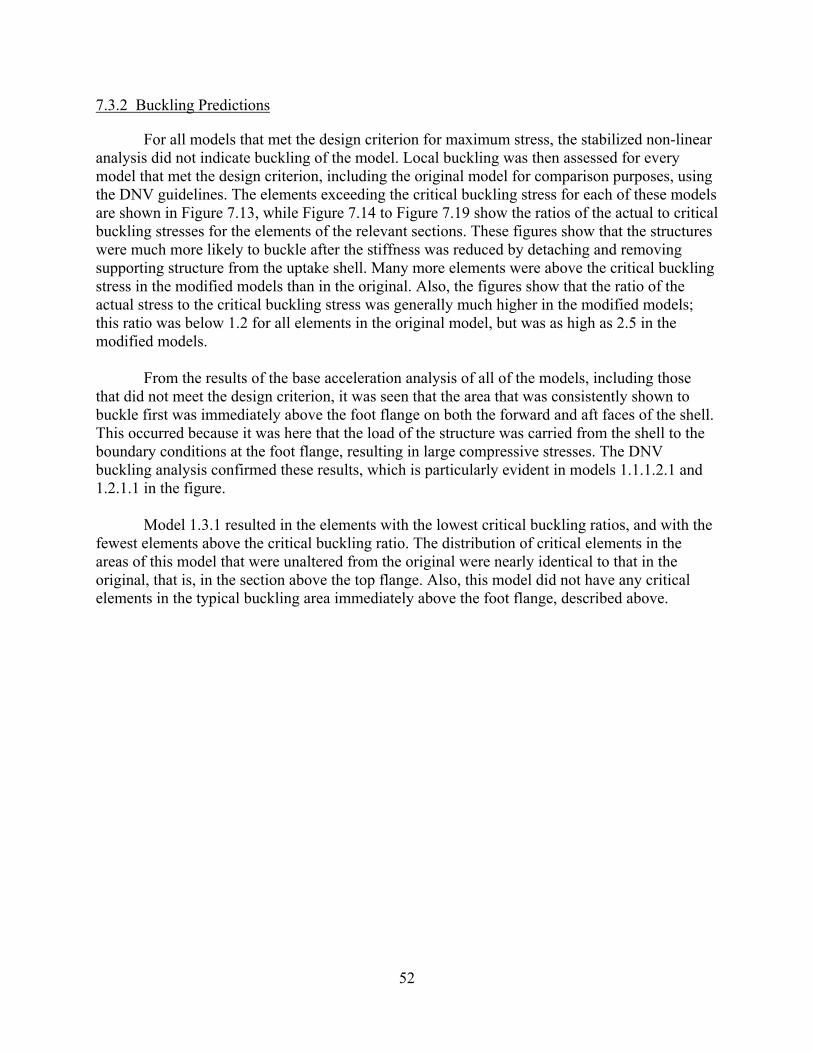
52
7.3.2 Buckling Predictions
For all models that met the design criterion for maximum stress, the stabilized non-linear analysis did not indicate buckling of the model. Local buckling was then assessed for every model that met the design criterion, including the original model for comparison purposes, using the DNV guidelines. The elements exceeding the critical buckling stress for each of these models are shown in Figure 7.13, while Figure 7.14 to Figure 7.19 show the ratios of the actual to critical buckling stresses for the elements of the relevant sections. These figures show that the structures were much more likely to buckle after the stiffness was reduced by detaching and removing supporting structure from the uptake shell. Many more elements were above the critical buckling stress in the modified models than in the original. Also, the figures show that the ratio of the actual stress to the critical buckling stress was generally much higher in the modified models; this ratio was below 1.2 for all elements in the original model, but was as high as 2.5 in the modified models.
From the results of the base acceleration analysis of all of the models, including those that did not meet the design criterion, it was seen that the area that was consistently shown to buckle first was immediately above the foot flange on both the forward and aft faces of the shell. This occurred because it was here that the load of the structure was carried from the shell to the boundary conditions at the foot flange, resulting in large compressive stresses. The DNV buckling analysis confirmed these results, which is particularly evident in models 1.1.1.2.1 and 1.2.1.1 in the figure.
Model 1.3.1 resulted in the elements with the lowest critical buckling ratios, and with the fewest elements above the critical buckling ratio. The distribution of critical elements in the areas of this model that were unaltered from the original were nearly identical to that in the original, that is, in the section above the top flange. Also, this model did not have any critical elements in the typical buckling area immediately above the foot flange, described above.

53
Figure 7.13. Critical Buckling Elements

54
Figure 7.14. Buckling Critical Stress Ratios, Model 1
Figure 7.15. Buckling Critical Stress Ratios, Model 1.1.1.1
Figure 7.16. Buckling Critical Stress Ratios, Model 1.1.1.2.1

55
Figure 7.17. Buckling Critical Stress Ratios, Model 1.2.1.1
Figure 7.18. Buckling Critical Stress Ratios, Model 1.2.1.2
Figure 7.19. Buckling Critical Stress Ratios, Model 1.3.1

56
7.4 TIME-HISTORY RESULTS
The original model was subjected to the acceleration time-history described above. The response at the time step with the maximum stress response, at 0.07 seconds, is shown in Figure 7.20(I), while the maximum response of each element over the entire event is given in Figure 7.20(II). Though parts of the model were shown to have exceeded the design criterion maximum allowable stress of 199.08 MPa, the maximum stress of 264.4 MPa corresponds to a strain of approximately 2%, which is far from the ultimate strength at 51% strain. Also, nearly the entire model remained below the design criterion stress; the areas most highly stressed were those sections of the circumferential flanges farthest from the vertical stiffeners. Thus, because these areas are not directly supporting the weight of the structure, and because of their relatively low stresses, it would be unlikely that the structure would fail. Also, the fact that the described time-history was very conservative indicates that it is likely that the response of the structure would be improved in a less-conservative shock event.
Figure 7.20. Original Model, Time-History Analysis
After selection, the final design was subjected to the same time-history as described
above. However, the analysis was stopped when the response was shown to reach 300 MPa, approximately 50 percent above the design criterion yield stress. This occurred after 17 milliseconds of the 200 millisecond event; the final stress distribution is given in Figure 7.21.

57
The areas that resulted in the greatest stress were at the inside top ends of the upper stiffeners. This result was significantly worse than for the original model. However, these poor results were not taken as showing that the model failed to meet the design criteria. Rather, because the time-history was considerably conservative, and because it was not derived from an actual characteristic shock event, it is likely that reanalysis in a more typical event would give better, more realistic results.
Figure 7.21. Final Design, Time-History Analysis
7.5 FINAL DESIGN
The final design selected was model 1.3.1. This model is shown in Figure 7.22, and the resulting maximum stresses, as compared to the original and minimum models, are given in Table 7.4. The modifications made to the original uptake were:
a) The inner edges of the main stiffeners were detached from the shell and 2.5cm of material was eliminated, and this gap was tapered to meet the shell at the circumferential flanges;
b) The inner edges of the upper stiffeners were detached as described above for the main stiffeners; and
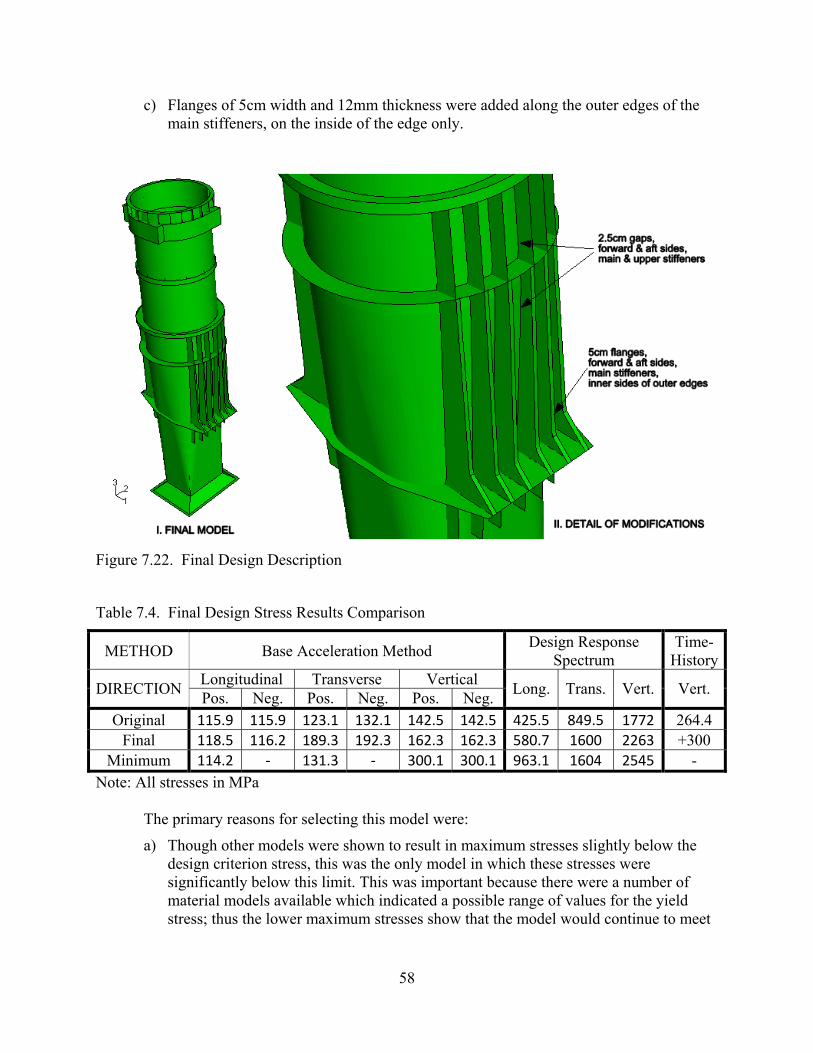
58
c) Flanges of 5cm width and 12mm thickness were added along the outer edges of the main stiffeners, on the inside of the edge only.
Figure 7.22. Final Design Description
Table 7.4. Final Design Stress Results Comparison
METHOD Base Acceleration Method Design Response Spectrum
Time-History
DIRECTION Longitudinal Transverse Vertical Long. Trans. Vert. Vert. Pos. Neg. Pos. Neg. Pos. Neg. Original 115.9 115.9 123.1 132.1 142.5 142.5 425.5 849.5 1772 264.4
Final 118.5 116.2 189.3 192.3 162.3 162.3 580.7 1600 2263 +300 Minimum 114.2 ‐ 131.3 ‐ 300.1 300.1 963.1 1604 2545 -
Note: All stresses in MPa
The primary reasons for selecting this model were:
a) Though other models were shown to result in maximum stresses slightly below the design criterion stress, this was the only model in which these stresses were significantly below this limit. This was important because there were a number of material models available which indicated a possible range of values for the yield stress; thus the lower maximum stresses show that the model would continue to meet

59
the requirements of the base acceleration method against a more conservative criterion;
b) It was shown that the susceptibility of this model to buckling was similar to that of the original model. Given that the original model was also shown to slightly exceed critical buckling stresses in some areas, and given that the use of a modified design with a small likelihood of buckling would be better than continued use of the original, cracked uptakes, the benefits of the modified model were deemed to outweigh this small deficiency.
One aspect of this model that may result in its eventual rejection is the fact that it did not require the removal of the lower stiffeners, and left them attached to the uptake shell along their entire lengths. Thermally-induced cracking has not been shown to be a concern in this area at present. However, it is conceivable that thermal analysis would show that these stiffeners might result in fatigue cracking at some time during the life of the class of ship. If this were the case, it would be highly wasteful to invest in correcting the original cracking problem without addressing an anticipated future problem. Thus, if this is in fact the case, it is recommended that a different model from this work, which has been shown to meet the base acceleration shock criteria, be selected for further thermal analysis.

60
8. FUTURE WORK
The final design presented here has been optimized for shock resistance while incorporating design aspects anticipated to reduce thermally induced stresses. In order to continue the development of a viable design, the next stage of the design process would be to analyze the model in thermal loading representing operation of the gas turbine. If the maximum stresses from this next stage were below a value that would result in fatigue cracking over the remaining life of the class of ship, the design could be accepted as it is presented here. If the thermal stresses were still excessive, the design might require further modifications, in which case it would subsequently require reanalysis in shock loading.
The structural redesign of the uptake is not the only option available to address the problem of uptake thermal cracking. All potential solutions should be compared and a selection should be made based on the merits of the best design, most likely based on factors such as lowest cost and minimal time alongside. Some potential options include:
a) Fitting a inner insulating lining the entire length of the uptake, as previously recommended;
b) Taking no action except to repair cracks as they appear;
c) Replacing the uptakes with a completely new structure which incorporates more recent trends in uptake design; or
d) Introducing exhaust gas cooling, using a heat exchanger, water injection into the gas stream, or a similar method.
Future or replacement uptake designs would benefit from incorporating the following
design aspects:
a) Minimizing the stiffening structure attached to the uptake shell, which would reduce constraints to thermal expansion;
b) Fabricating the structure from a number of sections, each individually mounted, and connected in the gas path by flexible expansion joints. This would reduce the inertial forces in shock, reducing the size of required structural components, thus reducing the likelihood of thermally induced stresses;
c) Using trunnion-mounting, which eliminates bending stresses, allows for thermal expansion, and reduces transmission of heat to the ship structure;
d) Ensuring mounting points are at or near the center of gravity of the structure, which would serve to minimize and level the shock stresses above and below the mounting point; and
e) Providing insulation either internally or both internally and externally, rather than only externally.

61
9. CONCLUSION
A number of modified uptakes were shown to meet the requirements of the base acceleration method for shock design, each one incorporating alterations anticipated to reduce the thermally-induced fatigue stresses in the structure. A final design was selected which had the lowest stress results as compared to the other modified models, and which was shown to be the least likely to buckle in a shock event.
It was originally intended that the DRS method would be used in this design process. However, the initial model failed to meet the design criteria when analyzed by this method, as did all subsequent modifications. Thus the base acceleration method was used to assess whether each model met the design requirements. The DRS method and the time-history method were used to further assess the behavior of the models. The use of these different methods gave significantly different results, not just in terms of maximum stress values, but in terms of the mechanisms causing high stresses, and the resulting stress distributions and deformation shapes. Thus it was difficult, if not impossible, to make modifications that would address the critical aspects causing high stresses from each of the design methods.

62
REFERENCES
1. Drawing No. HFX-D24-294-000-01 Arrangement of Propulsion & Auxiliary Intakes & Exhausts. Department of National Defence, August 17, 2004.
2. Intra Acoustics Co. Ltd. Drawing No. 8705040 Gas Turbine Uptake (Starboard) Modification D. Department of National Defence, July 3, 1994.
3. Canadian Forces Technical Order D-03-003-007/SF-000 Issue 4: Specification for Design and Test Criteria for Shock Resistant Equipment in Naval Ships. Department of National Defence, 1978.
4. Balan, L. Numerical Analysis of Halifax Class LM2500 GT Uptakes (Draft 1). Halifax, NS : Fleetway Inc., 2007.
5. Drawing No. HFX-D24-679-000-01 Gas Turbine Exhaust System Diagram. Department of National Defence, August 17, 2004.
6. Drawing No. HFX-D27-780-000-02 Schedule of Pipework Insulation. Department of National Defence, October 1, 2004.
7. Intra Acoustics Co. Ltd. Drawing No. 8705038 Gas Turbine Uptake Thermal Lagging (Starboard) Modification D. Department of National Defence, July 8, 1994.
8. Potential Master's Degree Thesis for MIT and UCL Students: Numerical Analysis of CPF LM2500 Uptakes Subjected to Shock Loading. Department of National Defence, 2007.
9. Balan, L. GT024 - Phase I: Gas Turbine Finite Element Analysis (Draft 1). Halifax, NS : Fleetway Inc., 2007.
10. Oliver Hazard Perry (FFG 7) Class Uptake Cracking. Koscinski, W.H. and Johnson, R.G. Jr. s.l. : Naval Sea Systems Command, Gas Turbine Surface Combatant Program Office (PMS314), 14 April 1989. Association of Scientists and Engineers - 26th Annual Technical Symposium.
11. Stress Analysis and Life Predictions of Ship Propulsion System Gas Turbine Uptake Structures. Farrington, H.O., et al. May 1990, Naval Engineers Journal, pp. 263-274.
12. A Radical Reassessment of the Design of Uptake and Downtake Systems for Marine Propulsion Engines. Hall, K. London : Royal Institution of Naval Architects, 14-15 November 1989. International Conference on New Developments in Warship Propulsion.
13. Chopra, A.K. Dynamics of Structures: Theory and Applications to Earthquake Engineering. Third Edition. Upper Saddle River, NJ : Pearson Prentice Hall, 2007.
14. Wilson, E. Design Analysis Using Response Spectrum Seismic Loading. [Online] December 2, 1998. [Cited: April 6, 2008.] http://www.csiberkeley.com/Tech_Info/15.pdf.
15. Abaqus Version 6.6 Documentation. Abaqus Analysis User's Manual. [Online] 2006. [Cited: April 6, 2008.] http://icl4.mit.edu:2080/v6.6/books/usb/default.htm.
16. Prediction of Shock Response for a Quadrupod-Mast Using Response Spectrum Analysis Method. Liang, C.C., Yang, M.F. and Tai, Y.S. 8, Elmsford, NY : Pergamon Press, 2002, Ocean Engineering, Vol. 29, pp. 887-914.

63
17. Drawing No. 976446 G.T. Exhaust Trunk Liner Details. Department of National Defence, April 3, 2000.
18. Rasmussen, K.J.R. Full-range Stress-strain Curves for Stainless Steel Alloys. Sydney, Australia : Department of Civil Engineering, The University of Sydney, 2001. Research Report R811.
19. Design Manual for Structural Stainless Steel. Third Edition. Euro Inox and the Steel Construction Institute, 2006.
20. Harvey, P.D., [ed.]. Engineering Properties of Steel. Metals Park, OH : American Society for Metals, 1982.
21. Roxul Inc. Canadian Internet Site. Technical Product Information Roxul RHM. [Online] January 25, 2008. [Cited: April 8, 2008.] http://www1.roxul.com/graphics/RX-NA/Canada/Product%20Literature/Tech%20Data/RHM-Marine-1-25-08.pdf.
22. BGF Industries, Inc. Techmat(R) 1200F High Temp. Thermal Insulation. [Online] [Cited: April 8, 2008.] http://www.bgf.com/prodInsulTechMatApp.asp.
23. An Experimental Study on Damping Characteristics of Thermal Insulation. Chiba, T. and Kobayashi, H. New York, NY : American Society of Mechanical Engineers, 1985, Journal of Pressure Vessel Technology, Vol. 100, pp. 17-23.
24. Survey of Current Studies in Damping and New Design Values for Nuclear Piping Systems in Japan. Hara, F. Brussels : North-Holland, Amsterdam, Ne, 1985. Transactions of the 8th International Conference on Structural Mechanics in Reactor Technology. Vol. K(b) Seismic Response Analysis of Nuclear Power Plant Systems, pp. 321-326.
25. Didoszak, J.M., Shin, Y.S. and Lewis, D.H. Shock Trial Simulation for Naval Ships. Monterey, CA : Naval Postgraduate School, 2004.
26. Guidlines and Classification Notes. Hovik : Det Norske Veritas Classification AS, 1992.

64
APPENDIX A: DNV CYLINDER BUCKLING CRITERIA
(From [26]) The following nomenclature is used in this section: distance between ring frames shell radius shell thickness cylinder length Young’s modulus yield stress elastic buckling resistance
reduced buckling coefficient Poisson’s ratio buckling coefficient
imperfection factor buckling coefficient buckling coefficient curvature parameter
critical value of von Mises stress buckling parameter von Mises stress axial stress due to compression axial stress due to bending circumferential stress due to lateral or hydrostatic pressure
shear stress due to torsion and shear forces critical value of axial stress due to compression critical value of axial stress due to bending critical value of circumferential stress due to lateral or hydrostatic pressure
critical value of shear stress due to torsion and shear forces
Unstiffened cylinders should be evaluated for the following buckling modes if the associated criteria are exceeded:
a) Shell buckling:
i) Axial;
ii) Torsion and shear force:
3.85

65
iii) Lateral or hydrostatic pressure:
2.25
e) Column buckling:
It can be shown that, for the applicable dimensions of the different sections of the uptake,
none of the above criteria apply. Thus the structure need only be evaluated for axial buckling. The elastic buckling resistance is given as:
12 1
The reduced buckling coefficient depends on the buckling coefficient for the perfect shell
and on the imperfections in the cylinder:
However, where information about the imperfections is not available, the reduced buckling coefficient can be taken as:
1
The coefficients for shell buckling in axial stress are:
1
0.702
0.5 1 150.
1

66
Buckling will occur when the von Mises stress reaches the critical value:
√1
This critical stress is defined by the following parameter:
Where consideration is given only to axial buckling due to compression, this reduces to:
This criterion depends only on compressive forces, as buckling will not occur in tension:
0 0
0