Fuel Design for LTC Applications: Quantifing Fuel ... · PDF fileFUEL DESIGN FOR LTC...
26
FUEL DESIGN FOR LTC APPLICATIONS: QUANTIFYING FUEL PERFORMANCE IN GCI ENGINES S. SCOTT GOLDSBOROUGH, STEPHEN CIATTI, TOBY ROCKSTROH, KHANH CUNG, ALEKSANDR FRIDLYAND (ANL); WILLIAM CANNELLA (CHEVRON) 09 JUNE 2016 Project ID # FT045 FY2016 DOE Vehicle Technologies Program Annual Merit Review Advanced Combustion Engine R&D / Fuel and Lubricant Technologies Thursday, June 9, 2016 Program Manager: Kevin Stork This presentation does not contain any proprietary, confidential or otherwise restricted information
Transcript of Fuel Design for LTC Applications: Quantifing Fuel ... · PDF fileFUEL DESIGN FOR LTC...

FUEL DESIGN FOR LTCAPPLICATIONS: QUANTIFYING FUEL PERFORMANCE IN GCIENGINES
drhgfdjhngngfmhgmghmghjmghfmf
S. SCOTT GOLDSBOROUGH, STEPHEN CIATTI, TOBY ROCKSTROH, KHANH CUNG, ALEKSANDR FRIDLYAND (ANL); WILLIAM CANNELLA (CHEVRON)
09 JUNE 2016
Project ID # FT045FY2016 DOE Vehicle Technologies Program Annual Merit ReviewAdvanced Combustion Engine R&D / Fuel and Lubricant TechnologiesThursday, June 9, 2016Program Manager: Kevin Stork
This presentation does not contain any proprietary, confidential or otherwise restricted information

OVERVIEW
Partners ANL – Lead, Goldsborough (PI) Chevron Energy Technology
Company (CETC) – provides fuels, blending and characterization, technical expertise
Barriers Lack of fuel quality specifications
for petroleum and non-petroleum based fuels
Inadequate data and predictive tools for fuel property effects on combustion and engine efficiency optimization
Timeline Project started FY 2015 Project ends FY 2017 50 % complete
Budget Total project funding
– DOE share: $1,000 k– CETC in-kind: $273 k
FY 2016 DOE / VTP funding– $325 k
2

OBJECTIVES AND RELEVANCE TO DOE
Formulate and validate new few quality metrics (FQM) that can overcome limitations of conventional and modern fuel rating indices (RON, OI) towards predicting the performance of, and operating parameters required for, petroleum and non-petroleum based fuels across a variety of LTC operating modes, e.g., homogeneous charge compression ignition (HCCI), partially premixed combustion (PPC).
New fuel quality metrics could be utilized to overcome technical barriers that currently inhibit the specification of fuels for, and design/deployment of LTC-capable engines in the ground vehicle fleet, thereby enabling required gains in engine efficiency and pollutant reductions.
3

PROJECT APPROACH

PROJECT APPROACH
Utilize ANL’s RCM to acquire fundamental autoignition data at relevantconditions; understand effects of fuel composition on LTC trends (e.g.,τ, LTHR); formulate correlation based on data. Employ GCI engine withvariety of fuels; generate testing protocol; validate FQM correlation.
Rapid Compression Machine / GCI Engine Experiments
Rapid Compression Machine (RCM)
Gasoline Compression Ignition(GCI) Engine
5

PROJECT MILESTONESFY2015/2016
Phase Milestone StatusI – Baseline
Gasoline(FY2015)
Physico-chemical characterization of baseline gasoline (RON/MON, D86 distillation, DHA, heat of combustion, etc.)
RCM tests with fuel – parametric sweeps covering temperature, pressure; identify trends of τ, LTHR, ITHR
GCI engine tests with fuel – parametric sweeps covering speed / load; identify trends with boost, injection(s) timing, EGR, swirl
Correlation development for RCM and GCI engine – formulate operating points for FQM validation at T/P conditions; demonstrate agreement between experimental platforms
II – Blended Gasolines (10% v./v.)(FY2016)
Physico-chemical characterization of 10% v/v blended gasolines (RON/MON, D86 distillation, DHA, heat of combustion, etc.) ongoing
Extend FQM correlation to account for φ-sensitvity, EGR-tolerance, covering range of conditions ongoing
RCM tests with blended fuels to facilitate extension of FQM ongoingGCI engine tests with blended fuels at FQM validation test
points; identify deficiencies / needs ongoing
6

TECHNICAL ACCOMPLISHMENTS / PROGRESS

TECHNICAL ACCOMPLISHMENTS / PROGRESS
Modifications to twin-piston RCM– Implemented high-speed DAQ card (1 MHz, 16-bit) to improve heat release
analysis during high-temperature heat release;– Redesigned heating system / control for mixture feedline from supply tank;– Refined post-processing script to identify / quantify LTHR, ITHR;– Incorporated high-precision, automated feed valve for reaction chamber ;– Previously limited to ~16 shots/day; up to 40 shots/day now possible,
excellent repeatability.
Modifications to multi-cylinder GCI engine– GT Power model developed for baseline operating
condition to assess IVC in-cylinder conditions;– Redesigned supercharger pulley to achieve wider
range of boosted intake pressures (Pin = 1.0–1.4 bar at idle) for stable operation with high to low reactivity fuels;
– Created post-processing script to identify / quantify LTHR, ITHR, compare with RCM data.
1234
Supercharger
Uncooled EGR Loop
Cooled EGR Loop
Heat Exchanger
Exhaust Outlet
Ambient Intake Air (from LFE)
Bypass Valve
Heat Exchanger
Intake Air (+ EGR)
Exhaust
Turbocharger

TECHNICAL ACCOMPLISHMENTS / PROGRESS
Fuel blending– Baseline gasoline, and blends doped with single-component surrogates
representing variety of structural classes (e.g., alkanes, aromatics, alcohols)• 10% vol./vol. fuels covering RON ≈ 80–92, S ≈ 1.5–8• 20% vol./vol. fuels covering RON ≈ 73–97, S ≈ 0–11
Physical characterization– ASTM tests for RON/MON, specific gravity, H:C ratio, average MW, net heat
of combustion, D86 distillation, detailed hydrocarbon analysis (DHA)
Fuel blending and physico-chemical characterization
9
TECHNICAL ACCOMPLISHMENTS / PROGRESS
Identified / quantified reactivity trends covering low to intermediate temperatures and range of engine-relevant pressures, using nominal fuel loading (φ) and dilution (%O2)
Achieved excellent repeatability over entire NTC regime
RCM measurements of baseline fuel
10

TECHNICAL ACCOMPLISHMENTS / PROGRESS
Quantified trends of low- and intermediate-temperature heat release (LTHR, ITHR) over range of temperature, pressure– LTHR found to be greater at lower temperature, higher pressure– ITHR found to be greater at lower temperature, lower pressure
RCM measurements of baseline fuel
11

TECHNICAL ACCOMPLISHMENTS / PROGRESS
Parametric sweeps covering 5 speed / load points– Quantified reactivity and emissions trends with boost, start of injection
(SOI), number of injections, EGR rate, swirl, injection pressure– Identified challenges / limits for FQM validation; consistent, stable operation
with wide variety of fuels requires careful definition of target conditions
GCI engine measurements of baseline fuel
12

TECHNICAL ACCOMPLISHMENTS / PROGRESS
Parametric sweeps covering 5 speed / load points– Quantified reactivity and emissions trends with boost, start of injection
(SOI), number of injections, EGR rate, swirl, injection pressure– Identified challenges / limits for FQM validation; consistent, stable operation
with wide variety of fuels requires careful definition of target conditions
GCI engine measurements of baseline fuel
firstinjection
secondinjection
13
TECHNICAL ACCOMPLISHMENTS / PROGRESS
Formulated test points (engine / RCM) for FQM validation– Engine operating conditions selected to:
• Isolate temperature and pressure influences on fuel reactivity– Low-speed, low-load, very early SOI (quasi-HCCI)
• Isolate φ–sensitivity, EGR-tolerance of fuel reactivity– Mid-speed, mid-load, late/multiple SOIs (PPC)
– RCM conditions selected to:• Replicate quasi-HCCI operating condition (T, P, φ, EGR) for direct comparison
against GCI engine measurements – demonstrating agreement between static reaction chamber, and variable-volume engine environments
• Quantify reactivity trends over wide range of conditions which could be seen across a variety of LTC concepts to ensure broad applicability of FQM
Correlation between GCI engine and RCM
14

TECHNICAL ACCOMPLISHMENTS / PROGRESS
Low-speed, low-load, very early SOI (quasi-HCCI) operation– 1000 rpm, near-minimum fueling, SOI = -141 aTDC– Constant phasing sweeps: vary Tin = 30–75 C, adjusting Pin to hold CA10 fixed– Identify compressed conditions (Tc, Pc) during Tin–Pin sweep for comparison
against RCM data
Correlation between GCI engine and RCM
CA10
superchargerlimit near idle
intercoolerlimits near idle
15
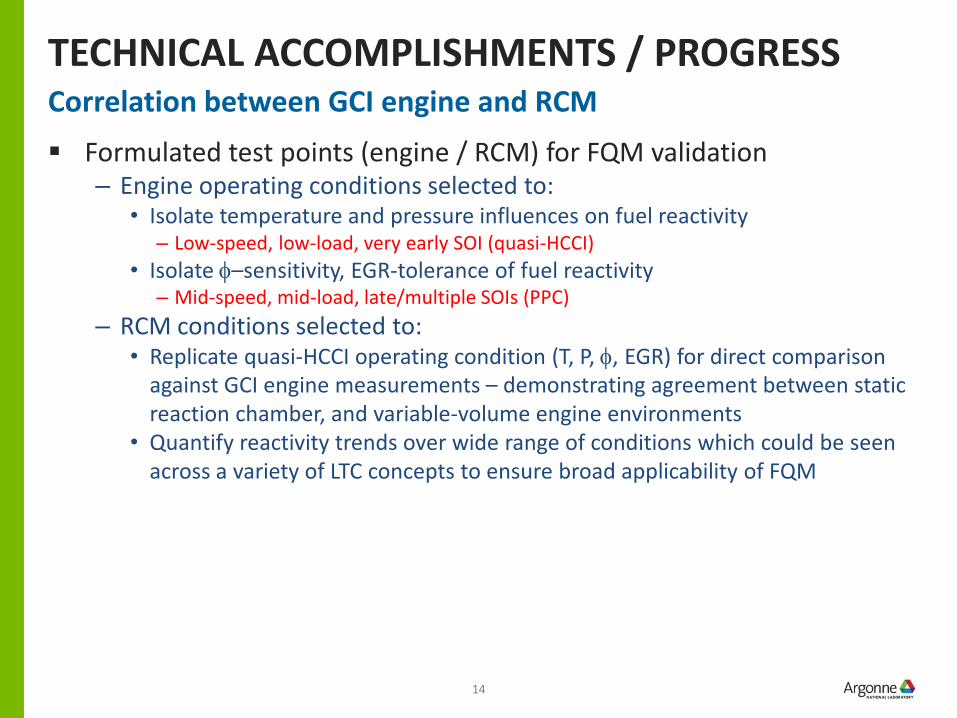
TECHNICAL ACCOMPLISHMENTS / PROGRESS
Low-speed, low-load, very early SOI (quasi-HCCI) operation– 1000 rpm, near-minimum fueling, SOI = -141 aTDC– Constant phasing sweeps: vary Tin = 30–75 C, adjusting Pin to hold CA10 fixed– Identify compressed conditions (Tc, Pc) during Tin–Pin sweep for comparison
against RCM data
Correlation between GCI engine and RCM
superchargerlimit near idle
intercoolerlimits near idle
CA10
16

TECHNICAL ACCOMPLISHMENTS / PROGRESS
RCM tests using identical fuel loading, covering Tc /Pc representative of conditions experienced by in-cylinder charge during compression– Overlaid T/P trajectories for three engine cases indicates good
correspondence, relevant chemistry captured in RCM experiments
Correlation between GCI engine and RCM
Tin = 67 C
Tin = 30 C
17

TECHNICAL ACCOMPLISHMENTS / PROGRESS
RCM tests using identical fuel loading, covering Tc /Pc representative ofconditions experienced by in-cylinder charge during compression– Constant combustion phasing in engine (CA10) corresponds to RCM data
at trajectory of constant ignition delay (τ ≈ 3 ms)
Correlation between GCI engine and RCM
τ = 3 ms
18

TECHNICAL ACCOMPLISHMENTS / PROGRESS
RCM tests using identical fuel loading, covering Tc /Pc representative of conditions experienced by in-cylinder charge during compression– Comparison between conditions in engine required for constant CA10,
and those in RCM required for iso-τ highlighted in (Tc–Pc) representation
Correlation between GCI engine and RCM
19

RESPONSE TO REVIEWER COMMENTS
Project was not reviewed last year.
20
COLLABORATION / COORDINATION
Chevron continuing to blend / characterize fuels– Remaining Phase II fuels to be delivered in FY2016, Q3/Q4
• Fuel storage facility at ANL has limited space, but small quantities delivered to RCM facility for testing
• Physico-chemical characterization enables planning of RCM and GCI engine tests– Phase III fuels delivered by FY2017, Q2
RCM / GCI engine comparisons– Iteration of FQM testing protocol within RCM, and operating conditions to
be used in GCI engine for validation is ongoing– Refinement of analysis tools, e.g., extension of GT Power model over wider
range of conditions, will reduce uncertainties in comparison between RCM and GCI engine data
21
REMAINING CHALLENGES / BARRIERS
Demonstrated correlation between RCM experiments, and trends observed in GCI engine under quasi-HCCI operation, but– mechanical constraints of multi-cylinder engine, e.g., super-/turbo-
charger, compression ratio, valve timing, noise, limit the operating range for comparison between fuels. Testing protocol iteratively designed / refined to quantitatively rank fuels under various operating regimes. Extension of operating range for engine may be possible, but would require hardware modifications, e.g., piston compression ratio.
Development of test point for stratified condition (φ, EGR effects)– Careful definition / iteration required to ensure apple-to-apple
comparison where fuel effects are quantitatively isolated
Influence of heat of vaporization (HOV) still challenging to quantify, but will be considered in FY2017
22

PROPOSED FUTURE WORK
Nominal FQM test conditions selected for RCM, and tests underway with Phase I blended fuels.– FQM test series designed to identify / quantify fuel response to φ-
gradients and EGR-tolerance experienced during engine operation.
GCI engine validation test points will be defined to quantitatively rank fuels under stratified conditions, e.g., late SOI, and EGR-diluted operation.– Validation tests with Phase II, 10% blended fuels during FY2016, Q4
Extension of tests to Phase III 20% v./v. blended fuels– Modifications to FQM and validation test points may be necessary
depending on unexpected changes in reactivity trends;– Modifications to supercharger (e.g., smaller pulley), addition of heater in
intake manifold, etc. could extend Tc /Pc, operating window for validation tests.
23

SUMMARY
Fuel Quality Metric under development to overcome limitations of conventional and modern fuel rating indices (RON, OI)– FQM will enable specification fuels for, and design of LTC-enabled engines,
highlighting parameters that are controllable, e.g., boost, stratification, EGR
FY2015/16 accomplishments and progress include:– Fuels with range of reactivity and molecular structure blended with physico-
chemical properties characterized– RCM utilized to fundamentally understand autoignition trends (τ, LTHR) of
fuels in matrix, and formulate FQM protocol– GCI engine experiments used to quantify fuel influences over range of
operating conditions (speed/load), validate FQM– Engine validation point designed to isolate T/P influences at LTC conditions;
validation test point(s) to isolate φ–sensitivity, EGR–tolerance will be established by end of FY2016
– Excellent correlation demonstrated between RCM and GCI engine data under quasi-HCCI conditions for baseline gasoline• Further testing underway with Phase II fuels

www.anl.gov
THANK YOU

TECHNICAL BACK-UP
Design of Experiments covering range of speed/load– Variations in fuel injection pressure, start of injection,
air-fuel ratio (λ), intake manifold pressure, and fuel type
Analysis highlights dominant parameters– Effects on combustion phasing (CA10, CA50), IMEP, COV,
noise, BFSC, and NOx, HC and CO emissions
GCI engine measurements of 10% blended fuels
SOI sweep, and DOE results
Engine Speed 1000 rpm 2000 rpm*
UnitLevel Low High Low High
DOE 1
Boost 0.2 0.45, 0.3 barInjection pressure (P)n 400 600 400 600 barStart of injection (S)n 15 141 70/20 70/40 deg. BTDC
Lambda (L)n 3.6 4.5 2.7, 2.5 3.7, 3.5Fuel (F)n F1 F2 F1 F2
DOE 2
Lambda 4.2 3.1, 3.0Injection pressure (P)n 400 600 400 600 barStart of injection (S)n 15 141 70/20 70/40 deg. BTDC
Boost (B)n 0.15 0.3 0.35, 0.2 0.55, 0.4 bar
Fuel (F)n F1 F2 F1 F2
Effect
P S B F PS PB PF SB SF BF PSB PSF SBF PBFPSBF
Nor
mal
ized
[a.u
.]
-1.5
-1.0
-0.5
0.0
0.5
1.0
1.5
IMEPCOVNoiseBSFC
Effect
P S B F PS PB PF SB SF BF PSB PSF SBF PBFPSBF
Nor
mal
ized
[a.u
.]
-1.5
-1.0
-0.5
0.0
0.5
1.0
1.5
CA10CA50CA90
26