Fuel Cell Membrane-Electrode-Assemblies with Ultra-Low Pt ...Fuel Cell Membrane...
26
Fuel Cell Membrane-Electrode-Assemblies with Ultra-Low Pt Nanofiber Electrodes Peter N. Pintauro Department of Chemical and Biomolecular Engineering Vanderbilt University, Nashville, TN 37235 June 14, 2018 Project ID: # FC158 This presentation does not contain any proprietary, confidential, or otherwise restricted information
Transcript of Fuel Cell Membrane-Electrode-Assemblies with Ultra-Low Pt ...Fuel Cell Membrane...

Fuel Cell Membrane-Electrode-Assemblies with Ultra-Low Pt Nanofiber Electrodes
Peter N. Pintauro
Department of Chemical and Biomolecular EngineeringVanderbilt University, Nashville, TN 37235
June 14, 2018
Project ID: # FC158
This presentation does not contain any proprietary, confidential, or otherwise restricted information

Project Start Date: 11/1/2016(subcontracts and NDAs were not signed until early 2017)
Project End Date: 12/31/2019 Percent complete: 47%
Total Project Budget: $3,173,854 Total Recipient Share: $640,291 Total Federal Share: $2,533,563 Total Funds Spent: $794,319
= $652,395 (DOE)+$141,924 (recipient)
Barrier Addressed:o High current density performance of MEAs
is low for low cathode Pt-loading Targets: DOE 2020 performance
targets for MEAso Anode + Cathode Pt loading ≤ 0.125 mgPt/cm2
o 65% peak efficiencyo 5,000 hour durabilityo > 1W/cm2 at rated power
Nissan Technical Center North America (NTCNA)
Georgia Institute of Technology (GaTech)
Project Lead: Peter N. Pintauro, Vanderbilt University (VU)
Overview
Timeline and Budget Barriers and Targets
Partners
2

Project Relevance and ObjectivesProject Relevance:
• The VU/GaTech/NTCNA team seeks to better understand and further improve theperformance and durability of low Pt loaded nanofiber mat fuel cell electrodes and MEAs.
• This project was selected to address the EERE/FCTO mission to advance PEMFCtechnology for automotive applications and is part of the FC-PAD consortium.
Project Objectives:• Fabricate, characterize, and evaluate nanofiber mat electrode MEAs with highly active
ORR catalysts for hydrogen/air fuel cells
• Focus on nanofiber cathodes with commercial Pt-alloy catalysts and Pt-Ni octahedra catalysts prepared at GaTech, with various ionomer and blended polymer binders.
• The nanofiber mat cathode/anode composition and morphology will be identified for MEAs that meet the DOE’s 2020 performance and durability targets:
Pt loading: ≤ 0.10 mg/cm2 cathode and ≤ 0.025 mg/cm2 anode; > 1 W/cm2 at rated power for T = 80-95oC; <40% drop in ORR mass activity after load cycling, <5% drop in voltage at 1.2 A/cm2
after unmitigated start up-shut down and < 10% loss in rated power after drive cycle durability.
• Improved power output at low relative humidity (40% RH), especially at high current density
• Generate insightful understanding regarding the structure and function of electrospun nanofiber electrodes to guide future nanofiber electrode R&D
3

Approach
1. Prepare nanofiber and sprayed electrode MEAs with commercial PtCo/C and PtNi/C cathodes with various binders (VU for nanofibers and painted cathodes; Nissan for sprayed cathodes).
2. Evaluate MEA performance and durability. Optimize the nanofiber cathode mat composition and mat morphology to maximize fuel cell power output and durability at high and low relative humidity conditions (VU and Nissan).
3. Synthesize Pt-Ni octahedra catalysts with high ORR activity; Type-1 with no Pt coating and Type-2 with a Pt nanolayer coating (GaTech).
4. Incorporate the octahedra Pt-Ni catalysts into nanofiber and sprayed electrode MEAs with selected ionomer binders (VU and Nissan).
5. Collaborate with FC-PAD researchers at National Labs to: (1) verify MEA performance, (2) assess durability, (3) perform diagnostic tests, and (4) begin structural characterization of fibers.
4

Collaborations – Team Members
Vanderbilt University (Prime) led by Peter Pintauro (project PI) and Dr. RyszardWycisk (technical contact)
• Electrospins nanofiber mat electrodes with different catalysts and binders(identifies ink composition and electrospinning conditions)
• Fabricates MEAs with nanofiber mat electrodes and performs preliminaryscreening fuel cell screening tests, including start-stop cycling and load cyclingASTs.
Nissan Technical Center North America (NTCNA) (Sub) led by Dr. Nilesh Dale(project co-PI) and Dr. Cenk Gumeci (technical contact)
• Prepares and tests sprayed electrode MEAs• Evaluates/validates the performance of nanofiber electrode MEAs• Performs O2 mass transfer resistance experiments on sprayed and nanofiber
electrode MEA• Evaluates GaTech shape-controlled catalyst in sprayed electrode MEAs
Georgia Institute of Technology (Sub) led Professor Younan Xia (project co-PI) andDr. D. Qin (technical contact)
• The GaTech team prepares batches of Pt-Ni/C octahedra catalyst for initialscreening at NTCNA
5
Milestones and Go/No-Go Decision for 2017-18
Milestone Description Date Status as of April 17, 2018
Prepare/deliver nanofiber MEAs to NTCNA and FC-PAD team at LANL
On going during 2017 and 2018
Prior targets met; future targets on
trackTest nanofiber and sprayed MEAs at NTCNA
Go/No-Go Description• Nanofiber MEA with >240 mA/cm2 at 0.8V • >800 mW/cm2 at rated power• <50% drop in ORR mass activity after load cycling• <20% drop in voltage at 1.2 A/cm2 after start up-shut down• <30% loss in rated power after drive cycle durability
Measurements at NTCNA and VU; verification at LANL
Dec. 31, 2017
Targets met (drive cycle
durability test was not
performed)
• Nanofiber MEA with >280 mA/cm2 at 0.8V, • >900 mW/cm2 at rated power, • < 40% drop in ORR mass activity after load cycling, • <10% drop in voltage at 1.2 A/cm2 after start up-shut down• <20% loss in rated power after drive cycle durability
Dec. 31, 2018 On track
6

Accomplishment: Electrospun Pt/C Gen-1 Fiber and PtCo/C Gen-2 Fiber
Ink:Catalyst+PFSA/P
AA + solvent
Electrospinning on Aluminum Foil or
GDL or membrane
Hot Press to make MEA
• High molecular weight polymers with sufficient chain entanglements will form fiber structures that dry-deposit on a grounded collector
• Nafion does not dissolve in alcohol/water solvents; it forms a micellar dispersion.
• A carrier polymer is required to spin Nafion fibers.
• Gen-1 fiber mat electrodes: catalyst + Nafion + poly(acrylic acid) (PAA)
• Gen-2 fiber mat electrodes: catalyst + proprietary blend of ionomer and carrier (with carrier removal after electrospinning)
7

Accomplishment: STEM Imaging of an Electrospun Nanofiber with PtCo/C and Nafion/PAA Binder (FC-PAD Collaboration)
8
• 30% of the total fiber surface area comes from internal porosity.• Outer fiber roughness accounts for additional ~20% of the surface area.• EDX results of Pt and F mapping in Gen-1 Fibers show that there is good
mixing of binder and Pt in the fiber interior with a thin Nafion coating (~20 nm) on the outside of the nanofiber (from an average of the EDX signal over a single fiber)
• Gen-1 Fibers (TKK PtCo/C + Nafion + PAA)• A series of STEM images were obtained on a single fiber
at various tilt angles. • These images were combined using a computer software
package at ORNL to obtain a 3D reconstructed image of the fiber (to identify the location of PtCo/C, carbon, binder, and void space).
• Blue visualization is PtCo metal.• Grey area is Carbon, Nafion & Poly(acrylic acid).• White is void space.
Data collected at Oak Ridge National Laboratory by John Slack (VU grad student) and Karren More’s group

100% RH 40% RH
Sample Max Power (mW/cm2)
Power at 0.65 V
(mW/cm2)
HFR (mΩ-cm2)
Max Power (mW/cm2)
Power at 0.65 V
(mW/cm2)
HFR (mΩ-cm2)
PtCo Spray 652 544 70 315 85 208Gen-1 PtCo Espun 759 661 76 590 250 219Gen-2 PtCo Espun 1132 998 56 967 488 120
Accomplishment: A Comparison of PtCo Spray and Electrospun Electrode MEAs at 80oC and 200 kPa (NTCNA Results)
MEA details: Cathode: 0.1 mgPt/cm2
Anode: 0.1 mgPt/cm2 (Espun), J-M 0.4 mgPt/cm2 (Spray)Membrane: NR 211GDL: SGL 29 BC
• Nanofiber MEAs displays improved performance, as compared to a spray electrodeMEA, possibly due to the porous fiber structure which allows better reactants transport to the catalyst surface and fast removal of water.
• Gen-2 displays much better performance and its power density is less sensitive to RH.
9

Accomplishment: PtCo/C Spray and Electrospun Electrode MEAs: Transport/Ionomer Resistance/Polarization (NTCNA Results)
• Due to its unique fiber structure, Espun electrodes have a lower O2 gas transport resistance, as compared to a spray electrode. • Gen-2 has higher O2 resistance than Gen-1 due to
lower Pt loading (0.095 mg/cm2) for Gen-2.
• For Espun electrodes, ionomer resistance is also substantially lower than that of a spray electrode.
• From polarization resistance analysis, mass transfer loss is considerably higher in a spray electrode, as compared to Gen-2 and Gen-1 Espun MEAs.
• The PLA results are consistent with iVperformance and O2 GTR measurements.
0.388 0.450 0.402
0.081 0.0350.005
0.020 0.0550.069
0.030 0.0170.012
0
0.2
0.4
0.6
0.8
1
PtCo Spray Gen-1 PtCo Espun Gen-2 PtCo Espun
Cat
hode
Ove
rpot
entia
l (V)
Polarization Loss Analysis at 1.5 AActivationMass TransferOhmicUnknown
10
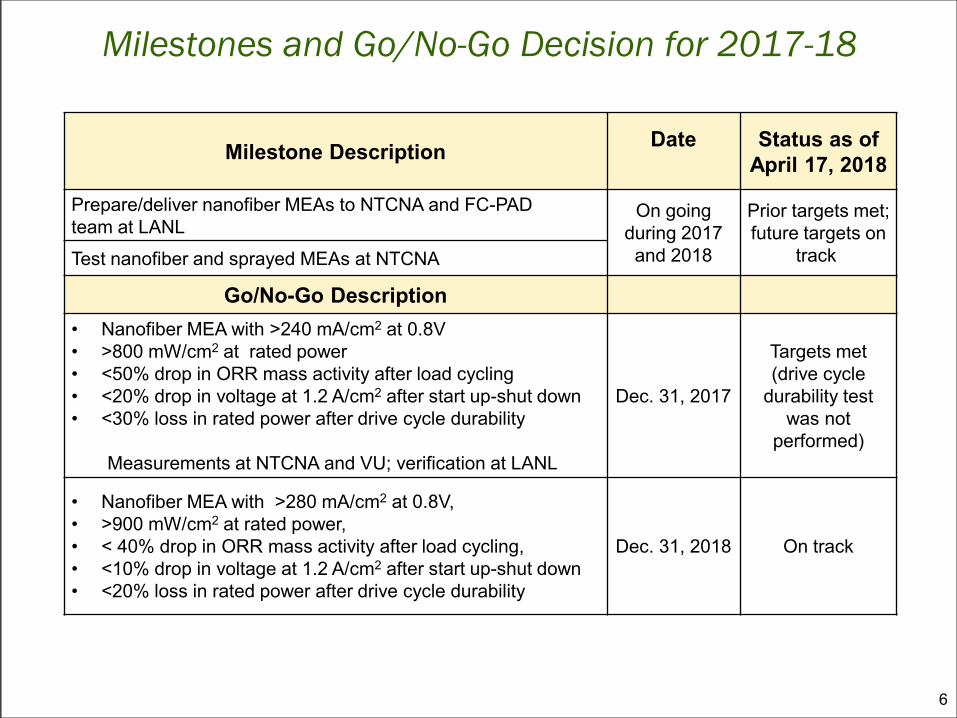
Accomplishment: Metal Dissolution Load Cycle ASTs for PtCo/C Sprayed and Fiber Electrode MEAs (NTCNA Results)
30,000 cycles
Beginning of Life (BoL) End of Life (EoL)
Sample Max Power (mW/cm2)
Power at 0.65 V
(mW/cm2)
O2 GTR(s/m)
Max Power (mW/cm2)
Power at 0.65 V
(mW/cm2)
O2 GTR(s/m)
PtCo Spray 652 544 52 534 339 69Gen-1 PtCo 759 661 35 695 419 43Gen-2 PtCo 1132 998 42 777 575 46
0
100
200
300
400
500
0
0.2
0.4
0.6
0.8
1
0 0.5 1 1.5 2
Res
istiv
ity (m
Ω∙c
m2 )
Cel
l Vol
tage
(V)
Current Density (A/cm2)
H2/Air, 100 kPa (abs), 100%RH Gen-2 PtCo Espun BoL Gen-2 PtCo Espun EoL Gen-1 PtCo Espun BoL Gen-1 PtCo Espun EoLPtCo Spray BoLPtCo Spray EoL
MEA details: Cathode: 0.1 mgPt/cm2
Anode: 0.1 mgPt/cm2 (Espun), J-M 0.4 mgPt/cm2 (Spray)Membrane: NR 211, GDL: SGL 29 BC
0.95 V
0.6 V6 s/cycle
• At the end of life after Pt dissolution, Espun electrodes outperform the spray electrode MEA.
• This is most likely due to their unique, porous nanofiber structure.
• Gen-2 Espun electrode shows better performance than that of Gen-1 Espun.
• A comprehensive analysis including neutron imaging is underway with the help of FC-PAD members for Gen-2 Espun electrode.
• EoL power at 0.65 V for Gen-2 > BoL power density for PtCo sprayed electrode MEA.
11

Accomplishment: Rated Power at 95°C and 70% RH with a Gen-2 MEA(PtCo/C)/Nafion Cathode; (Pt/C)/Nafion Anode
0.0
0.1
0.2
0.3
0.4
0.5
0.6
0.7
0.8
0.9
1.0
0 500 1000 1500 2000 2500
Cel
l Pot
entia
l (V)
Current Density (mA/cm²)
95°C, 125/500 H2/air, 70% RH (86 °C humid feed gas)
95 °C 200 kPa
95 °C 150 kPa
Rated Power at 95oC and 0.663V
Backpressure Power Density (mW/cm²)
150 kPa 802200 kPa 906250 kPa 1072
)40(@
)@25.1()90(/
CetemperaturambientetemperaturoutletcoolantStackpowerratedV
powerratedVkWPowerStackTQ
°−
−×
=∆
MEA Composition
Nanofiber Cathode: TKK PtCo/C TEC36E52; (0.1 mg/cm²)Membrane: Nafion 211Nanofiber Anode: JM 40% Pt on HiSpec 4000 (0.1 mg/cm²)
Calculations made with Q/∆T=1.45
At a Pt loading of 0.20 mg/cm2 (anode + cathode), the Gen-2 MEA meets/exceeds the Year 2 Go/No-Go target of > 900 mW/cm2
12

Accomplishment: Gen-2 and Gen-1 MEA Performance with Repeated Recovery Protocols (LANL Collaboration)
• Recovery: Low T, high RH, hydrogen pump to clean cathode catalyst.• 1 recovery step improves nanofiber MEA power density• Power density is high after recovery; 1 W/cm2 at 0.6 V and 150 kPa; 1.2 W/cm2 at
0.6 V and 200 kPa • % power loss at EOL is less than that seen at Vanderbilt (before recovery 82% vs.
72% at Vanderbilt)
Initial Performance of a Gen-2 Cathode Binder MEA with PtCo/C at 0.1 mg/cm2
Load cycling AST of a Gen-1 Cathode Binder MEA with PtCo/C at 0.1 mg/cm2
At a Pt loading of 0.20 mg/cm2 (anode + cathode), the Gen-1 MEA meets the Year 2 Go/No-Go target of < 40% drop in ORR mass activity.
13
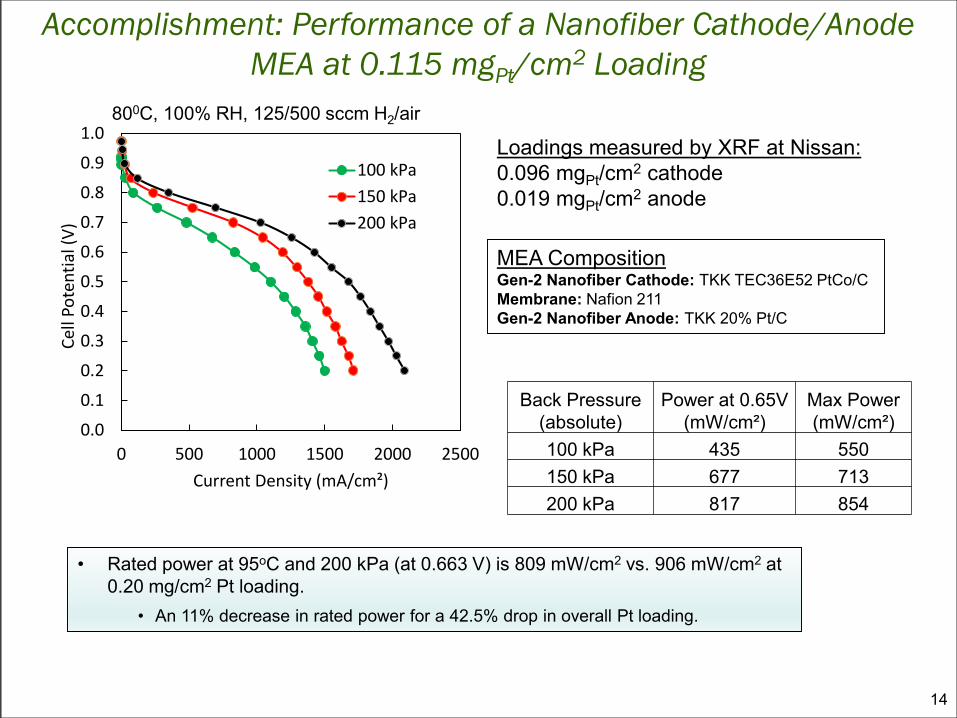
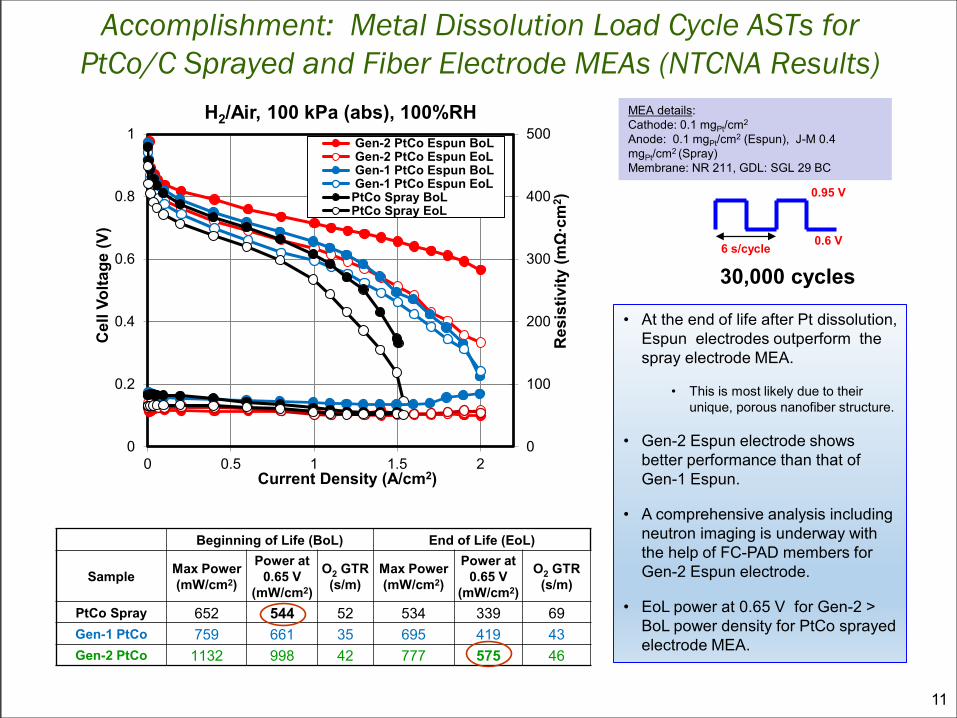
Accomplishment: Performance of a Nanofiber Cathode/Anode MEA at 0.115 mgPt/cm2 Loading
MEA CompositionGen-2 Nanofiber Cathode: TKK TEC36E52 PtCo/C Membrane: Nafion 211Gen-2 Nanofiber Anode: TKK 20% Pt/C
Back Pressure (absolute)
Power at 0.65V (mW/cm²)
Max Power (mW/cm²)
100 kPa 435 550150 kPa 677 713200 kPa 817 854
800C, 100% RH, 125/500 sccm H2/air
Loadings measured by XRF at Nissan:0.096 mgPt/cm2 cathode 0.019 mgPt/cm2 anode
0.0
0.1
0.2
0.3
0.4
0.5
0.6
0.7
0.8
0.9
1.0
0 500 1000 1500 2000 2500
Cell
Pote
ntia
l (V)
Current Density (mA/cm²)
100 kPa150 kPa200 kPa
• Rated power at 95oC and 200 kPa (at 0.663 V) is 809 mW/cm2 vs. 906 mW/cm2 at 0.20 mg/cm2 Pt loading.
• An 11% decrease in rated power for a 42.5% drop in overall Pt loading.
14

0
100
200
300
400
500
0
0.2
0.4
0.6
0.8
1
0 0.5 1 1.5 2
Res
istiv
ity (m
Ω∙c
m2 )
Cel
l Vol
tage
(V)
Current Density (A/cm2)
Gtech PtNi
TKK PtNi
H2-Air, 80°C, 200 kPaabs
Beginning of Life (BoL)
Sample Mass Activity(mA/mgPt)
ECSA (m2/gPt)Ionomer
Resistance (Ω-cm2)
O2 GTR (s/m)
TKK PtNi 220 48 0.277 65
GaTech PtNi 150 34 0.339 81
Accomplishment: Comparison of TKK PtNi/C vs. GaTech Shape-Controlled PtNi/C in Sprayed Electrode MEAs
• Low performance for GaTech PtNi is attributed to the presence of surfactants on the catalyst surface (remaining after the catalyst synthesis).
• GaTech catalyst MEA also exhibits a higher ionomer resistance (contaminants are lowering Nafion conductivity) and higher O2 gas transport resistance (due to lower ECSA and larger particle size).
15

Response to Previous Year Reviewers’ CommentsIt is NOT clear the long term durability of these electrodes due to the presence of 20 to 30 weight % of hydrocarbon carrier polymer. This is an important issue to keep aware of when developing this technology. This may be a top priority of FC PAD and Nissan.
Response: Gen-2 nanofiber MEAs do not use Poly(acrylic acid) as the carrier polymer. The new carrier polymer is easily removed from the fibers after electrospinning, by a short water soak.
The cost of nanofiber based electrode and MEA for the proposed process needs to be justified for competitive cost - yields are very important.
Response: The materials and fabrication costs of electrospun fiber mat electrode MEAs is comparable to MEAs with slot die coating slurry electrodes at high production rates, as per a recent economic analysis by Strategic Analysis, Inc. The PI will fabricate nanofiber electrode MEAs next year on commercial electrospinning equipment at eSpin Technologies, Chattanooga, TN. Based on this work, a better estimate of processing costs will be made.
The proposed future research is reasonable. But the PI should to some degree focus on the nanofiber MEA characterizations to elucidate the microstructures using in-situ and ex-situ approach. Why does the nanofiber MEA show superior performance to the conventional MEA?
Response: Characterization experiments have been initiated with FC-PAD collaborators; ORNL is examining nanofiber structure at BoL and EoL (STEM and XPS) and with LANL/Nissan (O2 mass transfer resistance). Next year additional nanofiber mat electrode characterization experiments are planned, including STEM, water vapor uptake, SAXS, and nano-CT (with ORNL, LANL, LBNL, and ANL)
16

FC-PAD National Lab CollaborationsOak Ridge National Laboratory• Analysis of nanofiber electrode MEAs by high resolution STEM imaging• Mapping of ionomer and Pt catalyst in nanofiber mat cathode MEAs at beginning of life (BoL) and
end of life (EoL).
Lawrence Berkeley National Laboratory• Measure water vapor uptake in nanofiber electrodes and MEAs as a function of RH.• Investigate Nafion/carrier polymer interaction; how does a carrier polymer interact with Nafion.
Argonne National Laboratory• Tomography analysis of Gen-2 inks
Los Alamos National Laboratory• Verification of nanofiber MEA performance at BoL and after ASTs.• Structural analysis of fibers before/after removing carrier polymer.• Neutron water imaging with NIST to understand better Gen-2 MEA performance at low RH
17

Remaining Challenges and Barriers
Continue to optimize the materials and fabrication conditions for nanofiber electrode MEAs , to achieve the highest power and best durability at a total anode + cathode Pt loading of ≤ 0.125 mg/cm2)
• Optimize on the ionomer/carrier/catalyst wt.. ratio in the ink and the electrospinning conditions. • Examine new Pt-alloy catalysts and high surface area carbon support catalysts.• Optimize on the post-electrospinning steps in creating a MEA (hot-pressing, removing carrier
polymer, etc.)• Performance Targets: • 1000 mW/cm2 at rated power while meeting the Q/∆T target requirement • <40% drop in ORR mass activity after load cycling• <5% drop in voltage at 1.2 A/cm2 after unmitigated start up-shut down• < 10% loss in rated power after drive cycle durability
Fabricate nanofiber electrodes on a commercial electrospinning line at eSpin Technologies, Inc. (Chattanooga, TN)
• Compare lab-scale and commercially electrospun electrode MEAs.
Continue to investigate the structure and function of particle/polymer nanofiber mat cathodes and anodes and then correlate data to MEA performance.
• Why do nanofiber cathodes exhibit: higher power less power loss after ASTs less power loss at low RH operation Lower O2 mass transfer resistance
• What is the difference in structure/function between Gen-1 and Gen-2 fiber electrode MEAs
18

Proposed Future Work for April 2018 – April 2019Assess performance of commercial Pt-alloy catalysts and shape-controlled Pt-Ni catalysts innanofiber electrode MEAs that are made in the lab and on commercial electrospinningequipment.
• Continue to optimize the composition and post-electrospinning processing of Gen-2 nanofiber electrode MEAs. Include a recovery protocol when evaluated performance.
• Perform load cycle and start-stop cycle durability tests on 0.125 mg/cm2Pt-loaded MEAs (total anode+cathode loading).
• Evaluate new shape-controlled catalyst(s) from GaTech.• Begin pilot-scale nanofiber MEA fabrication and evaluation.
Probe the structure of Gen-1 and Gen-2 MEAs and correlate results with fuel cell performance• Where is carrier polymer during/after fiber electrospinning for Gen-1 and Gen-2 MEAs?• Why do nanofibers work well? Are there agglomerates? What is the binder distribution/coating
on catalyst particles in nanofibers? What is the internal porosity?• What is the hydrophobicity/hydrophilicity of the fiber interior and fiber surface?• Why do we see high power at low RH with Gen-2 MEAs?• What is the structure of fibers (binder distribution, % loss in Co or C, etc.) after ASTs?
Milestones:1. Sample delivery: Gen-2 nanofiber MEAs (5 cm2 and 25 cm2) to NTCNA, LANL, and LBNL for
testing/analysis.2. Technical Targets: MEAs with 300 mA/cm2 at 0.8V and >1000 mW/cm2 at rated power while
meeting the Q/∆T target requirement; <40% drop in ORR mass activity after load cycling,<5% drop in voltage at 1.2 A/cm2 after unmitigated start up-shut down.
Any proposed future work is subject to change based on funding levels.19

Technology Transfer ActivitiesPatents have been filed/issued on nanofiber-based particle/polymer fuel cell electrodes.
• P. N. Pintauro and W. Zhang, “Nanofiber Fuel Cell Electrode and Method of Forming Same” U.S. patent 9905870, issued February 2018.
• Non-U.S. patents are in the prosecution stage.• Provisional patents on Gen-2 fuel cell electrodes and the ink composition used to prepare
Gen-2 electrodes and MEAs.
Arrangements have been made to commercially produce fuel cell electrodes and MEAs at eSpin Technologies, Inc., Chattanooga, TN.
• MEA performance will be tested at Vanderbilt, NTCNA, and LANL (performance should be the same as MEA made in Pintauro’s lab at Vanderbilt).
• MEAs are available to OEMs for purchase.• Today, the working width of electrodes is up to 24 inches.• Orders for large MEAs orders will be considered soon. Trials are planned for large-scale
production (≥ 20,000 linear feet per trial).
20

Summary• Last year focused on preparing and evaluating nanofiber cathode/anode MEAs. High
performance MEAs were prepared. There was a significant improvement in performance of Gen-2 MEAs as compared to Gen-1 MEAs.
• MEA performance was verified at Nissan and an FC-PAD lab (LANL).• Gen-2 fuel cell results with a Pt/C nanofiber anode and PtCo/C nanofiber cathode
are encouraging: • 906 mW/cm2 at rated power, 95oC and 200 kPaabs at 0.20 mg/cm2
• 809 mW/cm2 at rated power, 95oC and 200 kPaabs at 0.115 mg/cm2
• 20-30% power loss after a load cycling durability test (30,000 voltage cycles)• High power at low RH
• Preliminary fiber characterization work has been carried out at ORN, LANL, and NTCNA.• Fibers are ~30% porous with a uniform distribution of catalyst and binder
(minimal agglomerates of catalyst or binder)• O2 mass transfer resistance is low• Loss of Co during a load cycling is less than the loss in a sprayed cathode MEA
• Particle/polymer nanofiber mat electrodes are a promising alternative to conventional fuel cell electrode structures
• Electrospinning is a versatile and scalable nano/micro-fabrication method for preparing MEAs
• The method can exploit new catalysts and binders, as they are developed/discovered, such as GaTech’s shape controlled PtNi catalyst
21

Technical Back-Up Slides
22

Electrospinning – Rotating Drum Apparatus
Collector
23

Rated Power and Q/∆T Constraint Q/∆T is a measure of radiator size
Rated Power is Power at which Q/ ∆T is met
Target Q/∆T<1.45 kW/oC heat loss constraint based on car radiator’s Q/∆T
To meet this constraint
When Tcoolant stack is high Operate FC stack at higher Temp (limited by
current membrane technologies)
When V@ rated power is high Operate FC stack at higher Pressure and/or
use high ORR activity catalyst
)40(@
)@25.1()90(/
CetemperaturambientetemperaturoutletcoolantStackpowerratedV
powerratedVkWPowerStackTQ
°−
−×
=∆
For fixed Q/∆T of 1.45, min cell voltage @ rated power is higher at lower FC stack temperature
24

T. Mashio et al., ECS Trans. 11, 529, (2007). K. Sakai et al., ECS Trans. 25, 1193 (2009).Y. Fukuyama et al., Electrochim. Acta, 117, 367 (2014).
O2 transport resistance measurements, including limiting current experiments developed by Nissan, were completed at 80°C, 90% RH.
Gas transport loss in CL is inversely proportional to Pt loading, indicating local gas transport dominates gas transport in CLs.
O2 GTR measurements are a valuable diagnostic technique for new electrode structures (e.g., electrospun electrodes) with low Pt loading (0.1 mgPt/cm2) MEAs.
Pt
Gas Transport Losses in the Cathode Catalyst Layer at low Pt Loading – Analysis Performed at NTCNA
25

Polarization Loss Analysis – Performed at NTCNA
0.0
0.2
0.4
0.6
0.8
1.0
1.2
0 0.2 0.4 0.6 0.8 1 1.2 1.4 1.6 1.8 2Current Density, A/cm2
Vol
tage
, V
Air iR_free
Air (Tafel)
Air (Taf-iRin)
Air
iRact :Activation loss
iRin :Internal ohmic loss
EMF Air
iRext :External ohmic loss
Observed cell voltage
iRmas :Mass transfer loss
Representative H2/O2 and H2/Air Performance and Polarization Losses
Polarization Loss Analysis was performed using a model developed by Nissan to deconvolute various losses in fuel cell performance using H2/O2 and H2/Air iV data.
The model uses theoretical values of resistances losses to identify the relative importance of each loss (such as activation loss, ohmic loss, mass transfer loss etc. ).
For mass transfer loss: the iV curve obtained with O2 is assumed to have no mass transfer loss. It is calculated by subtracting the air iV plot and the internal ohmic loss from the O2 iV curve.
26