![Joint Investment and Operation of Microgrid · 2015-11-09 · and microgrid operation. While in [9]–[12], only microgrid operation is studied under given microgrid facilities. However,](https://static.fdocuments.in/doc/165x107/5f055ca67e708231d412960b/joint-investment-and-operation-of-microgrid-2015-11-09-and-microgrid-operation.jpg)
Fuel cell cars in a microgrid for synergies between ...bdeschutter/pub/rep/16_008.pdf · Fuel cell...
23
Delft University of Technology Delft Center for Systems and Control Technical report 16-008 Fuel cell cars in a microgrid for synergies between hydrogen and electricity networks * F. Alavi, E. Park Lee, N. van de Wouw, B. De Schutter, and Z. Lukszo If you want to cite this report, please use the following reference instead: F. Alavi, E. Park Lee, N. van de Wouw, B. De Schutter, and Z. Lukszo, “Fuel cell cars in a microgrid for synergies between hydrogen and electricity networks,” Applied Energy, vol. 192, pp. 296–304, Apr. 2017. Delft Center for Systems and Control Delft University of Technology Mekelweg 2, 2628 CD Delft The Netherlands phone: +31-15-278.51.19 (secretary) fax: +31-15-278.66.79 URL: http://www.dcsc.tudelft.nl * This report can also be downloaded via http://pub.deschutter.info/abs/16_008.html
Transcript of Fuel cell cars in a microgrid for synergies between ...bdeschutter/pub/rep/16_008.pdf · Fuel cell...

Delft University of Technology
Delft Center for Systems and Control
Technical report 16-008
Fuel cell cars in a microgrid for synergies
between hydrogen and electricity
networks∗
F. Alavi, E. Park Lee, N. van de Wouw, B. De Schutter, and
Z. Lukszo
If you want to cite this report, please use the following reference instead:
F. Alavi, E. Park Lee, N. van de Wouw, B. De Schutter, and Z. Lukszo, “Fuel cell
cars in a microgrid for synergies between hydrogen and electricity networks,” Applied
Energy, vol. 192, pp. 296–304, Apr. 2017.
Delft Center for Systems and Control
Delft University of Technology
Mekelweg 2, 2628 CD Delft
The Netherlands
phone: +31-15-278.51.19 (secretary)
fax: +31-15-278.66.79
URL: http://www.dcsc.tudelft.nl
∗This report can also be downloaded via http://pub.deschutter.info/abs/16_008.html

Fuel cell cars in a microgrid for synergies betweenhydrogen and electricity networks
Farid Alavia,∗, Esther Park Leeb, Nathan van de Wouwa,∗∗, Bart De Schuttera,Zofia Lukszob
aDelft Center for Systems and Control, Delft University of TechnologybFaculty of Technology, Policy and Management, Delft University of Technology
Abstract
Fuel cell electric vehicles convert chemical energy of hydrogen into electricityto power their motor. Since cars are used for transport only during a smallpart of the time, energy stored in the on-board hydrogen tanks of fuel cellvehicles can be used to provide power when cars are parked. In this paper, wepresent a community microgrid with photovoltaic systems, wind turbines, andfuel cell electric vehicles that are used to provide vehicle-to-grid power whenrenewable power generation is scarce. Excess renewable power generation isused to produce hydrogen, which is stored in a refilling station. A central controlsystem is designed to operate the system in such a way that the operational costsare minimized. To this end, a hybrid model for the system is derived, in whichboth the characteristics of the fuel cell vehicles and their traveling schedulesare considered. The operational costs of the system are formulated consideringthe presence of uncertainty in the prediction of the load and renewable energygeneration. A robust min-max model predictive control scheme is developedand finally, a case study illustrates the performance of the designed system.
Keywords: Energy management systems, vehicle-to-grid, hybrid systems
1. Introduction
Power systems are accommodating an increasing amount of renewable gen-eration. However, Renewable Energy Sources (RES) such as the sun or thewind are variable, uncertain and not dispatchable, and therefore electricity isnot always produced when it is needed by the users. Flexibility sources likedispatchable generation, storage, demand side response, and increased inter-
∗Corresponding author∗∗Nathan van de Wouw is also with the Department of Mechanical Engineering, Eindhoven
University of Technology, The Netherlands, and the Department of Civil, Environmental &Geo-Engineering, University of Minnesota, Minneapolis, U.S.A.
Preprint submitted to Elsevier

connection are needed to integrate more renewable power generation to powersystems [1, 2].
Electric Vehicles (EVs) can provide the flexibility needed in future electricpower systems. Although plug-in EVs represent a new source of variabilitydue to their charging needs, this variability can be managed via smart chargingstrategies [3], and the vehicles’ batteries can also be used to store surplus renew-able generation. Moreover, plug-in EVs can become dispatchable power plantsby providing power or balancing services via vehicle-to-grid (V2G) technology[4]. Fuel Cell Electric Vehicles (FCEVs), with hydrogen as fuel, can be used tosupport the operation of power systems with a large participation of RES. Theyare particularly suited to provide peak power or spinning reserves to the grid[5, 6]. Because they use hydrogen as a fuel, they do not draw power from thegrid, and if aggregated, they can provide large amounts of power. In contrastto plug-in EVs, if FCEVs have a connection to a hydrogen source, they canbe operated continuously regardless of the level of fuel stored in their tank [5].Through the use of FCEVs for both transportation and power generation, wecan explore the synergies that can be created between hydrogen and electricitynetworks.
In this paper, we present the Car as Power Plant (CaPP). This concept,originating from van Wijk, is extensively described in [7]. CaPP introducesa flexible multi-modal energy system that uses FCEVs as dispatchable powerplants [8]. It is based on the fact that FCEVs, when parked, can produceelectricity from hydrogen in a cleaner and more efficient way than the currentpower system, thereby producing waste products (water and heat) that can bere-used [7, 9]. Since cars are used for driving only around 5% of the time, thereis a big potential to replace peak power plants with a large fleet of FCEVs or toreduce the need to build new plants in the future. Additionally, heat generatedin the fuel cells can be used locally if the FCEVs are connected directly to abuilding’s heat network [6].
The CaPP concept can be implemented in different settings and for differenttypes of applications. When applied in a parking lot, a large fleet of parkedcars can be used to provide power to the grid through an aggregator that sellspower on behalf of the drivers. In residential microgrid settings, residents of theneighborhood can use their FCEVs to provide power to the local grid at timesof low renewable power generation. In buildings with high electricity and heatdemand, such as hospitals, the CaPP system can be implemented not only touse the electricity and heat from vehicles, but also to provide a large back-upcapacity to the building.
In the current paper, we explore the possible synergies between hydrogen andelectricity networks using the residential microgrid CaPP case. We consider aresidential microgrid with distributed generators that are used to serve localloads and to produce hydrogen, which acts as energy storage medium. Thisgaseous fuel is used by cars to drive, and additionally, it can be used to generatepower when renewable power sources are scarce. This system is studied fromthe operational control perspective, as operational control is one of the mainchallenges in the implementation of microgrids [10].
2

The operational control aspects to take into account in the CaPP microgridare the scheduling of the FCEVs and the electrolyzer in the power-to-gas (P2G)system. In the literature, the scheduling problem of grid-integrated vehicles inmicrogrids is usually addressed with centralized optimization approaches, wherethe resources from plug-in EVs are managed by minimizing power losses in thesystem [11] or by minimizing the operating costs [12]. In a microgrid withrenewable resources, a power-to-gas (P2G) system and vehicle-to-grid (V2G)power from FCEVs, the V2G scheduling problem is addressed by minimizingthe power imported from the grid [13]. The operation of electrolyzers in P2Gsystems is also addressed with optimization approaches in the literature [14, 15,16]. Similar control objectives are used, for example, maximizing the profitsfrom wind power export to the grid while taking into account the hydrogendemand [14]. In [17] the sizing and techno-economic aspects of a PV-to-hydrogensystem with fuel cell buses are studied using a simple control algorithm.
Model predictive control is used in the operation of microgrids in [18]. Theoptimization problem in [18] is formulated as a mixed integer linear program-ming problem. Herein, it is assumed that the prediction of the electrical load ofthe microgrid is accurate and there is no uncertainty in the system. To deal withthe uncertainty in the prediction of the load and generation of renewable energysources, robust control techniques are developed in [19] and [20]. A stochasticoptimization approach is used in [19] where a set of scenarios are selected forthe uncertainty in the system. However, the selection of a reliable set is notalways possible. In [20], the authors develop a min-max optimization methodto operate a microgrid. However, the use of the fuel cells and electrolyzer, inaddition to the connection of the microgrid to the power grid and exchange ofelectricity is not considered in [20].
In this paper, a model is developed that describes the power generation of thefuel cell cars while the transportation aspect of the cars is taken into account.Further, a unified model is derived that describes the economic dispatch problemof a microgrid including a fleet of fuel cell cars, a water electrolysis system, andRES in the form of wind turbines and PV systems. A model predictive controlscheme is developed to govern the system operation while the uncertainty inthe prediction of the electrical load and power generation of RES is taken intoaccount. The min-max optimization problem that arises in model predictivecontrol is converted into a mixed integer linear programming problem. Realisticdata for the behavior of drivers based on the survey of the Dutch Ministry ofInfrastructure and renewable energy generation based on the Dutch weatherdata are used to illustrate the behavior of the system.
The rest of the paper is organized as follows: In Section 2 we describe theCaPP microgrid system. In Section 3 the system model is developed. Section 4develops an optimization problem to be used in the control system. In Section5, a case study is simulated and, finally, Section 6 concludes the paper.
3

2. The CaPP microgrid system
2.1. Description of the system
The CaPP microgrid consists of a group of residential loads, a PV system,a wind turbine, an electrolyzer, and a hydrogen storage system, as depicted inFigure 1. A centralized PV system and also a wind turbine are used to provideelectricity to the households. When there is a surplus of renewable power gen-eration, it is used to produce hydrogen via electrolysis of water. The hydrogenproduced is compressed and stored in a central storage tank, which is used asa refilling station for FCEVs. The FCEVs are used both for the transportationof residents of the neighborhood and also the generation of electricity inside theneighborhood. The energy management system controls the flows of electricityand the scheduling of FCEVs as power plants.
A side product of generating electricity in each fuel cell stack is heat. Inorder to keep the temperature of the fuel cell stack inside the desired range,FCEVs are equipped with a relatively big radiator and cooling fans. We assumethat in the stationary mode, when the FCEVs are used to generate electricityfor the microgrid, the fuel cells are only operated at partial load. In other words,the maximum power generation of a fuel cell in the stationary mode would bea small fraction of its nominal power. As a result, the on-board utilities ofan FCEV would be still able to regulate the fuel cell’s temperature, even atstandstill. It is worth mentioning that the use of waste heat from the vehiclescan be accommodated by heat exchange equipment suggested by [6]. Otherslike [5] reject the idea given the additional equipment needed and complexityinvolved, but this could be solved by centralizing the heat exchange system.However, in this paper, we focus on the electrical power generated by the fuelcells. The use of the fuel cell’s heat and their corresponding models is consideredas a topic for future research.
Figure 1: Schematic presentation of the CaPP microgrid system.
4

A common feature in most of the RES, such as wind and solar energy, isthe variation in power generation due to fluctuations in the weather conditions.The CaPP concept brings the opportunity to create a microgrid system withRES and without wind and solar energy curtailment. We assume that themicrogrid is connected to the power grid and that exchange of electrical powermay happen in both directions. It is assumed that the cost of power exchangebetween the microgrid and the power grid is determined by the power gridoperator. Based on the load and the generation profile of the other generationunits in the power network, the power grid operator may determine a reward forthe microgrid to export power to the grid. However, in some other situations,the power grid operator may discourage the microgrid for exporting the powerby determining a cost for the exported power. The existence of the fuel cell carsand water electrolysis system create the flexibility for the microgrid to set thepower exchange with the power grid in such a way that the maximum benefitis gained for the microgrid.
2.2. Synergies in the CaPP microgrid
The implementation of the CaPP microgrid system will be beneficial for thetransportation system. The CaPP microgrid would provide FCEVs with renew-able hydrogen, reducing not only the tailpipe emissions of the transportationsystem, but also the well-to-wheel emissions. In addition, such a microgrid willbenefit from storage of excess renewable generation in the form of hydrogen, in-creasing the system’s flexibility and capturing better the renewable generationpotential. Finally, using FCEVs to provide power in the microgrid will increasethe system’s flexibility in power generation. When FCEVs are operated as powerplants using hydrogen that was produced from renewable electricity, the overallcarbon emissions linked to the electricity consumption in the microgrid will alsobe low. Without the vehicles in the microgrid, other dispatchable power plants,demand response, and storage should be used. Alternatively, electricity has tobe imported from the public grid at times of low or no renewable generation.
3. Modeling the CaPP microgrid
In this section, the CaPP microgrid system is modeled. To this end, firstwe develop a hybrid model that describes the behavior of the fuel cell cars and,next, with a similar approach, the hybrid model of the electrolysis system andthe hydrogen storage tank is developed.
3.1. Fuel cell cars model
The fuel cell cars are considered as controllable power generation units. Weassume that the total number of cars in the microgrid is equal to Nveh. Letxf,i(k) represent the amount of fuel level in the car number i at time stepk. The inputs of the model consist of a continuous variable, uf,i(k), and twobinary variables, sf,i(k) and sr,i(k) for each fuel cell car i. The value of uf,i(k)determines the net power generation of fuel cell car i at time step k. It is
5

assumed that a lower-level control system exists in each fuel cell car that canoperate the fuel cell stack of the car in such a way that the net power generationof the car is equal to a given set-point, uf,i(k). The value of the binary variablesf,i(k) determines the operation mode of the fuel cell of car i at time step k. Ifsf,i(k) = 1, the fuel cell is turned on; if sf,i(k) = 0, the fuel cell is turned off.In addition, the refilling process of the cars is determined based on the value ofsr,i(k), where sr,i(k) = 1 indicates that the car i is refilled at time step k.
The fuel level of the car i, when its fuel cell is turned on, can be describedby [21, 22]
xf,i(k + 1) = xf,i(k)− (αf,iuf,i(k) + βf,i)Ts, (1)
where αf,i and βf,i are two parameters related to the specifications of each fuelcell stack i. The sampling time interval of the system is presented by Ts.
The model presented in this paper includes both the trip characteristicsand the power generation of the cars. Trip characteristics of the cars are theinformation about the estimated departure and arrival time of each car, inaddition to the distance that each car has traveled. The availability of each carin the task of power generation is determined by the trip characteristics. If acar leaves the neighborhood at a specific time, it will not be available in theprocess of electricity generation until it comes back. In addition, an amountof fuel will be used during the travel of the car. In this paper, we assumethat the trip characteristics of the cars are not controllable, but predictable.Even though the predictions of the departure and arrival time of the cars arenot completely accurate, it is possible to determine tight but guaranteed lowerbounds for the departure times of each car. Similarly, we can determine tightbut guaranteed upper bounds for the arrival times of each car. As a result, thereis no uncertainty in the trip characteristics of the cars.
A binary number, λf,i(k), indicates whether fuel cell car i is available inthe neighborhood at time step k. In addition, the amount of fuel that is usedduring the travel of car i is denoted by hi(k). It is assumed that if fuel cell cari leaves the neighborhood and comes back again at time step k, the value ofhi(k) represents the amount of fuel that is used for this transportation. For allother values of k, we set hi(k) = 0.
The model of fuel cell car i including the refilling process and the trip char-acteristics of the car is as follows:
xf,i(k + 1) =
xf,i(k) +Rf,i refillingxf,i(k) no generationxf,i(k)− (αf,iuf,i(k) + βf,i)Ts generationxf,i(k) transportationxf,i(k)− hi(k) arrival,
(2)
where Rf,i represents the rate of fuel that can be injected to fuel cell car i duringthe process of refilling. The model in (2) is a hybrid piecewise affine (PWA)model with five modes. The refilling mode represents a case that the car is beingrefilled. The no generation mode is related to the case that the car is available
6
for the task of power generation, but it is switched off. Similarly, the generationmode indicates that the car is available and it is switched on. The transportationmode relates to the case that the car is not in the neighborhood. Finally, thearrival mode is related to the arrival time of the car. A full description of eachmode and the operational constraints are given in Appendix A.
3.2. Electrolysis system model
A water electrolysis system is responsible for providing the hydrogen neededfor the transportation and electricity production in the neighborhood. It isassumed that all the hydrogen produced by the electrolysis system is stored ina reservoir connected to it. The amount of stored hydrogen, xel(k), is a systemstate. The energy consumption of a typical electrolysis system, uel(k), is a linearfunction of the produced hydrogen [23]. As a result, the stored hydrogen willincrease due to hydrogen production of the electrolysis system with the amountof αeluel(k)Ts, where Ts is the sampling time interval and αel is a constant relatedto the specifications of the system. Based on the CaPP microgrid scenario, allthe fuel cell cars receive their fuel from the water electrolysis system, and hence,the PWA model of the system can be expressed as:
xel(k + 1) =
{xel(k)−
∑Nveh
i=1 sr,i(k)Rf,i if sel(k) = 0
xel(k)−∑Nveh
i=1 sr,i(k)Rf,i + Tsαeluel(k) if sel(k) = 1, (3)
where sel(k) is the on/off switching signal of the electrolysis system. The oper-ational constraints of the electrolysis system are presented in Appendix B.
3.3. Overall system model
The piecewise affine models of the cars and electrolysis system in (2) and (3)can be converted into mixed logical dynamical (MLD) models [24] by standardtechniques [25]. An MLD model describes the behavior of a hybrid systemincluding continuous and discrete variables. Based on Appendix C, this modelis of the from:
x(k + 1) = x(k) +B1(k)u(k) +B3(k)z(k) +B4(k), (4)
where the system states and inputs are defined as:
x(k) ,[xTf (k) xel(k)
]T(5)
u(k) ,[uTf (k) sTr (k) sTf (k) uel(k) sel(k)
]T. (6)
Here, a bold face variable indicates a vector containing the corresponding vari-
ables related to all cars. For example, xf(k) =[xf,1(k) . . . xf,Nveh
(k)]T
.If we define ω(k) as the difference between the prediction of the residual elec-
tricity demand and its actual realization at time step k, matrices G1(k), G2(k),G3(k), and G4(k) can be determined in such a way that all the operationalconstraints given in Appendix A and B are included in the following inequality:
G1(k)X(k) ≤ G2(k) +G3(k)x(k) +G4(k)ω(k), (7)
7
where X(k) =[uT (k) δTexp(k) zT (k)
]T. Here, a variable with a tilde rep-
resents the stacked version of that variable in the prediction horizon. For exam-
ple, u(k) =[uT (k) . . . uT (k +Np − 1)
]T. Equation (4) with inequality
(7) forms the MLD model of the overall system.
4. Control system operation
The proposed scenario assumes that, on the one hand, the wind turbineand PV systems are generating maximum power with respect to the weathersituation, and on the other hand, the electricity load in the households is notcontrollable. The connection of the microgrid with the power grid allows theexchange of electricity, but it comes at a cost. An appropriate control system canhelp the microgrid to use the RES inside the neighborhood as much as possibleand avoid unnecessary exchange of electricity. In addition, the physical limitsin the transmission lines may cause a power unbalance inside the microgrid atsome times. Fortunately, the presence of the fuel cell cars and the electrolysissystem make it possible to still satisfy the power balance; this task is done viaa central control system.
We assume that the central control system has access to weather forecastinformation, prediction of loads and renewable energy sources, predictions of thetrip characteristics of the cars, and current values of the system states includingthe level of hydrogen stored in the electrolysis system and in each fuel cell car.The switching signals of fuel cell cars and electrolysis system, in addition totheir power generation and consumption are determined by the control systemin such a way that, firstly, the power balance is guaranteed in the system and,secondly, the operational costs of the system are minimized. To this end, amodel predictive control (MPC) algorithm is developed. In this algorithm, theoperational costs of the system, subject to all constraints, are minimized bydetermining a sequence of control actions to be implemented in the future. Thefirst control action is applied to the system and, at the next sample time, thewhole procedure is repeated.
The following factors are considered to affect the operational costs:
• Switching the operation mode of the fuel cells and the electrolysis system,Jswitch(k).
• Power generation of fuel cells and power consumption of the electrolyzer,Jpower(k).
• The price of imported power, Jimp(k).
• The price of exported power, Jexp(k).
All the mentioned elements in the operational costs of the system create thecost function:
J(k) = Jswitch(k) + Jpower(k) + Jimp(k) + Jexp(k). (8)
8

A more detailed description of the elements of the cost function is given inAppendix D.
By using the MLD model of the system derived in Section 3, the cost functioncan be written in the following form:
J(k) = Wx(ω(k))X(k) +Wd(k)ω(k) (9)
The matrices Wx(ω(k)) and Wd(k) can be easily derived from the cost functionby using the system model. Therefore, the optimization problem that the modelpredictive controller needs to solve at each time step is of the form:
minX(k)
maxω(k)
{J(k)} (10)
subject to (7).
The constraint of the optimization problem (10) should be satisfied for allpossible realizations of ω(k), and hence, problem (10) is hard to solve in general.In order to simplify the problem, the uncertainty in the residual load of theneighborhood is assumed to be bounded.
Assumption 1 : There exists a finite bound for the deviation of the predictedresidual load from its actual value, ω(k), at each time step k. Therefore, it ispossible to determine ω and ω such that for all k, ω ≤ ω(k) ≤ ω.
With the assumption of bounded deviation of actual demand from the pre-dicted values (Assumption 1) and using Lemma 1 to 3 in [26], the optimizationproblem can be formulated as an MILP problem as follows:
minX(k){max{Wx(ωmin(k))X(k) +Wd(k)ωmin(k), Wx(ωmax(k))X(k) +Wd(k)ωmax(k)}}
(11)
subject to
G1(k)X(k) ≤ G2(k) +G3(k)x(k) +G4(k)ωmin (12)
G1(k)X(k) ≤ G2(k) +G3(k)x(k) +G4(k)ωmax, (13)
which can be solved by a variety of MILP solvers, such as GLPK [27], CPLEX[28], or Gurobi [29].
5. Simulation of a CaPP microgrid
In this section, the CaPP microgrid system described in Section 2 is sim-ulated. A central controller is assumed to operate the system as described inSection 4. We consider 200 households inside the neighborhood. In order tosimulate the electricity demand of the households, standard curves correspond-ing to 2014 are extracted from [30]. Using the standardized power fractions foreach 15-min period of the year, we calculated the hourly demand by assuminga yearly consumption of 3,400 kWh/year [31]. Photovoltaic systems and windturbines are the available RES in the system. It is assumed that the RES units
9

generate the maximum electrical power that is possible given weather condi-tions. To simulate the power generation of the wind turbine, data from one ofthe measuring stations of the Dutch Institute of Meteorology is used [32]. Sincethe wind turbine is assumed to be in the community, a small turbine of 130kWis considered [33]. Given the turbine size, a measuring station in a coastal areais chosen to better capture the wind’s energy [34]. Using the hourly wind speeddata measured at Hoek van Holland in 2014, the hourly wind power is calculatedfor a 130kW turbine.
To simulate the power generation of solar photovoltaic systems, the PVWatts tool [35] is used. For the Netherlands, Amsterdam is the only locationavailable in PV Watts. Hourly power generation of a 10 kWp PV system iscalculated. The historical data show that the total RES capacity installed gen-erate as much as 90% of the yearly electricity consumption in the neighborhood.However, considering the fact that the load of the microgrid is not controllable,only a part of the renewable energy is usable inside the microgrid.
As mentioned in Section 4, the residual load of the microgrid is assumed tobe equal to the electricity load in the microgrid minus the power production ofrenewable energy sources. Figure 2 depicts the prediction of the residual load inthe microgrid in a sample week. It is assumed that the prediction of the residualload contains uncertainty up to around 10 percent of its peak value. Here weassume that ω = −ω = 10 kW. The electrical connection between the microgridand the power network are assumed to have a capacity of power exchange equalto 80 kW, i.e. ein = −ein = 80.
1 12 24 36 48 60 72 84 96 108 120 132 144 156Time [h]
-100
-50
0
50
100
150
Pow
er [k
W]
Figure 2: Residual load of the microgrid; shaded area indicates the uncertainty and the redlines are the limits on the power exchange between the microgrid and the power network.
The number of the fuel cell cars in the neighborhood is assumed to be 50.In order to derive the trip characteristics of the cars, the traveling behavior ofthe Dutch drivers for the year 2014 [36] is used. About 13,700 data points wereused to derive the distribution of the departure and arrival times of the cars,and also the daily distance driven - for weekdays and weekends. The driving
10

behaviors of the 50 cars are determined using these distributions. The resultingaverage daily distance traveled per car is 53 km. It is assumed that all the fuelcell cars consume 1 kg of hydrogen per 100 km driving distance. In addition,in the model of fuel cell stacks, the results of [21] are used to determine therequired parameters. As a result, the parameters αf,i and βf,i for all the carsare equal to 0.06 kg/kWh and 0.11 kg/h, respectively. The refilling speed ofthe cars, Rf,i, is assumed to be equal to 2 kg/h for all the cars. The maximumpower generation of the fuel cells, uf,i, is set to 15 kW. Because the nominalpower generation of a typical fuel cell car is around 100 kW, the fuel cell isoperated at partial load. The coefficient of the power generation of fuel cellcars, Wpf , and power consumption of the electrolysis system, Wpel, in the costfunction are assumed to be equal to 0.6 e/kW and 0.15 e/kW, respectively.
A water electrolysis system with a maximum power consumption of 100kW and a hydrogen storage tank with the capacity of 500 kg are assumed tobe available inside the neighborhood. The limits of the hydrogen level in thestorage tank are xel = 10 kg and xel = 500 kg. For the water electrolysis systemwe assumed an efficiency of 70%. Considering that the high heating value ofhydrogen is 39.4kWh/kg [23], αel is equal to 0.02 kg/kWh.
The price of importing electricity is assumed to be equal to the price of theAmsterdam Power Exchange (APX) market in a day of April 2016 [37] andit is shown in Figure 3. In addition, we have considered a constant cost forthe system, 0.2 e/kWh, to be paid to the grid operator in case of exportingelectricity from the microgrid to the power network between 11 P.M. and 7A.M. In this period of the time, the load of the power grid is low and exportingelectricity from the microgrid to the power grid is discouraged.
1 12 24 36 48 60 72 84 96 108 120 132 144 156Time [h]
0.1
0.15
0.2
0.25
0.3
0.35
0.4
Pric
e [E
uro/
kWh]
Imported electricity tariff
Figure 3: Price of importing electricity to the microgrid based on the APX market.
Based on the system model developed in Section 3 and the control algorithmof Section 4, the system is simulated for an entire year. Figure 4 illustrates thehydrogen level in the storage tank during a year. The use of hydrogen in thetransportation and electricity generation by fuel cell cars causes the hydrogenlevel to fluctuate, but inside the predefined minimum and maximum of 10 and500 kg, respectively.
If the renewable energy sources in the microgrid are operated with their
11

0 1000 2000 3000 4000 5000 6000 7000 8000Time [h]
0
100
200
300
400
Sto
red
hydr
ogen
[kg]
Figure 4: Level of hydrogen stored in the system.
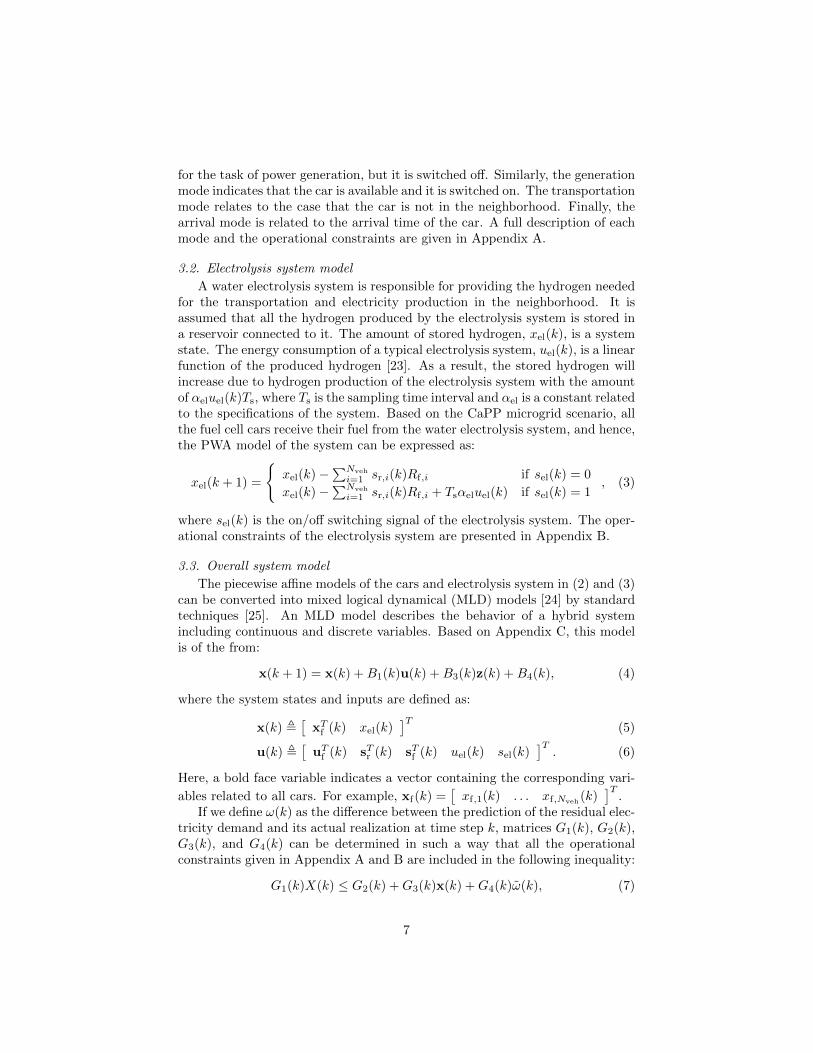
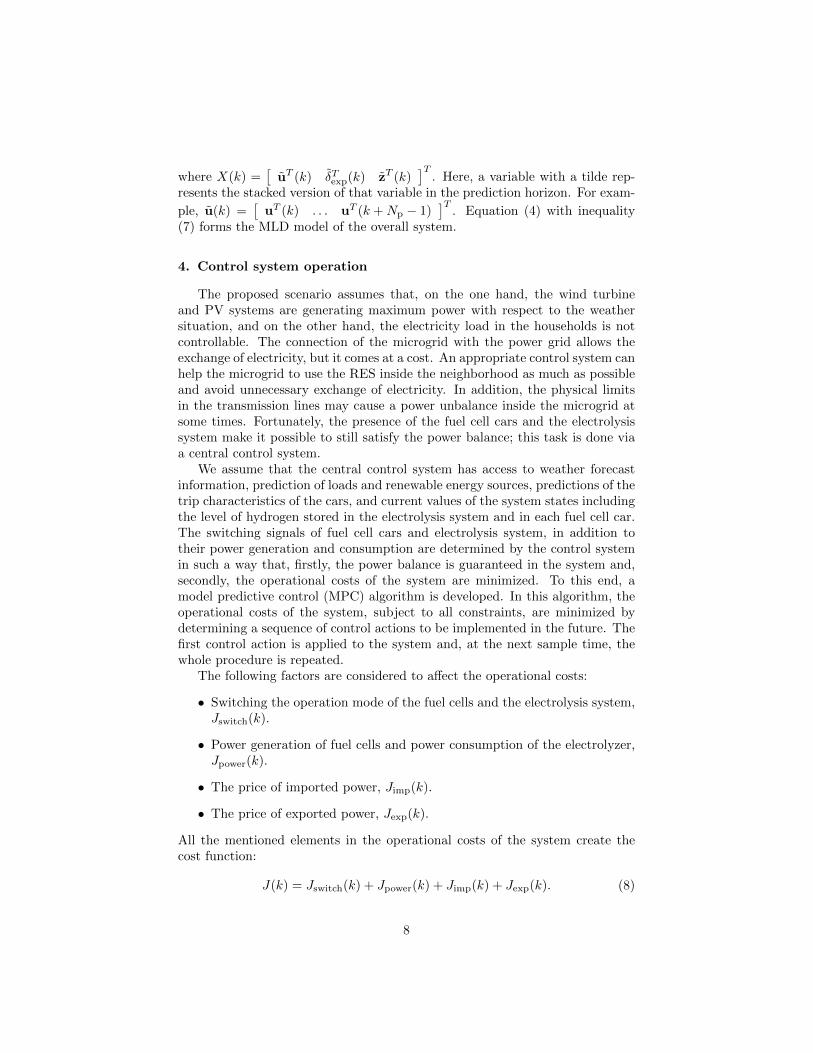
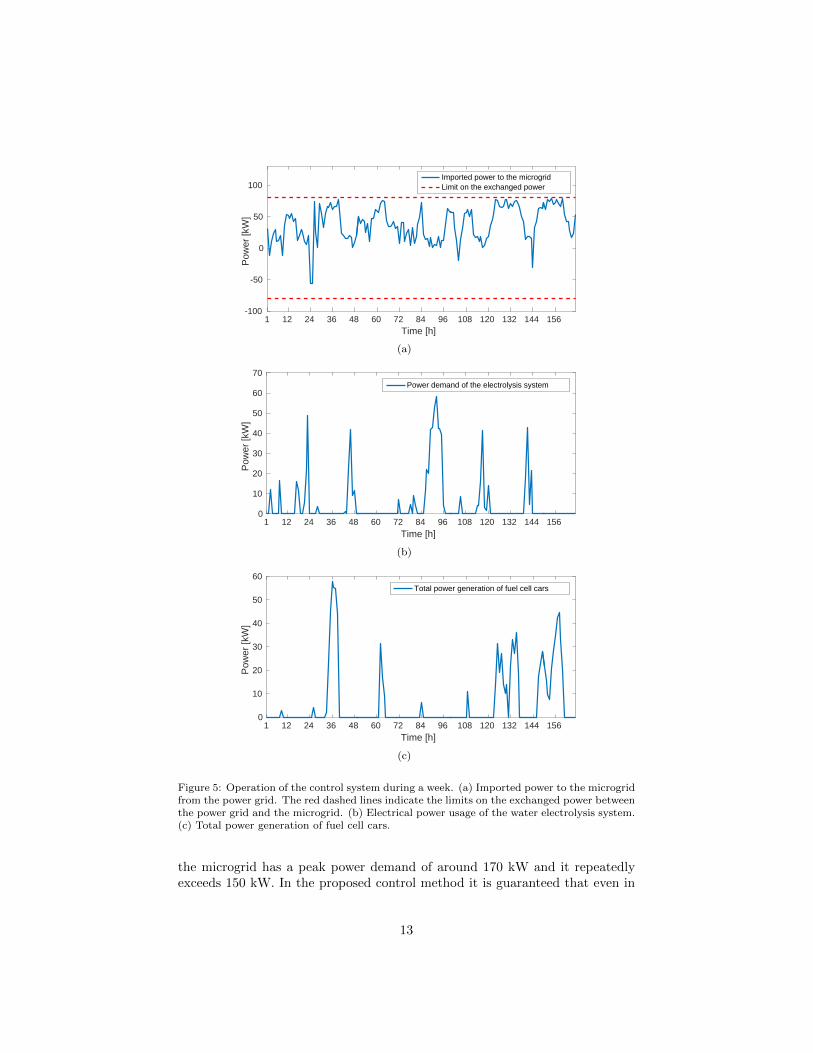
maximum power generation capacity, the residual load of the microgrid wouldnot be always in the range -80 to 80 kW, i.e. the range that exchange of powerbetween the microgrid and the power network is possible. In addition, it isassumed that the power grid operator has set a price for exporting electricityfrom microgrid to the power network in order to discourage the microgrid fromthis action. The result of the simulation on the imported power to the microgridin Figure 5(a) shows that the microgrid barely exports power to the powernetwork. The residual load of the microgrid, depicted in Figure 2, indicatesthat in the absence of a water electrolysis system and in the case of avoiding thecurtailment of the RES generation, the microgrid inevitably exports electricityto the power grid. However, Figure 5(a) shows that by using the fuel cellcars and the water electrolysis system, the imported power to the microgridalways remains inside the predefined bounds. Figure 5(b) represents the powerconsumption of the water electrolysis system in a sample week. The importedpower to the microgrid is also influenced by the total power generation of fuelcell cars. Figure 5(c) shows the total power generation of the fuel cell cars insidethe microgrid.
One may look at the microgrid as a medium of transferring electrical energyin which some sources supply energy to it and some others drain energy fromit. Here, the electrical load of the households, the renewable energy sources,the fuel cell cars, and the water electrolysis system are the different sourcesconnected to this medium for transferring electrical energy. In addition, we canassume that the power grid is another source of energy that can both injectenergy to the microgrid or drain energy from it.
The simulation of the microgrid is now extended to an entire year and theresulting energy flows in the microgrid are listed in Table 1. It can be inferredfrom Table 1 that around 70% of the total consumed energy of the microgrid isdelivered via the renewable energy sources, while the share of fuel cell cars ingeneration of the electrical energy of the microgrid is only 3%. Even though thefuel cell cars generate only a small portion of the total energy in the microgrid,they play an important role in decreasing the required capacity of the electricalconnection between the power grid and the microgrid. The residual load of
12
1 12 24 36 48 60 72 84 96 108 120 132 144 156Time [h]
-100
-50
0
50
100
Pow
er [k
W]
Imported power to the microgridLimit on the exchanged power
(a)
1 12 24 36 48 60 72 84 96 108 120 132 144 156Time [h]
0
10
20
30
40
50
60
70
Pow
er [k
W]
Power demand of the electrolysis system
(b)
1 12 24 36 48 60 72 84 96 108 120 132 144 156Time [h]
0
10
20
30
40
50
60
Pow
er [k
W]
Total power generation of fuel cell cars
(c)
Figure 5: Operation of the control system during a week. (a) Imported power to the microgridfrom the power grid. The red dashed lines indicate the limits on the exchanged power betweenthe power grid and the microgrid. (b) Electrical power usage of the water electrolysis system.(c) Total power generation of fuel cell cars.
the microgrid has a peak power demand of around 170 kW and it repeatedlyexceeds 150 kW. In the proposed control method it is guaranteed that even in
13
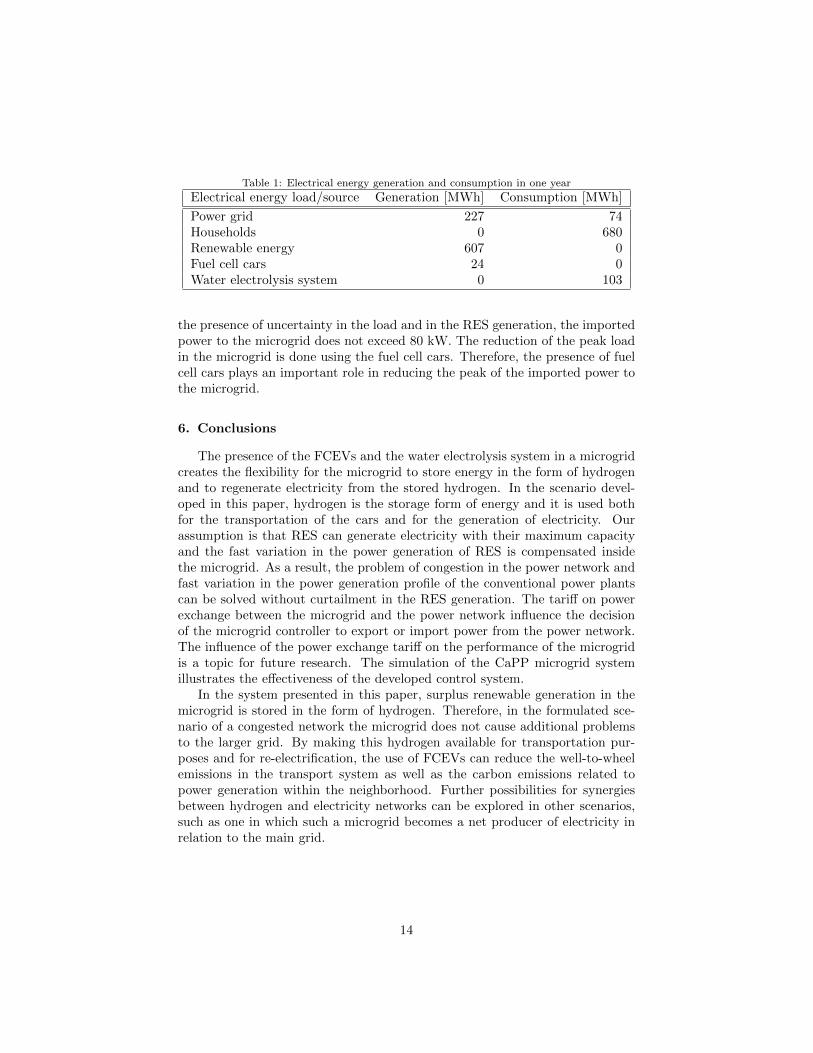
Table 1: Electrical energy generation and consumption in one year
Electrical energy load/source Generation [MWh] Consumption [MWh]
Power grid 227 74Households 0 680Renewable energy 607 0Fuel cell cars 24 0Water electrolysis system 0 103
the presence of uncertainty in the load and in the RES generation, the importedpower to the microgrid does not exceed 80 kW. The reduction of the peak loadin the microgrid is done using the fuel cell cars. Therefore, the presence of fuelcell cars plays an important role in reducing the peak of the imported power tothe microgrid.
6. Conclusions
The presence of the FCEVs and the water electrolysis system in a microgridcreates the flexibility for the microgrid to store energy in the form of hydrogenand to regenerate electricity from the stored hydrogen. In the scenario devel-oped in this paper, hydrogen is the storage form of energy and it is used bothfor the transportation of the cars and for the generation of electricity. Ourassumption is that RES can generate electricity with their maximum capacityand the fast variation in the power generation of RES is compensated insidethe microgrid. As a result, the problem of congestion in the power network andfast variation in the power generation profile of the conventional power plantscan be solved without curtailment in the RES generation. The tariff on powerexchange between the microgrid and the power network influence the decisionof the microgrid controller to export or import power from the power network.The influence of the power exchange tariff on the performance of the microgridis a topic for future research. The simulation of the CaPP microgrid systemillustrates the effectiveness of the developed control system.
In the system presented in this paper, surplus renewable generation in themicrogrid is stored in the form of hydrogen. Therefore, in the formulated sce-nario of a congested network the microgrid does not cause additional problemsto the larger grid. By making this hydrogen available for transportation pur-poses and for re-electrification, the use of FCEVs can reduce the well-to-wheelemissions in the transport system as well as the carbon emissions related topower generation within the neighborhood. Further possibilities for synergiesbetween hydrogen and electricity networks can be explored in other scenarios,such as one in which such a microgrid becomes a net producer of electricity inrelation to the main grid.
14

Acknowledgment
This research is supported by the NWO-URSES project Car as Power Plant,which is financed by the Netherlands Organization for Scientific Research (NWO).
15

Appendix A: Full description of the fuel cell cars model
Here we explain the structure and terms of (2) and its five modes. The firstmode indicates the refilling process. The system enters this mode when thecar is available for power generation and the value of sr,i(k) is set to 1 by thecontroller. During this mode, the fuel level of the car increases with a constantrate Rf,i. The second and the third modes belong to the situation when the caris inside the neighborhood and it is not refilled. In the second mode the fuel cellstack is turned off, and hence, the amount of fuel in the car does not change intime. The third mode represents the system dynamics when the fuel cell stackis turned on and the net power production is equal to uf,i(k). The last twomodes in (2) belong to the situation where the car has left the neighborhood.A fuel cell car is not allowed to be refilled or to generate electricity when itis not inside the neighborhood and as a result, the fuel level xf,i(k) does notinfluence the system dynamics in this case. We can assume that the fuel levelremains constant during the absence of the car and that one sample time beforearrival of the car in the neighborhood, all the fuel used in the transportation issubtracted from the initial value.
It is assumed that the refilling process and the generation of electricity by acar can be done only when the car is inside the neighborhood. In other words,
if λf,i(k) = 0 then sr,i(k) = 0. (14)
if λf,i(k) = 0 then sf,i(k) = 0. (15)
In addition, we assume that during the refilling process, the fuel cell stack shouldbe turned off. Therefore, another constraint in the system is given by:
if sr,i(k) = 1 then sf,i(k) = 0. (16)
Based on the physical limits, an upper bound exists for the generation of elec-tricity in each fuel cell stack. In addition, the rate of power generation is limitedto an upper and lower bound as follows:
0 ≤ uf,i(k) ≤ uf,i (17)
∆uf,i ≤ ∆uf,i ≤ ∆uf,i. (18)
The fuel cell stack cannot generate electricity when it is turned off, i.e.,
if sf,i(k) = 0 then uf,i(k) ≤ 0. (19)
The inequality (19) combined with (17) implies that whenever a fuel cell isturned off, the power generation of that fuel cell has to be equal to zero.
The maximum level of fuel in each car is indicated by xf,i and the minimumlevel of fuel that is necessary for the next travel of car is indicated by xf,i(k). Ifthe amount of fuel in a car is equal to or lower than this minimum level necessaryfor the travel purpose, the car is not used in the task of power generation.Therefore:
if xf,i(k) ≤ xf,i(k) then sf,i(k) = 0. (20)
16

As a result, the constraints on xf,i(k) can be written as:
xf,i(k)sf,i(k) ≤ xf,i(k) ≤ xf,i. (21)
Appendix B: Constraints on the operation of the electrolysis system
The physical limitations of the system dictate a bound on the stored hydro-gen, consumed electricity and its rate of change as follows:
uel ≤ uel(k) ≤ 0 (22)
∆uel ≤ ∆uel(k) ≤ ∆uel (23)
xel ≤ xel(k) ≤ xel (24)
The electrolysis system consumes electricity only when it is turned on. There-fore,
if sel(k) = 0 then uel(k) ≥ 0. (25)
The inequality (25) combined with (22) implies that whenever sel(k) = 0, thenuel(k) = 0.
Appendix C: Intermediate steps in deriving the MLD model
To derive the MLD model, we define a binary auxiliary variable δexp(k) thatindicates whether electricity is imported or exported from the microgrid to thepower network at time step k. If we define ein(k) as the imported power to thesystem, the value of δexp(k) is determined as follows:
ein(k) ≤ 0⇔ δexp(k) = 1. (26)
We define a lower, ein, and an upper bound, ein, for the imported power to themicrogrid, ein(k). Based on the physical properties of the electrical networks,the amount of imported power to the microgrid is given by:
ein(k) = Pd(k) + ω(k)− uel(k)−Nveh∑i=1
uf,i(k). (27)
Therefore, the following constraint exists in the system:
ein ≤ Pd(k) + ω(k)− uel(k)−Nveh∑i=1
uf,i(k) ≤ ein, (28)
where Pd(k) is the prediction of residual electrical load in the microgrid, which isequal to the total power production of the renewable energy sources subtractedfrom the load demand in the microgrid. The difference between the predictionof residual electricity demand and its actual realization at time step k is anuncertain value that is denoted by ω(k).
17

Using the models (2) and (3), the overall system model can be written as(4), where z(k) contains the continuous auxiliary variables that are used in theMLD models [24]. The matrices B1(k), B3(k), and B4(k) are time-varying,but because we can predict the trip characteristics of the cars, they can bedetermined over the whole prediction horizon.
All the mentioned constraints in the model of the fuel cell cars, the electrol-ysis system and the definition of auxiliary variables are affine with respect tothe variables x(k), u(k), δexp(k), z(k), and ω(k). Therefore, for each sampletime we can express the inequalities as:
E1u(k) + E4x(k) + E51(k) + E52ω(k) ≥ E2δexp(k) + E3z(k). (29)
Using (4) and defining G1(k), G2(k), G3(k), and G4(k) in an appropriate way,the whole set of constraints for all the prediction horizon can be written in theform (7).
Appendix D: Description of the cost function
The different parts of the cost function are:
Jswitch(k) =
Np−1∑j=0
(Nveh∑i=1
Wsf |∆sf,i(k + j)|+Wsel|∆sel(k + j)|
)(30)
Jpower(k) =
Np−1∑j=0
(Nveh∑i=1
Wpfuf,i(k + j) +Wpeluel(k + j)
)(31)
Jimp(k) =
Np−1∑j=0
Ce,imp(k + j)ein(k + j)(1− δexp(k + j)) (32)
Jexp(k) =
Np−1∑j=0
Ce,exp(k + j)(−ein(k + j))δexp(k + j), (33)
and they can be interpreted as follows:
• Jswitch(k): This part of the cost function is used to include the strong effectof switching the operation mode of fuel cells and electrolysis systems ontheir life time. A term Wsf |∆sf,i(k)| is considered for each fuel cell car ias the cost of switching at time step k, where Wsf is a weight factor todetermine the importance of the degradation in the whole operational cost.A similar term, Wsel|∆sel(k)|, is considered for the electrolysis system.
• Jpower(k): This term reflects the operational costs, related to the powergeneration of fuel cells or power consumption of water electrolysis system.The price of hydrogen per kilogram, which is used by the fuel cells or isproduced by the electrolysis system, are influencing the constant coeffi-cients Wpf and Wpel.
18

• Jimp(k): It is assumed that the price of imported electricity should be paidto the power grid operator. As a result, the imported power affects theoperational costs of the microgrid. If Ce,imp(k+ j) represents the price of
electricity at time step k+ j, the term∑Np−1
j=0 Ce,imp(k+ j)ein(k+ j)(1−δexp(k+ j)) indicates the price of imported power, where (1− δexp(k+ j))determines whether the electricity is imported or not.
• Jexp(k): In order to control the total power generation in the power grid,the amount of injected power to the grid should be controlled. When extrapower can be used in the power grid, for example the peak demand hours,the grid operator pays the microgrid to inject electricity to the network.However, the scenario assumes that the neighborhood can be seen as aload, and not a generation unit, from the power network’s point of view.Therefore, the injection of power to the power grid is penalized by anamount Ce,exp(k) at time step k.
References
[1] H. Holttinen, A. Tuohy, M. Milligan, E. Lannoye, V. Silva, S. Muller,L. Soder, The flexibility workout: Managing variable resources and as-sessing the need for power system modification, IEEE Power and EnergyMagazine 11 (6) (2013) 53–62.
[2] M. Wolsink, The research agenda on social acceptance of distributed gen-eration in smart grids: Renewable as common pool resources, Renewableand Sustainable Energy Reviews 16 (1) (2012) 822–835.
[3] R. A. Verzijlbergh, Z. Lukszo, M. D. Ilic, Comparing different EV chargingstrategies in liberalized power systems, in: Proceedings of the InternationalConference on the European Energy Market, 2012, pp. 1–8.
[4] W. Kempton, J. Tomic, Vehicle-to-grid power implementation: From stabi-lizing the grid to supporting large-scale renewable energy, Journal of PowerSources 144 (1) (2005) 280–294.
[5] T. E. Lipman, J. L. Edwards, D. M. Kammen, Fuel cell system economics:comparing the costs of generating power with stationary and motor vehiclePEM fuel cell systems, Energy Policy 32 (1) (2004) 101–125.
[6] J. Kissock, Combined heat and power for buildings using fuel-cell cars, in:Proceedings of the ASME International Solar Energy Conference, 1998, pp.121–132.
[7] A. J. M. van Wijk, L. Verhoef, Our Car as Power Plant, Delft UniversityPress, 2014.
[8] A. Fernandes, T. Woudstra, A. van Wijk, L. Verhoef, P. V. Aravind, Fuelcell electric vehicle as a power plant and SOFC as a natural gas reformer:
19

An exergy analysis of different system designs, Applied Energy 173 (2016)13–28.
[9] Z. Lukszo, E. H. Park Lee, Demand Side and Dispatchable Power Plantswith Electric Mobility, in: A. Beaulieu, J. de Wilde, M. A. J. Scherpen(Eds.), Smart Grids from a Global Perspective: Bridging Old and NewEnergy Systems, Springer International Publishing, 2016, pp. 163–177.
[10] S. Parhizi, H. Lotfi, A. Khodaei, S. Bahramirad, State of the art in researchon microgrids: A review, IEEE Access 3 (2015) 890–925.
[11] H. Khodr, N. El Halabi, M. Garcıa-Gracia, Intelligent renewable microgridscheduling controlled by a virtual power producer: A laboratory experience,Renewable Energy 48 (2012) 269–275.
[12] C. Battistelli, Generalized microgrid-to-smart grid interface models forvehicle-to-grid, in: 2013 IEEE PES Innovative Smart Grid TechnologiesConference, 2013, pp. 1–6.
[13] K. Shinoda, E. Park Lee, M. Nakano, Z. Lukszo, Optimization model fora microgrid with fuel cell vehicles, in: 13th IEEE International Conferenceon Networking, Sensing and Control (ICNSC), 2016.
[14] M. Korpas, A. T. Holen, Operation planning of hydrogen storage connectedto wind power operating in a power market, IEEE Transactions on EnergyConversion 21 (3) (2006) 742–749.
[15] L. Bolıvar Jaramillo, A. Weidlich, Optimal microgrid scheduling with peakload reduction involving an electrolyzer and flexible loads, Applied Energy169 (2016) 857–865.
[16] M. Petrollese, L. Valverde, D. Cocco, G. Cau, J. Guerra, Real-time inte-gration of optimal generation scheduling with MPC for the energy manage-ment of a renewable hydrogen-based microgrid, Applied Energy 166 (2016)96–106.
[17] J. M. Vidueira, A. Contreras, T. N. Veziroglu, PV autonomous installationto produce hydrogen via electrolysis, and its use in FC buses, InternationalJournal of Hydrogen Energy 28 (9) (2003) 927–937.
[18] A. Parisio, E. Rikos, L. Glielmo, A model predictive control approach tomicrogrid operation optimization, IEEE Transactions on Control SystemsTechnology 22 (5) (2014) 1813–1827.
[19] A. Parisio, L. Glielmo, Stochastic model predictive control for eco-nomic/environmental operation management of microgrids, in: EuropeanControl Conference (ECC), Zurich, Switzerland, 2013, pp. 2014–2019.
20

[20] C. A. Hans, V. Nenchev, J. Raisch, C. Reincke-Collon, Minimax modelpredictive operation control of microgrids, in: 19th World Congress of theInternational Federation of Automatic Control, Cape Town, South Africa,2014, pp. 10287–10292.
[21] P. Rodatz, G. Paganelli, A. Sciarretta, L. Guzzella, Optimal power manage-ment of an experimental fuel cell/supercapacitor-powered hybrid vehicle,Control Engineering Practice 13 (2005) 41–53.
[22] F. Alavi, N. van de Wouw, B. De Schutter, Min-max control of fuel-cell-car-based smart energy systems, in: European Control Conference, Aalborg,DK, 2016.
[23] J. Ivy, National Renewable Energy Laboratory, Summary of electrolytichydrogen production: Milestone completion report, National RenewableEnergy Laboratory, 2004.
[24] A. Bemporad, M. Morari, Control of systems integrating logic, dynamics,and constraints, Automatica 35 (3) (1999) 407–427.
[25] W. P. M. H. Heemels, B. De Schutter, A. Bemporad, Equivalence of hybriddynamical models, Automatica 37 (7) (2001) 1085–1091.
[26] F. Alavi, E. Park Lee, N. van de Wouw, B. De Schutter, Z. Lukszo, Fuel cellcars in a microgrid for synergies between hydrogen and electricity networks– addendum, Tech. Rep. 16-008a, Delft Center for Systems and Control,Delft University of Technology, Delft, The Netherlands (Apr. 2016).
[27] GLPK (GNU Linear Programming Kit).URL https://www.gnu.org/software/glpk/
[28] CPLEX optimizer.URL http://www-01.ibm.com/software/commerce/optimization/
cplex-optimizer/
[29] Gurobi optimization.URL http://www.gurobi.com/
[30] Energie Data Services Nederland (EDSN), Verbruiksprofielen - profielenelektriciteit 2014 (Load profiles - electricity profiles 2014) (in Dutch) (2015).URL http://nedu.nl/portfolio/verbruiksprofielen/
[31] E. Veldman, M. Gaillard, M. Gibescu, J. Slootweg, W. Kling, Modellingfuture residential load profiles, in: Innovation for Sustainable Production,2010, pp. 64–68.
[32] Royal Netherlands Meteorological Institute (KNMI), Uurgegevens van hetweer in Nederland (Hourly weather data in the Netherlands) (in Dutch)(2015).URL http://knmi.nl/nederland-nu/klimatologie/uurgegevens
21

[33] U.S. Department of Energy, Wind and water program: Community windbenefits (November 2012).URL http://www.nrel.gov/docs/fy13osti/56386.pdf
[34] Milieu Centraal, Kleine windmolens (“Small wind turbines”) (in Dutch)(2016).URL https://www.milieucentraal.nl/klimaat-en-aarde/
energiebronnen/windenergie/kleine-windmolens/
[35] National Renewable Energy Laboratory, PVWatts Calculator (2015).URL http://pvwatts.nrel.gov/pvwatts.php
[36] Centraal Bureau voor de Statistiek (CBS), Rijkswaterstaat (RWS), On-derzoek Verplaatsingen in Nederland 2014 (Research on Movements in theNetherlands 2014) - Data Archiving and Networked Services (in Dutch)(2015).URL https://easy.dans.knaw.nl/
[37] Amsterdam Power Exchange, APX Market Results - APX Power NL DayAhead (April 2016).URL http://apxgroup.com/market-results/apx-power-nl
22