Fuel Cell Buses in U.S. Transit Fleets: Current Status 2018 · Fuel Cell Buses in U.S. Transit...
50
NREL is a national laboratory of the U.S. Department of Energy Office of Energy Efficiency & Renewable Energy Operated by the Alliance for Sustainable Energy, LLC This report is available at no cost from the National Renewable Energy Laboratory (NREL) at www.nrel.gov/publications. Contract No. DE-AC36-08GO28308 Technical Report NREL/TP-5400-72208 December 2018 Fuel Cell Buses in U.S. Transit Fleets: Current Status 2018 Leslie Eudy and Matthew Post National Renewable Energy Laboratory
Transcript of Fuel Cell Buses in U.S. Transit Fleets: Current Status 2018 · Fuel Cell Buses in U.S. Transit...

NREL is a national laboratory of the U.S. Department of Energy Office of Energy Efficiency & Renewable Energy Operated by the Alliance for Sustainable Energy, LLC This report is available at no cost from the National Renewable Energy Laboratory (NREL) at www.nrel.gov/publications.
Contract No. DE-AC36-08GO28308
Technical Report NREL/TP-5400-72208 December 2018
Fuel Cell Buses in U.S. Transit Fleets: Current Status 2018 Leslie Eudy and Matthew Post
National Renewable Energy Laboratory

NREL is a national laboratory of the U.S. Department of Energy Office of Energy Efficiency & Renewable Energy Operated by the Alliance for Sustainable Energy, LLC This report is available at no cost from the National Renewable Energy Laboratory (NREL) at www.nrel.gov/publications.
Contract No. DE-AC36-08GO28308
Technical Report NREL/TP-5400-72208 December 2018
National Renewable Energy Laboratory 15013 Denver West Parkway Golden, CO 80401 303-275-3000 • www.nrel.gov
Fuel Cell Buses in U.S. Transit Fleets: Current Status 2018 Leslie Eudy and Matthew Post
National Renewable Energy Laboratory
Suggested Citation Eudy, Leslie and Matthew Post. 2018. Fuel Cell Buses in U.S.Transit Fleets: Current Status 2018. Golden, CO: National Renewable Energy Laboratory. NREL/TP-5400-72208. https://www.nrel.gov/docs/fy19osti/72208.pdf.

NOTICE
This work was authored by the National Renewable Energy Laboratory, operated by Alliance for Sustainable Energy, LLC, for the U.S. Department of Energy (DOE) under Contract No. DE-AC36-08GO28308. Funding provided by the U.S. Department of Energy Office of Energy Efficiency and Renewable Energy Fuel Cell Technologies Office. The views expressed herein do not necessarily represent the views of the DOE or the U.S. Government.
This report is available at no cost from the National Renewable Energy Laboratory (NREL) at www.nrel.gov/publications.
U.S. Department of Energy (DOE) reports produced after 1991 and a growing number of pre-1991 documents are available free via www.OSTI.gov.
Cover Photos by Dennis Schroeder: (clockwise, left to right) NREL 51934, NREL 45897, NREL 42160, NREL 45891, NREL 48097, NREL 46526.
NREL prints on paper that contains recycled content.

iii This report is available at no cost from the National Renewable Energy Laboratory (NREL) at www.nrel.gov/publications.
Acknowledgments This document includes results and experiences from several U.S. fuel cell electric bus evaluation projects. The U.S. Department of Energy’s Fuel Cell Technologies Office within the Office of Energy Efficiency and Renewable Energy and the U.S. Department of Transportation Federal Transit Administration provided funding for this effort. The Federal Transit Administration and state agencies have funded fuel cell electric bus deployments and infrastructure, while the Fuel Cell Technologies Office focuses on early-stage research and technology development to meet cost and performance targets. The National Renewable Energy Laboratory appreciates the active participation of our project partners. Contributors to this report included staff members of federal and state government agencies, manufacturing firms, and transit authorities. The authors especially thank the following individuals:
Salvador Llamas, Lee Donnell, Chris Durand, and Jose Vega, Alameda-Contra Costa Transit District
Tommy Edwards and Mike Hayes, SunLine Transit Agency
Analy Castillo, University of California at Irvine
Cliff Thorne, Bill Habibe, and Joseph Townsend, Orange County Transportation Authority
Kirt Conrad, Mark Finnicum, and John Ferrell, Stark Area Regional Transit Authority
Jason Marcinkoski and Sunita Satyapal, U.S. Department of Energy
Sean Ricketson, U.S. Department of Transportation, Federal Transit Administration
Byron Somerville, Nicolas Pocard, Steve Potvin, and George Morales, Ballard Power Systems
Robert Devine, Frank Macaluso and Yesh Premkumar, BAE Systems
Nico Bouwkamp, California Fuel Cell Partnership
Jaimie Levin, Center for Transportation and the Environment
Matthew Jeffers and Jen Kurtz, National Renewable Energy Laboratory

iv This report is available at no cost from the National Renewable Energy Laboratory (NREL) at www.nrel.gov/publications.
Acronyms and Abbreviations AC Transit Alameda-Contra Costa Transit District AFCB American Fuel Cell Bus CARB California Air Resources Board CEC California Energy Commission CNG compressed natural gas dge diesel gallon equivalent DOE U.S. Department of Energy ENC ElDorado National-California FCEB fuel cell electric bus FCH JU Fuel Cell and Hydrogen Joint Undertaking FCPP fuel cell power plant ft feet FTA Federal Transit Administration gge gasoline gallon equivalent kg kilograms MBRC miles between roadcalls MBTA Massachusetts Bay Transportation Authority mph miles per hour NFCBP National Fuel Cell Bus Program NREL National Renewable Energy Laboratory OCTA Orange County Transportation Authority OEM original equipment manufacturer SARTA Stark Area Regional Transit Authority TIGGER Transit Investments for Greenhouse Gas and Energy
Reduction TRL technology readiness level UCI University of California at Irvine ZEBA Zero Emission Bay Area

v This report is available at no cost from the National Renewable Energy Laboratory (NREL) at www.nrel.gov/publications.
Definition of Terms Availability: The number of days the buses are actually available compared to the days that the buses are planned for operation expressed as percent availability.
Balance of plant: The components of the fuel cell system—such as air compressor, fans, and pumps—that support the operation of the fuel cell stack.
Clean point: The starting point for the data analysis period. For each evaluation, NREL works with the project partners to determine a starting point—or clean point—for the data analysis period. The clean point is chosen to avoid some of the early and expected operations problems with a new vehicle going into service, such as early maintenance campaigns. In some cases, reaching the clean point may require 3 to 6 months of operation before the evaluation can start.
Fast fill: Per the SAE International J2601/2 standard, a flow rate of 61 to 120 grams per second is considered a fast fill. Transit agencies have a goal of completing a full fill of a hydrogen-fueled bus in 10 minutes or less.
Miles between roadcalls (MBRC): A measure of reliability calculated by dividing the number of miles traveled by the number of roadcalls. (Also known as mean distance between failures.) MBRC results in the report are categorized as follows:
• Bus MBRC: Includes all chargeable roadcalls. Includes propulsion-related issues as well as problems with bus-related systems such as brakes, suspension, steering, windows, doors, and tires.
• Propulsion-related MBRC: Includes roadcalls that are attributed to the propulsion system. Propulsion-related roadcalls can be caused by issues with the power system (fuel cell), batteries, and hybrid systems.
• Fuel-cell-system-related MBRC: Includes roadcalls attributed to the fuel cell power plant and balance of plant only.
Revenue service: The time when a vehicle is available to the general public with an expectation of carrying fare-paying passengers. Vehicles operated in a fare-free service are also considered revenue service.
Roadcall: A failure of an in-service bus that causes the bus to be replaced on route or causes a significant delay in schedule. The analysis includes chargeable roadcalls that affect the operation of the bus or may cause a safety hazard. Non-chargeable roadcalls can be passenger incidents that require the bus to be cleaned before going back into service or problems with an accessory such as a farebox or radio.

vi This report is available at no cost from the National Renewable Energy Laboratory (NREL) at www.nrel.gov/publications.
Summary This report summarizes the progress of fuel cell electric bus (FCEB) development in the United States and discusses the achievements and challenges of introducing fuel cell propulsion in transit. The report provides a summary of results from evaluations performed by the U.S. Department of Energy’s (DOE’s) National Renewable Energy Laboratory (NREL). The data from these early FCEB deployments funded by the U.S. Department of Transportation, state agencies, and the private sector help to guide future early-stage research and development supported by DOE’s Fuel Cell Technologies Office.
NREL considers these FCEB designs to be around technology readiness level (TRL) 7 to 8, that is, full-scale validation in a relevant environment. At this point in development, capital and operating costs for FCEBs are still higher than those of conventional diesel and compressed natural gas technology. This is to be expected considering both diesel and compressed natural gas are mature technologies (TRL 9) and FCEBs are still in the early deployment stage. This annual status report combines results from all FCEB demonstrations, tracks the progress of the FCEB industry toward meeting technical targets (as shown in Table ES-1), documents the lessons learned, and discusses the path forward for commercial viability of fuel cell technology for transit buses.
The 2018 summary results primarily focus on the most recent year for each demonstration, from August 2017 through July 2018. NREL has included an up-to-date analysis of operational costs including scheduled and unscheduled cost and cost per mile by system. The primary results presented in the report are from five demonstrations of two different fuel-cell-dominant bus designs:
• American Fuel Cell Bus Project at SunLine Transit Agency in California
• American Fuel Cell Bus Project at the University of California at Irvine (UCI)
• American Fuel Cell Bus Project at Orange County Transportation Authority (OCTA)
• American Fuel Cell Bus Project at Stark Area Regional Transit Authority (SARTA)
• Zero Emission Bay Area Demonstration Group led by Alameda-Contra Costa Transit District (AC Transit) in California
The AC Transit buses have reached an advanced age, therefore NREL has ended the full analysis of that fleet. Tracking the longevity of these buses is important to verify the technology can meet the bus life and reliability targets. Data included in this report from the AC Transit fleet are limited to miles, fuel cell hours, and the roadcall analysis.
DOE and the U.S. Department of Transportation’s Federal Transit Administration (FTA) have collectively established performance and cost targets for FCEBs. These targets, established with industry input, include interim targets and ultimate targets for commercialization. FCEB technology continues to show progress toward meeting technical targets for reliability and durability while also decreasing in cost. Table ES-1 summarizes the performance of the FCEBs in the report compared to these targets.

vii This report is available at no cost from the National Renewable Energy Laboratory (NREL) at www.nrel.gov/publications.
Table ES-1. Summary of FCEB Performance Compared to DOE/FTA Targets1
Units Current Statusa 2016
Target1 Ultimate Target1 Range Average
Bus lifetime years/miles 0.2–8/ 6,000–222,000b
4.5/ 119,790 12/500,000 12/500,000
Power plant lifetimec hours 500–29,000b,d,e 13,236 18,000 25,000 Bus availability % 55–88 72 85 90 Fuel fillsf per day 1 1 1 (<10 min) 1 (<10 min)
Bus costg $ 1,270,000– 2,400,000h 1,920,000 1,000,000 600,000
Roadcall frequency (bus/fuel cell system)
miles between roadcalls
2,500–5,700/ 13,000–36,800
4,239/ 24,406
3,500/ 15,000
4,000/ 20,000
Operation time hours per day/ days per week
7–21/ 5–7
11.8/ 6 20/7 20/7
Scheduled and unscheduled maintenance costi
$/mile 0.22–0.73 0.49 0.75 0.40
Rangej miles 199–348 266 300 300
Fuel economy miles per diesel gallon equivalent 5.83–7.82 7.01 8 8
a The summary of results in this report represents data from the included demonstrations: from the beginning of each demonstration through July 2018. b Accumulated totals for existing fleet through July 2018; these buses have not reached end of life. c For the DOE/FTA targets, the power plant is defined as the fuel cell system and the battery system. The fuel cell system includes supporting subsystems such as the air, fuel, coolant, and control subsystems. Power electronics, electric drive, and hydrogen storage tanks are excluded. d The status for power plant hours is for the fuel cell system only; battery lifetime hours were not available. e The highest-hour power plant was transferred from an older-generation bus that had accumulated more than 6,000 hours prior to transfer. f Multiple sequential fuel fills should be possible without an increase in fill time. g Cost targets are projected to a production volume of 400 systems per year. This production volume is assumed for analysis purposes only and does not represent an anticipated level of sales. h Reported cost of most recent orders for FCEBs was $1.2 million. i Excludes mid-life overhaul of power plant. j Based on fuel economy and 95% tank capacity.
DOE/FTA set an ultimate performance target of 4 to 6 years (or 25,000 hours) durability for the fuel cell propulsion system, with an interim target of 18,000 hours. NREL added eight new buses to the data collection last year, bringing the total number of buses to 27. The fuel cell power plants (FCPPs) tracked by NREL continue to accumulate significant numbers of hours. NREL has now collected data on buses for more than half their useful life—8 years. Last year’s report documented a single FCPP surpassing 25,000 hours without repair or cell replacement. At the end of the analysis period for this report (July 2018), that FCPP has now surpassed 29,000 hours. Nine FCPPs have surpassed 20,000 hours. The average for the group is 13,236 hours. This is less
1 Fuel Cell Technologies Program Record # 12012, September 12, 2012, www.hydrogen.energy.gov/pdfs/12012_fuel_cell_bus_targets.pdf.

viii This report is available at no cost from the National Renewable Energy Laboratory (NREL) at www.nrel.gov/publications.
than the average reported last year due to the addition of new buses with low numbers of hours. The average for the oldest fleet is 23,364 hours.
Availability for the FCEBs ranges from a low of 55% to a high of 88% with an overall average of 72%. Bus-related problems—such as brakes, suspension, air system, and air conditioning—make up most of the unavailable days (36%). Fuel cell system issues, which make up 25% of the unavailable time, were attributed to balance of plant components and not issues with the fuel cell stack. Hybrid system problems—including issues with components such as traction motor, cooling system, and inverters—make up 19% of the unavailable days.
The interim target for bus maintenance cost is $0.70 per mile and the ultimate target is $0.40 per mile. Most of the FCEBs are still under warranty or supported by extended service contracts, so much of the maintenance costs are for labor. Although the parts costs for the older buses have increased, the parts have been from the bus systems that typically wear out with increasing age. The average maintenance costs for the AFCBs are $0.09 for scheduled maintenance and $0.40 for unscheduled maintenance for a total of $0.49 per mile.
FCEB performance continues to improve; however, there are still challenges to overcome to make the technology commercially viable. Challenges include the following.
Fuel cell system issues—Agencies report that the fuel cell stacks are proving robust and that most fuel cell system issues involve components in the balance of plant. Air blowers, compressors, and sometimes plumbing leaks have resulted in downtime for the buses. The agencies have worked well with the original equipment manufacturers (OEMs) but still have issues getting some replacement parts.
Parts supply—Transit agencies are still experiencing some issues with availability of bus components that have a long lead time for delivery. While this has improved for some components, agencies have taken the initiative to find other methods to supply parts. Upcoming FCEB projects are purchasing buses built by North American OEMs using the same platform as conventional technologies. Sharing of conventional bus parts will help improve availability of replacement parts and lower parts costs.
Range issues—The effective range of the FCEBs varies depending on fuel economy and the ability to get a full fill of the hydrogen tanks. Agencies have reported issues in getting a full fill when the station fill rate is high. After the tank cools, the tank pressure is less than 350 bar. Agencies report that this can result in the buses running low on fuel before completing scheduled service. To avoid sending a bus out with less fuel than needed, some agencies top off the fuel tanks in the morning. This adds labor time and is not optimal for typical transit operation. AC Transit has reported this issue and has been working with its station and OEM partners on a solution. The station setpoint has been increased to 380 bar so that the final pressure after cooling is closer to 350 bar.
Access to and cost of hydrogen fuel—Access to inexpensive hydrogen fuel remains a significant challenge for transit agencies deploying FCEBs. This has especially been a challenge for OCTA, which began operating its FCEB before making the decision to build a hydrogen station. In the early stage of the demonstration, OCTA partnered with UCI to use its hydrogen

ix This report is available at no cost from the National Renewable Energy Laboratory (NREL) at www.nrel.gov/publications.
station. The cost for hydrogen at that station averaged around $13 per kg. When the agreement between UCI and OCTA ended in May 2018, UCI elected to discontinue servicing the OCTA bus. OCTA has had to search for other solutions to fuel the bus. While there are other retail stations in the area, current retail prices are very high—$16 per kilogram. The average fuel costs for the other agencies with on-site stations are closer to $7 per kilogram. In addition to the higher fuel cost, OCTA incurs labor costs to fuel and drive the bus to and from the station. This has added significant costs to the project. The agency is moving forward with a new project to procure 10 more buses and build its own fueling station, which will eliminate the need to fuel outside the facility. Agencies considering FCEBs need to plan ahead to avoid this type of early deployment issue.
Fueling station issues—Transit agencies report that most hydrogen station issues involve compressor failures. Redundancy (multiple compressors) helps avoid station downtime, but a quick response time from station providers is important to maintain bus service. Transit agencies recommend negotiating the service contract with station providers to cover response time for repairs.
Training—Transit agencies deploying FCEBs cannot overemphasize the need for training staff. This includes training operators in the different start-up and shut-down procedures of the technology as well as what to do in case of a failure on route. Maintenance staff need training on safety, scheduled maintenance, diagnostics, and repair of multiple systems they may not be familiar with. Schedulers need to understand the abilities of the buses to ensure the FCEBs are assigned to route blocks within the expected range. Dispatch operators also need to understand some procedures so they can assist an operator that calls in with a bus issue. Transit agencies interested in the technology should develop a comprehensive training plan for multiple groups within the organization. Contracts with OEMs should include enough time for initial training.
The findings from the data and analyses suggest the following areas could benefit from additional early-stage research and development including but not limited to:
• Research and development of fuel cell balance of plant components (such as air compressors, blowers, and pumps) to increase reliability and durability
• Research and development of hydrogen station compressors to increase reliability
• Development and demonstration of cryo-compressed hydrogen tanks to increase bus range.

x This report is available at no cost from the National Renewable Energy Laboratory (NREL) at www.nrel.gov/publications.
Table of Contents Introduction ................................................................................................................................................. 1
Scope and Purpose .................................................................................................................................. 1 Organization ........................................................................................................................................... 1 What’s New Since the Previous Report ................................................................................................. 2
Fuel Cell Electric Buses in Operation in the United States .................................................................... 3 New Fuel Cell Buses Under Development ............................................................................................. 3 Fuel Cell Bus Demonstrations Outside North America ......................................................................... 5
FCEB Development Process—Technology Readiness Levels .............................................................. 7 Update of Evaluation Results Through July 2018 ................................................................................... 9
Baseline Buses ...................................................................................................................................... 10 Total Miles and Hours .......................................................................................................................... 11 Bus Use................................................................................................................................................. 11 Availability ........................................................................................................................................... 12 Fuel Economy ....................................................................................................................................... 14 Maintenance Cost ................................................................................................................................. 15
Total Work Order Maintenance Costs ......................................................................................... 16 Work Order Maintenance Costs Categorized by System ............................................................ 18 Propulsion-Related Work Order Maintenance Costs .................................................................. 20
Current Status of FCEB Introductions: Summary of Achievements and Challenges ....................... 22 Progress Toward Meeting Technical Targets ....................................................................................... 22
Bus and Power Plant Lifetime ..................................................................................................... 23 Bus Availability ........................................................................................................................... 24 Fuel Fills ...................................................................................................................................... 24 Bus Cost ...................................................................................................................................... 24 Roadcall Frequency ..................................................................................................................... 25 Operation Time ........................................................................................................................... 26 Scheduled and Unscheduled Maintenance Cost .......................................................................... 26 Fuel Economy and Range ........................................................................................................... 26
Remaining Challenges .......................................................................................................................... 28 Appendix: Summary Statistics ................................................................................................................ 30
SunLine AFCB Demonstration Summary ............................................................................................ 31 UCI AFCB Demonstration Summary .................................................................................................. 33 OCTA AFCB Demonstration Summary .............................................................................................. 35 SARTA AFCB Demonstration Summary ............................................................................................ 37 AC Transit Demonstration Summary ................................................................................................... 39

1 This report is available at no cost from the National Renewable Energy Laboratory (NREL) at www.nrel.gov/publications.
Introduction This report is the eleventh in a series of annual status reports from the U.S. Department of Energy’s (DOE’s) National Renewable Energy Laboratory (NREL). It summarizes status and progress from demonstrations of fuel cell transit buses in the United States. Since 2000, NREL has evaluated fuel cell electric bus (FCEB) demonstrations at transit agencies, looking at the buses, infrastructure, and each transit agency’s implementation experience. These NREL evaluations have been funded by DOE, the U.S. Department of Transportation’s Federal Transit Administration (FTA), and the California Air Resources Board (CARB).
Scope and Purpose This annual status report discusses the achievements and challenges of fuel cell propulsion for transit and summarizes the introduction of fuel cell transit buses in the United States. It provides an analysis of the combined results from fuel cell transit bus demonstrations evaluated by NREL with a focus on the most recent data (through July 2018). NREL also publishes detailed reports on individual demonstration results that are posted on the NREL website.2
The report’s intent is to inform FTA and DOE decision makers who guide future early-stage research and funding; state and local government agencies that fund new propulsion technology transit buses; and interested transit agencies and industry manufacturers.
Organization This report is organized into sections as follows.
1. Introduction 2. Fuel Cell Electric Buses in Operation in the United States: summarizes existing and
upcoming demonstrations in the United States and includes an overview of FTA’s National Fuel Cell Bus Program (NFCBP) and other programs that promote cleaner options for transit buses.
3. FCEB Development Process—Technology Readiness Levels: outlines the steps for developing and commercializing FCEBs and indicates where each of the current designs falls in the process.
4. Update of Evaluation Results Through July 2018: presents the results of the most recent NREL evaluations of fuel cell transit bus demonstrations with comparisons for availability, fuel economy, and reliability.
5. Current Status of Fuel Cell Bus Introductions: Summary of Achievements and Challenges: discusses the status and challenges of fuel cell propulsion for transit.
6. Appendix: provides summary fuel cell bus data from each of the transit agencies.
2 Website: https://www.nrel.gov/hydrogen/fuel-cell-bus-evaluation.html.

2 This report is available at no cost from the National Renewable Energy Laboratory (NREL) at www.nrel.gov/publications.
What’s New Since the Previous Report Table 1 outlines the FCEB designs that were included in the 2017 and 2018 (current) status reports. The 2017 report presented the results from five FCEB demonstration projects featuring fuel-cell-dominant designs. NREL began collecting data on another project since the last report. The AC Transit buses have reached an advanced age, therefore NREL has ended the full analysis of that fleet. Tracking the longevity of these buses is important to verify the technology can meet bus life and reliability targets. Data included in this report from the AC Transit fleet are limited to accumulated miles, fuel cell hours, and the roadcall analysis. The project at Massachusetts Bay Transportation Agency (MBTA) has ended. The four remaining evaluation projects involve operating an American Fuel Cell Bus (AFCB)3 (or multiple AFCBs) in service: one bus at the Orange County Transportation Authority (OCTA) in Orange County, California; one bus at the University of California in Irvine (UCI), and a new evaluation of five buses at the Stark Area Regional Transit Authority (SARTA) in Canton, Ohio.
Table 1. Technologies Included in the 2017 or 2018 Status Reports
FCEB Demonstration Included in 2017 Report
Included in Current Report
Status (as of 7/31/18)
AC Transit Zero Emission Bay Area (ZEBA) Select data Active
SunLine AFCB Active UCI AFCB Active OCTA AFCB Active
MBTA AFCB Demonstration ended
SARTA AFCB Active
3 The AFCB design was developed through collaboration between BAE Systems, ElDorado National-California (ENC), and Ballard Power Systems.
3 This report is available at no cost from the National Renewable Energy Laboratory (NREL) at www.nrel.gov/publications.
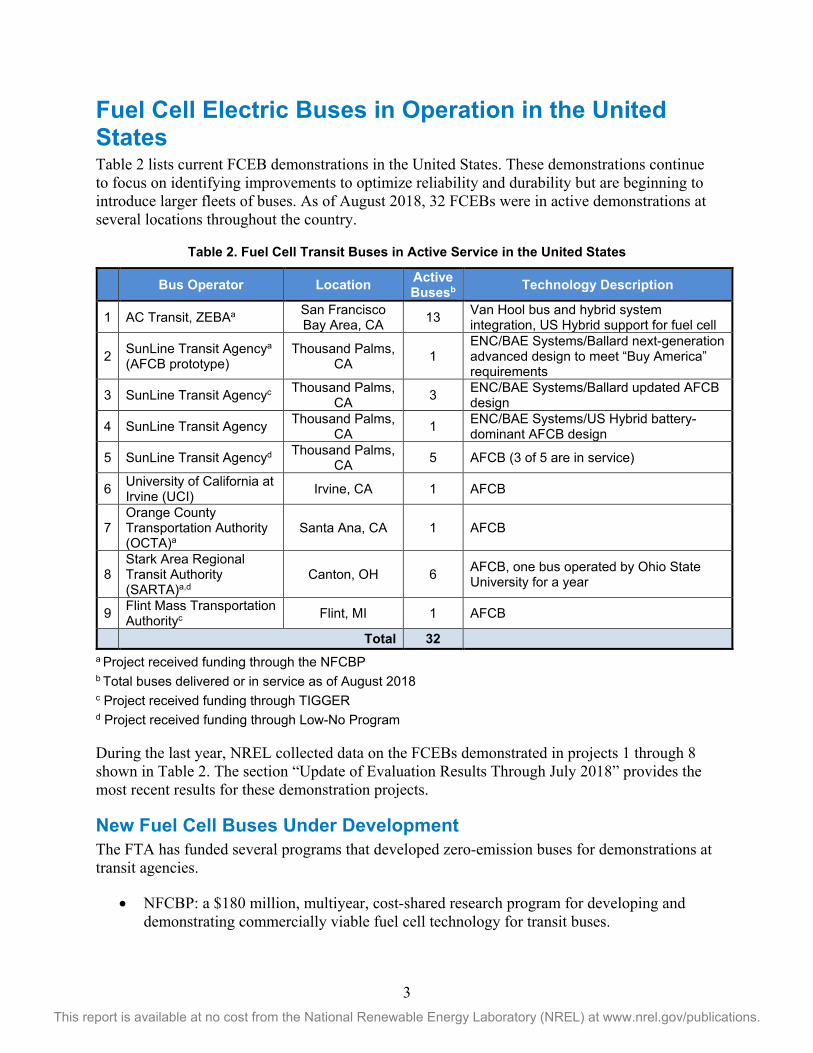
Fuel Cell Electric Buses in Operation in the United States Table 2 lists current FCEB demonstrations in the United States. These demonstrations continue to focus on identifying improvements to optimize reliability and durability but are beginning to introduce larger fleets of buses. As of August 2018, 32 FCEBs were in active demonstrations at several locations throughout the country.
Table 2. Fuel Cell Transit Buses in Active Service in the United States
Bus Operator Location Active Busesb Technology Description
1 AC Transit, ZEBAa San Francisco Bay Area, CA 13 Van Hool bus and hybrid system
integration, US Hybrid support for fuel cell
2 SunLine Transit Agencya (AFCB prototype)
Thousand Palms, CA 1
ENC/BAE Systems/Ballard next-generation advanced design to meet “Buy America” requirements
3 SunLine Transit Agencyc Thousand Palms, CA 3 ENC/BAE Systems/Ballard updated AFCB
design 4 SunLine Transit Agency Thousand Palms,
CA 1 ENC/BAE Systems/US Hybrid battery-dominant AFCB design
5 SunLine Transit Agencyd Thousand Palms, CA 5 AFCB (3 of 5 are in service)
6 University of California at Irvine (UCI) Irvine, CA 1 AFCB
7 Orange County Transportation Authority (OCTA)a
Santa Ana, CA 1 AFCB
8 Stark Area Regional Transit Authority (SARTA)a,d
Canton, OH 6 AFCB, one bus operated by Ohio State University for a year
9 Flint Mass Transportation Authorityc Flint, MI 1 AFCB
Total 32 a Project received funding through the NFCBP b Total buses delivered or in service as of August 2018 c Project received funding through TIGGER d Project received funding through Low-No Program
During the last year, NREL collected data on the FCEBs demonstrated in projects 1 through 8 shown in Table 2. The section “Update of Evaluation Results Through July 2018” provides the most recent results for these demonstration projects.
New Fuel Cell Buses Under Development The FTA has funded several programs that developed zero-emission buses for demonstrations at transit agencies.
• NFCBP: a $180 million, multiyear, cost-shared research program for developing and demonstrating commercially viable fuel cell technology for transit buses.

4 This report is available at no cost from the National Renewable Energy Laboratory (NREL) at www.nrel.gov/publications.
• Transit Investments for Greenhouse Gas and Energy Reduction (TIGGER): $225 million for capital investments that would reduce greenhouse gas emissions and/or lower the energy use of public transportation systems.
• Low or No Emission Vehicle Deployment Program (Low-No Program): $271 million in funding (FY13–FY18) to transit agencies for capital purchases of zero-emission and low-emission transit buses that have been largely proven in testing and demonstration efforts but are not yet widely deployed.
The NFCBP is a multiyear, cost-shared research program established by FTA in 2006, with an overall goal of developing and demonstrating commercially viable fuel cell technology for transit buses. Additional funding was added to the program over the following 4 years. Projects were competitively selected and included fuel cell bus demonstrations, component development projects, and outreach projects. Many of the projects have been completed. The remaining projects are being managed by two nonprofit consortia—CALSTART (Pasadena, California) and the Center for Transportation and the Environment (Atlanta, Georgia). NREL was funded as a third-party evaluator to assess the viability of the buses demonstrated under the program.
Beyond the NFCBP, FTA has funded fuel cell bus research at several universities and transit agencies around the country. The TIGGER program funded numerous zero-emission buses at transit agencies in the United States. Most of those buses are battery electric buses (BEBs); however, SunLine and Flint MTA received funding for FCEBs. These TIGGER projects, listed in Table 2, include an upgraded AFCB design based on lessons learned from the first bus demonstrated at SunLine. The prototype bus was also upgraded to match the configuration of the rest of the AFCB fleet.
FTA’s newest program is the Low-No Program. This program provides funding for capital acquisitions or leases of zero-emission and low-emission transit buses, including BEBs and FCEBs. The primary purpose is to deploy the cleanest U.S.-made transit buses that have been proven in testing and demonstrations but are not yet widely deployed in transit fleets. Since the inception of the program, 140 projects were awarded more than $271 million in funding to add low- or zero-emission buses to transit fleets across the United States. At least 385 buses will be deployed through the program including FCEBs, BEBs, and hybrid electric buses. The FCEB projects include 17 FCEBs. Ten buses have been delivered: five AFCBs to SunLine and five AFCBs to SARTA in Canton, Ohio. Planned projects include five more AFCBs at SARTA, and two New Flyer FCEBs will be deployed at Champaign-Urbana Mass Transit District in Illinois.
The state of California funds technology development and demonstration programs that include FCEB projects. Both the California Energy Commission (CEC) and CARB have funded demonstrations of FCEBs. One of the more recent programs is CARB’s Zero-Emission Truck and Bus Pilot Commercial Deployment Projects. Two FCEB-related projects have been approved for funding. Table 3 lists the new demonstration projects from all funding sources that are expected to field as many as 35 more fuel cell buses over the next few years.

5 This report is available at no cost from the National Renewable Energy Laboratory (NREL) at www.nrel.gov/publications.
Table 3. New Fuel Cell Transit Buses Planned in the United States
Bus Operator Program Location
Number of
Buses Technology Description Actual/Estimated
Service Start
AC Transit (CALSTART) NFCBP Oakland,
CA 1
New Flyer 60-ft bus with next-generation Ballard fuel cell, Siemens hybrid propulsion system
October 2018
SARTA NFCBP Canton, Columbus, OH
1 AFCB Q4 2018
SunLine CEC Thousand Palms, CA 1 New Flyer Xcelsior 40-ft
bus, Hydrogenics fuel cell Q4 2018
SARTA Low-No (2016/17) Canton, OH 5 AFCB TBD
AC Transit, OCTA CARB
Oakland, Santa Ana, CA
20 New Flyer bus with Ballard fuel cell, 10 buses for each agency
Q4 2018
SunLine CARB Thousand Palms, CA 5 New Flyer bus with Ballard
fuel cell Q4 2018
Champaign-Urbana Mass Transit District
Low-No (2017)
Champaign-Urbana, IL 2 New Flyer 60-ft bus with
Ballard fuel cell 2020
Total 35 Fuel Cell Bus Demonstrations Outside North America Many countries worldwide are investing in fuel cell bus technology and are funding demonstration projects to commercialize the technology. Knowledge of the major demonstrations outside North America facilitates our understanding of how the technology is progressing worldwide. Although this report focuses on U.S. projects, several international demonstrations are of interest. In the previous report, NREL outlined several projects in Europe and other parts of the world that were focused on FCEBs. Table 4 provides examples of projects to deploy FCEBs outside the United States.

6 This report is available at no cost from the National Renewable Energy Laboratory (NREL) at www.nrel.gov/publications.
Table 4. Examples of Deployment Projects Outside the United States4
Project Description Cities/Regions Number of Buses
CHIC
Clean Hydrogen in European Cities (CHIC): a public-private partnership to build on previous experience to demonstrate FCEBs (FCH JUa) 5
9 54
High V.LO-City Accelerate the market for new-generation FCEBs (FCH JU) 6 4 14
HyTransit Introduce FCEBs and hydrogen infrastructure to Scotland (FCH JU) 7 1 6
3Emotion
Environmentally friendly Efficient Electric Motion (3Emotion) project aims to bridge the gap between current demonstrations and larger deployments of FCEBs (FCH JU) 8
6 21
JIVE
Joint Initiative for hydrogen Vehicles across Europe (JIVE) addresses issues of cost of ownership and availability (FCH JU) 9
9 142
JIVE 2 Second generation of the JIVE initiative10 14 152
H2BusEurope Large-scale deployment of FCEBs and hydrogen infrastructure11 multiple 600
Toyota Introduce FCEBs for 2020 Olympic Games in Tokyo12 1 100
Hyundai
South Korean government announced plans to deploy 1,000 FCEBs by 2022, and to fully electrify fleet by 2030. (FCEB and BEB) 13
multiple 1,000
China Deploy FCEBs in multiple cities and for the 2022 Winter Olympics14 multiple ~200
India Prototype FCEB from Tata Motors 1 1 Total Buses 2,290
a FCH JU: Fuel Cell and Hydrogen Joint Undertaking
4 Based on publicly available information at the time of publication. 5 CHIC-Final Publishable Summary Report: http://chic-project.eu/ 6 Project website: http://highvlocity.eu 7 Project website: http://aberdeeninvestlivevisit.co.uk/H2-Aberdeen/Hydrogen-Bus/Hydrogen-Bus-Project.aspx 8 Project website: http://www.3emotion.eu/ 9 Project description: http://www.fch.europa.eu/project/joint-initiative-hydrogen-vehicles-across-europe 10 Project description: https://www.fch.europa.eu/project/joint-initiative-hydrogen-vehicles-across-europe-2 11 Press release: https://ec.europa.eu/inea/en/news-events/newsroom/eu-to-invest-nearly-%E2%82%AC700-million-sustainable-and-innovative-transport; https://nelhydrogen.com/press-release/nel-asa-eu-awards-funding-for-large-scale-hydrogen-bus-project/ 12 Toyota press release: https://newsroom.toyota.co.jp/en/corporate/21863761.html 13 News release: https://fuelcellsworks.com/news/hyundai-puts-hydrogen-powered-buses-into-service-in-seoul/ 14 News release: https://fuelcellsworks.com/news/largest-chinese-fuel-cell-bus-order-issued-for-2022-winter-olympics

7 This report is available at no cost from the National Renewable Energy Laboratory (NREL) at www.nrel.gov/publications.
FCEB Development Process—Technology Readiness Levels In the 2012 status report, NREL introduced a guideline for assessing the technology readiness level (TRL) for FCEBs. This guideline was developed using a Technology Readiness Assessment Guide15 published by DOE in September 2011. NREL presented a TRL guide tailored for the commercialization of FCEBs. The guideline considers the FCEB as a whole and does not account for differing TRLs for separate components or subsystems. Some subsystems may include off-the-shelf components that are considered commercial, while other subsystems may feature newly designed components at an earlier TRL. Figure 1 provides a graphic representation of this process. A table outlining the TRLs and definitions is included in the Appendix.
Figure 1. Graphic representation of the commercialization process developed for FCEBs
FCEB development is currently in the latter half of the technology demonstration/commissioning phase that includes TRLs 6 through 8. This phase begins the process of validating the design, analyzing the results, and reconfiguring or optimizing the design as needed. At this point in development, capital and operating costs for FCEBs are still higher than those of conventional diesel and CNG technology. This is to be expected, considering both diesel and CNG are mature technologies (TRL 9) and FCEBs are still in the early deployment stage. Currently, there are three FCEB designs in service or planned for operation in the United States.
ENC, based in California, builds buses in the United States that meet “Buy America” requirements. The buses are built on ENC’s manufacturing line along with all other propulsion technologies that the company offers. An AFCB recently completed testing at the Altoona Bus Research and Testing Center, which is a requirement for transit agencies that use FTA funds. This is a major step toward commercialization of FCEBs. When accounting for planned procurements, there will be at least 26 AFCBs in service within the next few years. NREL considers this design to be in the TRL 8 stage.
New Flyer is a Canada-based original equipment manufacturer (OEM) with manufacturing facilities in the United States. Buses built by New Flyer meet “Buy America” requirements. New
15 DOE Technology Readiness Assessment Guide, G 143.3-4a, available at http://www2.lbl.gov/DIR/assets/docs/TRL%20guide.pdf.

8 This report is available at no cost from the National Renewable Energy Laboratory (NREL) at www.nrel.gov/publications.
Flyer offers a FCEB design based on its current Xcelsior platform. Using a shared platform for all its propulsion technologies is expected to contribute to cost reductions and higher reliability. New Flyer’s 60-foot version of its FCEB design recently completed testing at Altoona. This new FCEB design increases the choices for transit agencies interested in adopting the technology. Although the design has completed Altoona testing, it has not been deployed in service as of this report. The OEM has orders for at least twenty-five 40-foot FCEBs that will be placed in service in California in the next year. NREL considers this design to be in the TRL 7 stage, beginning full-scale validation in a relevant environment.
Van Hool is a Belgium-based OEM that produces FCEBs primarily for Europe. The FCEBs at AC Transit are model year 2010 buses built by Van Hool and were funded through the NFCBP. At the onset of the NFCBP, no U.S.-based OEMs were offering FCEBs, so FTA granted those projects a waiver for meeting “Buy America” requirements. Van Hool is moving forward with a next-generation FCEB design in Europe; however, transit agencies in the United States are not likely to purchase those buses because of the FTA requirements. Van Hool has announced plans to build a plant in Tennessee to supply diesel and CNG buses to the U.S. market. The OEM could potentially offer FCEBs for future procurements. NREL considers this design to be in the TRL 8 stage.

9 This report is available at no cost from the National Renewable Energy Laboratory (NREL) at www.nrel.gov/publications.
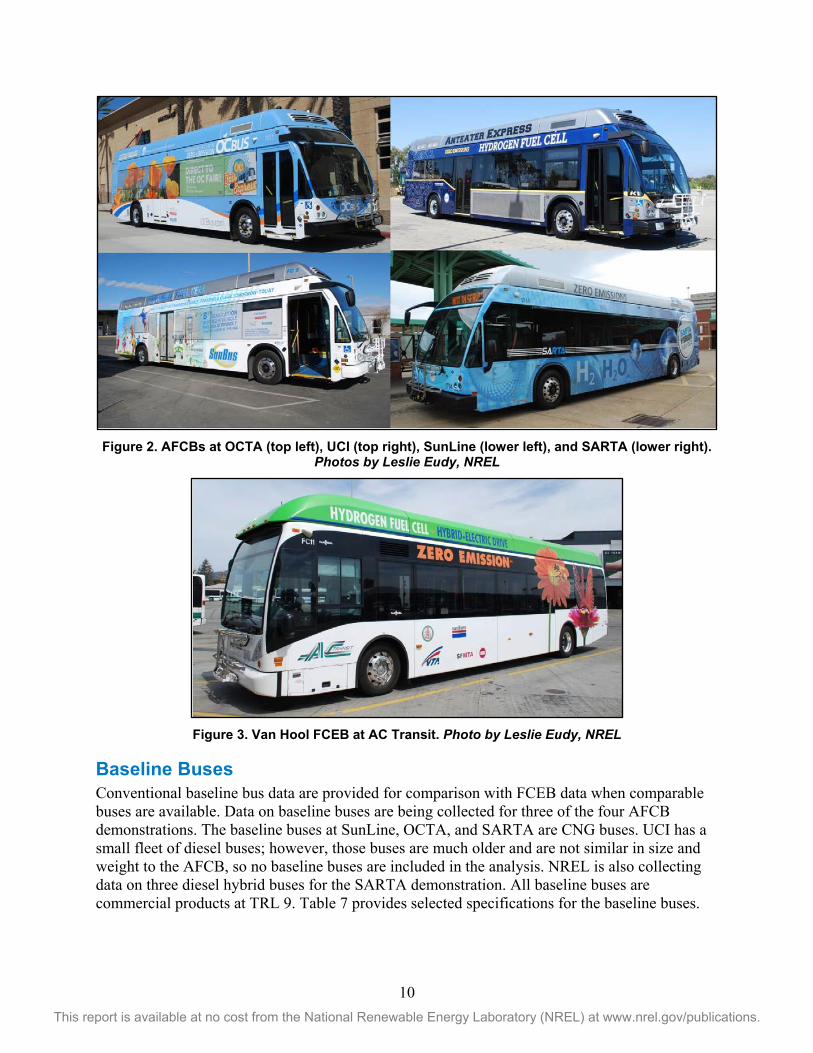
Update of Evaluation Results Through July 2018 The data presented in this section represent the most recent results that have not been presented in a previous annual status report. Most of these data come from the four demonstrations of AFCBs at SunLine, OCTA, UCI, and SARTA. A selection of data is included from the FCEBs at AC Transit. To simplify the presentation of the data, each FCEB is assigned an identifier that includes a site abbreviation followed by a manufacturer or project designation. Table 5 provides some specifications for each FCEB design. Table 6 outlines the number of buses at each site and provides the unique identifier used in the tables and figures in the following sections. The buses at UCI, OCTA, and SARTA are the same configuration as the buses at SunLine. Figure 2 shows the AFCBs operated at SunLine, UCI, OCTA, and SARTA. Figure 3 shows a picture of one of the Van Hool FCEBs at AC Transit.
Table 5. Selected FCEB Specifications
AFCB Van Hool FCEB Bus OEM ENC Van Hool Model Axcess A300L Bus length 40 ft 40 ft Gross vehicle weight 43,420 lb 39,350 lb Fuel cell OEM Ballard UTC Power Fuel cell model FCvelocity HD6 Puremotion 120 Fuel cell power (kW) 150 gross power 120 net power Hybrid system integrator BAE Systems Van Hool Design strategy Fuel cell dominant Fuel cell dominant Energy storage OEM A123 EnerDel Energy storage type Li-ion Li-ion Energy storage capacity 11 kWh 21 kWh Hydrogen storage pressure (psi) 5,000 5,000
Hydrogen cylinders 8 8 Hydrogen capacity (kg) 50 40
Table 6. FCEB Identifiers and Numbers by Site
Identifier Transit Agency Design
Number of
Buses Model Year Data Included
SL AFCB SunLine AFCB 7 2011, 2014, 2018 All
UCI AFCB Anteater Express, UCI AFCB 1 2015 All
OCTA AFCB OCTA AFCB 1 2016 All SARTA AFCB SARTA AFCB 5 2017 All
ACT ZEBA AC Transit Van Hool 13 2010 Miles and fuel cell hours
10 This report is available at no cost from the National Renewable Energy Laboratory (NREL) at www.nrel.gov/publications.
Figure 2. AFCBs at OCTA (top left), UCI (top right), SunLine (lower left), and SARTA (lower right).
Photos by Leslie Eudy, NREL
Figure 3. Van Hool FCEB at AC Transit. Photo by Leslie Eudy, NREL
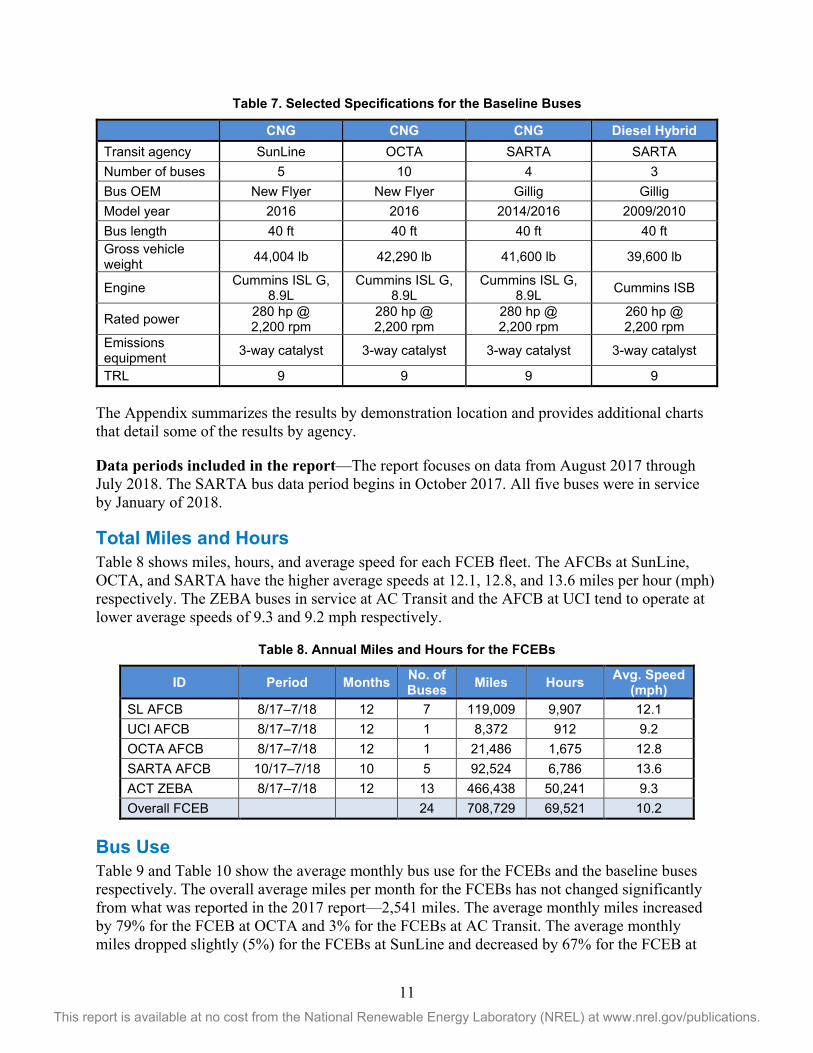
Baseline Buses Conventional baseline bus data are provided for comparison with FCEB data when comparable buses are available. Data on baseline buses are being collected for three of the four AFCB demonstrations. The baseline buses at SunLine, OCTA, and SARTA are CNG buses. UCI has a small fleet of diesel buses; however, those buses are much older and are not similar in size and weight to the AFCB, so no baseline buses are included in the analysis. NREL is also collecting data on three diesel hybrid buses for the SARTA demonstration. All baseline buses are commercial products at TRL 9. Table 7 provides selected specifications for the baseline buses.
11 This report is available at no cost from the National Renewable Energy Laboratory (NREL) at www.nrel.gov/publications.
Table 7. Selected Specifications for the Baseline Buses
CNG CNG CNG Diesel Hybrid Transit agency SunLine OCTA SARTA SARTA Number of buses 5 10 4 3 Bus OEM New Flyer New Flyer Gillig Gillig Model year 2016 2016 2014/2016 2009/2010 Bus length 40 ft 40 ft 40 ft 40 ft Gross vehicle weight 44,004 lb 42,290 lb 41,600 lb 39,600 lb
Engine Cummins ISL G, 8.9L
Cummins ISL G, 8.9L
Cummins ISL G, 8.9L Cummins ISB
Rated power 280 hp @ 2,200 rpm
280 hp @ 2,200 rpm
280 hp @ 2,200 rpm
260 hp @ 2,200 rpm
Emissions equipment 3-way catalyst 3-way catalyst 3-way catalyst 3-way catalyst
TRL 9 9 9 9
The Appendix summarizes the results by demonstration location and provides additional charts that detail some of the results by agency.
Data periods included in the report—The report focuses on data from August 2017 through July 2018. The SARTA bus data period begins in October 2017. All five buses were in service by January of 2018.
Total Miles and Hours Table 8 shows miles, hours, and average speed for each FCEB fleet. The AFCBs at SunLine, OCTA, and SARTA have the higher average speeds at 12.1, 12.8, and 13.6 miles per hour (mph) respectively. The ZEBA buses in service at AC Transit and the AFCB at UCI tend to operate at lower average speeds of 9.3 and 9.2 mph respectively.
Table 8. Annual Miles and Hours for the FCEBs
ID Period Months No. of Buses Miles Hours Avg. Speed
(mph) SL AFCB 8/17–7/18 12 7 119,009 9,907 12.1 UCI AFCB 8/17–7/18 12 1 8,372 912 9.2 OCTA AFCB 8/17–7/18 12 1 21,486 1,675 12.8 SARTA AFCB 10/17–7/18 10 5 92,524 6,786 13.6 ACT ZEBA 8/17–7/18 12 13 466,438 50,241 9.3 Overall FCEB 24 708,729 69,521 10.2
Bus Use Table 9 and Table 10 show the average monthly bus use for the FCEBs and the baseline buses respectively. The overall average miles per month for the FCEBs has not changed significantly from what was reported in the 2017 report—2,541 miles. The average monthly miles increased by 79% for the FCEB at OCTA and 3% for the FCEBs at AC Transit. The average monthly miles dropped slightly (5%) for the FCEBs at SunLine and decreased by 67% for the FCEB at

12 This report is available at no cost from the National Renewable Energy Laboratory (NREL) at www.nrel.gov/publications.
UCI. All four baseline bus fleets are operated for more miles than the FCEBs fleets are, with an overall average of 4,096 miles per month.
Table 9. FCEB Monthly Miles
FCEB Miles
ID Period Months No. of Buses
Total Miles
Avg. Monthly
Miles SL AFCB 8/17–7/18 12 7 119,009 2,104 UCI AFCB 8/17–7/18 12 1 8,372 698 OCTA AFCB 8/17–7/18 12 1 21,486 1,791 SARTA AFCB 10/17–7/18 10 5 92,524 2,056 ACT ZEBA 8/17–7/18 12 13 466,438 2,990 Overall 25 708,729 2,513
Table 10. Baseline Bus Miles
Baseline Bus Miles
ID Period Months No. of Buses
Total Miles
Avg. Monthly
Miles SL CNG 8/17–7/18 12 5 324,451 5,408 OCTA CNG 8/17–7/18 12 10 412,250 3,435 SARTA CNG 10/17–7/18 10 4 182,536 4,563 SARTA Hybrid 8/17–7/18 10 3 88,453 3,402 Overall 22 1,007,690 4,096
Availability Availability for all NREL’s evaluations is calculated as the percentage of days the buses are actually available out of days that buses are planned for operation. Planned service days for these evaluations vary depending on the transit agency. Some agencies have planned service every day while others plan for weekdays only with some weekend service. For agencies with planned weekday service, weekends are included in the calculation only if the bus operated in service on those days. If a bus is not scheduled to operate on the weekend or on a holiday, it is not counted as unavailable. Table 11 summarizes the availability of the FCEBs at each transit agency and the baseline buses. OCTA does not provide data to assess the availability of individual buses but reports its overall CNG fleet averages 86% availability. The overall availability for the FCEBs as a group is 71%.
At SunLine, the buses are typically planned to operate on weekdays; however, they often operate on weekends as well. SunLine had an increase in availability from 73% last reporting period to 77% this period. Individual availability for the four buses ranged between 66% and 88% for the data period. Most issues affecting availability were attributed to general bus maintenance.

13 This report is available at no cost from the National Renewable Energy Laboratory (NREL) at www.nrel.gov/publications.
The UCI AFCB is operated on campus circulator routes and is planned for weekday service when the university is in session. The bus is often used for training during the summer when the university is not in session. The UCI AFCB had an average availability of 58% during the data period, which is a significant decrease from last year when the bus achieved 90% availability. Most of the downtime was for an issue with the radiator in September and October 2017. The bus also developed an issue with the air compressor for the fuel cell in February 2018.
The OCTA buses are expected to operate every day. The OCTA AFCB had an availability of 77%. Most of the downtime was due to general bus issues and time for preventive maintenance early in the data period.
Table 11. Availability for the FCEBs and Baseline Buses
ID Period Months No. of Buses
Planned Days
Days Available
Percent Available
SL AFCB 8/17–7/18 12 7 1,379 1,068 77.4 UCI AFCB 8/17–7/18 12 1 231 134 58.0 OCTA AFCB 8/17–7/18 12 1 344 265 77.0 SARTA AFCB 10/17–7/18 10 5 1,140 743 65.2 Overall FCEB 14 3,094 2,210 71.4 SL CNG 8/17–7/18 12 5 1,662 1,442 86.8 SARTA CNG 10/17–7/18 10 4 986 758 76.9 SARTA Hybrid 10/17–7/18 10 3 597 515 86.3
Figure 4 tracks the overall monthly availability for the FCEBs and baseline buses. The overall average availability for the FCEBs as a group is shown in dark green. The overall availability of the fuel cell system is also included on the chart as a light green line. The fuel cell system availability was above the DOE/FTA ultimate target of 90% for most of the reporting period.
Figure 4. Monthly availability for the FCEBs and baseline buses

14 This report is available at no cost from the National Renewable Energy Laboratory (NREL) at www.nrel.gov/publications.
Figure 5 presents a pie chart that shows the overall availability for the data period and separates the reasons for unavailability by category for the FCEBs as a group. (Individual pie charts for each demonstration are included in the Appendix.) The data provided for the demonstrations included the specific reason for each day a bus was not available. The FC system category includes the fuel cell module and balance of plant components. The hybrid propulsion category includes electric drive components not including the battery pack. Most of the issues causing downtime were due to bus-related components or preventive maintenance (PM). Some agencies report longer times to accomplish PMs, primarily due to training time for maintenance staff. This categorization is based on the diagnostic information at that time. Occasionally, an issue proves challenging to troubleshoot and the cause is eventually traced to a system other than that of the original diagnosis. For these cases, NREL changes the unavailability reason retroactively to reflect the updated information.
Figure 5. Reasons for unavailability for the FCEBs
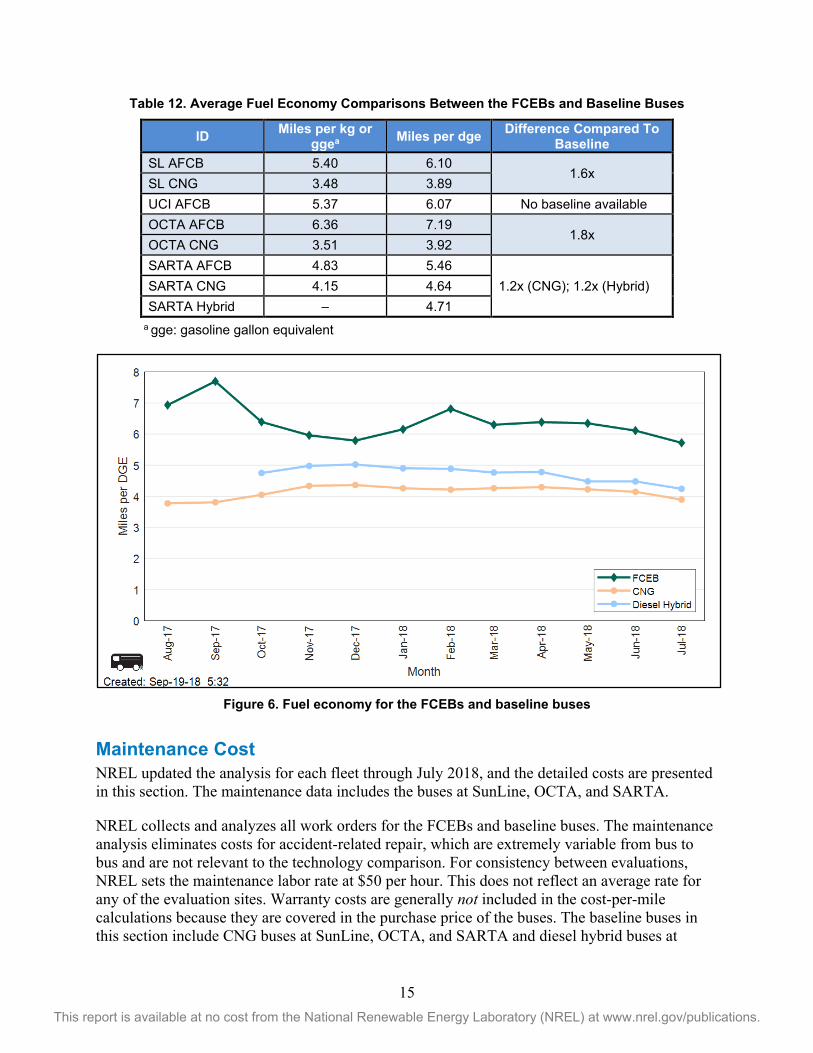
Fuel Economy Table 12 shows the average in-use fuel economy for the data period in miles per diesel gallon equivalent (dge) for each type of FCEB compared to the conventional baseline bus technology at the same site, if available. The AFCBs at SunLine show improved fuel economy that is 1.6 times higher than that of the CNG baseline buses. As mentioned previously, the UCI AFCB has no similar baseline buses for comparison. The OCTA AFCB fuel economy is 1.8 times that of the CNG baseline buses. The SARTA AFCBs have an average fuel economy that is 1.2 times that of both the CNG and diesel hybrid buses. Figure 6 shows the monthly average fuel economy for the FCEBs as a group compared to the baseline buses.
15 This report is available at no cost from the National Renewable Energy Laboratory (NREL) at www.nrel.gov/publications.
Table 12. Average Fuel Economy Comparisons Between the FCEBs and Baseline Buses
ID Miles per kg or ggea Miles per dge Difference Compared To
Baseline SL AFCB 5.40 6.10
1.6x SL CNG 3.48 3.89 UCI AFCB 5.37 6.07 No baseline available OCTA AFCB 6.36 7.19
1.8x OCTA CNG 3.51 3.92 SARTA AFCB 4.83 5.46
1.2x (CNG); 1.2x (Hybrid) SARTA CNG 4.15 4.64 SARTA Hybrid – 4.71
a gge: gasoline gallon equivalent
Figure 6. Fuel economy for the FCEBs and baseline buses
Maintenance Cost NREL updated the analysis for each fleet through July 2018, and the detailed costs are presented in this section. The maintenance data includes the buses at SunLine, OCTA, and SARTA.
NREL collects and analyzes all work orders for the FCEBs and baseline buses. The maintenance analysis eliminates costs for accident-related repair, which are extremely variable from bus to bus and are not relevant to the technology comparison. For consistency between evaluations, NREL sets the maintenance labor rate at $50 per hour. This does not reflect an average rate for any of the evaluation sites. Warranty costs are generally not included in the cost-per-mile calculations because they are covered in the purchase price of the buses. The baseline buses in this section include CNG buses at SunLine, OCTA, and SARTA and diesel hybrid buses at

16 This report is available at no cost from the National Renewable Energy Laboratory (NREL) at www.nrel.gov/publications.
SARTA. NREL has combined the data for the CNG fleets. The diesel hybrid buses are older and out of warranty. Table 13 outlines the data sets used in the analysis.
Table 13. Fleet Data Sets Used in the Maintenance Analysis
Fleet Name Agency No. of Buses
Data Set Start Date
Data Set End Date
Total Months Dates of Analysis Under
Warranty
AFCB SunLine 7 3/1/2012 7/31/2018 77 Aug 2017–Jul 2018 Some
buses OCTA 1 6/1/2016 7/31/2018 26 Aug 2017–Jul 2018 Yes
SARTA 5 10/1/2017 7/31/2018 10 Oct 2017–Jul 2018 Yes Diesel Hybrid SARTA 3 10/1/2017 7/31/2018 10 Oct 2017–Jul 2018 No
CNG SunLine 5 1/1/2017 7/31/2017 19 Aug 2017–Jul 2018 Yes OCTA 10 5/1/2016 7/31/2017 15 Aug 2017–Jul 2018 No
SARTA 4 10/1/2017 7/31/2018 10 Oct 2017–Jul 2018 No
This section first covers total maintenance costs and then maintenance costs by bus system.
Total Work Order Maintenance Costs Total maintenance costs include the price of parts and labor rates at $50 per hour. NREL calculates the cost per mile as follows:
Cost per mile = [(labor hours * 50) + parts cost] / mileage
Table 14 shows total maintenance costs for the FCEBs and baseline buses. The table includes total cost and separates scheduled and unscheduled maintenance cost per mile by fleet. Scheduled maintenance includes safety inspections and preventive maintenance at planned mileage intervals.
Table 14. Total Work Order Maintenance Cost
Fleet Mileage Parts ($) Labor Hours
Total Cost per Mile ($)
Scheduled Cost per Mile
($)
Unscheduled Cost per Mile ($)
AFCB 233,919 15,714.85 1,927.3 0.48 0.10 0.38 CNG 919,237 80,553.66 3,507.1 0.28 0.11 0.17 Diesel Hybrid 88,468 11,369.32 415.2 0.36 0.10 0.26
Figure 7 provides the scheduled and unscheduled cost per mile by fleet for the data period. The FCEB fleet has the highest total maintenance cost, followed by the diesel hybrid and CNG fleets. Scheduled service is similar for the three bus types, but it is slightly higher for the CNG buses primarily due to the added scheduled maintenance for changing spark plugs on the Cummins ISLG engine, which is more frequent than for previous CNG engines.

17 This report is available at no cost from the National Renewable Energy Laboratory (NREL) at www.nrel.gov/publications.
Figure 7. Scheduled and unscheduled costs
Figure 8 provides the cost per mile separated by parts and labor. Parts costs make up 35% of the total costs for the diesel hybrid buses, 32% for the CNG buses, and only 14% for the AFCBs. Because most of the FCEBs are still under warranty or supported by the OEMs under the project, costs for high dollar parts are not covered by the agencies.

18 This report is available at no cost from the National Renewable Energy Laboratory (NREL) at www.nrel.gov/publications.
Figure 8. Parts and labor costs per mile
Work Order Maintenance Costs Categorized by System Table 15 shows maintenance costs by vehicle system and bus study group (without warranty costs). Figure 9 presents the data graphically. The vehicle systems shown in the table are as follows:
• Cab, body, and accessories: Includes body, glass, and paint repairs; cab and sheet metal repairs on seats and doors; and accessory repairs such as hubodometers, fareboxes, and radios
• Propulsion-related systems: Repairs for exhaust, fuel, engine, electric motors, fuel cell modules, propulsion control, non-lighting electrical (charging, cranking, and ignition), air intake, cooling, and transmission
• Preventive maintenance inspections (PMI): Labor for inspections during preventive maintenance (parts for scheduled maintenance, such as filters and fluids, are included in the specific system categories; for example, oil and oil filters are included in the engine subsystem parts costs, while air filters are included in the air subsystem parts costs)
• Brakes
• Frame, steering, and suspension

19 This report is available at no cost from the National Renewable Energy Laboratory (NREL) at www.nrel.gov/publications.
• Heating, ventilation, and air conditioning (HVAC)
• Lighting
• Air system, general
• Axles, wheels, and drive shaft
• Tires.
Table 15. Work Order Maintenance Cost per Mile by System (Report Data Period)16
System AFCB CNG Diesel Hybrid
Propulsion-related 0.09 0.05 0.10 Cab, body, and accessories 0.21 0.09 0.09 PMI 0.09 0.06 0.05 Brakes 0.02 0.03 0.01 Frame, steering, and suspension 0.04 0.01 0.04 HVAC 0.02 0.01 0.04 Lighting 0.00 0.00 0.01 General air system repairs 0.00 0.00 0.01 Axles, wheels, and drive shaft 0.00 0.01 0.00 Tires 0.01 0.00 0.01
Total 0.48 0.28 0.36
The color shading denotes the systems with the highest percentage of maintenance costs: orange for the highest, green for the second highest, and purple for the third highest. The systems with the highest percentage of maintenance costs for the AFCBs and CNG buses were (1) cab, body, and accessories; (2) PMI; and (3) propulsion-related. The systems with the highest percentage of maintenance costs for the diesel hybrid buses were (1) propulsion-related; (2) cab, body, and accessories; and (3) PMI.
16 Most of the values shown as zero are not necessarily zero, but they are so low that they round to zero.

20 This report is available at no cost from the National Renewable Energy Laboratory (NREL) at www.nrel.gov/publications.
Figure 9. Maintenance cost per mile by system
Propulsion-Related Work Order Maintenance Costs Propulsion-related vehicle systems include the exhaust, fuel, engine/fuel cell system, electric propulsion, air intake, cooling, non-lighting electrical, and transmission systems. These systems have been separated to highlight maintenance costs most directly affected by the advanced propulsion system changes for the buses. Figure 10 shows the propulsion-related system maintenance by subsystem for the groups of buses during the data period. The subsystems with the highest percentage of maintenance costs for the AFCBs were cooling, electric drive, and fuel cell. The CNG buses had the highest maintenance costs in the engine, transmission, and cranking/charging subcategories. The diesel hybrid buses had the highest maintenance costs for the fueling, hydraulic, and engine subsystems.

21 This report is available at no cost from the National Renewable Energy Laboratory (NREL) at www.nrel.gov/publications.
Figure 10. Propulsion system cost per mile by subsystem
22 This report is available at no cost from the National Renewable Energy Laboratory (NREL) at www.nrel.gov/publications.
Current Status of FCEB Introductions: Summary of Achievements and Challenges FCEB technology continues to show progress toward meeting technical targets for reliability and durability while also decreasing in cost. This section discusses the progress being made and the challenges that remain to bring FCEBs to the market.
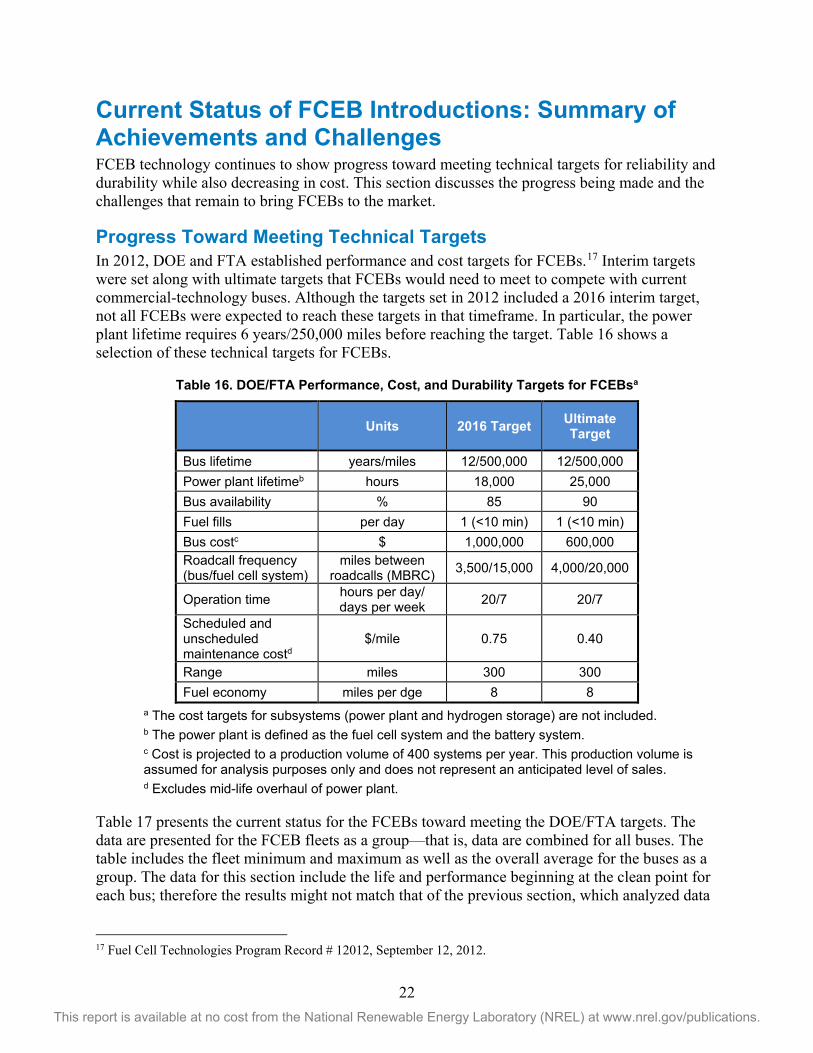
Progress Toward Meeting Technical Targets In 2012, DOE and FTA established performance and cost targets for FCEBs.17 Interim targets were set along with ultimate targets that FCEBs would need to meet to compete with current commercial-technology buses. Although the targets set in 2012 included a 2016 interim target, not all FCEBs were expected to reach these targets in that timeframe. In particular, the power plant lifetime requires 6 years/250,000 miles before reaching the target. Table 16 shows a selection of these technical targets for FCEBs.
Table 16. DOE/FTA Performance, Cost, and Durability Targets for FCEBsa
Units 2016 Target Ultimate
Target
Bus lifetime years/miles 12/500,000 12/500,000 Power plant lifetimeb hours 18,000 25,000 Bus availability % 85 90 Fuel fills per day 1 (<10 min) 1 (<10 min) Bus costc $ 1,000,000 600,000 Roadcall frequency (bus/fuel cell system)
miles between roadcalls (MBRC) 3,500/15,000 4,000/20,000
Operation time hours per day/ days per week 20/7 20/7
Scheduled and unscheduled maintenance costd
$/mile 0.75 0.40
Range miles 300 300 Fuel economy miles per dge 8 8
a The cost targets for subsystems (power plant and hydrogen storage) are not included. b The power plant is defined as the fuel cell system and the battery system.
c Cost is projected to a production volume of 400 systems per year. This production volume is assumed for analysis purposes only and does not represent an anticipated level of sales.
d Excludes mid-life overhaul of power plant.
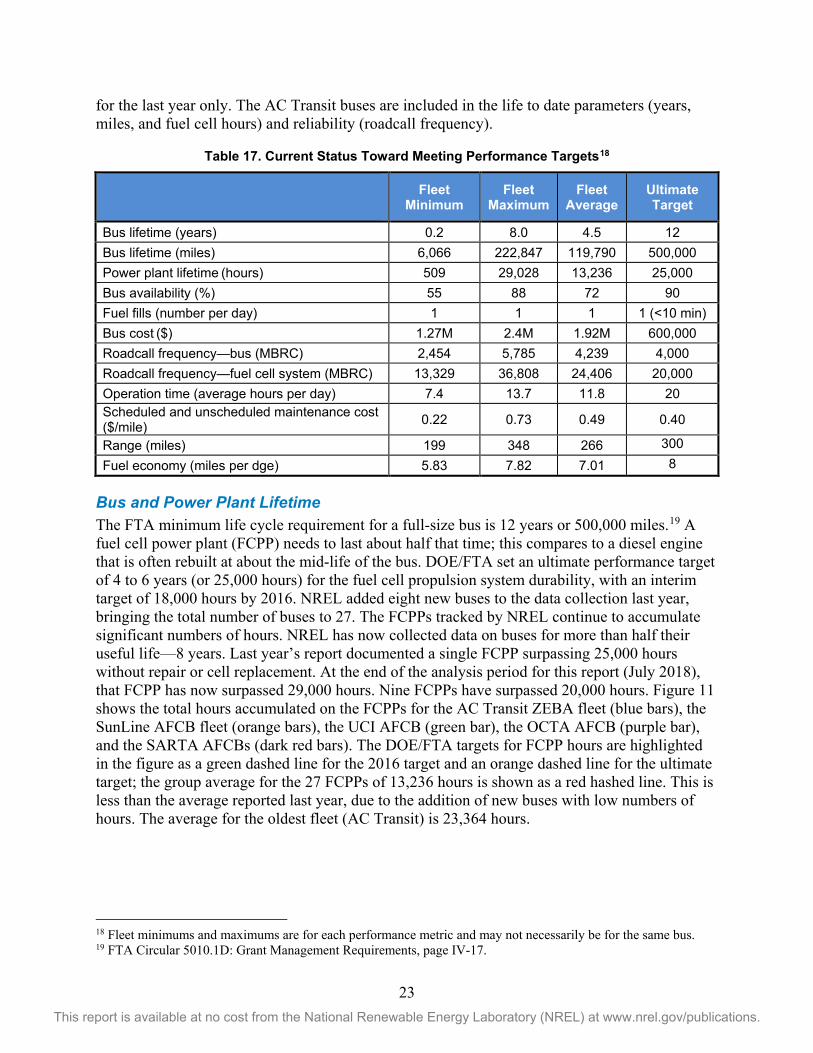
Table 17 presents the current status for the FCEBs toward meeting the DOE/FTA targets. The data are presented for the FCEB fleets as a group—that is, data are combined for all buses. The table includes the fleet minimum and maximum as well as the overall average for the buses as a group. The data for this section include the life and performance beginning at the clean point for each bus; therefore the results might not match that of the previous section, which analyzed data
17 Fuel Cell Technologies Program Record # 12012, September 12, 2012.
23 This report is available at no cost from the National Renewable Energy Laboratory (NREL) at www.nrel.gov/publications.
for the last year only. The AC Transit buses are included in the life to date parameters (years, miles, and fuel cell hours) and reliability (roadcall frequency).
Table 17. Current Status Toward Meeting Performance Targets18
Fleet
Minimum Fleet
Maximum Fleet
Average Ultimate Target
Bus lifetime (years) 0.2 8.0 4.5 12 Bus lifetime (miles) 6,066 222,847 119,790 500,000 Power plant lifetime (hours) 509 29,028 13,236 25,000 Bus availability (%) 55 88 72 90 Fuel fills (number per day) 1 1 1 1 (<10 min) Bus cost ($) 1.27M 2.4M 1.92M 600,000 Roadcall frequency—bus (MBRC) 2,454 5,785 4,239 4,000 Roadcall frequency—fuel cell system (MBRC) 13,329 36,808 24,406 20,000 Operation time (average hours per day) 7.4 13.7 11.8 20 Scheduled and unscheduled maintenance cost ($/mile) 0.22 0.73 0.49 0.40
Range (miles) 199 348 266 300 Fuel economy (miles per dge) 5.83 7.82 7.01 8
Bus and Power Plant Lifetime The FTA minimum life cycle requirement for a full-size bus is 12 years or 500,000 miles.19 A fuel cell power plant (FCPP) needs to last about half that time; this compares to a diesel engine that is often rebuilt at about the mid-life of the bus. DOE/FTA set an ultimate performance target of 4 to 6 years (or 25,000 hours) for the fuel cell propulsion system durability, with an interim target of 18,000 hours by 2016. NREL added eight new buses to the data collection last year, bringing the total number of buses to 27. The FCPPs tracked by NREL continue to accumulate significant numbers of hours. NREL has now collected data on buses for more than half their useful life—8 years. Last year’s report documented a single FCPP surpassing 25,000 hours without repair or cell replacement. At the end of the analysis period for this report (July 2018), that FCPP has now surpassed 29,000 hours. Nine FCPPs have surpassed 20,000 hours. Figure 11 shows the total hours accumulated on the FCPPs for the AC Transit ZEBA fleet (blue bars), the SunLine AFCB fleet (orange bars), the UCI AFCB (green bar), the OCTA AFCB (purple bar), and the SARTA AFCBs (dark red bars). The DOE/FTA targets for FCPP hours are highlighted in the figure as a green dashed line for the 2016 target and an orange dashed line for the ultimate target; the group average for the 27 FCPPs of 13,236 hours is shown as a red hashed line. This is less than the average reported last year, due to the addition of new buses with low numbers of hours. The average for the oldest fleet (AC Transit) is 23,364 hours.
18 Fleet minimums and maximums are for each performance metric and may not necessarily be for the same bus. 19 FTA Circular 5010.1D: Grant Management Requirements, page IV-17.

24 This report is available at no cost from the National Renewable Energy Laboratory (NREL) at www.nrel.gov/publications.
Figure 11. Total hours on the FCEBs through July 2018
Bus Availability Availability for the 19 FCEBs ranges from a low of 55% to a high of 88% with an overall average of 72%. Bus-related problems—such as brakes, suspension, air system, and air conditioning—make up most of the unavailable days (36%). Fuel cell system issues make up 25% of the unavailable time. Hybrid system problems—including issues with components such as traction motor, cooling system, and inverters—make up 19% of the unavailable days.
Fuel Fills Transit agencies typically fuel and service buses each evening to prepare them for morning pull-out the following day. This results in a 6- to 8-hour window for all of the buses at a specific depot to be prepped for service. As the buses are being fueled, transit staff handle other prep work, such as cleaning the interior and emptying the farebox. The time to service each bus is about 10 minutes; therefore, the fueling time needs to be 10 minutes or less. All transit agencies are able to fuel the buses at least once per day. Times for fueling vary between fleets, mainly due to the station designs.
Bus Cost DOE and FTA have set an interim capital cost target of $1 million per bus with an ultimate target of $600,000 per bus. Reported costs for FCEBs listed in Table 17 are based on the buses included in the data summary. At this point in the development of FCEB technology, costs are still high, although they have decreased. Recent orders of buses report an average cost of $1.27 million, which is a 49% decrease from that of the AC Transit buses in 2010 ($2.5 million). The industry projects an order for 40 buses could result in costs closer to $1 million each.

25 This report is available at no cost from the National Renewable Energy Laboratory (NREL) at www.nrel.gov/publications.
Roadcall Frequency The transit industry measures reliability as mean distance between failures, also documented as MBRC. The DOE/FTA targets for roadcall frequency include MBRC for the entire bus and MBRC for the fuel cell system only. Bus MBRC includes all chargeable roadcalls, which means any issue that could physically disable the bus from operating on route. It does not include roadcalls for items such as fareboxes, radios, or destination signs. The fuel cell system MBRC includes any roadcalls due to issues with the fuel cell stack or associated balance of plant.
Each year, NREL presents summary data from the most recent evaluations. As demonstrations end, the data from those evaluations are removed from the combined calculations, while others are added. This makes it challenging to compare the current year’s MBRC data to previous years because the data set can change significantly. The following MBRC results include reliability data from the current fleets back to the beginning of the evaluation periods. Figure 12 shows the monthly MBRC over time for the AFCB demonstrations combined. The bus and fuel cell system MBRC for the Van Hool (VH) FCEBs at AC Transit are included as separate lines to show the improvement for the older fleet of buses. The DOE/FTA 2016 and ultimate targets for bus MBRC and fuel cell system MBRC are included as dashed lines on the chart. Bus MBRC for both bus designs continues to show a gradual upward trend, surpassing the 2016 target and reaching the ultimate target around July 2015. The overall bus MBRC has remained steady over the last year. The fuel cell system roadcalls have all been due to issues with balance of plant components and not the fuel cell stack. Fuel cell system MBRC for the Van Hool FCEBs surpassed the ultimate target in 2014 and has increased since that time. The higher trend for the Van Hool FCEBs is partly due to the increasing use of the buses and the improvement of the maintenance staff in handling preventive maintenance (i.e., staff can anticipate and repair issues before they cause an in-service failure). Fuel cell system MBRC for the AFCB design has been more varied over time. This is primarily due to the lower number of buses (lower miles) where a single roadcall has a significant effect on the cumulative MBRC.
Figure 12. Monthly MBRC for the FCEBs

26 This report is available at no cost from the National Renewable Energy Laboratory (NREL) at www.nrel.gov/publications.
Operation Time The DOE/FTA target for bus operation is up to 20 hours per day for up to 7 days per week. Each transit agency operates its FCEBs differently, but agencies report having operated a bus for as many as 20 hours in a single day. Typical service averages around 8 hours per day. This reflects the actual/planned operation, not the maximum capability of the FCEBs.
Scheduled and Unscheduled Maintenance Cost The costs in Table 17 cover data through July 2018. The AFCBs at OCTA and SARTA are all still under warranty, so nearly all the maintenance costs are for labor. While SunLine’s older buses have surpassed the warranty period, the agency has support from the OEMs through agreements funded by the project. Although the parts costs have increased, most parts have been from the bus systems that typically wear out with increasing age. The average maintenance costs for the AFCBs are $0.09 for scheduled maintenance and $0.40 for unscheduled maintenance for a total of $0.49 per mile. The interim target is $0.70 per mile and the ultimate target is $0.40 per mile.
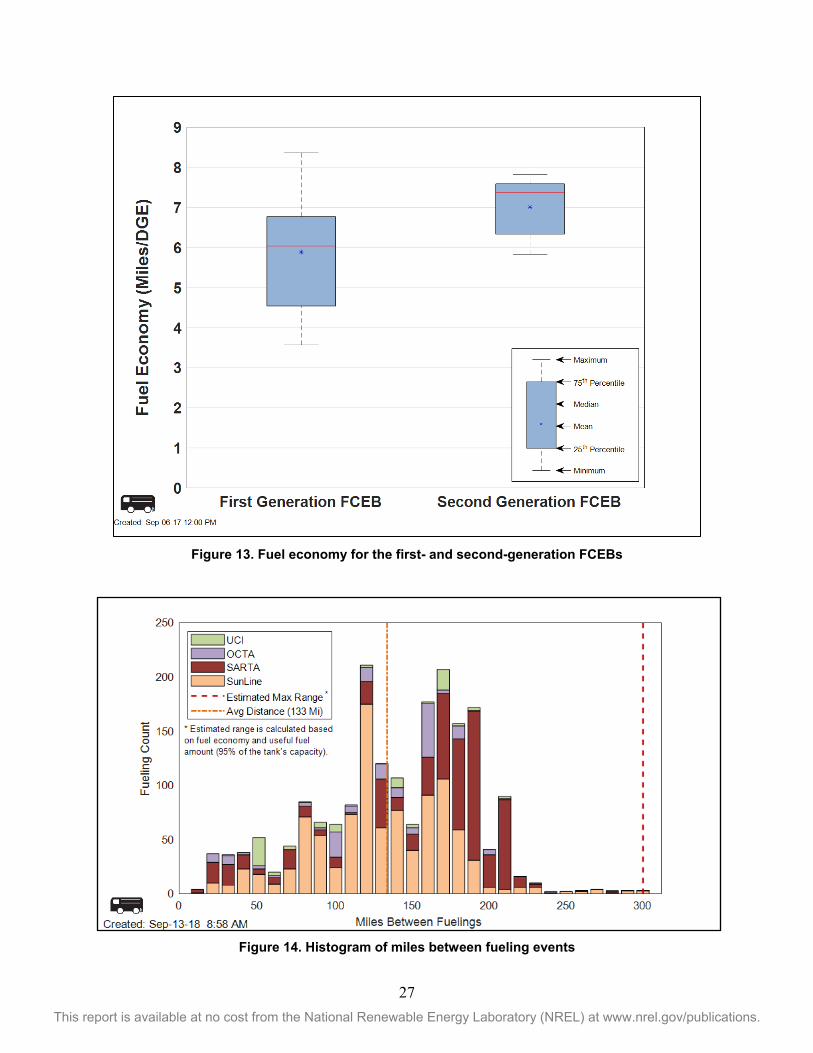
Fuel Economy and Range In the last report, NREL reported the initial fuel economy for all FCEB demonstrations based on the first full year of operation. Because fuel economy is highly variable by duty cycle, NREL calculated an overall fuel economy for each demonstration as opposed to one average for a particular FCEB design. Figure 13 presents the results of the fuel economy analysis and includes first- and second-generation FCEBs that NREL has evaluated. This early fuel economy has not changed in the last year. NREL will add to the analysis as new demonstrations and FCEB designs are included in the project.
The effective range of a bus is a concern for all transit agencies. Reductions in real-world fuel economy over time have lowered the range for FCEBs. NREL does not conduct range tests on buses; however, data can be used to show the typical use of a bus in service. Figure 14 provides a histogram of miles traveled between hydrogen fueling events over the past year. While this is a measure of how the buses were used and not a specific range, some inferences can be drawn from the results. The average miles driven for the group (dashed orange line) was 133 miles. The estimated range—calculated using the average fuel economy and the useful fuel amount in the tanks at 95% of capacity—is shown as a dashed red line. The colors separate the numbers by agency. These data show that the FCEBs regularly travel 150–200 miles between fueling events. For SunLine, the regular scheduled service is between 100 and 150 miles, while SARTA has scheduled service closer to 200 miles.
27 This report is available at no cost from the National Renewable Energy Laboratory (NREL) at www.nrel.gov/publications.
Figure 13. Fuel economy for the first- and second-generation FCEBs
Figure 14. Histogram of miles between fueling events

28 This report is available at no cost from the National Renewable Energy Laboratory (NREL) at www.nrel.gov/publications.
Remaining Challenges FCEB performance continues to improve, and new FCEB designs have incorporated the early lessons learned from the first-generation systems. However, there are still challenges to overcome to make the technology commercially viable. This section outlines the ongoing challenges as well as lessons learned from recent issues that occurred over the last year.
Fuel cell system issues—Agencies report that the fuel cell stacks are proving robust and that most fuel cell system issues involve components in the balance of plant. Air blowers, compressors, and sometimes plumbing leaks have resulted in downtime for the buses. The agencies have worked well with the OEMs but still have issues getting some replacement parts.
Parts supply—Transit agencies are still experiencing some issues with availability of bus components that have a long lead time for delivery. While this has improved for some components, agencies have taken the initiative to find other methods to supply parts. In some cases, an agency has sought to order parts directly from the component manufacturer instead of through a distributor. In other cases, an agency rebuilt or fabricated parts internally to reduce cost and downtime. Upcoming FCEB projects are purchasing buses built by North American OEMs using the same platform as conventional technologies. Sharing of conventional bus parts will help improve availability of replacement parts and lower parts costs.
Range issues—The effective range of the FCEBs varies depending on fuel economy and the ability to get a full fill of the hydrogen tanks. Agencies have reported issues in getting a full fill when the station fill rate is high because the hydrogen heats up in the process and reaches the setpoint pressure of 350 bar. After the tank cools, the tank pressure is less than 350 bar. Agencies report that this can result in the buses running low on fuel before completing scheduled service. To avoid sending a bus out with less fuel than needed, some agencies top off the fuel tanks in the morning. This adds labor time and is not optimal for typical transit operation. AC Transit has reported this issue and has been working with its station and OEM partners on a solution. The station setpoint has been increased to 380 bar so that the final pressure after cooling is closer to 350 bar.
Access to and cost of hydrogen fuel—Access to inexpensive hydrogen fuel remains a significant challenge for transit agencies deploying FCEBs. This has especially been a challenge for OCTA, which began operating its FCEB before making the decision to build a station. In the early stage of the demonstration, OCTA partnered with UCI to use its hydrogen station. The UCI station is about 5 miles from the OCTA facility and the station has been upgraded to handle service to the university’s FCEB. The cost for hydrogen at that station averaged around $13 per kg. When the agreement between UCI and OCTA ended in May 2018, UCI elected to discontinue servicing the OCTA bus. The station was built primarily for fueling light-duty fuel cell electric vehicles and has a high utilization rate. A typical bus fill can take 30 kg, which requires time for the station to recover. Because of this, bus fueling had been limited to a small window of time when auto customers were not likely to fuel. As use of the station has increased, the primary function of filling light-duty fuel cell electric vehicles has limited the station’s ability to handle bus fueling. OCTA has had to search for other solutions to fuel the bus. While there are other retail stations in the area, current retail prices are very high—$16 per kilogram. The average fuel costs for the other agencies with their own stations are closer to $7 per kilogram. In addition to the higher fuel cost, OCTA incurs labor costs to fuel and drive the bus to and from

29 This report is available at no cost from the National Renewable Energy Laboratory (NREL) at www.nrel.gov/publications.
the station. This has added significant costs to the project. The agency is moving forward with a new project to procure 10 more buses and build its own fueling station, which will eliminate the need to fuel outside the facility. Agencies considering FCEBs need to plan ahead to avoid this type of early deployment issue.
Fueling station issues—Transit agencies report that most hydrogen station issues involve compressor failures. Redundancy (multiple compressors) helps avoid station downtime, but a quick response time from station providers is important to maintain bus service. Transit agencies recommend negotiating the service contract with station providers to outline expectations for response time for repairs.
Training—Transit agencies deploying FCEBs cannot overemphasize the need for training staff. This includes training operators in the different start-up and shut-down procedures of the technology as well as what to do in case of a failure on route. Maintenance staff need training on safety, scheduled maintenance, diagnostics, and repair of multiple systems they may not be familiar with. Schedulers need to understand the abilities of the buses to ensure the FCEBs are assigned to route blocks within the expected range. Dispatch operators also need to understand some procedures so they can assist an operator that calls in with a bus issue. Transit agencies interested in the technology should develop a comprehensive training plan for multiple groups within the organization. Contracts with OEMs should include sufficient time for initial training.
The findings from the data and analyses suggest the following areas could benefit from additional early-stage research and development including but not limited to:
• Research and development of fuel cell balance of plant components (such as air compressors, blowers, and pumps) to increase reliability and durability
• Research and development of hydrogen station compressors to increase reliability
• Development and demonstration of cryo-compressed hydrogen tanks to increase bus range.

30 This report is available at no cost from the National Renewable Energy Laboratory (NREL) at www.nrel.gov/publications.
Appendix: Summary Statistics Table A-1. Technology Readiness Levels for FCEB Commercialization
Technology Readiness
Level TRL Definition Description
TRL 9 Actual system operated
over the full range of expected conditions
The technology is in its final form. Deployment, marketing, and support begin for the first fully commercial products.
TRL 8 Actual system completed and qualified through test
and demonstration
The last step in true system development. Demonstration of a limited production of 50 to 100 buses at a small number of locations. Beginning the transition of all maintenance to transit staff.
TRL 7 Full-scale validation in relevant environment
A major step up from TRL 6 by adding larger numbers of buses and increasing the hours of service. Full-scale demonstration and reliability testing of 5 to 10 buses at several locations. Manufacturers begin to train larger numbers of transit staff in operation and maintenance.
TRL 6 Engineering/pilot-scale validation in relevant
environment
First tests of prototype buses in actual transit service. Field testing and design shakedown of 1 to 2 prototypes. Manufacturers assist in operation and typically handle all maintenance. Begin to introduce transit staff to technology.
TRL 5 Laboratory scale, similar
system validation in relevant environment
Integrated system is tested in a laboratory under simulated conditions based on early modeling. System is integrated into an early prototype or mule platform for some on-road testing.
TRL 4 Component and system validation in laboratory
environment
Basic technological components are integrated into the system and begin laboratory testing and modeling of potential duty cycles.
TRL 3
Analytical and experimental critical
function and/or proof of concept
Active research into components and system integration needs. Investigate what requirements might be met with existing commercial components.
TRL 2 Technology concept and/or application
formulated
Research technology needed to meet market requirements. Define strategy for moving through development stages.
TRL 1 Basic principles observed and reported
Scientific research and early development of FCEB concepts.

31 This report is available at no cost from the National Renewable Energy Laboratory (NREL) at www.nrel.gov/publications.
SunLine AFCB Demonstration Summary Table A-2. SunLine Data Summary
SL AFCB All Data
SL AFCB Past Year
SL CNG All Data
SL CNG Past Year
Data period 3/12–7/18 8/17–7/18 1/17–7/18 8/17–7/18 Number of buses 7 7 5 5 Number of months 77 12 19 12 Total miles 506,496 119,909 516,105 324,451 Total fuel cell hours 38,304 9,870 – – Average speed (mph) 13.2 12.1 – – Average miles per month 2,323 2,104 5,433 5,408 Number of scheduled days 5,503 1,379 2,606 1,662 Number of days available 4,099 1,068 2,286 1,442 Availability 74% 77% 88% 87% Fuel economy (miles per kg or ggea) 5.59 5.4 3.44 3.48 Fuel economy (miles per dge) 6.31 6.1 3.84 3.89 Bus MBRC 4,186 3,241 15,640 10,815 Propulsion-related MBRC 6,578 6,662 34,407 24,958 Fuel-cell-system-related MBRC 13,329 10,901 – – Total fuel used (kg or gge) 87,640 21,441 148,228 92,085 SI Units Total kilometers 815,126 192,975 830,590 522,153 Average speed (kph) 21.3 19.6 – – Average km per month 3,739 3,386 8,744 8,703 Fuel consumption (kg/100 km) 11.12 11.51 – – Fuel consumption (L/100 km) 36.01 37.22 61.60 60.81 Bus km between roadcalls (KBRC) 2,601 2,014 9,718 6,720 Propulsion-related KBRC 4,087 4,140 21,380 15,508 Fuel-cell-system-related KBRC 8,282 6,774 – –
a gasoline gallon equivalent
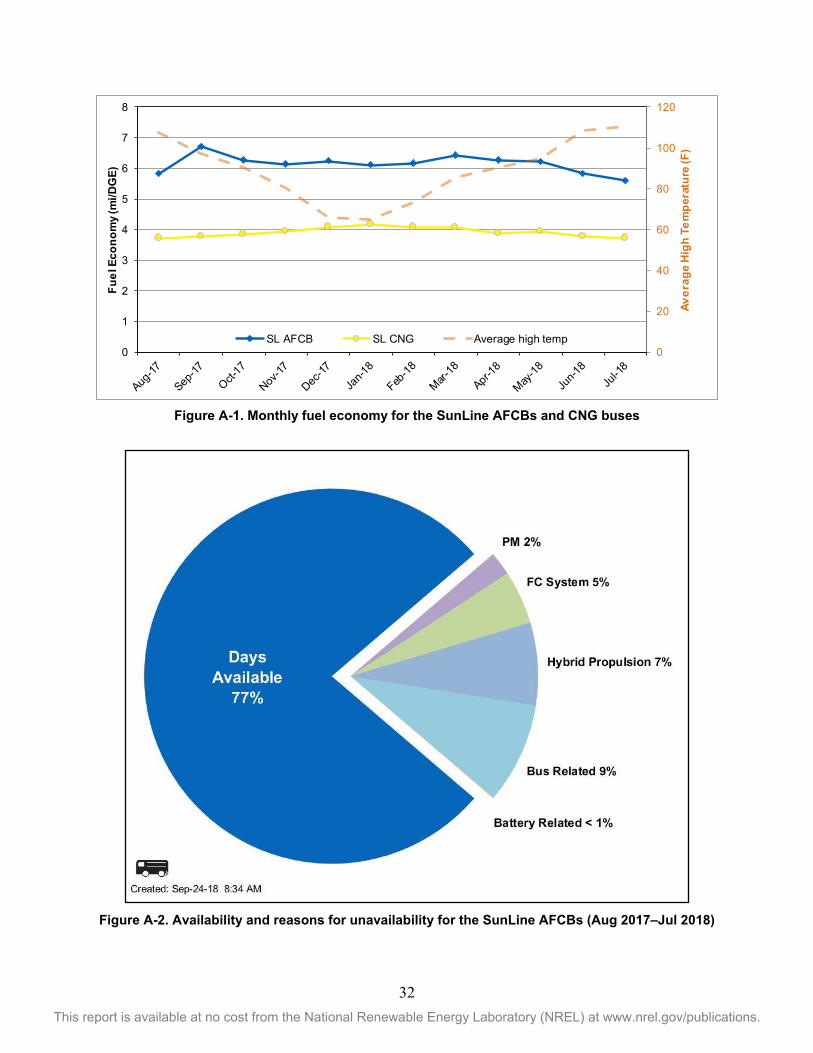
32 This report is available at no cost from the National Renewable Energy Laboratory (NREL) at www.nrel.gov/publications.
Figure A-1. Monthly fuel economy for the SunLine AFCBs and CNG buses
Figure A-2. Availability and reasons for unavailability for the SunLine AFCBs (Aug 2017–Jul 2018)
0
20
40
60
80
100
120
0
1
2
3
4
5
6
7
8
Aver
age
High
Tem
pera
ture
(F)
Fuel
Eco
nom
y (m
i/DG
E)
SL AFCB SL CNG Average high temp
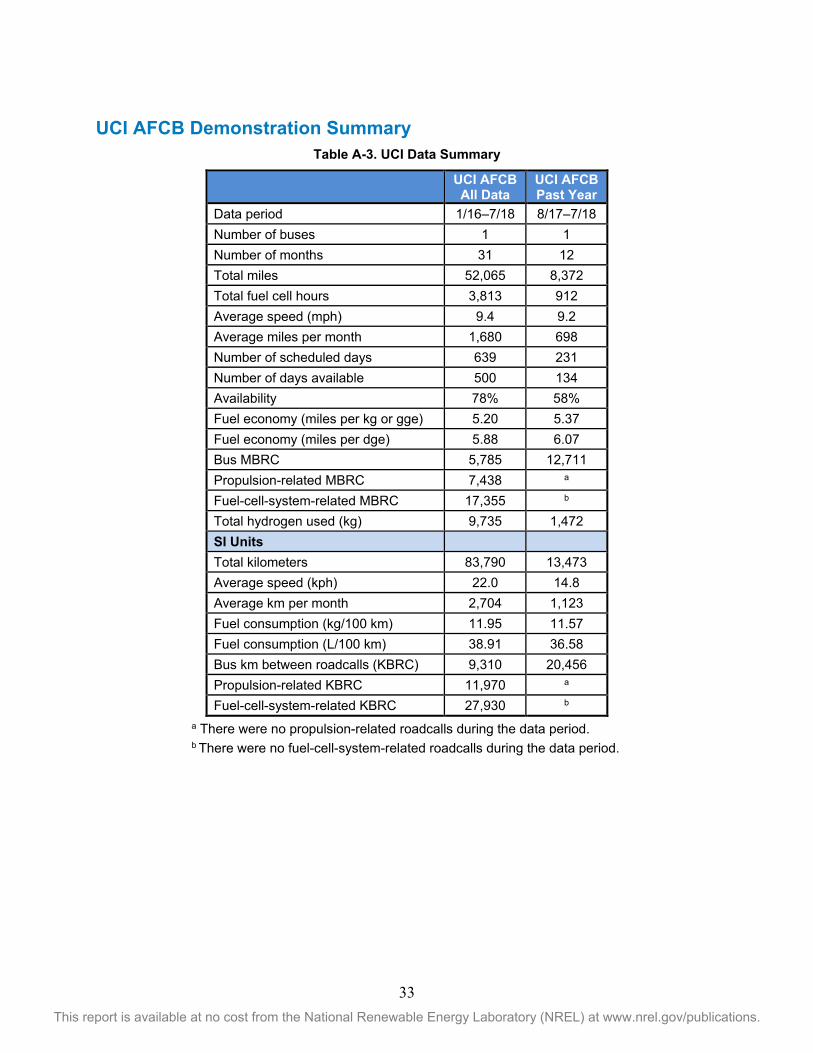
33 This report is available at no cost from the National Renewable Energy Laboratory (NREL) at www.nrel.gov/publications.
UCI AFCB Demonstration Summary
Table A-3. UCI Data Summary
UCI AFCB All Data
UCI AFCB Past Year
Data period 1/16–7/18 8/17–7/18 Number of buses 1 1 Number of months 31 12 Total miles 52,065 8,372 Total fuel cell hours 3,813 912 Average speed (mph) 9.4 9.2 Average miles per month 1,680 698 Number of scheduled days 639 231 Number of days available 500 134 Availability 78% 58% Fuel economy (miles per kg or gge) 5.20 5.37 Fuel economy (miles per dge) 5.88 6.07 Bus MBRC 5,785 12,711 Propulsion-related MBRC 7,438 a
Fuel-cell-system-related MBRC 17,355 b
Total hydrogen used (kg) 9,735 1,472 SI Units Total kilometers 83,790 13,473 Average speed (kph) 22.0 14.8 Average km per month 2,704 1,123 Fuel consumption (kg/100 km) 11.95 11.57 Fuel consumption (L/100 km) 38.91 36.58 Bus km between roadcalls (KBRC) 9,310 20,456 Propulsion-related KBRC 11,970 a
Fuel-cell-system-related KBRC 27,930 b
a There were no propulsion-related roadcalls during the data period. b There were no fuel-cell-system-related roadcalls during the data period.

34 This report is available at no cost from the National Renewable Energy Laboratory (NREL) at www.nrel.gov/publications.
Figure A-3. Monthly fuel economy for the UCI AFCB
Figure A-4. Availability and reasons for unavailability for the UCI AFCB (Aug 2017–Jul 2018)
0
10
20
30
40
50
60
70
80
90
0
1
2
3
4
5
6
7
8
Aver
age
High
Tem
pera
ture
(F)
Fuel
Eco
nom
y (m
i/DG
E)
UCI AFCB Average high temp

35 This report is available at no cost from the National Renewable Energy Laboratory (NREL) at www.nrel.gov/publications.
OCTA AFCB Demonstration Summary Table A-4. OCTA Data Summary
OCTA AFCB
All Data
OCTA AFCB
Past Year
OCTA CNG
All Data
OCTA CNG
Past Year Data period 6/16–7/18 8/17–7/18 6/16–7/18 8/17–7/18 Number of buses 1 1 10 10 Number of months 26 12 26 12 Total miles 36,808 21,486 857,036 412,250 Total fuel cell hours 2,827 1675 – – Average speed (mph) 13 12.8 – – Average miles per month 1,416 1,791 3,296 3,435 Number of scheduled days 770 405 – – Number of days available 421 280 – – Availability 55% 69% – – Fuel economy (miles per kg or gge) 6.49 6.36 3.56 3.51 Fuel economy (miles per dge) 7.33 7.19 3.98 3.92 Bus MBRC 2,454 7,162 15,582 12,492 Propulsion-related MBRC 4,201 21,486 32,963 22,903 Fuel-cell-system-related MBRC 36,808 a – – Total fuel used (kg or gge) 5,392 3,279 239,148 116,842 SI Units Total kilometers 59,237 34,578 1,379,266 663,452 Average speed (kph) 21.0 20.6 – – Average km per month 2,279 2,882 5,304 5,528 Fuel consumption (kg/100 km) 9.57 9.77 – – Fuel consumption (L/100 km) 30.49 31.76 59.44 60.35 Bus km between roadcalls (KBRC) 3,949 11,526 25,077 20,104 Propulsion-related KBRC 6,761 34,578 53,049 36,859 Fuel-cell-system-related KBRC 59,237 a – –
a There were no fuel-cell-system-related roadcalls during the data period.

36 This report is available at no cost from the National Renewable Energy Laboratory (NREL) at www.nrel.gov/publications.
Figure A-5. Monthly fuel economy for the OCTA AFCB and CNG buses
Figure A-6. Availability and reasons for unavailability for the OCTA AFCB (Aug 2017–Jul 2018)
0
10
20
30
40
50
60
70
80
90
0
1
2
3
4
5
6
7
8
9
Aver
age
High
Tem
pera
ture
(F)
Fuel
Eco
nom
y (m
i/DG
E)
OCTA AFCB OCTA CNG Average high temp

37 This report is available at no cost from the National Renewable Energy Laboratory (NREL) at www.nrel.gov/publications.
SARTA AFCB Demonstration Summary Table A-5. SARTA Data Summary
SARTA AFCB
All Data
SARTA CNG
All Data
SARTA Hybrid
All Data Data period 10/17–7/18 10/17–7/18 10/17–7/18 Number of buses 5 4 3 Number of months 10 10 10 Total miles 92,524 182,536 88,453 Total fuel cell hours 6,786 – – Average speed (mph) 13.6 – – Average miles per month 2,056 4,563 3,402 Number of scheduled days 1,140 986 597 Number of days available 743 758 515 Availability 65% 77% 86% Fuel economy (miles per kg or gge) 4.83 4.15 – Fuel economy (miles per dge) 5.46 4.64 4.71 Bus MBRC 3,913 10,737 5,897 Propulsion-related MBRC 23,478 18,254 29,484 Fuel-cell-system-related MBRC 31,304 – – Total fuel used (kg, gge, gal) 18,976 43,117 18,528 SI Units Total kilometers 148,903 293,763 142,351 Average speed (kph) 21.9 – – Average km per month 3,309 7,343 5,475 Fuel consumption (kg/100 km) 12.86 – – Fuel consumption (L/100 km) 42.69 50.98 50.23 Bus km between roadcalls (KBRC) 6,297 17,280 9,490 Propulsion-related KBRC 37,784 29,377 47,450 Fuel-cell-system-related KBRC 50,379 – –

38 This report is available at no cost from the National Renewable Energy Laboratory (NREL) at www.nrel.gov/publications.
Figure A-7. Monthly fuel economy for the OCTA AFCB and CNG buses
Figure A-8. Availability and reasons for unavailability for the OCTA AFCB (Oct 2017–Jul 2018)
0
10
20
30
40
50
60
70
80
90
0
1
2
3
4
5
6
7
Aver
age
High
Tem
pera
ture
(F)
Fuel
Eco
nom
y (m
i/DG
E)
AFCB CNG Hybrid Average high temp

39 This report is available at no cost from the National Renewable Energy Laboratory (NREL) at www.nrel.gov/publications.
AC Transit Demonstration Summary Table A-6. AC Transit Data Summary
ACT ZEBA All Data
ACT ZEBA Past Year
ACT Gillig Diesel
All Data Data period 9/11–7/17 8/16–7/17 7/13–7/17 Number of buses 13 13 10 Number of months 75 12 49 Total miles 2,383,309 466,438 2,187,978 Total fuel cell hours 273,212 50,241 – Average speed (mph) 8.7 9.3 – Bus MBRC 4,855 5,622 6,671 Propulsion-related MBRC 8,974 13,459 13,024 Fuel-cell-system-related MBRC 23,233 21,150 – SI Units Total kilometers 3,835,564 750,659 3,521,209 Average speed (kph) 14.0 14.9 – Bus km between roadcalls (KBRC) 7,813 9,048 10,736 Propulsion-related KBRC 14,442 21,660 20,960 Fuel-cell-system-related KBRC 37,390 34,038 –