
Rainfall Irregularities, Trends and Variations Intropical ...
Fuel-Burn Penalties Caused by Irregularities in Aircraft
Surfaces (ASTEROID Project)
A presentation to the Airbus DiPaRT Flight Physics Symposium 2017
22nd November 2017
Andrew Shires (UoL) [email protected]
Ben Hinchliffe (UoL)
Kevin Hackett (ESDU)
David Philpott (ESDU)
Project part funded by:
Aircraft Surface Tolerances for Enhanced Repairs, OperatIons & Design
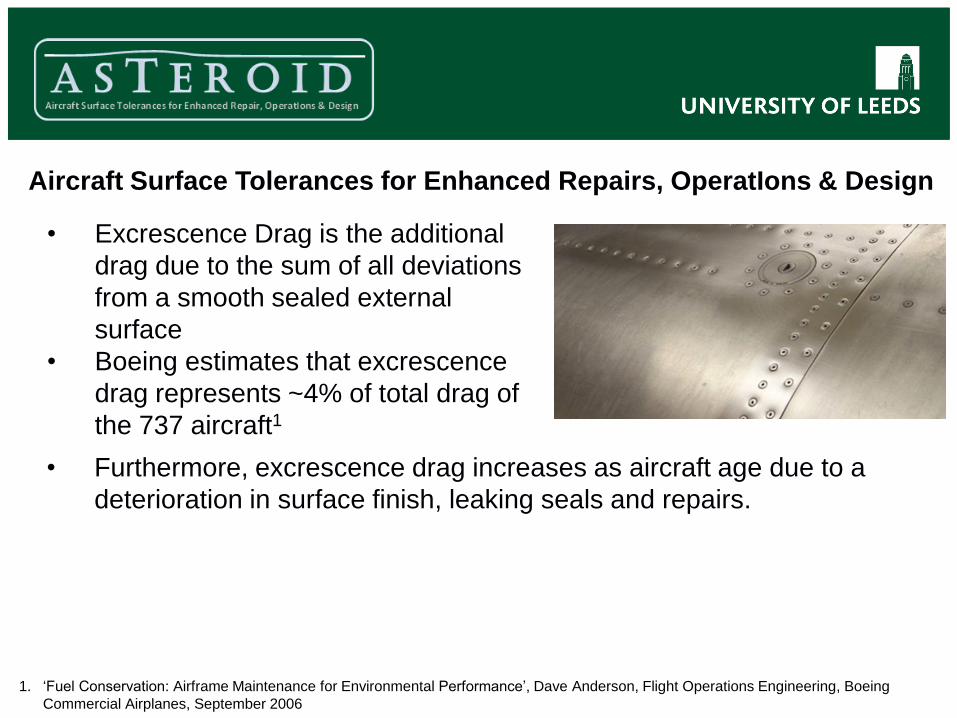
• Excrescence Drag is the additional
drag due to the sum of all deviations
from a smooth sealed external
surface
• Boeing estimates that excrescence
drag represents ~4% of total drag of
the 737 aircraft1
• Furthermore, excrescence drag increases as aircraft age due to a
deterioration in surface finish, leaking seals and repairs.
1. ‘Fuel Conservation: Airframe Maintenance for Environmental Performance’, Dave Anderson, Flight Operations Engineering, Boeing
Commercial Airplanes, September 2006
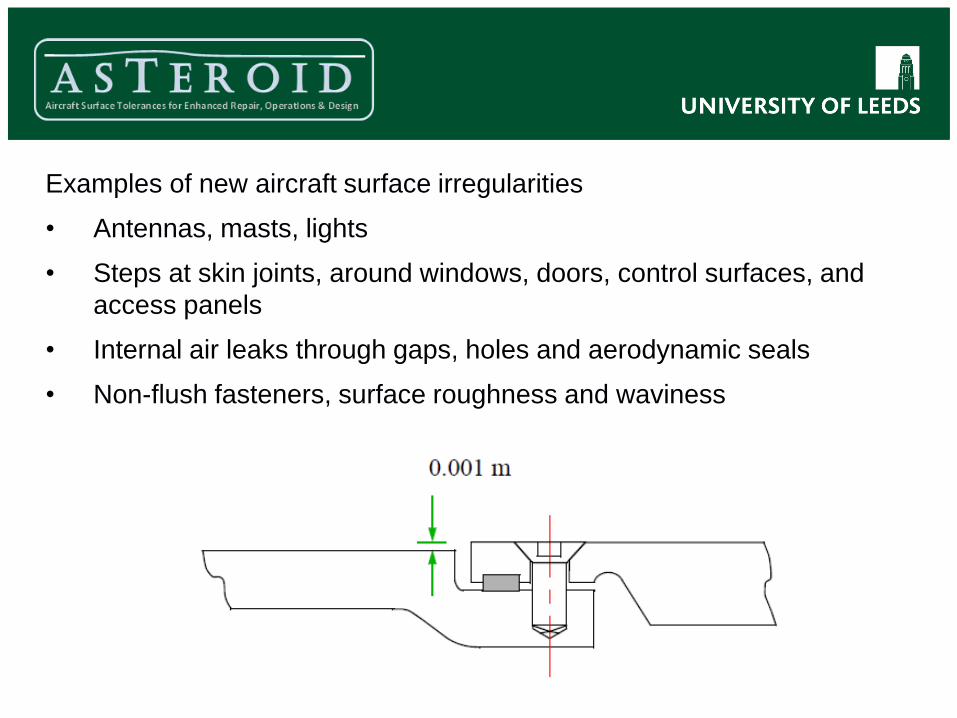
Examples of new aircraft surface irregularities
• Antennas, masts, lights
• Steps at skin joints, around windows, doors, control surfaces, and
access panels
• Internal air leaks through gaps, holes and aerodynamic seals
• Non-flush fasteners, surface roughness and waviness

In-service excrescence drag will be influenced by maintenance standards.
Average total airframe drag deterioration ~ 0.65%, composed mainly of1:
• Control Surface Rigging ≈ 0.25%
• Deteriorated Seals ≈ 0.20%
Also influenced by installation of repair patches.
1. ‘Fuel Conservation: Airframe Maintenance for Environmental Performance’, Dave Anderson, Flight Operations Engineering, Boeing
Commercial Airplanes, September 2006
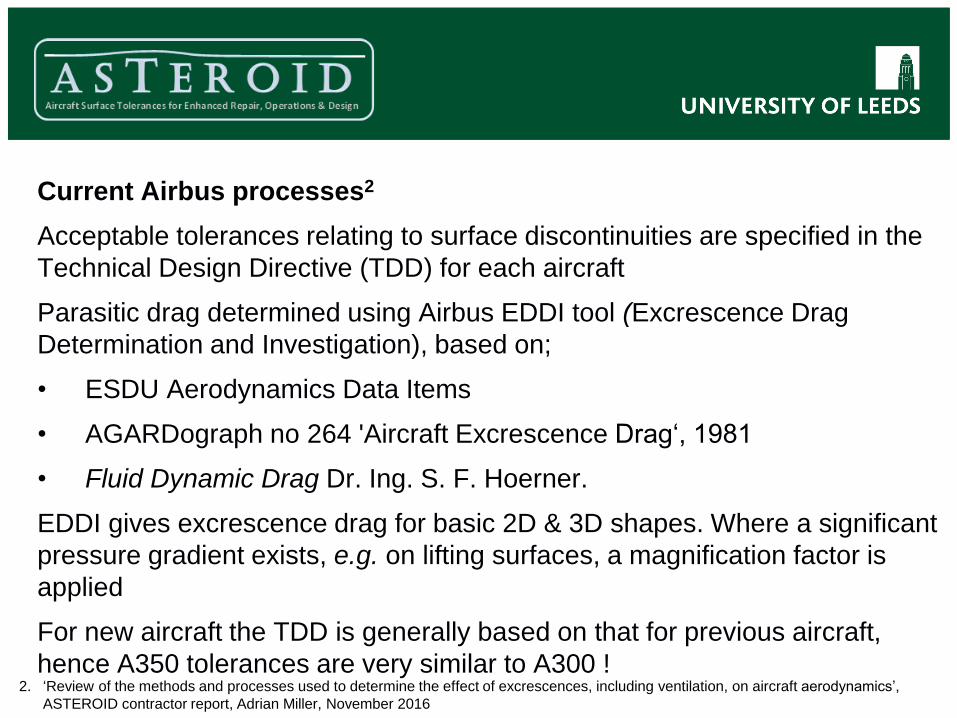
Current Airbus processes2
Acceptable tolerances relating to surface discontinuities are specified in the
Technical Design Directive (TDD) for each aircraft
Parasitic drag determined using Airbus EDDI tool (Excrescence Drag
Determination and Investigation), based on;
• ESDU Aerodynamics Data Items
• AGARDograph no 264 'Aircraft Excrescence Drag‘, 1981
• Fluid Dynamic Drag Dr. Ing. S. F. Hoerner.
EDDI gives excrescence drag for basic 2D & 3D shapes. Where a significant
pressure gradient exists, e.g. on lifting surfaces, a magnification factor is
applied
For new aircraft the TDD is generally based on that for previous aircraft,
hence A350 tolerances are very similar to A300 ! 2. ‘Review of the methods and processes used to determine the effect of excrescences, including ventilation, on aircraft aerodynamics’,
ASTEROID contractor report, Adrian Miller, November 2016

• ESDU data items are largely based on extensive measurements in the
RAE 8ft wind tunnel by Gaudet et al.3
• Various excrescence heights, up to 5% of ∂, were mounted onto a flat
plate and a force strain balance used to measure drag with and without
the excrescence present
3. L. Gaudet and K. Winter. ‘Measurements of the drag of various two-dimensional excrescences immersed in turbulent boundary layers at
Mach numbers between 0.2 and 2.8’, from Proceedings of AGARD Conference on Aerodynamic Drag, 1973
• Plots show the drag increment
(CD) relative to the undisturbed
local skin friction (Cf) in a zero-
pressure gradient.
• Logarithmic dependence on
Reynolds roughness
• Distinct correlations for sub and
supersonic regimes

Project aims
• Primarily to update current ESDU data sheet methods
• Low and High speed (M = 1.4) wind tunnel tests to measure
boundary-layer velocity profiles using laser optic (LDV) and/or hot
wire techniques for different excrescence shapes and heights
• Obtain integral BL parameters (∂, ∂* and θ) and therefore the
viscous drag increment
• Develop empirical ‘User Defined Functions’ in CFD (Fluent and
VGK) to explicitly include the effects of excrescences
• Develop an ‘Operations Tool’, a web-based interface to the ESDU
excrescence drag software to allow maintenance engineers to quantify
drag penalties to prioritise maintenance strategies
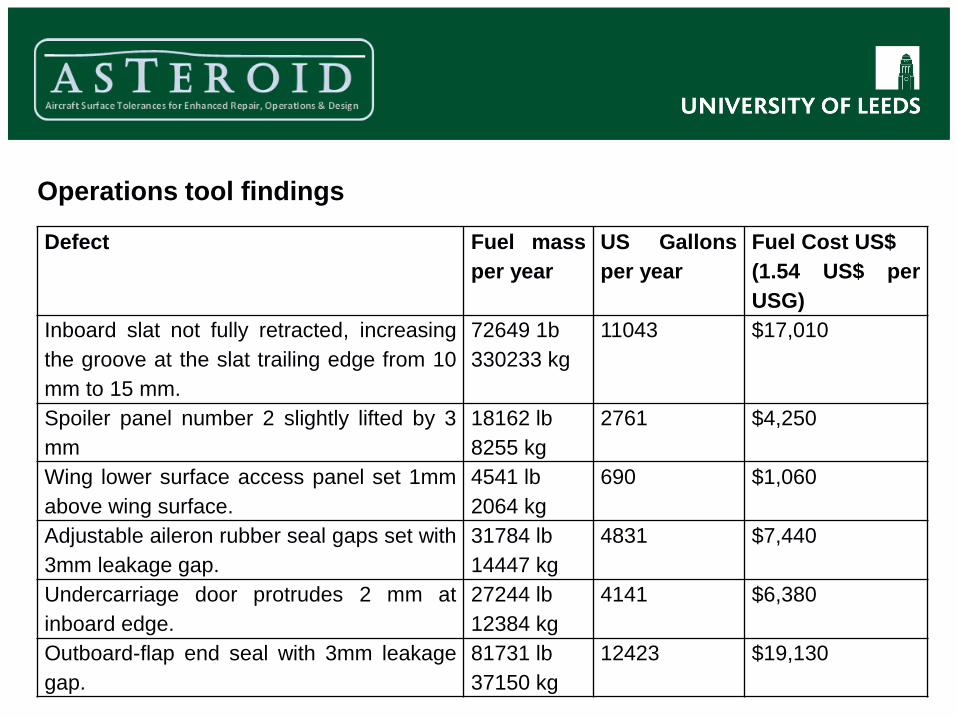
Operations tool findings
Defect Fuel mass
per year
US Gallons
per year
Fuel Cost US$
(1.54 US$ per
USG)
Inboard slat not fully retracted, increasing
the groove at the slat trailing edge from 10
mm to 15 mm.
72649 1b
330233 kg
11043 $17,010
Spoiler panel number 2 slightly lifted by 3
mm
18162 lb
8255 kg
2761 $4,250
Wing lower surface access panel set 1mm
above wing surface.
4541 lb
2064 kg
690 $1,060
Adjustable aileron rubber seal gaps set with
3mm leakage gap.
31784 lb
14447 kg
4831 $7,440
Undercarriage door protrudes 2 mm at
inboard edge.
27244 lb
12384 kg
4141 $6,380
Outboard-flap end seal with 3mm leakage
gap.
81731 lb
37150 kg
12423 $19,130
Operations tool findings
Following several visits to aircraft under maintenance, the excrescences
we identified that could be addressed by the airline/operator were relatively
minor and would produce only small savings in fuel burn.
The most significant excrescences were inherent in the aircraft design
Most rectification work would have to be completed during scheduled
withdrawals from service. These are infrequent, and would require
expenditure in man hours that would offset any consequent fuel savings.
Getting the aircraft back into service on time is always the economic and
operational priority, regardless of the presence of any feature that may
cause a higher fuel burn.
Consequently, the operations tool development has halted !

• Consider a small excrescence located on a flat plate at E. Although
the local flow at E may be complex, the downstream velocity profile
returns to that corresponding to a flat plate but with an increase in
momentum thickness (θ) due to the excrescence drag.
• Consequently velocity traverses must be made upstream and
downstream of E.
Momentum thickness
(no excrescence)
Momentum thickness
(with excrescence)
Excrescence
A B
x
E

Low-speed test results
• Wind tunnel tests have been completed in the Cranfield Environmental
Tunnel with a range of forward facing steps and a step-groove.
• BL profiles were measured
using a pitot rake.
• Due to the size of the rake and
mounting, measurements could
not be taken down to the
surface.
• Additional low-speed testing
currently underway at City University
using a hot wire traverse

High-speed (M = 1.4) test results
• Wind tunnel tests have also been completed in the Cambridge University
tunnel with a range of forward and backward facing steps using LDV
• Excrescence heights h/∂ = 2%, 9% and 73%

1. Obtain time averaged profile
2. Remove erroneous points at the wall
3. Curve-fit profiles to produce a
composite curve comprising;
1. Outer layer
2. Log-layer
3. Buffer-layer
4. Viscous sublayer
4. Integrate composite profile to get δ*
and θ
5. Apply a compressibility correction4
High-speed (M = 1.4) test results
4. ESDU data item 68020

Comparison of BL profiles using a NACA (report 772) empirical
method with fitted profiles from the test (flat plate).
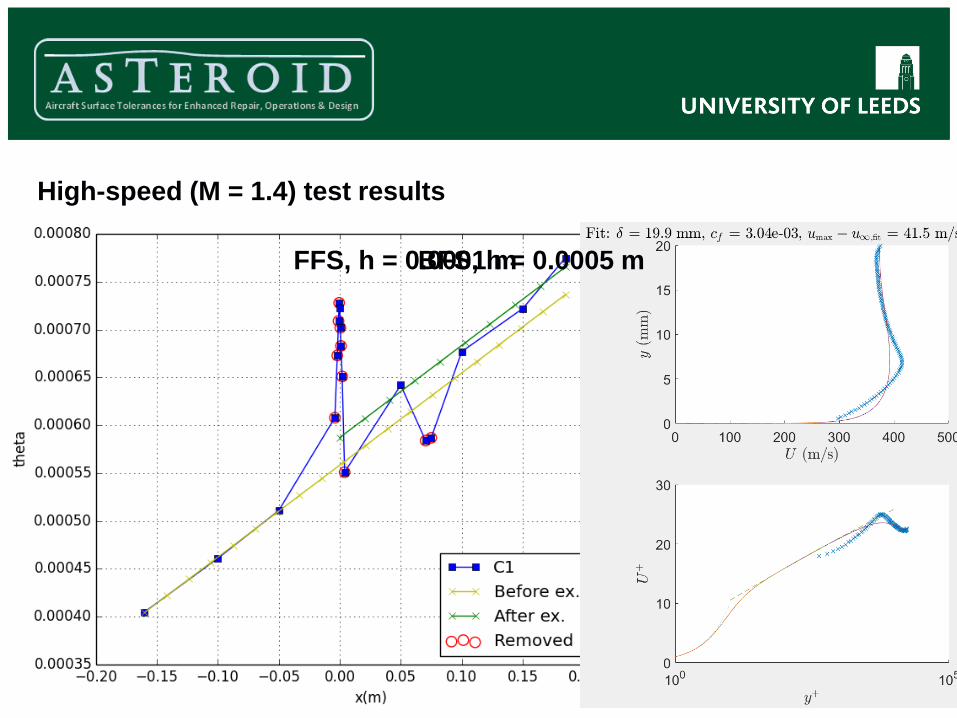
High-speed (M = 1.4) test results
FFS, h = 0.0001 mBFS, h = 0.0005 m

Forward step height, h = 0.0001 m
Forward step height, h = 0.0044 m
High-speed (M = 1.4) test results
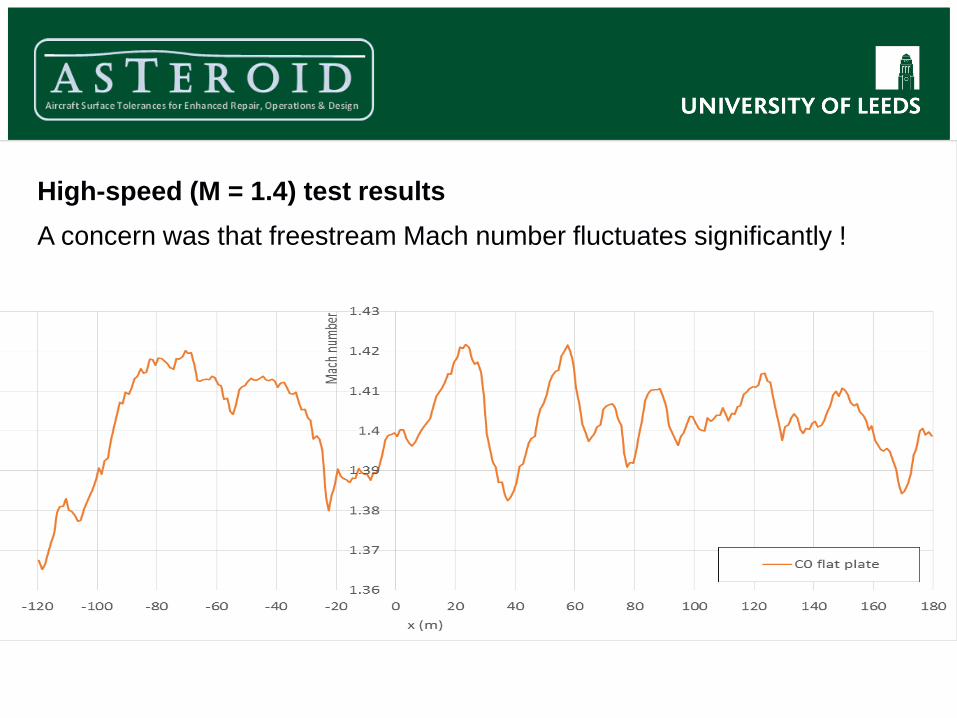
A concern was that freestream Mach number fluctuates significantly !

High-speed (M = 1.4) test results
There were further concerns over the consistency of δ* and θ
distributions obtained from integrating the fitted (composite) profiles.
Causes may include;
• Fluctuating freestream Mach number
• Reflected Mach waves
• A difficulty of the LDV setup is ‘finding the wall’ with the laser system
– can lead to errors in the expected vertical position
• A further limitation of the LDV method is the low seeding levels very
close to the wall.
Consequently, another high speed test is scheduled for 4th December
2017 to address some of these issues
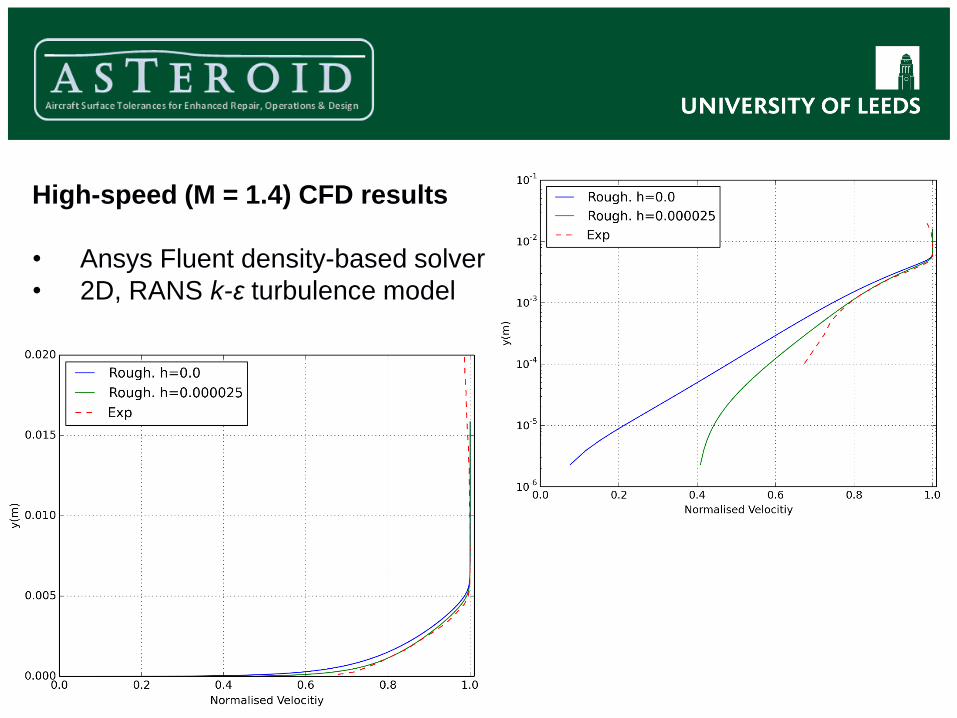
High-speed (M = 1.4) CFD results
• Ansys Fluent density-based solver
• 2D, RANS k-ε turbulence model

High-speed (M = 1.4) CFD results
• Initially achieved convergence of
continuity and u-momentum to 10-6
• However, when checking the convergence of q, ∂* and Cf it was
found that these were not well
converged
• Also, Cf converged to
approximately one order lower than q and d
• Therefore the convergence of Cf at
several points along the surface
was achieved to 10-8
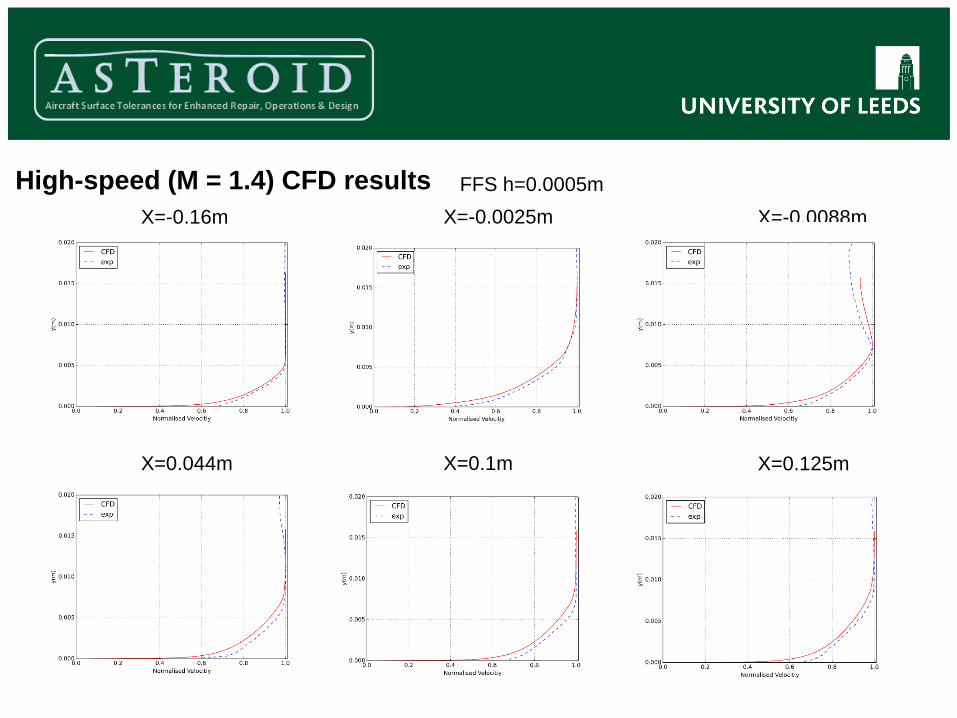
X=-0.16m X=-0.0025m X=-0.0088m
X=0.044m X=0.1m X=0.125m
FFS h=0.0005mHigh-speed (M = 1.4) CFD results

X=-0.16m X=-0.044m X=0.0088m
X=0.044m X=0.1m X=0.125m
BFS h=0.0044mHigh-speed (M = 1.4) CFD results

High-speed (M = 1.4) CFD results (FFS)
Previously extrapolated lines fitted before and after excrescence to
determine Δθx=0, but switched to equivalent plate method
ESDU Δθ based on drag due to excrescence that will include wave drag
CD wave
contribution

CD wave
contribution
High-speed (M = 1.4) CFD results (BFS)
Previously extrapolated lines fitted before and after excrescence to
determine Δθx=0, but switched to equivalent plate method
ESDU Δθ based on drag due to excrescence that will include wave drag

Summary
Low speed wind tunnel tests
• We have some wake rake measurements from Cranfield still to process
• Have switched to City University due to issues with hot wire traverse
High speed wind tunnel tests
• Repeating experiment with new plates to hopefully address fluctuating
freestream Mach number as well as vertical positioning issues
RANS CFD
• Results are looking promising compared with experiment and importantly,
are more consistent
• Currently determining wave drag contribution
• Will then use CFD results to update current ESDU data sheet methods
and derive improved empirical models