FUCHS PETROLUB AG The lubricants specialistThe lubricants ... · FUCHS – the lubricants...
40
FUCHS PETROLUB AG The lubricants specialist The lubricants specialist Stefan Fuchs, CEO Stefan Fuchs, CEO Dagmar Steinert, Head of Investor Relations May 2013
Transcript of FUCHS PETROLUB AG The lubricants specialistThe lubricants ... · FUCHS – the lubricants...
FUCHS PETROLUB AGThe lubricants specialistThe lubricants specialist
Stefan Fuchs, CEOStefan Fuchs, CEODagmar Steinert, Head of Investor Relations
May 2013

Overview and business model
FUCHS PETROLUB AG2
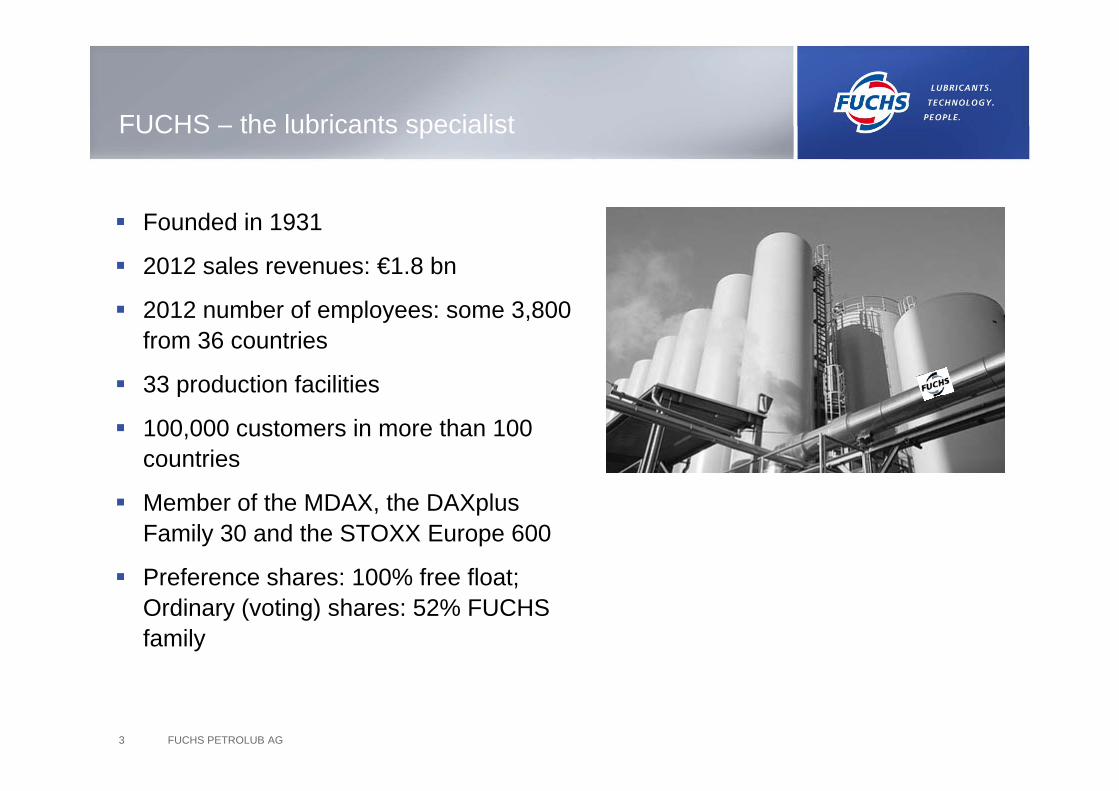
FUCHS – the lubricants specialistFUCHS – the lubricants specialist
F d d i 1931 Founded in 1931
2012 sales revenues: €1.8 bn
2012 number of employees: some 3 800 2012 number of employees: some 3,800 from 36 countries
33 production facilitiesp
100,000 customers in more than 100 countries
Member of the MDAX, the DAXplus Family 30 and the STOXX Europe 600
Preference shares: 100% free float; Preference shares: 100% free float; Ordinary (voting) shares: 52% FUCHS family
FUCHS PETROLUB AG3
FUCHS - business modelFUCHS - business model
Fully focussed on lubricants
Leader in technology, innovation and specialisationLeader in technology, innovation and specialisation
Independent
Full-line supplier
Global presence
FUCHS PETROLUB AG4
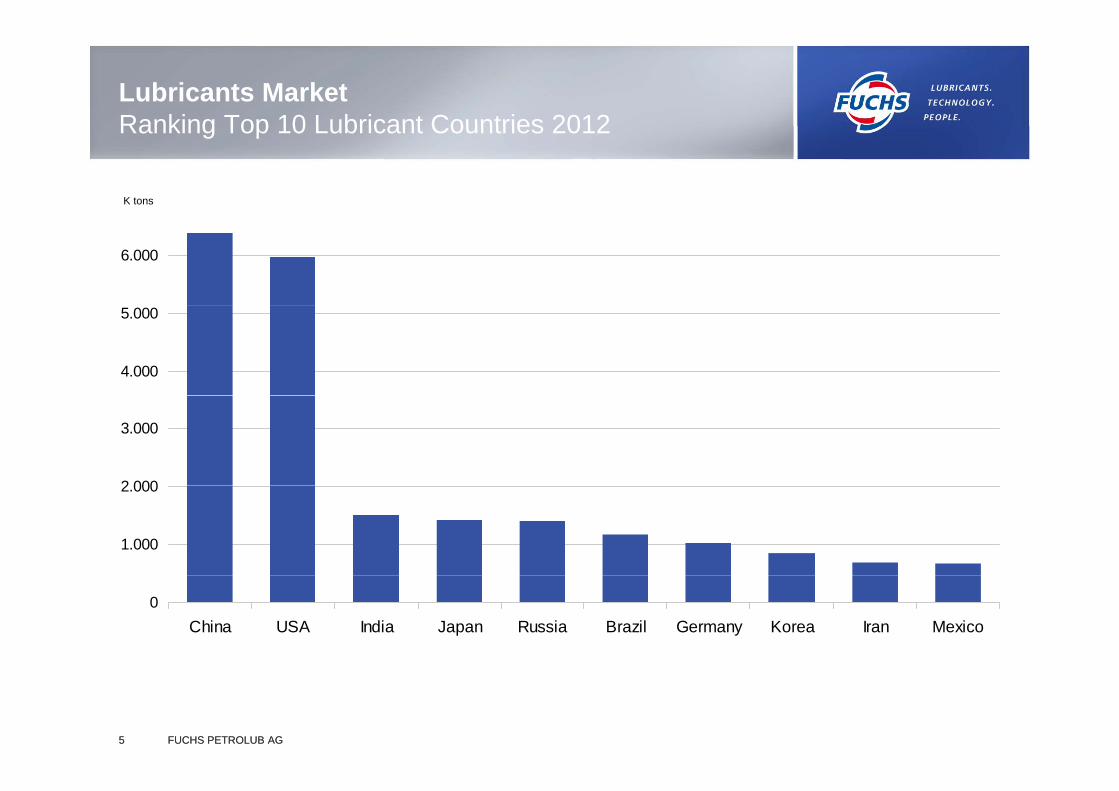
Lubricants MarketRanking Top 10 Lubricant Countries 2012
K tons
Ranking Top 10 Lubricant Countries 2012
6.000
4.000
5.000
2 000
3.000
1.000
2.000
0China USA India Japan Russia Brazil Germany Korea Iran Mexico
FUCHS PETROLUB AG5 FUCHS PETROLUB AG5
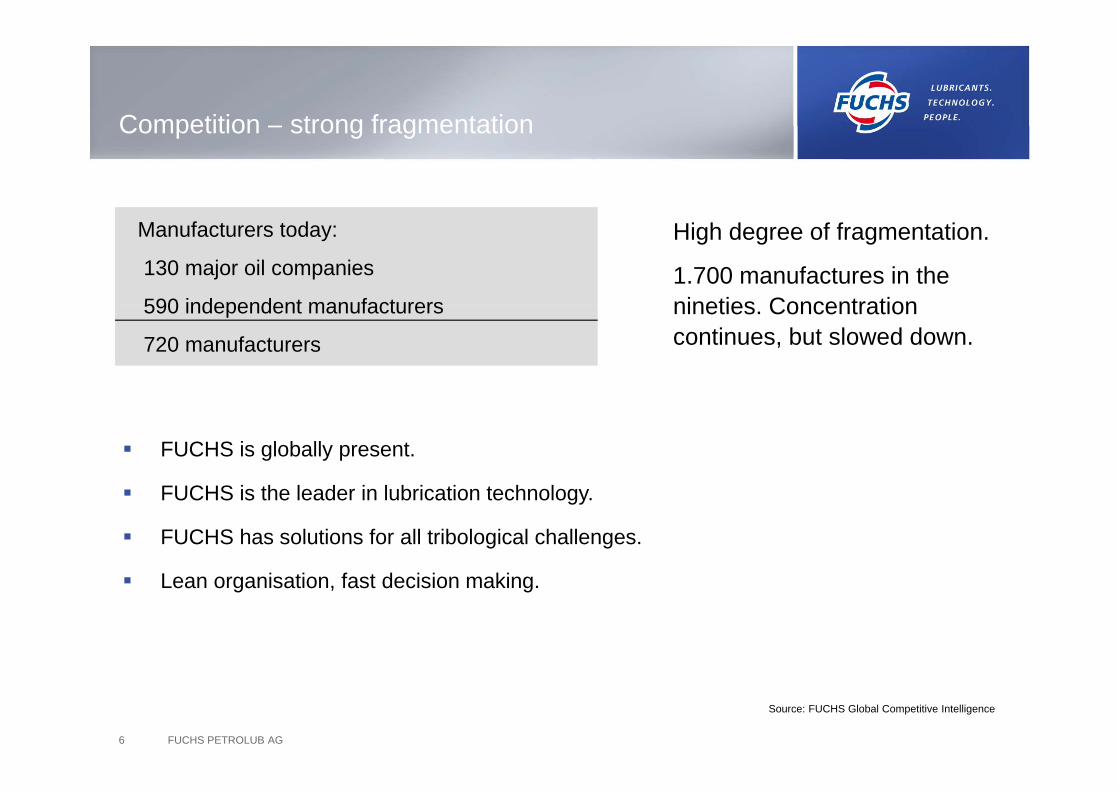
Competition – strong fragmentationCompetition – strong fragmentation
Manufacturers today:
130 major oil companies
590 independent manufacturers
High degree of fragmentation.
1.700 manufactures in the nineties Concentration590 independent manufacturers
720 manufacturers
nineties. Concentration continues, but slowed down.
FUCHS is globally present.
FUCHS i th l d i l b i ti t h l FUCHS is the leader in lubrication technology.
FUCHS has solutions for all tribological challenges.
L i ti f t d i i ki Lean organisation, fast decision making.
FUCHS PETROLUB AG6
Source: FUCHS Global Competitive Intelligence
The business model has paid dividends
FUCHS PETROLUB AG7
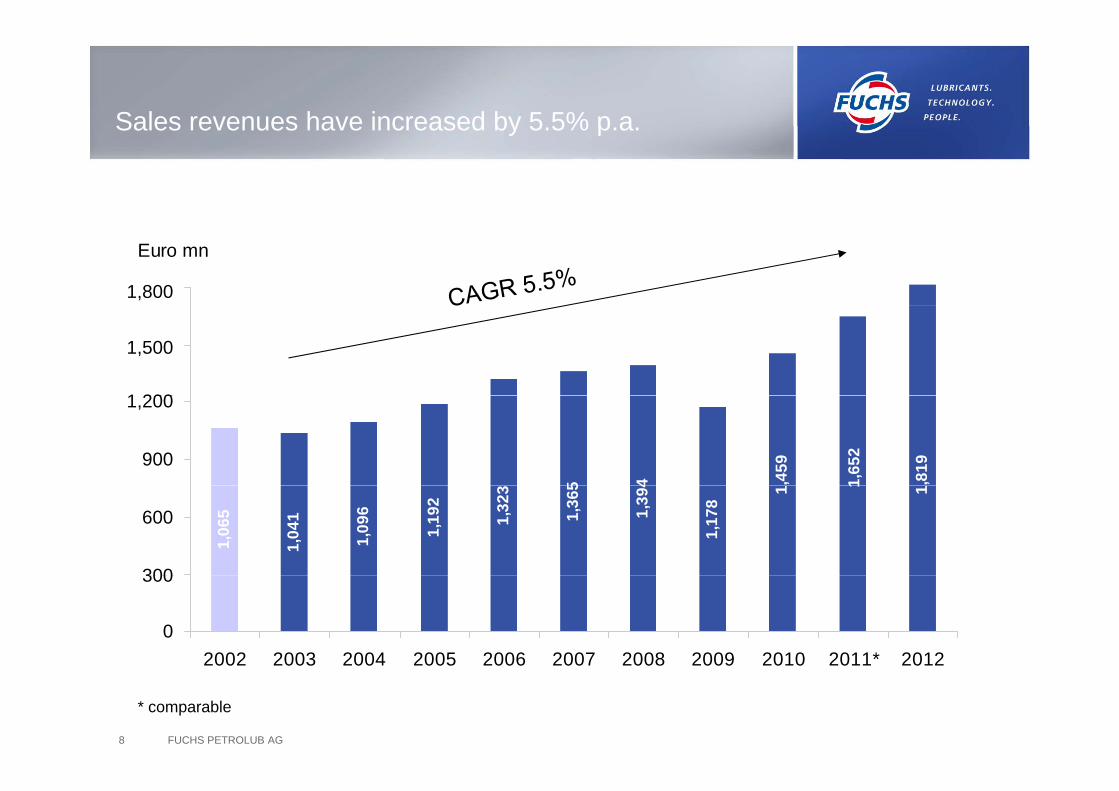
Sales revenues have increased by 5 5% p aSales revenues have increased by 5.5% p.a.
1.800
Euro mn
1,800
1 200
1.5001,500
1 200
45 ,459
1,65
2
,819900
1.2001,200
900
1,17
81,39
4
1,36
5
1,32
3
1,19
2
1,04
1
1,06
5
1 1 1
1,09
6
300
600600
300
0
300
2002 2003 2004 2005 2006 2007 2008 2009 2010 2011* 2012
300
0
FUCHS PETROLUB AG8
2002 2003 2004 2005 2006 2007 2008 2009 2010 2011 2012
* comparable
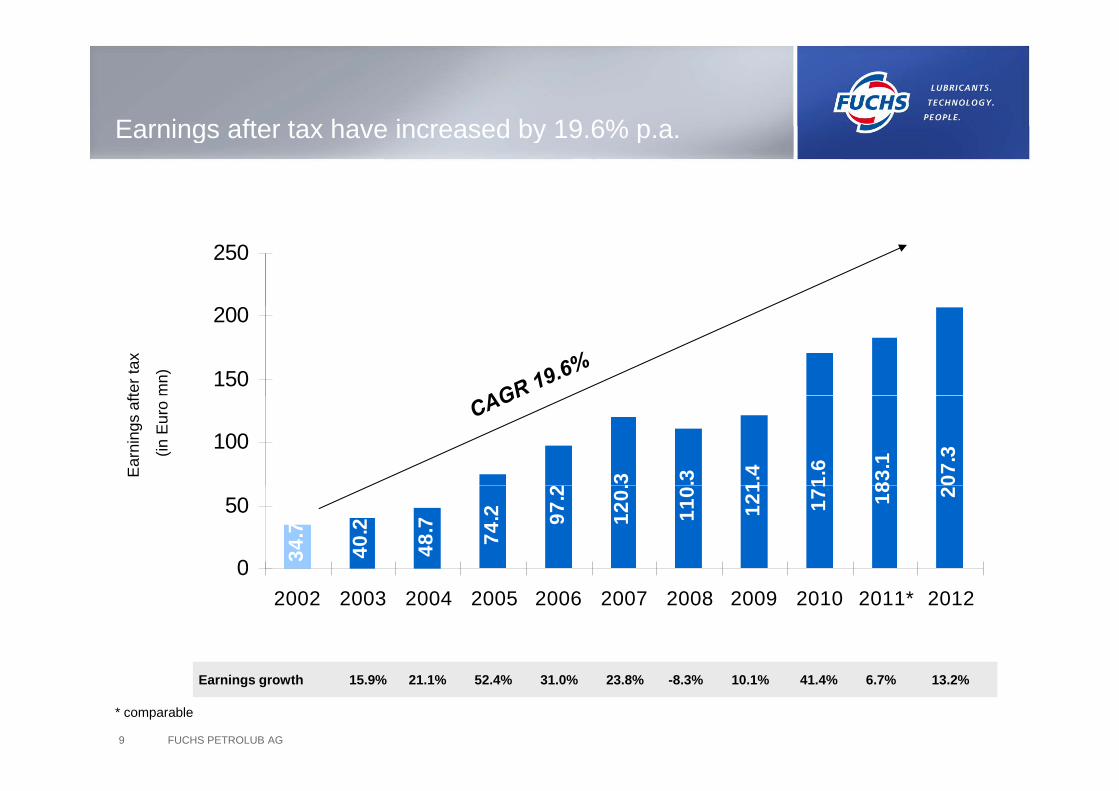
Earnings after tax have increased by 19 6% p aEarnings after tax have increased by 19.6% p.a.
250
150
200
ter t
ax
mn)
83.1
07.3
.3 .3 1.4 1.6
100
Ear
ning
s af
t
(in E
uro
18 2
34.7
40.2
48.7 74
.2 97.2
120.
110
121
171
0
50
02002 2003 2004 2005 2006 2007 2008 2009 2010 2011* 2012
FUCHS PETROLUB AG9
Earnings growth 15.9% 21.1% 52.4% 31.0% 23.8% -8.3% 10.1% 41.4% 6.7% 13.2%
* comparable
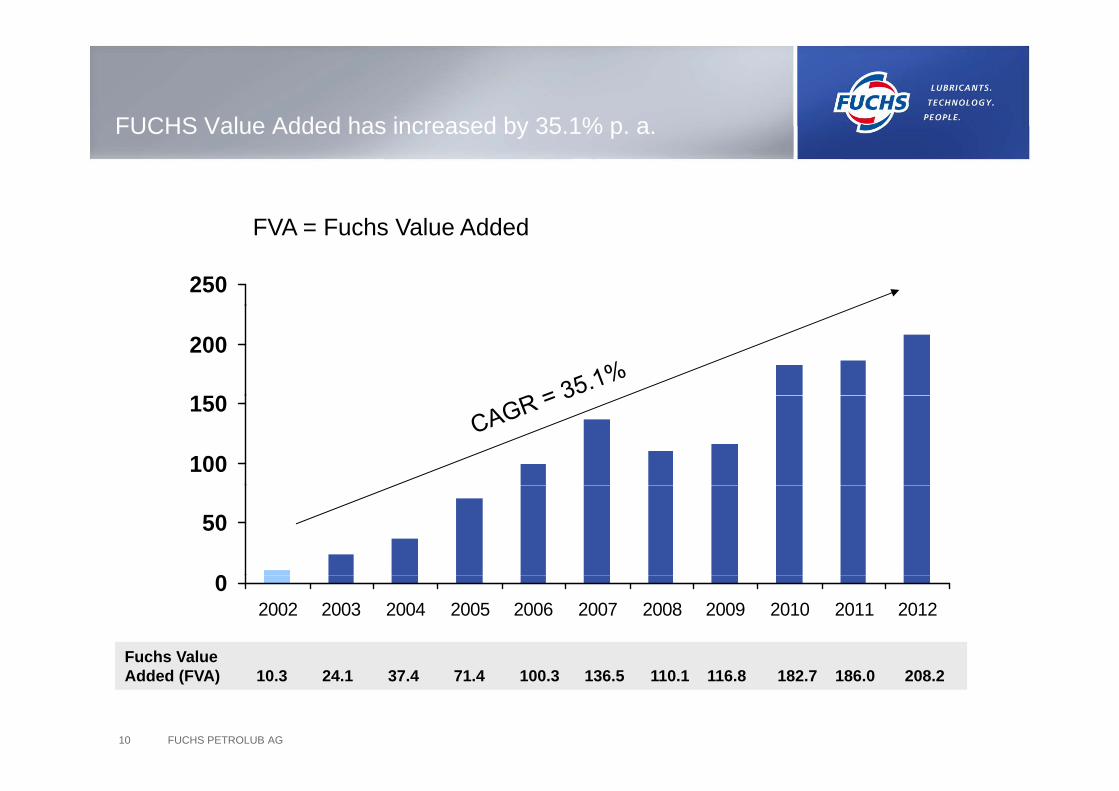
FUCHS Value Added has increased by 35 1% p aFUCHS Value Added has increased by 35.1% p. a.
250
FVA = Fuchs Value Added
150
200
100
150
0
50
Fuchs Value
02002 2003 2004 2005 2006 2007 2008 2009 2010 2011 2012
FUCHS PETROLUB AG10
Added (FVA) 10.3 24.1 37.4 71.4 100.3 136.5 110.1 116.8 182.7 186.0 208.2
Reasons for the positive development during the last 10 yearslast 10 years
I t ti li ti Internationalization– Via acquisitions in the nineties– Frontrunner in emerging markets; market entry China in the mid eightiesg g y g
Forming of a united group
Focused Communication– For international key accounts– For global R&D projects– Etc– Etc.
Thorough understanding of customer processes
Lifting of synergiesLifting of synergies
Lean cost management
Strict cash focus; incentives based on FVA
FUCHS PETROLUB AG11
Strict cash focus; incentives based on FVA
Lowering of debt and reducing tax rate to ~30%

Mission Statement – Values -Sustainabilityy
FUCHS PETROLUB AG12
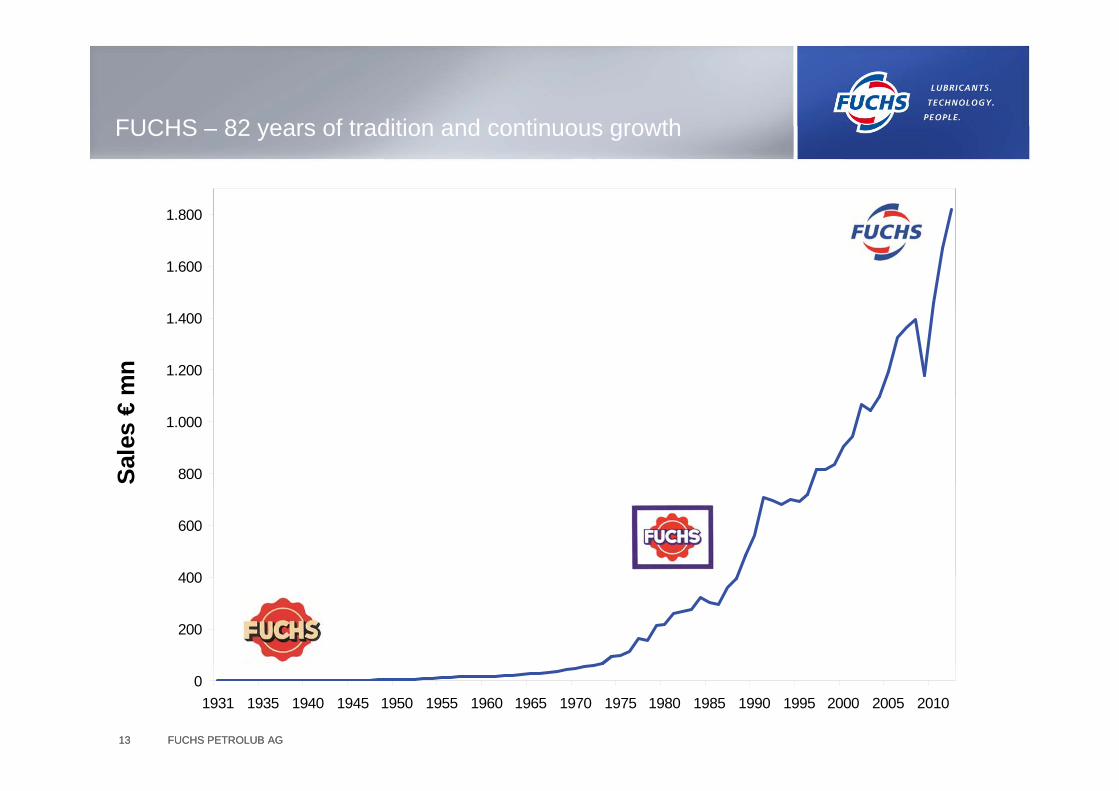
FUCHS 82 years of tradition and continuous growthFUCHS – 82 years of tradition and continuous growth
1 800
1.600
1.800
1.200
1.400
mn
800
1.000
Sale
s €
400
600
200
400
FUCHS PETROLUB AG13 FUCHS PETROLUB AG13
01931 1935 1940 1945 1950 1955 1960 1965 1970 1975 1980 1985 1990 1995 2000 2005 2010
Mission Statement of the FUCHS PETROLUB GroupMission Statement of the FUCHS PETROLUB Group
FUCHS PETROLUB AG14 FUCHS PETROLUB AG14
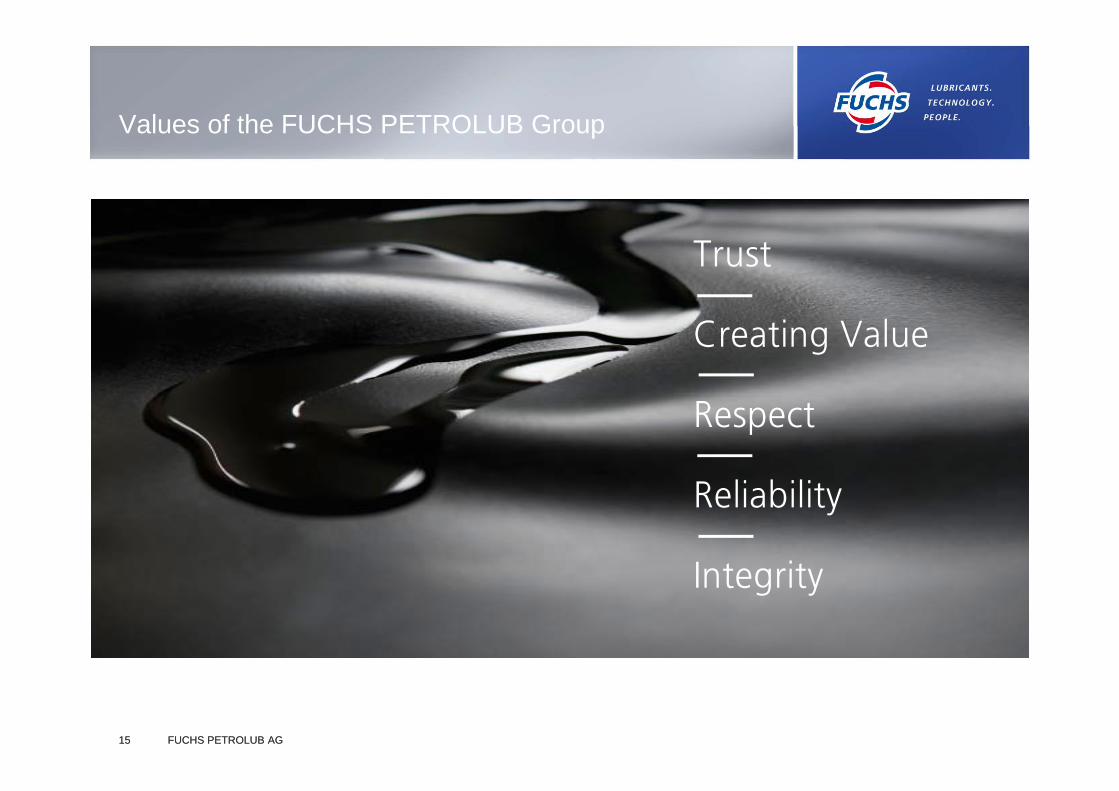
Values of the FUCHS PETROLUB GroupValues of the FUCHS PETROLUB Group
Trust
Creating Value
Respect
R li bilitReliability
IntegrityIntegrity
FUCHS PETROLUB AG15 FUCHS PETROLUB AG15
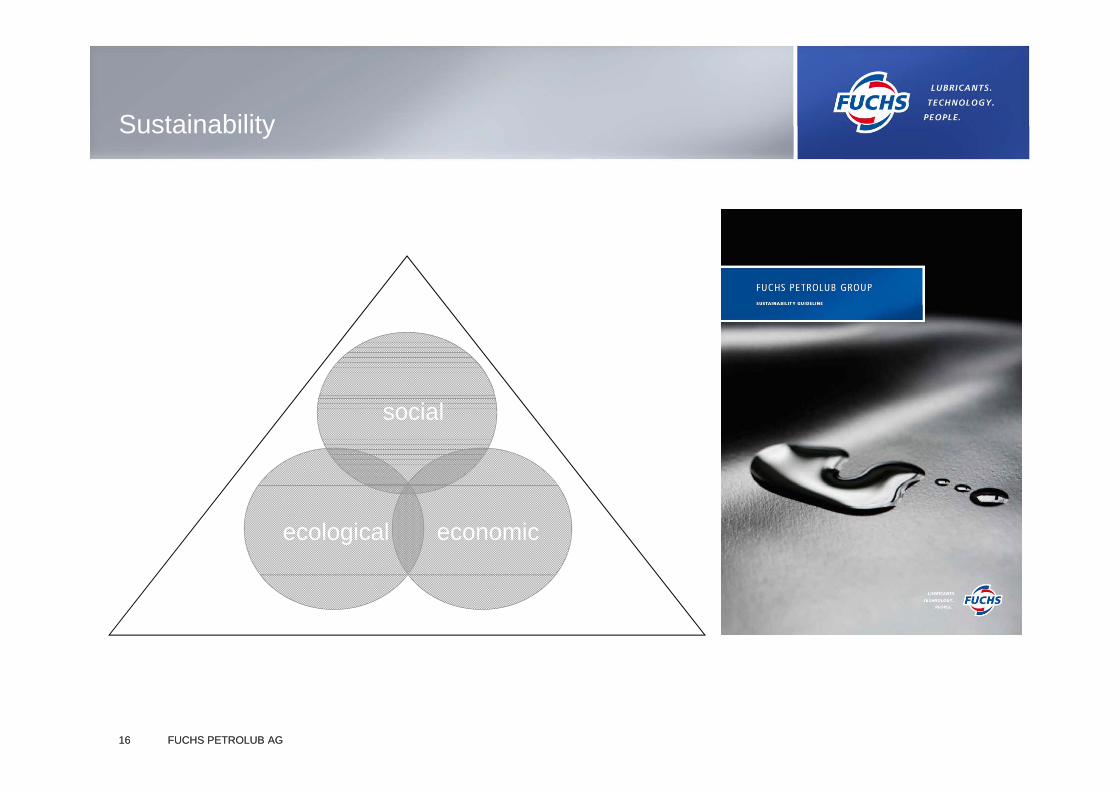
SustainabilitySustainability
social
ecological economic
FUCHS PETROLUB AG16 FUCHS PETROLUB AG16

Good return for shareholders
FUCHS PETROLUB AG17
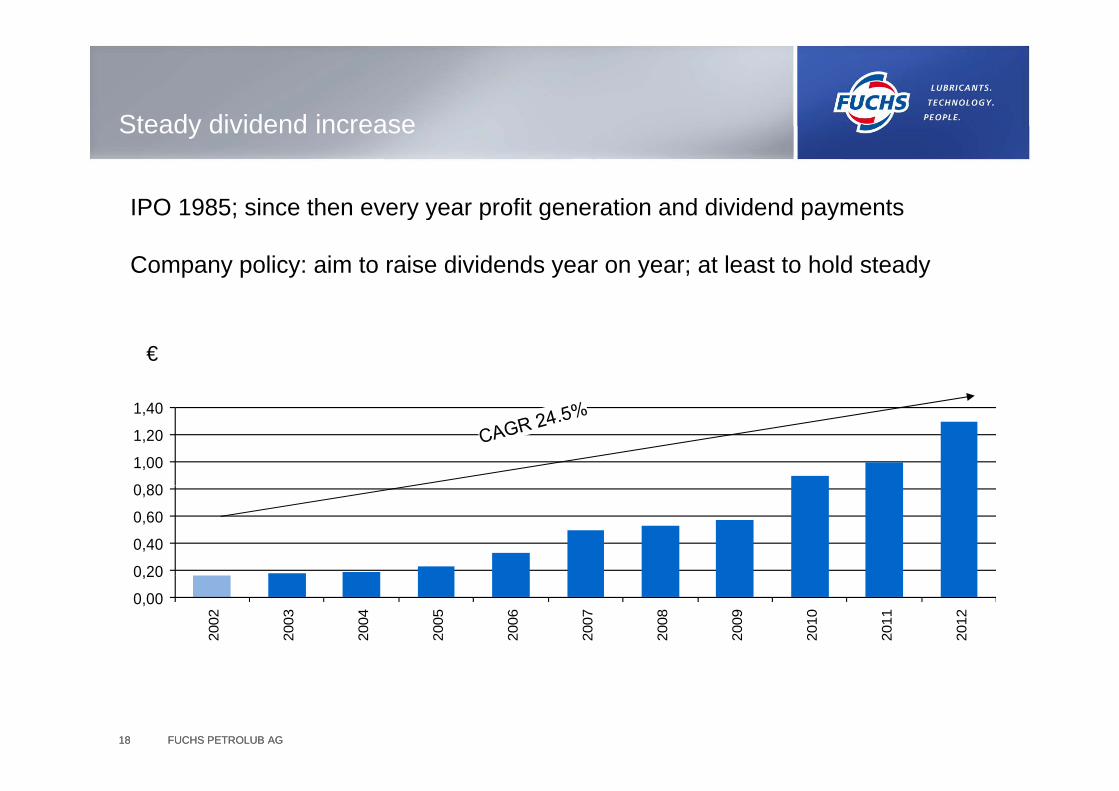
Steady dividend increaseSteady dividend increase
IPO 1985; since then every year profit generation and dividend payments; y y p g p y
Company policy: aim to raise dividends year on year; at least to hold steady
€
0 80
1,00
1,20
1,40
0 20
0,40
0,60
0,80
0,00
0,20
2002
2003
2004
2005
2006
2007
2008
2009
2010
2011
2012
FUCHS PETROLUB AG18 FUCHS PETROLUB AG18
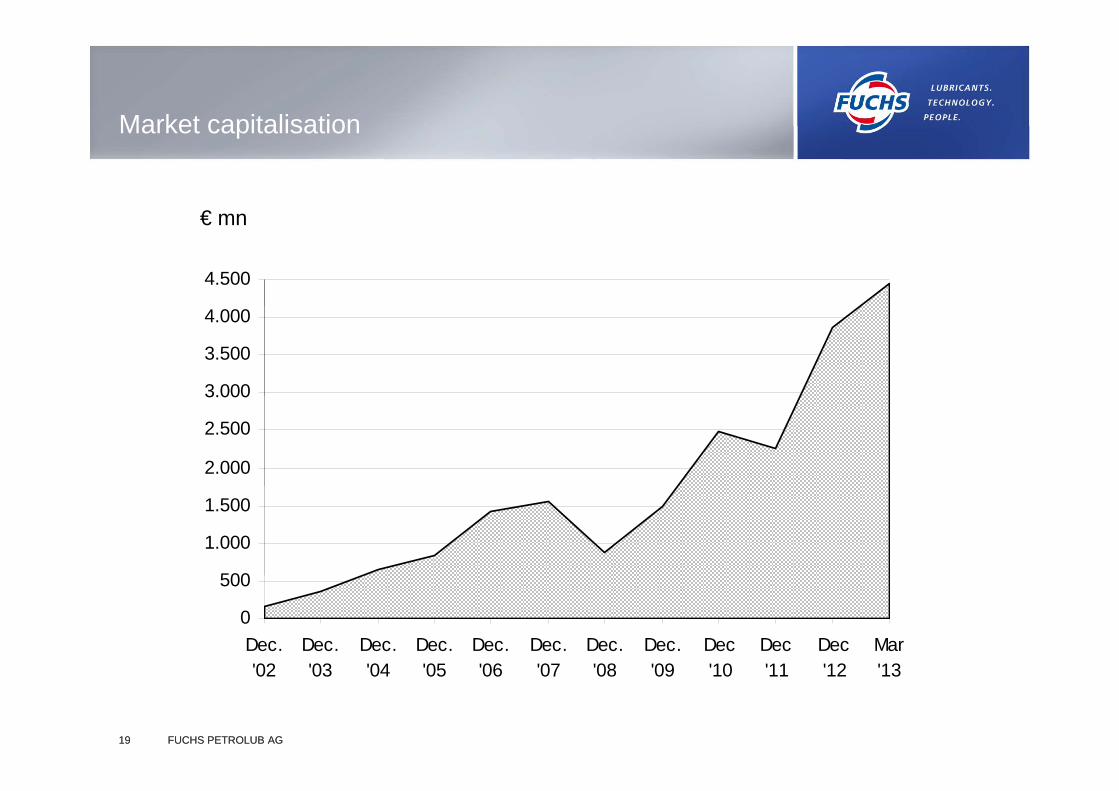
Market capitalisationMarket capitalisation
€ mn
4.500
€ mn
3.000
3.500
4.000
2.000
2.500
3.000
500
1.000
1.500
0
500
Dec.'02
Dec.'03
Dec.'04
Dec.'05
Dec.'06
Dec.'07
Dec.'08
Dec.'09
Dec'10
Dec'11
Dec'12
Mar'13
FUCHS PETROLUB AG19 FUCHS PETROLUB AG19
'02 '03 '04 '05 '06 '07 '08 '09 '10 '11 '12 '13
Financials
FUCHS PETROLUB AG20
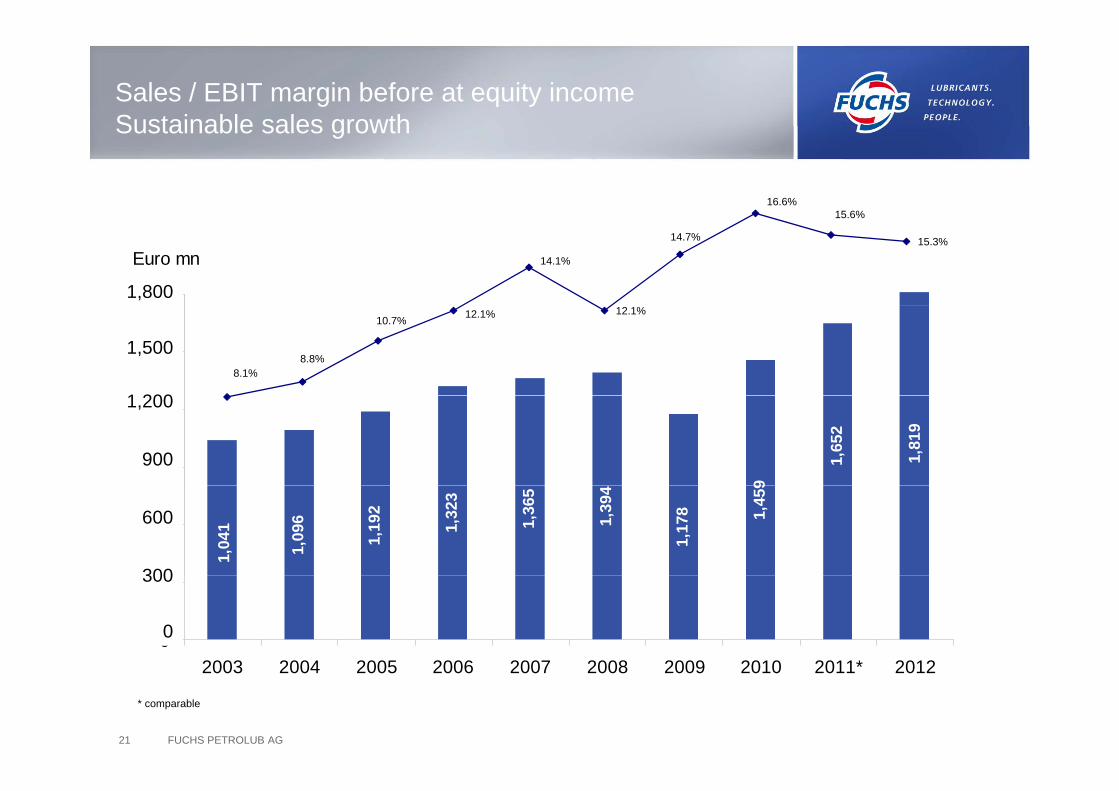
Sales / EBIT margin before at equity incomeSustainable sales growthSustainable sales growth
16.6%15 6%
1.800
Euro mn
1,800
14.1%
14.7%
15.6%
15.3%
1.5001,500
1 2008.1%
8.8%
10.7% 12.1% 12.1%
9
1,65
2
1,81
9
900
1.2001,200
900
1,45
9
1,17
81,39
4
1,36
5
1,32
3
1,09
6
1,04
1
1,19
2
600600
300
0
300
2003 2004 2005 2006 2007 2008 2009 2010 2011* 2012
300
0
FUCHS PETROLUB AG21
2003 2004 2005 2006 2007 2008 2009 2010 2011* 2012
* comparable
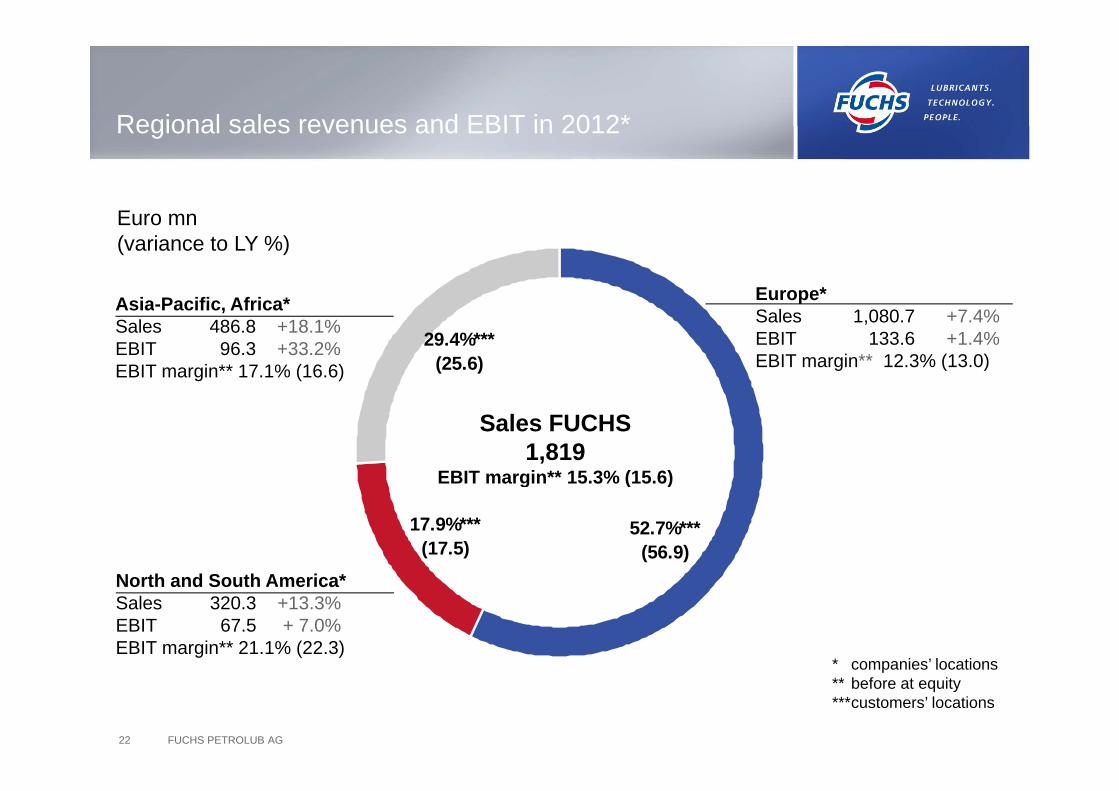
Regional sales revenues and EBIT in 2012*Regional sales revenues and EBIT in 2012
Euro mnEuro mn(variance to LY %)
Europe*Asia-Pacific Africa*
29.4%***(25.6)
Sales 1,080.7 +7.4%EBIT 133.6 +1.4%EBIT margin** 12.3% (13.0)
Asia-Pacific, AfricaSales 486.8 +18.1%EBIT 96.3 +33.2%EBIT margin** 17.1% (16.6)
Sales FUCHS1,819
EBIT margin** 15.3% (15.6)
17.9%***(17.5)
52.7%***(56.9)
g ( )
N th d S th A i *
* companies’ locations
North and South America*Sales 320.3 +13.3%EBIT 67.5 + 7.0%EBIT margin** 21.1% (22.3)
FUCHS PETROLUB AG22
companies locations ** before at equity***customers’ locations
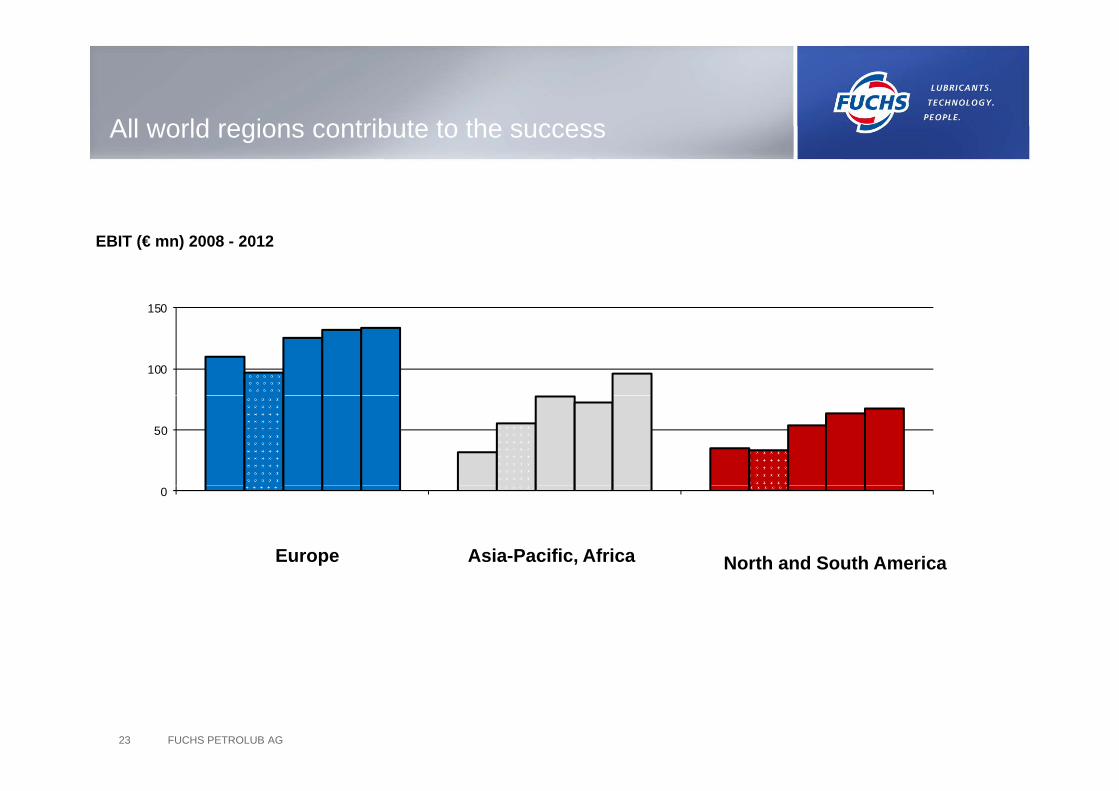
All world regions contribute to the successAll world regions contribute to the success
150
EBIT (€ mn) 2008 - 2012
100
150
50
0
Europe Asia-Pacific, Africa North and South America
FUCHS PETROLUB AG23
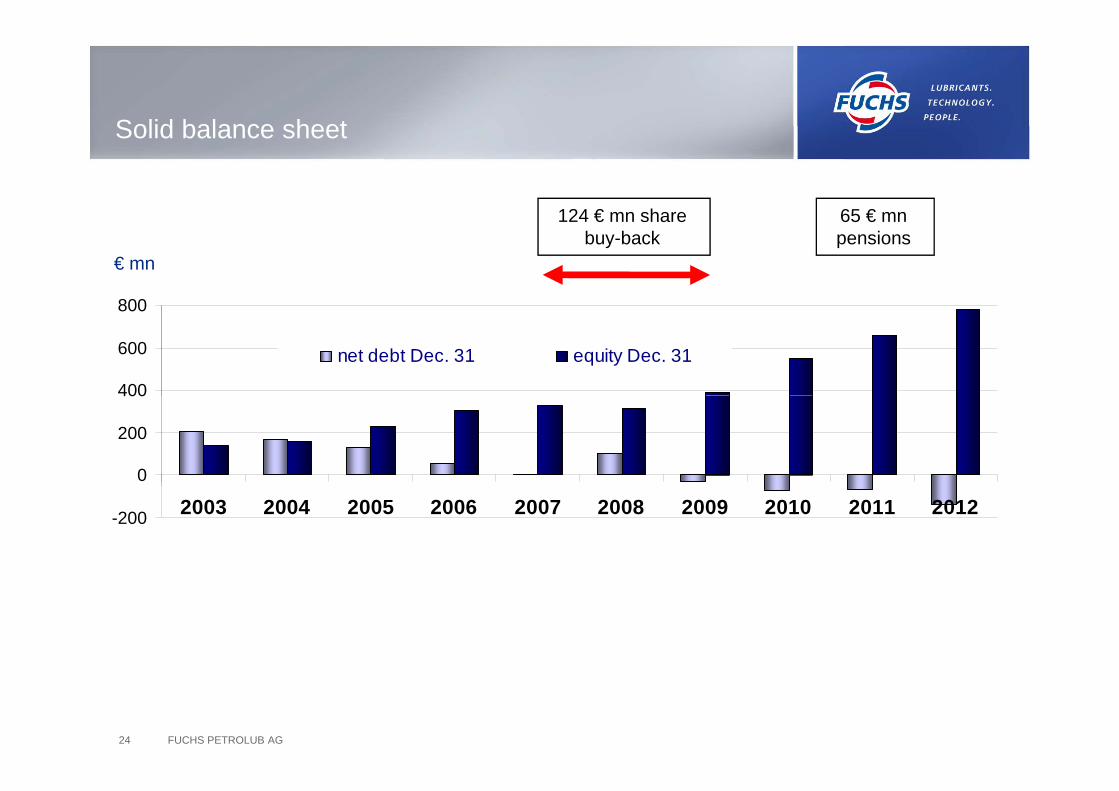
Solid balance sheet
124 € mn share
Solid balance sheet
65 € mn
€ mn
800
124 € mn share buy-back
65 € mn pensions
400
600
800
net debt Dec. 31 equity Dec. 31
0
200
400
-200 2003 2004 2005 2006 2007 2008 2009 2010 2011 2012
FUCHS PETROLUB AG24
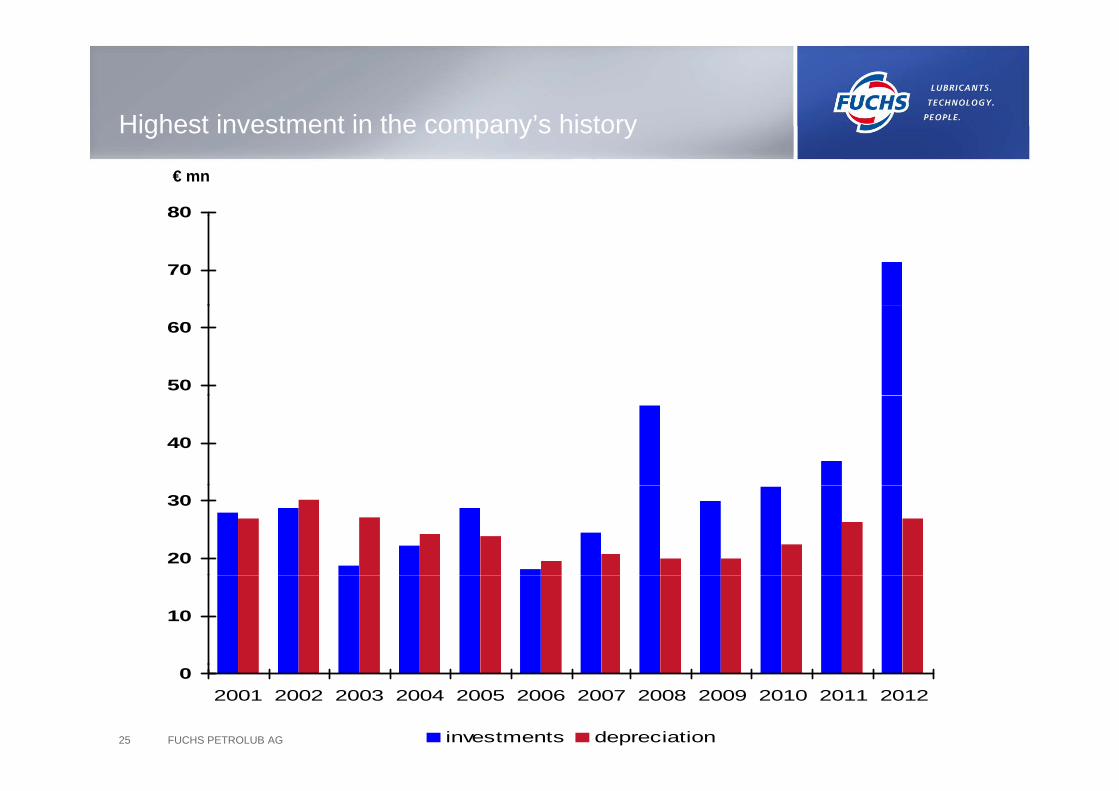
Highest investment in the company’s historyHighest investment in the company s history
80
€ mn
70
80
50
60
40
20
30
10
FUCHS PETROLUB AG25
02001 2002 2003 2004 2005 2006 2007 2008 2009 2010 2011 2012
investments depreciation
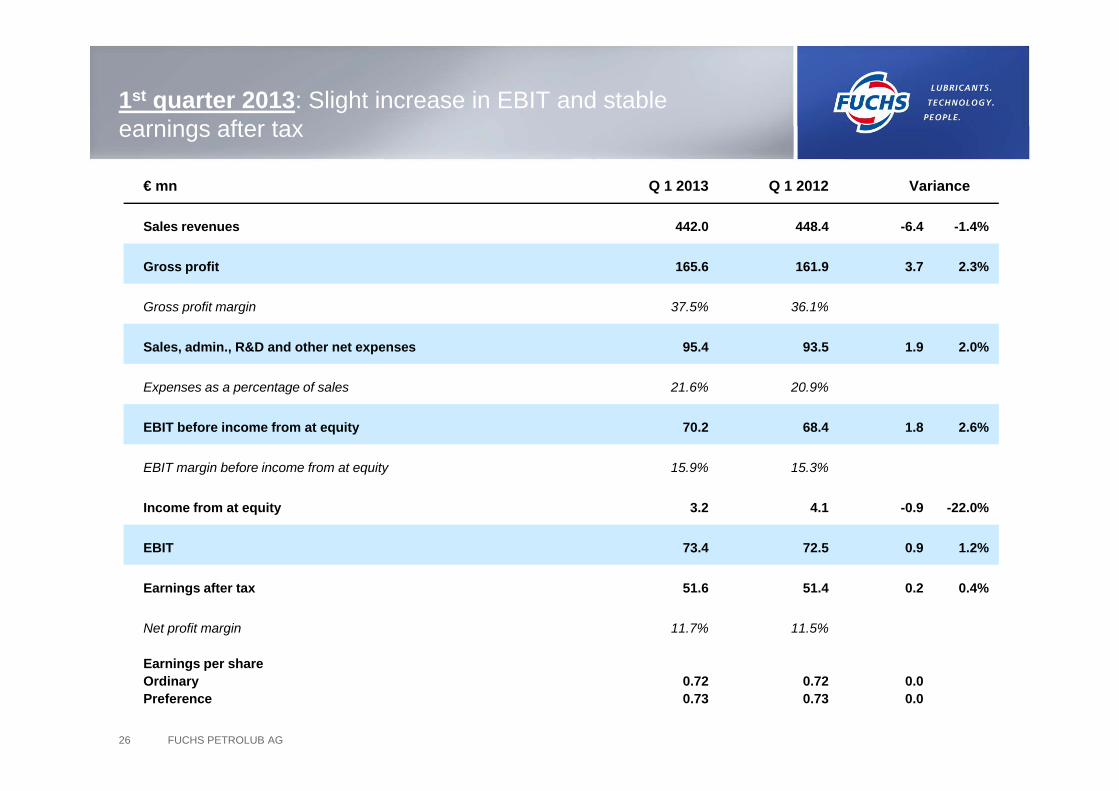
1st quarter 2013: Slight increase in EBIT and stable earnings after taxearnings after tax
€ mn Q 1 2013 Q 1 2012 Variance
Sales revenues 442.0 448.4 -6.4 -1.4%
Gross profit 165.6 161.9 3.7 2.3%
Gross profit margin 37 5% 36 1%Gross profit margin 37.5% 36.1%
Sales, admin., R&D and other net expenses 95.4 93.5 1.9 2.0%
Expenses as a percentage of sales 21.6% 20.9%
EBIT before income from at equity 70.2 68.4 1.8 2.6%
EBIT margin before income from at equity 15.9% 15.3%
Income from at equity 3.2 4.1 -0.9 -22.0%
EBIT 73.4 72.5 0.9 1.2%
Earnings after tax 51.6 51.4 0.2 0.4%
Net profit margin 11.7% 11.5%
Earnings per share
FUCHS PETROLUB AG26
Earnings per shareOrdinary Preference
0.720.73
0.720.73
0.00.0
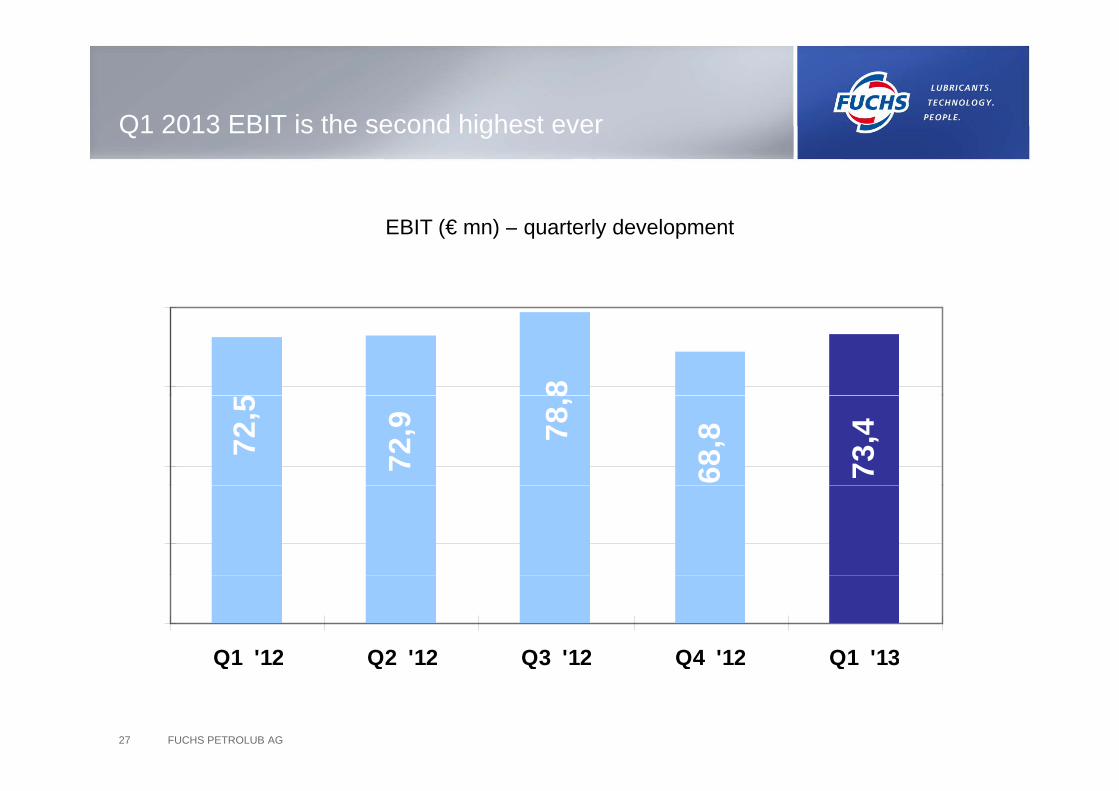
Q1 2013 EBIT is the second highest everQ1 2013 EBIT is the second highest ever
EBIT (€ mn) – quarterly development
8
72,5
72,9 78
, 8
68,8
73,4
Q1 '12 Q2 '12 Q3 '12 Q4 '12 Q1 '13
FUCHS PETROLUB AG27
Q1 12 Q2 12 Q3 12 Q4 12 Q1 13
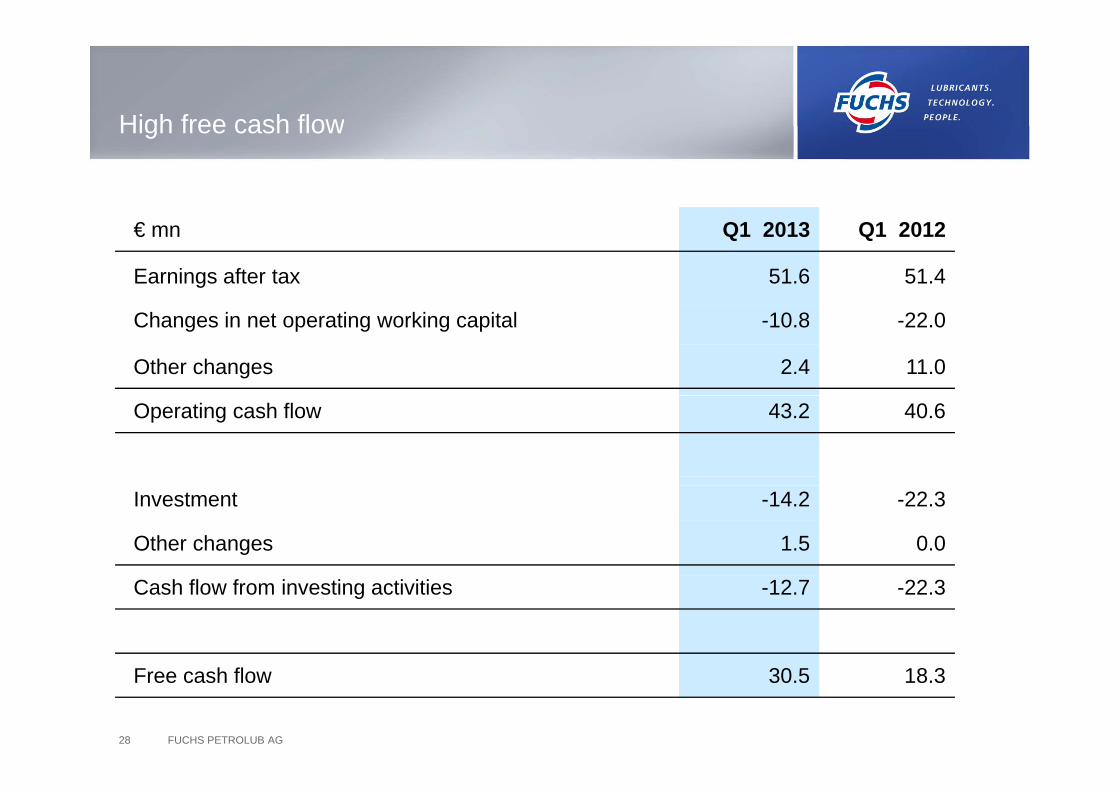
High free cash flowHigh free cash flow
€ mn Q1 2013 Q1 2012
Earnings after tax 51.6 51.4
Changes in net operating working capital -10.8 -22.0
Other changes 2.4 11.0
Operating cash flow 43.2 40.6
Investment -14.2 -22.3
Other changes 1.5 0.0
Cash flow from investing activities -12.7 -22.3
FUCHS PETROLUB AG28
Free cash flow 30.5 18.3
Outlook for the FUCHS GroupOutlook for the FUCHS Group
Outlook for the year 2013
FUCHS fi it l i f i th i 2013 i th l i l di it FUCHS confirms its planning for organic growth in 2013 in the low single-digit percent range. To what extent sales revenues will be influenced by changes in currency exchange rates remains to be seen.
FUCHS anticipates a further increase in earnings before interest and tax (EBIT), profit after tax, and earnings per share in 2013.
FUCHS i l i hi h h fl t ith t di i ifi t it l FUCHS is planning a high cash flow notwithstanding significant capital expenditure at a similar level as 2012.
Outlook is based on a stable economic environment in the next quarters, which is
not negatively effected by the various political and financial risks around the globe.
FUCHS PETROLUB AG29
g y y p g
Continuation of growth initiative
FUCHS PETROLUB AG30
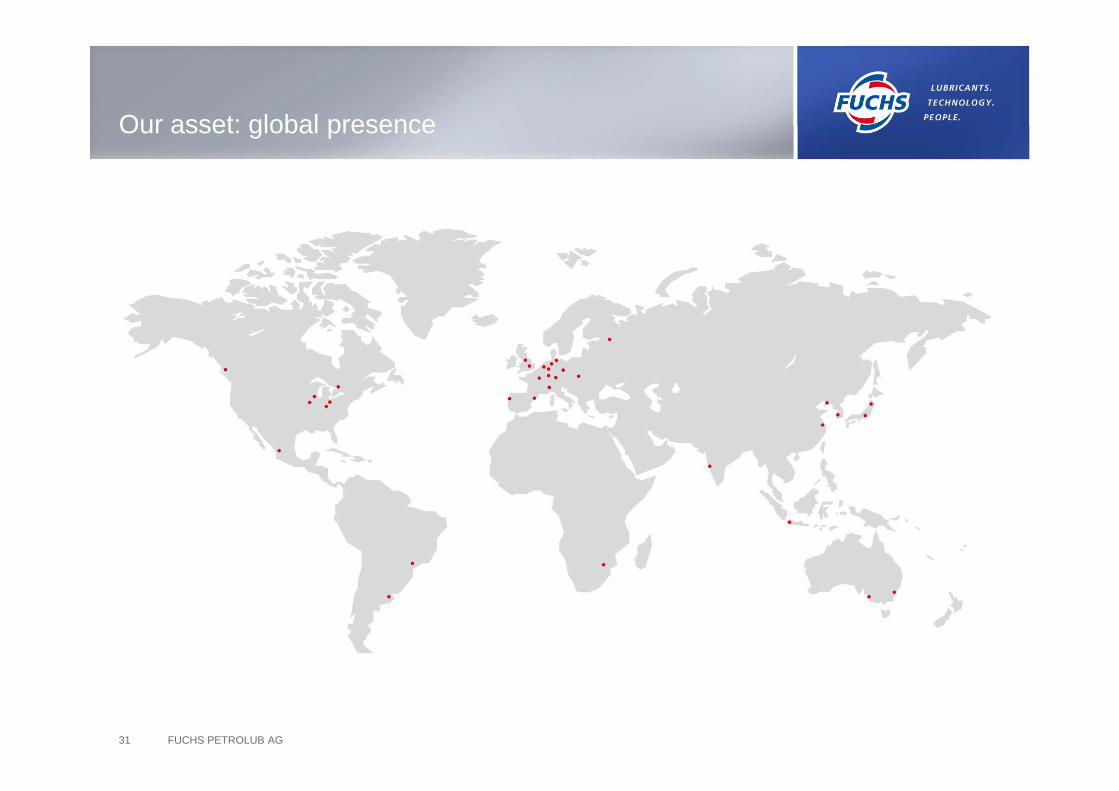
Our asset: global presenceOur asset: global presence
FUCHS PETROLUB AG31
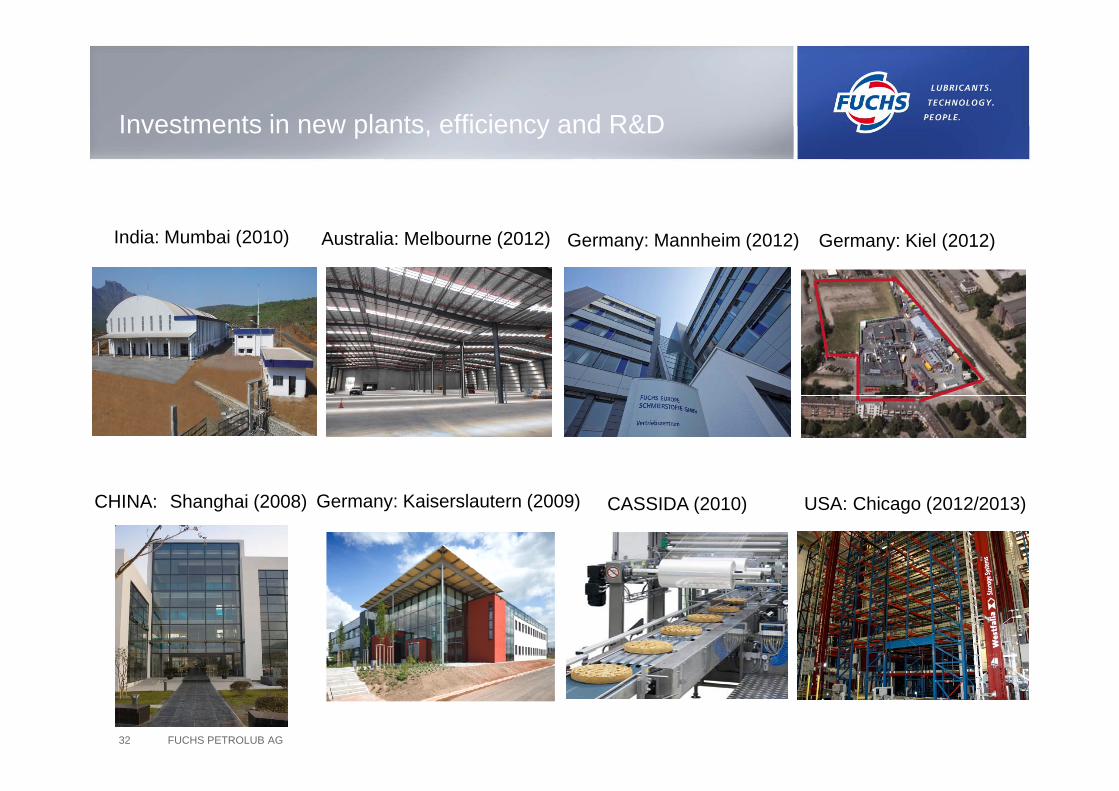
Investments in new plants efficiency and R&DInvestments in new plants, efficiency and R&D
India: Mumbai (2010) Australia: Melbourne (2012) Germany: Kiel (2012)Germany: Mannheim (2012)
CHINA: Shanghai (2008) USA: Chicago (2012/2013)CASSIDA (2010)Germany: Kaiserslautern (2009)
FUCHS PETROLUB AG32
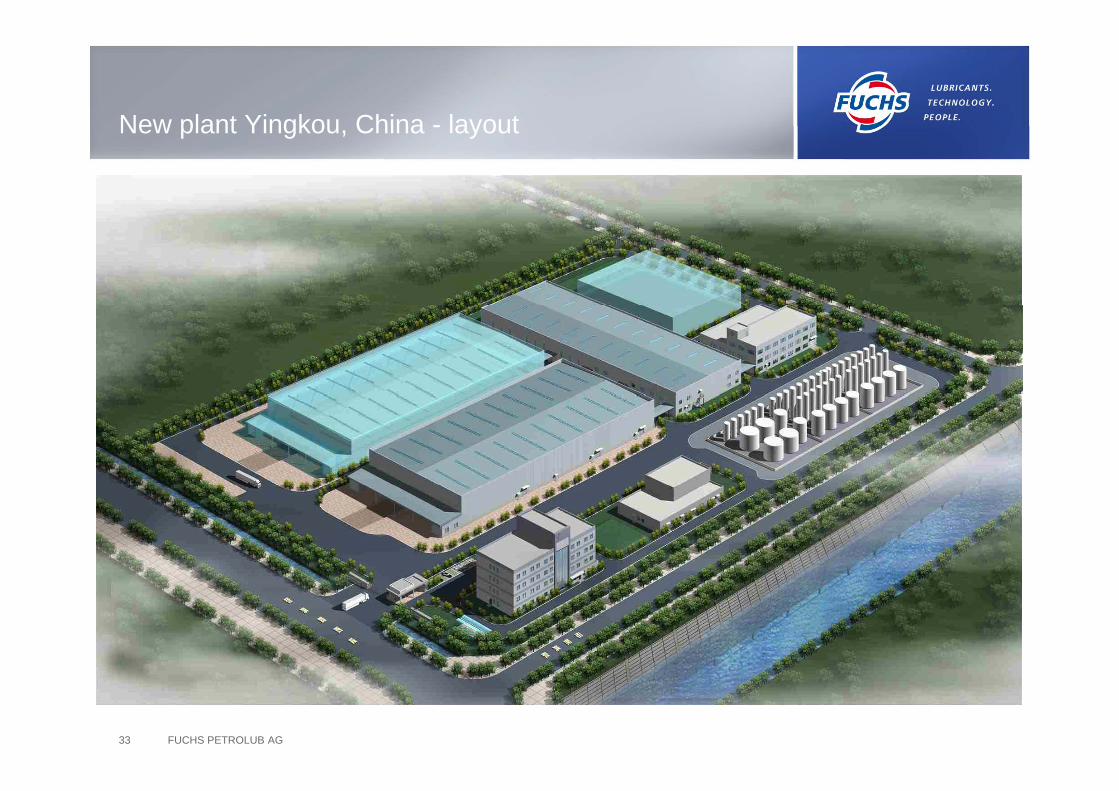
New plant Yingkou China - layoutNew plant Yingkou, China - layout
FUCHS PETROLUB AG33
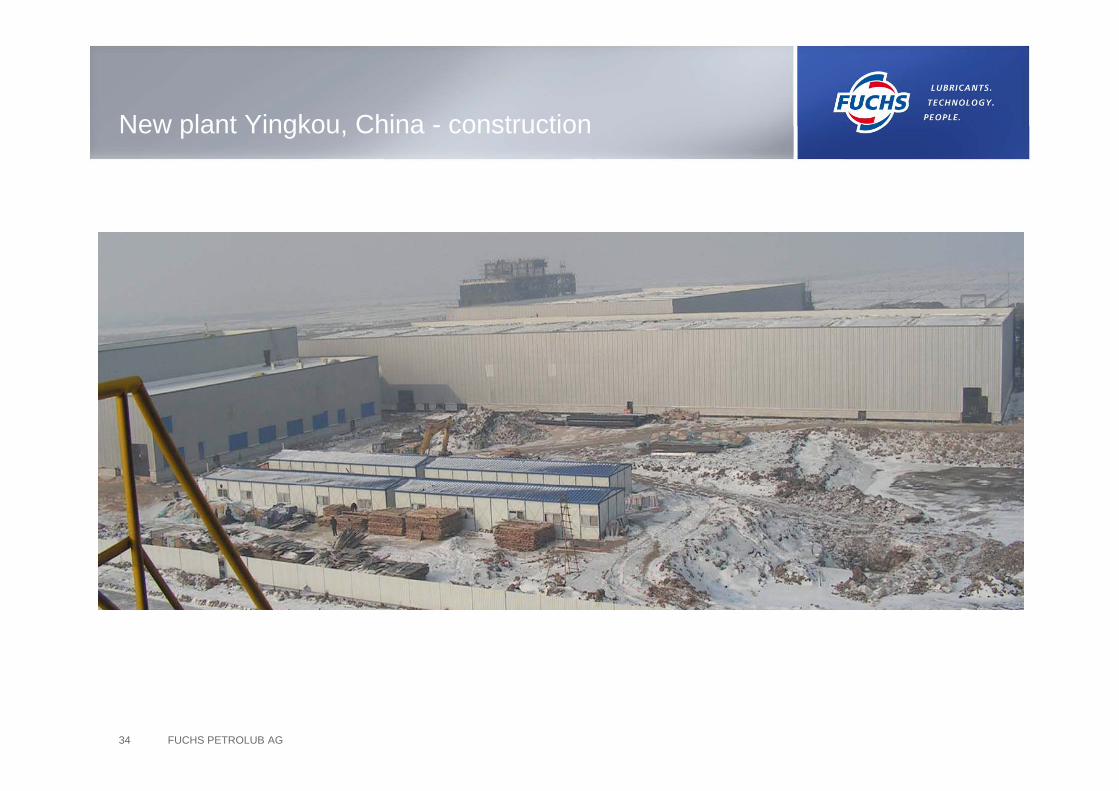
New plant Yingkou China - constructionNew plant Yingkou, China - construction
FUCHS PETROLUB AG34
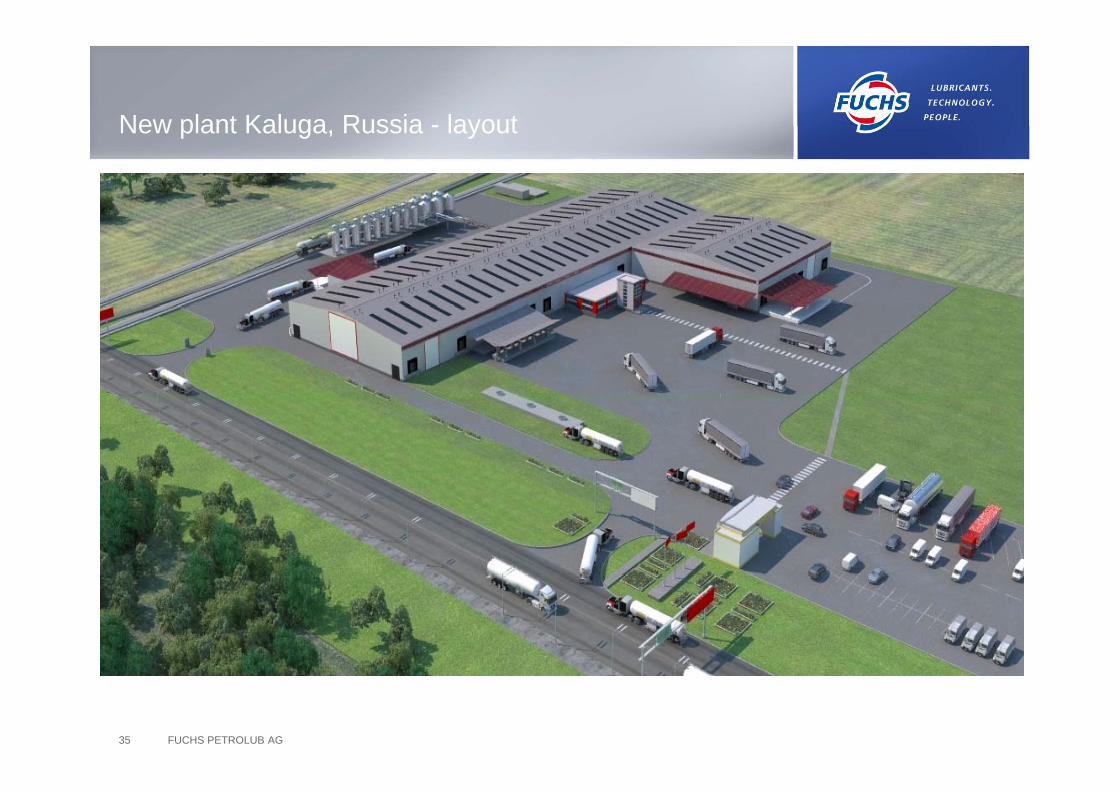
New plant Kaluga Russia - layoutNew plant Kaluga, Russia - layout
FUCHS PETROLUB AG35
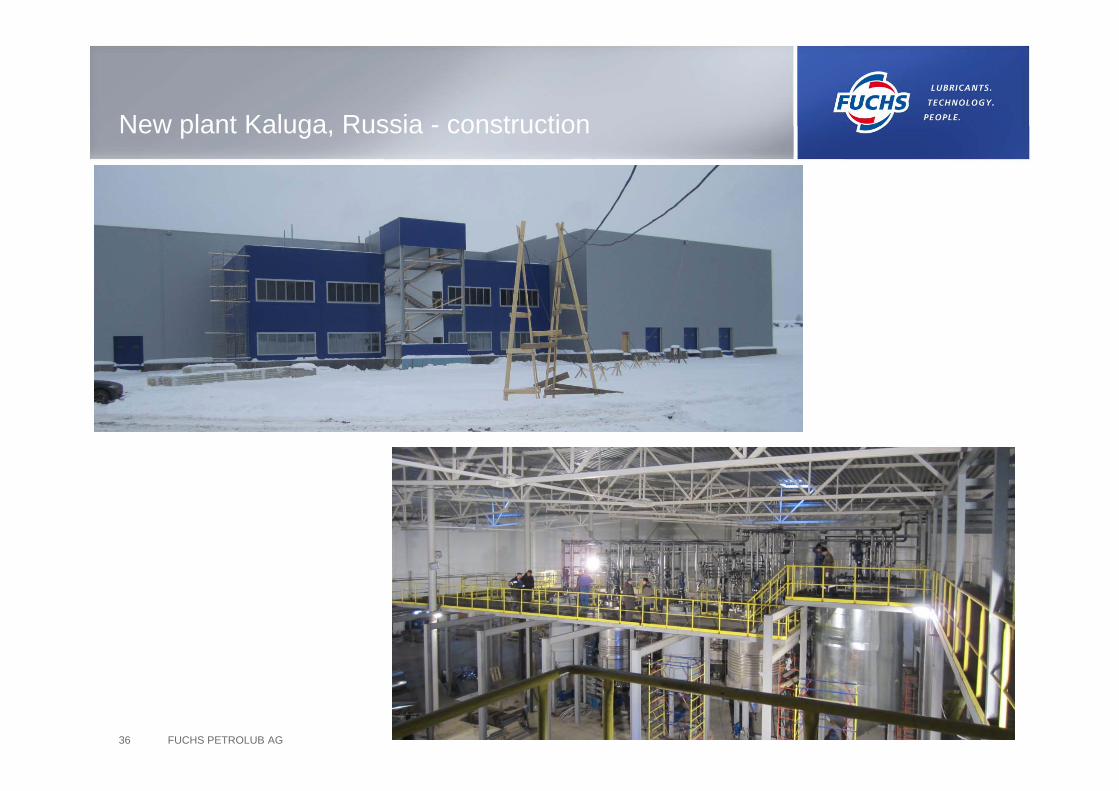
New plant Kaluga Russia - constructionNew plant Kaluga, Russia - construction
FUCHS PETROLUB AG36
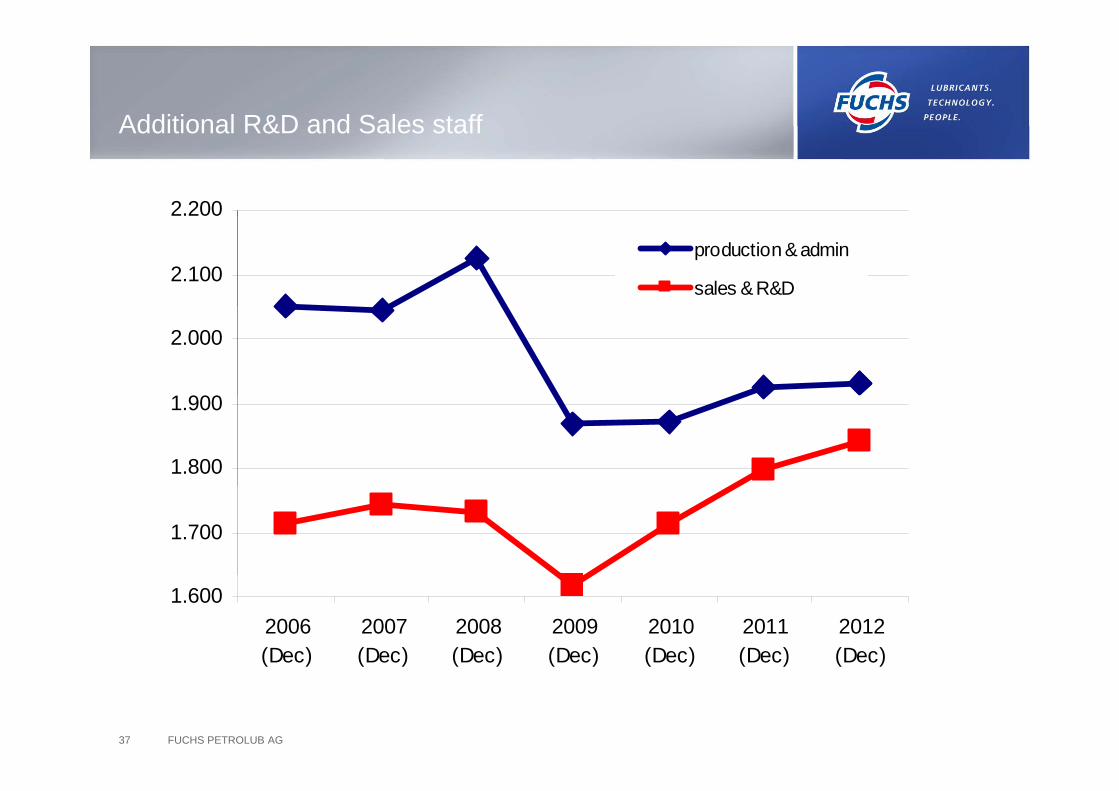
Additional R&D and Sales staffAdditional R&D and Sales staff
2.200
2.100production & admin
sales & R&D
1 900
2.000
1.800
1.900
1.700
1.6002006(Dec)
2007(Dec)
2008(Dec)
2009(Dec)
2010(Dec)
2011(Dec)
2012(Dec)
FUCHS PETROLUB AG37
( ) ( ) ( ) ( ) ( ) ( ) ( )
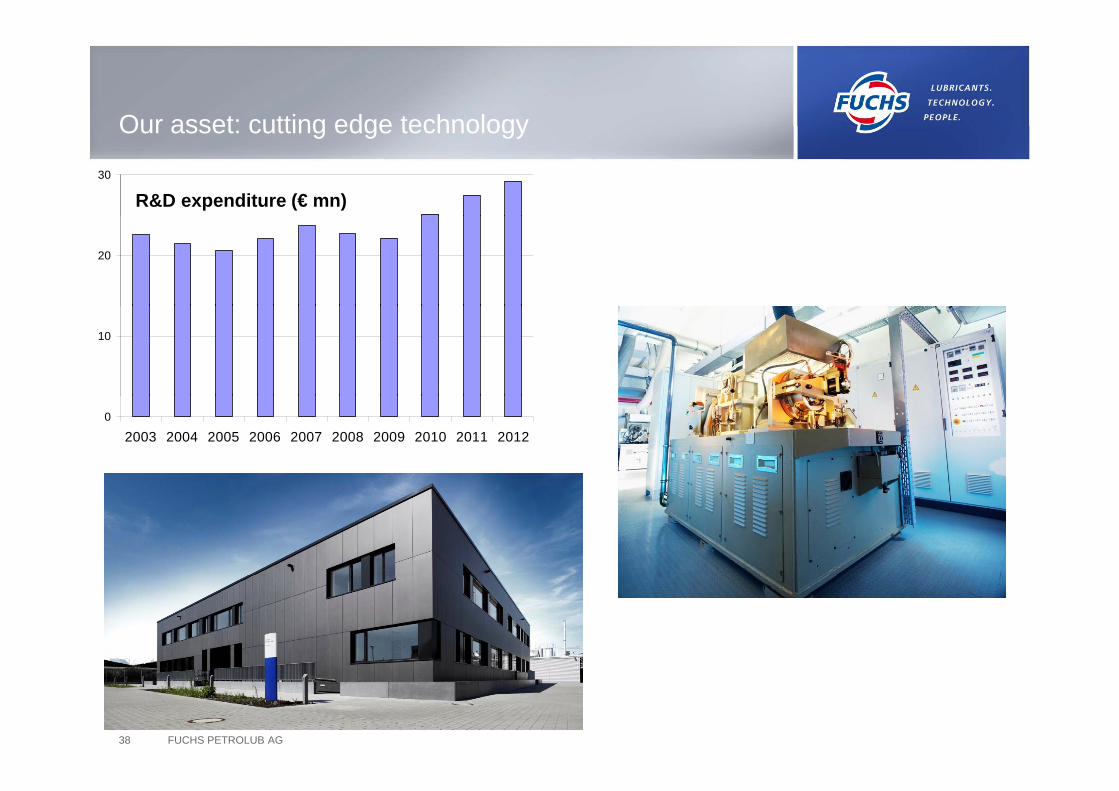
Our asset: cutting edge technologyOur asset: cutting edge technology
R&D expenditure (€ mn)30
20
10
0
2003 2004 2005 2006 2007 2008 2009 2010 2011 2012
FUCHS PETROLUB AG38
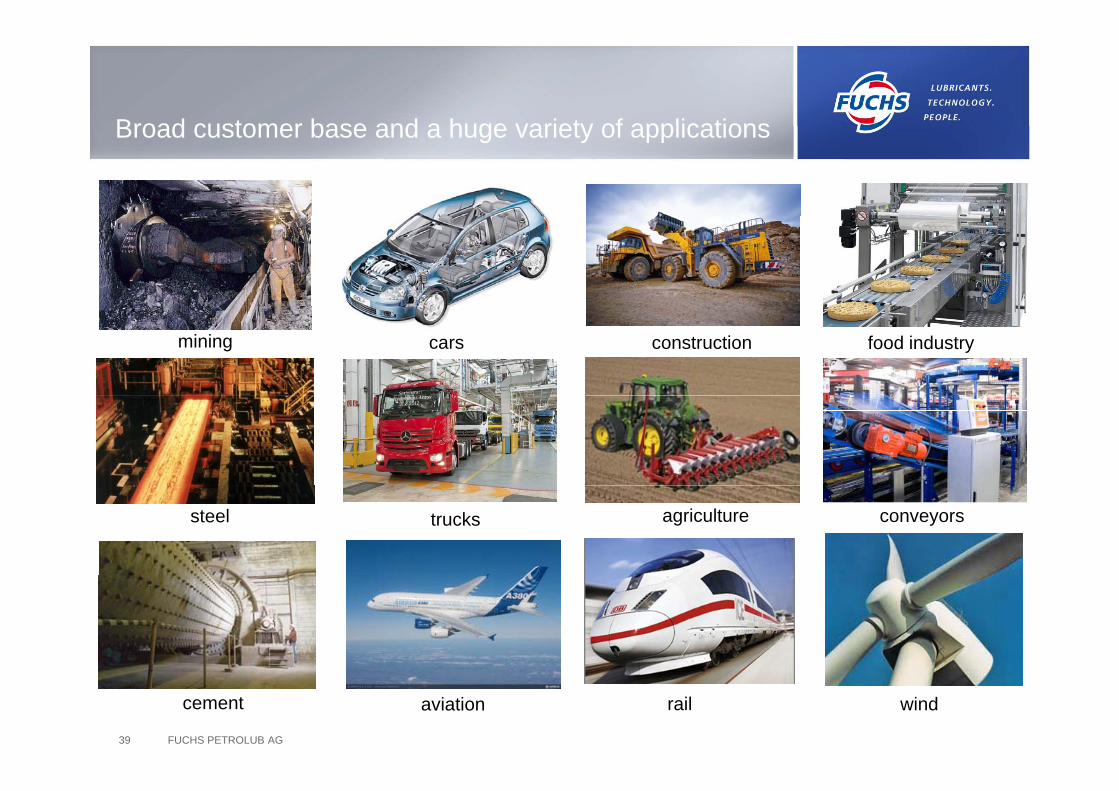
Broad customer base and a huge variety of applicationsBroad customer base and a huge variety of applications
mining cars construction food industry
steel agriculture conveyorstrucks
FUCHS PETROLUB AG39
cement railaviation wind
DisclaimerDisclaimer
This presentation contains statements about future development p pthat are based on assumptions and estimates by the management of FUCHS PETROLUB AG. Even if the management is of the opinion that these assumptions and estimates are accurate, future actual developments and future actual results may differactual developments and future actual results may differ significantly from these assumptions and estimates due to a variety of factors. These factors can include changes to the overall economic climate, changes to exchange rates and interest rates , g gand changes in the lubricants industry. FUCHS PETROLUB AG provides no guarantee that future developments and the results actually achieved in the future will agree with the assumptions and
ti t t t i thi t ti d li bilit festimates set out in this presentation and assumes no liability for such.
FUCHS PETROLUB AG40