ftp.cdc.gov · PDF fileData from the NATIONAL HEALTH SURVEY prevalence of Selected Impairments...
85
Data from the NATIONAL HEALTH SURVEY prevalence of Selected Impairments United States - July 1963-June 1965 Statistics on the prevalence of impairments involving vision, hearing, speech, paralysis, absence of extremities, and ortho- pedic defects by type, site, and etiology. Distributed by age, sex, color, geographic region, family income, and associated chronic activity limitation. Based on data collected in house- hold interviews during the period July 1963-June 1965. DHEW Publication No. (HRA) 74-1286 U.S. DEPARTMENT OF HEALTH, EDUCATION, AND WELFARE Public Health Service Series 10 Number 48 Health Services and Mental Health Administration National Center for Health Statistics Rockville, Md. December 1973
Transcript of ftp.cdc.gov · PDF fileData from the NATIONAL HEALTH SURVEY prevalence of Selected Impairments...

Data from theNATIONAL HEALTH SURVEY
prevalence of
Selected Impairments
United States - July 1963-June 1965
Statistics on the prevalence of impairments involving vision,hearing, speech, paralysis, absence of extremities, and ortho-pedic defects by type, site, and etiology. Distributed by age,sex, color, geographic region, family income, and associatedchronic activity limitation. Based on data collected in house-hold interviews during the period July 1963-June 1965.
DHEW Publication No. (HRA) 74-1286
U.S. DEPARTMENT OF HEALTH, EDUCATION, AND WELFARE
Public Health Service
Series 10Number 48
Health Services and Mental Health Administration
National Center for Health Statistics
Rockville, Md. December 1973

\/l~c,l ,,,,,{ Hc,i] [}, s(,, [l\~,’\.scr,c, 1().~~
I’lt-,t I\.uLd III tl]c I’LII>IIL Hc,I]tlI Scrvlcc [’ublic~tlon Series No. 1000” N,~vcmber 1968

NAT,
OSWALD K.
ONAL CENTER FOR HEALTH STATISTICS
THEODORE D. WOOLSEY, Dhector
PHILIP S. LAWRENCE, SC. D., Associate Director
SAGEN, Ph. D., Assistant Director /or Health Statistics Development
WALT R. SIMMONS, M. A., Assistant Director for Research and Scientific Development
ALICE U. WATERHOUSE, M. D., Medical Consultant
JAMES E. KELLY, D. D. S., Dental Advisor
EDWARD E. MINTY, Executive O/ficer
MARGERY R. CUNNINGHAM, Information O//icer
DIVIS1ON OF HEALTH INTERVIEW STATISTICS
ELIJAH L. WHITE, Director
ROBERT R. FUCHSBERG, Deputy Director
KENNETH HAASE, .$peciaz Assistant to Director
RON ALD W, WILSON, Chief, Survey Methods B~anch
GERALDINE A. GLEESON, Chief, Analysis and Reports Branch
COOPERATION OF THE BUREAU OF THE CENSUS
IJnd@r the legislation establishing the National Health
Surve,y, the Public Health Swvi ce is authorized to use, insofar
as possible, the services or facilities of other Federal, State,
or private agencies.
In accordance with specifications established by the
NaLional Health Survey, the Bureau of the Census, under a
contractual arrangement, participates in most aspects of sur-
vey planning, selects the sample, collects the data, and carries
ou t rcrtain part,s of the statistical processing.
Public Health Service Publication No. 1000-Series 1O-NO. 48
Library of Congress Catalog Card Number 68-62239

CONTENTSPage
htroduction ---------------------------------------------------------- 1
Source and Qualifications of Data --------------------------------------- 2
Visual hpirments --------------------------------------------------- 3Age ~dSex -------------------------------------------------------- 4Color ------------------------------------------------------------- 5Etiolo~----------------------------------------------------------- 5Region ------------------------------------------------------------ 7Family Income ----------------------------------------------------- 7Activity Lfiitation ------------------------------------------------- 7
Hearing Impaiments -------------------------------------------------- 8Age, Sex, and Color ------------------------------------------------- 8Etiolo~----------------------------------------------------------- 8Re@on ------------------------------------------------------------ 10Family hcome ----------------------------------------------------- 10Activity Ltiitation ------------------------------------------------- 10
Speech Impairments --------------------------------------------------- 10Age, Sex, and Color ------------------------------------------------ 11Etiolo~----------------------------------------------------------- 11Region ------------------------------------------------------------ 12Family kcome ----------------------------------------------------- 12Activity Limitation ------------------------------------------------- 12
Paralysis$ Complete or Partial ----------------------------------------- 12Age, Se~, and Color ------------------------------------------------- 12Etiolo~----------------------------------------------------------- 13Region ------------------------------------------------------------ 14Family Income ----------------------------------------------------- 14Activity Ltiitation ------------------------------------------------- 14
. ..Ill

. CONTENTS—Con.
Page
Absence of Extremities ------------------------------------------------Selected Characteristics --------------------------------------------Etiology -----------------------------------------------------------Activity Limitation -------------------------------------------------
Impairments (Except Paralysis and Absence) of Limbs, Back, and Trunk----Age and Sex-------------------------------------------------------Color -------------------------------------------------------------Etiolo~-----------------------------------------------------------Region ----------------------------------------------:-------------Family Income -----------------------------------------------------Activity Limitation -------------------------------------------------
Increased Prevalence of Impairments -----------------------------------
Detailed Tables -------------------------------------------------------
Appendix I. Teckical Notes on Methods -------------------------------Background of This Report ------------------------------------------Statistical Design of the Health Interview Survey -----------------------General Qualifications ----------------------------------------------Reliability of Estimates ---------------------------------------------Guide to Use of Relative Standard Error Charts -----------------------
Appendix II. Definitions of Certain Terms Used in This Report and Classi-fication of Impairments &-Code)--------------------------------------
Demographic and Economic Terms -----------------------------------Terms Relating to Chronic Conditions --------------------------------Terms Relating to Disability ----------------------------------------Classification of Impairments &-Code)-------------------------------
List of Mpairments, by T~eand Site (XOO-X99)---------------------Lists of l-Digit Etiolo~ Codes -------------------------------------Preference Rules Used When Multiple Etiologies Are Given ------------
Appendix III. Questiomaire -------------------------------------------
15151616
17171819202020
20
22
595959606062
6565656667677071
73
iv

SYMBOLS
Data not available ------------------------ ---
Category not applicable ------------------- . . .
Quantity zero ---------------------------- -
Quantity morethan O but less tban O.05---- 0.0
Figure doesnot meet standards ofreliabilityor precision ------------------ *
v

IN THIS REPORT statistics age presented on the prevalence of im-pairments involving vision, heaving, speech, paralysis, absence of ex-tremities, and orthopedic defects. The type, site, and etiology of theseselected impairments ave shown. The ahta are based on informationcollected in household inteniews in a representative sample of the U.S.population during the period J&y 1963-June 1965,
Each impaiment group is discussed separately. The demographic van’-ables by which the data are distributed inclwde age, sex, color, geog-raphic re~”on, and family income. In addition, infovmatwn is pvasentedon the chvonic activity limitation associated with each type of impair-ment. In the last section of the p-resent report the estimates are com-pared with estimates pvodwced earliar by the suvvey.
In the civilian, noninstitutional population it is estimated that there wasan average annual number of a bout 5.4 million viswai! impairments, 8.5million heaving impairments, and 1.3 million speech defects duving thepeviod July 1963-June 1965. There were also an estimated 1.5 millioncases of paralysis, 2.0 million cases of missing extremities, and 17.7million orthopedic defects during this period. Cataracts were the lead-ing cause repovted for viswal impairments, ad ill-defined and unknowncauses for both heaving impairments and speech defects. Vascwlav le-sions affecting the central nervous system weve the major cause ofpavalysis; while injuvy constituted the major cause of both missing ex-tremities and orthopedic defects. In gene?al, thave were substantialwzriations by age for most topics covered.

PREVALENCE OF
SELECTED IMPAIRMENTSAnn L.Jackson,Divisionof Health Inte?wiew Statistics
INTRODUCTION
The term “impairment”hasnoactual,defini-tivemedicalsignificance.As usedintheHealthInterviewSurvey,theterm “impairment”refersto chronicor permanentdefectsresultingfromdisease, injury,or congenitalmalformation.These defectsrepresenta decreaseinor lossofabilitytoperformvariousfunctions,particularlythose ofthemusculoskeletalsystem and senseorgans.
Thisreportpresentsinformationon impair-ments involving(1)vision(2)hearing,(3)speech,(4)paralysis,(5)absenceofextremities,and (6)orthopedicdefects.The prevalenceofthesese-
lectedimpairmentsissummarized intableA.The demographicand economiccharacteristicsreviewedincludeage, sex, color,region,andfamilyincome.Inaddition,thisreportdescribesthe etiologicfactorscontributingto theseim-pairmentsand theactivitylimitationassociatedwiththem.
‘TWOearlierreportspresenteddataon im-pairmentscollectedbytheHealthInterviewSur-veyduringtheperiodsofJuly1957-June1958andJuly1959-June1961(HeaZth Stui!istics, SeriesB,Nos. 9 and 35).Intheearliestreportmedicalcare status,bed-disabilitydays,theproportionof impairmentscausedby injury,andthemajoractivityofthe impairedpersonwere discussed
Table A. Average prevalence of selected impairments:UnitedStates,July 1963-June 1965
Impairment
All visual impairments-----------------------------------------Severe visual impairments------------------------------------Other visual impairments-------------------------------------
Hearing Impairments--------------------------------------------Speech defects-------------------------------------------------Paralysis, complete or partial---------------------------------Absence of extremities,all sites------------------------------Major extremities--------------------------------------------Finger(s) or toe(s) only-------------------------------------
Other impairmentsof limbs, back, trunk, all sites-------------Back or spine------------------------------------------------Upper extremity and shoulder---------------------------------Lower extremity and hip--------------------------------------Other and multiple, NEC--------------------------------------
Averagenumberin
thousands
5,3901,2274,1638,5491,2981,5161,968257
1.712
Rate per1,000
population
28.8
2::;45.76.98.1
10.5
$:?94.834:715.635.49.1

for many broad types of impairments. The morerecent report was restricted to the six impair-ment groups (excluding the absence of minor ex-tremities) used in the present report, with eti-ologic factors and activity limitation considered.A comparison of the data shown in the presentreport with data shown in the earlier reports ismade in the last section of this report.
More detailed information about persons withimpaired hearing during July 1962- June 1963 maybe found in Vitul and Health Statistics, Series 10,No. 35. The report Series 10, No. 46, of Vitul andHealth Statistics, shows more detailed data onvisual impairments for the period July 1963- June1964.
SOURCE AND QUALIFICATIONSOF DATA
The data presented in this report are derivedfrom information obtained in household interviewsconducted by the Health Interview Survey in co-operation with the U.S. Bureau of the Census. Thehouseholds interviewed were part of a continuousprobability sample of the civilian, noninstitutionalpopulation of the United States. The sample is sodesigned that interviews are conducted every weekof the year in a representative sample of theNation’s households. During the 2-year periodending in June 1965, about 84,000 householdscontaining approximately 268,000 persons wereincluded in the sample.
The restriction of the survey to the non-institutional population reduces the estimates ofimpaired persons. Because of this restriction,persons who are not living at home are excludedfrom the sample while they receive care or train-ing in institutions such as schools for the blindor the deaf, as are those in nursing homes orconvalescent homes in which persons may beblind, deaf, paralyzed, or unable to move aboutfreely because of orthopedic conditions. 1
A description of the design of the survey, themethods used in estimation, and the general quali-fications of data obtained from surveys is pre-
lE~timate~ of the pre~alen~e of impairments among resi-
dents of nursing and personal care homes based on the find-
ings of a sample survey of these institutions during May andJune 1964 may be found in Vital and Health Statistics,Series
12, No. 8.
sented in appendix 1. Since the estimates shown inthis report are based on a sample of the populationrather than on the entire population, they are sub-ject to sampling error. Therefore, particular at-tention should be paid to the section entitled “Re-liability of Estimates. ~I sampl~g errorS formost
of the estimates are of relatively low magnitude.However, where an estimated number or thenumerator or denominator of a rate or percentageis small, the sampling error may be high. Thedata are also subject to errors related to theinterviewing process since the information ob-tained from interviews depends on the respond-ents willingness and ability to answer the inter-viewer’s questions. The adequacy of a responsemay also depend on whether the respondent is re-porting for himself or for a closely related person.
The cautions given above concerning sam-pling errors have particular significance when thedata are broken down by the various demographicand other variables outlined in the introduction.For example, in making comparisons betweenwhite and nonwhite persons, it should be notedthat the estimated numbers for nonwhite pe:rsonsare considerably lower than those for white per-sons. The sampling errors, consequently, arehigher for estimates for nonwhite persons thanfor white.
Another qualification should be consideredwhen making comparisons between different popu-lation groups. In general, the estimated preva-lence of all types of impairments, except speechdefects, incr”ased wi~h age. As illustrated infigure 1, the proportion of persons who were 65years and older differed among the various popu-lation groups used in this report, particularlyamong income groups. Since the estimates forall ages have not been adjusted for age, thesetotals may distort the differences between variouspopulation groups. Consequently, the best com-parisons, between different population groups,particularly color and income groups, can be madeby using age-specific rates.
Certain terms used in this report are definedin appendix II, Since many of these terms havespecialized mehnings for the purpose of thissurvey, it is suggested that the reader familiarizehimself with these definitions. Of particular im-portance is the classification information given inthe definition of “impairments.” In addition,, thecomplete Classification of hnpairments (X-Code)
2

PERCENT
o 5 10 15 20 25I I I I I
Characteristic
Al I persons
Female
~White
Nonwhite
Region
Northeost
North Central
South
West
L8.4
F9.6
6, I
8.7
Family income
Under $3,000 24.4
$3,000-$3999 ~
$4,000-$6,999 5.0 ●
b+7,000-$9,999 3.4
$10,000+ m
Figure 1. Percent of population aged 65 years and
over, by selected character i st its.
by type, site, and etiology is shown at the end ofappendix 11.
The questionnaire used during the periodJuly 1964-June 1965 is illustrated in appendix III.It is similar to the questionnaire used during thepreceding 12 months which is reproduced in the“Current Estimates” report for that period (Vituland Health Statistics, Series 10, No. 13).
Conditions which might be classified as im-pairments were initially recorded from the re-sponses to the illness-recall questions (6-12),particularly question 11 in which a list of im-pairments (card B) was read to the respondent.The more detailed information needed to codethese conditions as impairments was obtained inquestionnaire table I on illnesses, impairments,and injuries. In addition, information concerningthe degree of severity of vision problems wasobtained in question 14.
T’he data in this report on the etiology ofimpairments are based on the causes given byrespondents in column “d-2” of table L Columnsflt!! and !!u!~are the sources of infOrrnatiOn con-
cerning limitation in usual activities. (See cardsE-H in appendix 111and the definition of “chronicactivity limitation” in appendix II.)
The information obtained about the presenceand degree of activity limitation is probably quitesubjective. When a respondent is asked to whatextent, if at all, activity limitation exists, hisreply may be influenced by such factors as hisattitudes, his adjustment to the condition, theduration of the condition, and his usual activitiesprior to the onset of the condition. The situationmay be further complicated if the respondent hasmore than one chronic condition and is unable todistinguish which one(s) causes his activity limi-tation.
VISUAL IMPAIRMENTS
The visual defects incIuded in this report aredefined according to severity and are divided into“severe visual impairments” and “other visualimpairments. ” Estimates of visual impairmentswere based for the most part on responses to thequestion “Does anyone in the family have serioustrouble seeing with one or both eyes even whenwearing glasses?” (item 2, card B, appendix HI).Information recorded in question 14 and/or tableI of the questionnaire was used to code the degreeof visual loss.
According to the definitions used in this re-port severe visual impairments include amongpersons 6 years of age or older, a visual defectwhich, according to the respondent’s reply, pre-vents his reading ordinary newspaper print evenwhile wearing glasses. Among persons under 6years of age and those who have never learnedto read, a visual impairment is one which wasreported as “blind in lmth eyes” or one for whicha reply indicating no useful vision in either eyewas given. Visual impairments in this class arecoded to XOOof the X-Code (appendix II).
Oth# visual impzinnents include amongpersons 6 years or older, visual difficulties whichare not severe enough to prevent reading ordinarynewspaper print with glasses. For persons whoare under 6 years of age or who cannot read,reports of trouble in seeing but not indicating
3

loss of visionin botheyes are includedinthisclass.impairmentsin thisclassare codedtoXO1-X05 oftheX-Code.
Reportsofcertainconditionssuch as “colorblindness,” refractive errors, and strabismus arenot coded by the Classification of Impairmentsunless there is additional mention of impairedvision in table I and/or question 14 of the ques-tionnaire (appendix III).
Codes XO1-X05 were revised July 1, 1964.At that time, a new code, X03, was added andthe inclusions in XO1, X02, and X05 were changed.The two sets of codes used during July 1963-June1965 are shown in appendix II. With one exception,other visual impairments are grouped together inthis report, making ;t possible to show the com-bined data for the 2-year period. The severevisual impairment code, XOO,was not affected bythe revision.
Only one code in XOO-X05 may be assignedper person. The number of visual impairmentsshown in this report is, therefore, a count ofpersons with visual loss.
It is estimated by the Health Interview Surveythat, during July 1963-June 1965, there was anaverage annual number of about 5.4 million per-sons in the civilian, noninstitutional population ofthe United States who had a visual defect as de-fined above. Of this number, 22.8 percent, or1,227,000 persons, had a severe visual impair-
ment. The remaining 4,163,000 cases are groupedtogether in this report as other visual impair-ments.
In table B the data on visual impairments are ‘shown by X-Code categories. Due to the codingchanges mentioned earlier, the X-Code breakdownis shown for the July 1964-June 1965 period only.The X05 category includes 53.6 percent of allcases of visual impairment and 70.1 percent ofthe cases grouped as other visual impairments.
(-Age and Sex
About one-half (46.4 per;ent) o!all reportedvisual impairments were among persons 65 yearsof age and older. As shown in table 1, the numberof visually impaired persons per 1,000 populationincreased sharply with age. From a rate of 0.6among young people under 25, the rate of severevisual impairments increased to 23.6 among per-sons aged 65-74 and to 97.5 among persons 75years and older. The corresponding rate in-creases for other visual impairments were from6.9 to 77.4 and 131.3.
The rates of visual impairment were similaramong males and females at ages under 65 years.Among persons aged 65 years and over, however,the rates for females were appreciably higherthan those for males.
Table B. Prevalenceand percent distributionof visual impairments, by X-Code cate-gories: United Staees, July 1964-June 1965
INumber Percent Rate per
X-Code categories for visual impairments in distri- 1,000thousands bution population
Impairment of vision (xoo-x05) ---------------- 5,717 100.0 30.3
Visual impairment (XOO)1---------------------------- 1,3;: 23.5Blind in one eye, with impairmentas in X03 XO1)---
[~:;
Blind in one eye, with impairmentas in x05 X02)--- 726 1;:;Visual impairment (X03)2---------------------------- 511 2:7Impaired vision except as in XOO-X03 (X05)---------- 3,065 5::: 16.3
liability to read ordinary newspaper print withno useful vision in either eye.
21nabilityto recognize a friend walking on thevisual difficulty,but not as in XOO-X02.
glasses, and impairmentindicating
other side of the street and other
4

Color
The rate of all visual impairments per 1,000population was slightly greater among nonwhitepersons (32.0) than among white persons (28.4)as shown in table 2. Because the two color groupsdiffer somewhat in age composition (fig. l), thefigures for all ages obscure greater differencesbetween the two groups among persons under 65and among persons 65 years of age and older.In both age groups, the rates among nonwhitepersons were substantially higher for all visualimpairments combined and for severe visual im-pairments. For other visual impairments, how-ever, rates for nonwhite persons were onlyslightly higher than those for white persons.
Etiology
Twelve etiology codes which are applicableonly to visual impairments are provided in theClassification of Impairments (X-Code). One ofthese codes is assigned to each reported visualdefect according to the cause stated by the res-pondent. Coding rules which define preferenceswhen multiple causes were given are shown fol-lowing the list of etiology codes in appendix II.
The codes used for visual impairments onlywere revised July 1, 1964, as listed in appendixH. The etiologic data on visual impairments shownin tables 3 and 4 are for the July 1964-June 1965period only, using the revised codes. Because ofthe small numbers in some of the etiologicclasses, the 12 groups have been combined intoeight etiologic classes as follows:
Etiolo/@c gYOUp
Cataract -----------------------Glaucoma ----------------------Other local eye diseases --------General diseases ---------------
Injury (with any other cause) ---- -Congenital or birth factors ------Other and ill-defined conditions- --Unknown to respondent ----------
Etiologz”ccodes
included2
.1 and .2.3.4
S, .6,.7,and .8
.9
.x
.Y
.0
%ee list in appendix II.
The leading causes of visual impairmentvaried with age as shown in table 3 and figure 2.Among persons under 65 years of age, otherlocal eye diseases and injury were equally im-portant as the major causes of visual defects.Either one or the other of these causes was re-ported by persons in this age group for44 percentof all cases. For persons 65 years and over, onthe other hand, cataracts were reported as thecause of visual impairment in 39.6 percent of allcases—far more frequently than any other cause.Because of their high frequency among olderpersons, cataracts were also the leading cause ofvisual impairments (24.0 percent) among personsof all ages. Although the distribution of cases byetiology was different in the two age groups, therates of visual impairment for persons 65 and overwere greater in every etiologic group.
There was also variation in the distributionof cases among etiologic groups according to thedegree of severity of the impairment (fig. 3).Cataracts, injuries, and other local eye diseaseswere the leading causes of other visual impair-ments, as well as of all visual impairmentscombined. The most frequently reported causes ofsevere visuaI impairments were cataracts, otherlocal eye diseases, and general diseases. Thisreflects the fact that injury was not one of themost important causes of severe visual impair-ment among persons under 65 years of age. Inaddition, persons in both age groups reportedgeneral diseases more frequently as causes ofsevere visual impairment than as causes of othervisual impairment. In both figures 2 and 3 itshould be noted that the cause of visual impair-ment was unknown to the respondent in a rela-tively large percentage of the cases.
Etiologic data by sex are shown in table 4.Injury, reported h 26.9 percent of all cases, wasthe leading cause of visual impairment amongmales; however, only 7.6 percent of the casesamong females were reported as being causedby injury. The causes most frequently reportedby females were cataracts (27.1 percent of allcases) and other local eye diseases (18.0 percent).These causes were also important among males,who reported cataracts for 20.1 percent of thecases and other local eye diseases for 14.0 per-cent of the cases. For all etiologic groups, ex-cept injury and congenital or birth factors, the
5

50 r For each age group,
etiology categories total to 100’percent
4n 1- 7Q. G.-
30
!2(dc1
5a
20
10
0Co foroct
7.6
5.3
Gloucoma Other Iocol
7.4
d!$-
4.2
General diseoses Iniurv. .eye diseose$
ETIOLOGY
AGE IN YEARS
Under 65
NI 65+
I9.5
Congenital or Other and Unknown tobirth factors ill-defined respondent
conditions
Figure 2. Percent distribution of visual impairments, by etiology according to age: July 196Y-June 1965.
40
[
For each severity group,
etiology categories total tolOO percent
I DEGREE OF SEVERITY
Cotoroct
6,65.6
mGlaucoma
170
Other loco!eye diseases
19.2
d
1[.5
5.43.8
General diseoses Injury
ETIOLOGY
Severe visual impairment
N Other visual impairment
20.3
Congenital or Other and Unkn,;wn to
birth foctors ill-defined respondentconditions
Figure 3. Percent distribution of visual impairments, by etlologyaccordlng to degree of severity: July 1964-June 1965,
6

rates for females were higher than the rates formales.
Region
The rate of visual impairments per 1,000population was considerably higher in the SouthRegion than in any other region (table 5). In theSouth Region about 39 persons per 1,000 popula-tion had a visual impairment as defined in thesurvey— a rate which was about 50 percent greaterthan the corresponding rates in the North Centraland West Regions and about 77 percent greaterthan the rate in the Northeast Region. Relativelyhigh rates were found in the South Region for bothsevere defects and other visual impairments, andfor both persons under 65 years of age and per-sons 65 years and older.
Family Income
About 56 percent of all cases of visual im-pairments were among persons with a familyincome of less than $4,000. The high prevalenceof visual defects among persons in the lower in-come groups was influenced by the older age com-position of these population groups as illustratedin figure 1.
The rates of visual impairment among per-sons with a family income of less than $3,000were considerably higher than the rates for anyother income group regardless of age (table 6).Persons with a ‘family income of $3,000-$3,999also had relatively high rates, particularly thoseunder the age of 65. The rates of visual impair-ment did not differ markedly among persons inthe family income groups of $4,000 or more.
Activity Limitation,
About one-fourth of all persons reporting avisual impairment considered themselves limitedin some degree by their vision problem. Data onactivity limitation caused by visual defects arepresented in tables 7 and 8 according to degree ofactivity limitation as defined in appendix II. Whenactivity limitation was reported, it usually in-volved limitation in major activity. Figure 4shows the percent distribution of all cases involv-ing activity limitation by the degree of activitylimitation.
100
80
zgk
~ 60E1-rn=
F-Z
: 40aun
20
0
l-imitation, but not inmajor activity]
Limitation in amount orkind of major activityl
Unable to carry onmojor activityl
Severe visual Other visual
impairments impairments
causing octi vit y causing oct[vity
limit oIiOn limitation
%ajor activity refers to ability to work, kcup hub:, or engagein school or preschool act~.yv{tie.s.
igure 4. Percent distribution of visual impairmentscausing limitation of activity,by degree of limita-tion of activity according to degree of severity.
The percentage of persons reporting activitylimitation varied considerably with the degree ofseverity of the impairment. Activity limitationin some degree was reported for 53.6 percent ofthe persons with severe visual impairment. Forother visual impairments, this figure was only15.1 percent. Of those persons reporting somedegree of activity limitation, 51.5 percent withsevere visual impairments and 23.0 percent withother visual impairments were unable to performtheir major activity as shown in figure 4.
The percent distributions of cases by degreeof activity limitation were similar among malesand females (table 7). A slightly higher percent-age of limiting cases among males (25.6 percent)than among females (22.5 percent) may reflectthe fact that a higher proportion of males have amajor activity outside the home.
7
The percentage of persons whose activitieswere limited by visual impairments generallyincreased with age (table 8). Although the esti-mate was highest (55.2 percent) for persons 65years of age and over, approximately one-halfof the persons with severe visual impairments ineach of the age groups shown in table 8 had somedegree of activity limitation. For other visualimpairments, there was a more marked increasewith age in the percentage of cases causing activ-ity limitation— ranging from 10.2 percent amongpersons under 45 years of age to 19.7 percentamong persons 65 and older.
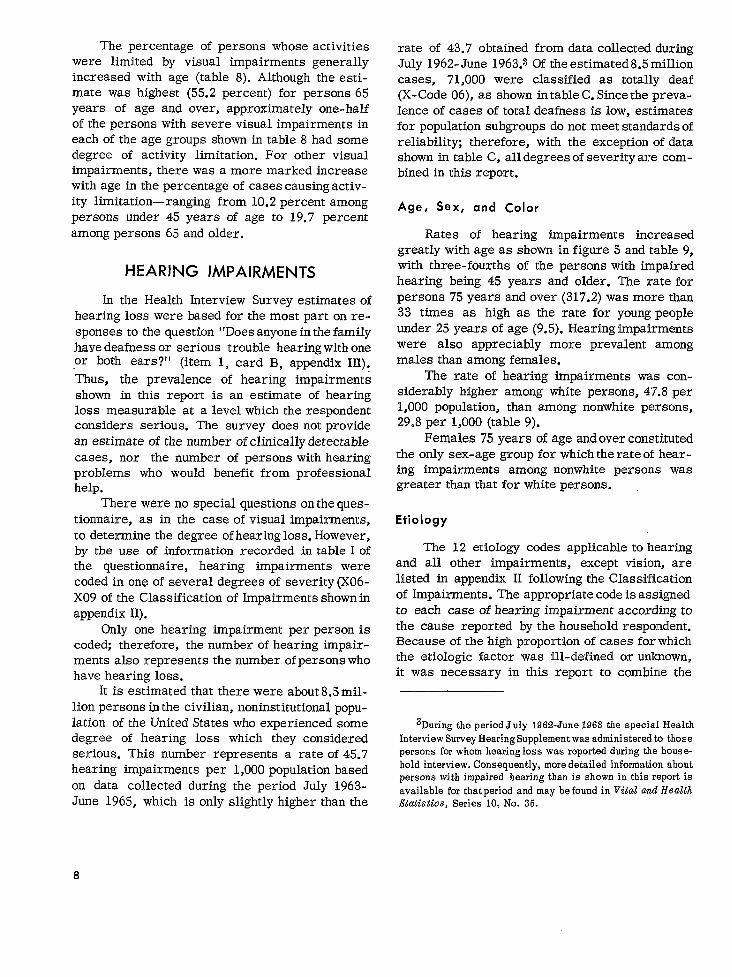
HEARING IMPAIRMENTS
In the Health Interview Survey estimates ofhearing loss were based for the most part on re-sponses to the question “Does anyone in the familyIxaye deafness or serious trouble hearing with oneor both ears?” (item 1, card B, appendix 111):-.Thus, the prevalence of hearing impairmentsshown in this report is an estimate of hearingloss measurable at a level which the respondentconsiders serious. The survey does not providean estimate of the number of clinically detectablecases, nor the number of persons with hearingproblems who would benefit from professionalhelp.
There were no special questions on the ques-tionnaire, as in the case of visual impairments,to determine the degree of hearing loss. However,by the use of information recorded in table I ofthe questionnaire, hearing impairments werecoded in one of several degrees of severity (X06-XO9 of the Classification of Impairments shown inappendix H).
Only one hearing impairment per person iscoded, therefore, the number of hearing impair-ments also represents the number of persons whohave hearing loss.
It is estimated that there were about 8.5 mil-lion persons in the civilian, noninstitutional popu-lation of the United States who experienced somedegree of hearing loss which they consideredserious. This number represents a rate of 45.7hearing impairments per 1,000 population basedon data collected during the period July 1963-June 1965, which is only slightly higher than the
rate of 43.7 obtained from data collected duringJuly 1962-June 1963.8 Of the estimated 8.5 millioncases, 71,000 were classified as totally deaf(X-Code 06), as shown in table C. Since the preva-lence of cases of total deafness is low, estimatesfor population subgroups do not meet standards ofreliabilit~ therefore, with the exception of datashown in table C, all degrees of severity are com-bined in this report.
Age, Sex, and color
Rates of hearing impairments increasedgreatly with age as shown in f igure 5 and table 9,with three-fourths of the persons with impairedhearing being 45 years and older. The rate forpersons 75 years and over (317.2) was more than33 times as high as the rate for young peopleunder 25 years of age (9.5). Hearing impairmentswere also appreciably more prevalent amongmales than among females.
The rate of hearing impairments was con-siderably higher among white persons, 4’7.8 per1,000 population, than among nonwhite persons,29.8 per 1,000 (table 9).
Females 75 years of age and over constitutedthe only sex-age group for which the rate of hear-ing impairments among nonwhite persons wasgreater than that for white persons.
Etiology
The 12 etiology codes applicable to hearingand all other impairments, except vision, arelisted in appendix H following the Classificationof Impairments. The appropriate code is assignedto each case of hearing impairment according to
the cause reported by the household respondent.Because of the high proportion of cases for whichthe etiologic factor was ill-defined or unknown,it was necessary in this report to combirle the
3Duringthe periodJ uly i962-June1963the special HealthInterviewSurveyHearingSupplementwasadministeredto thosepersons forwhom hearing loss was reported during the house-
hold interview. Consequently, more detailed information aboutpersons with impaired hearing than is shown in this report is
available for that period and may be found in Vital ad Hea2thStatistics, Series 10, No. 35.

Table C. Average prevalence and percent distribution of hearing impairments,by X-Codecategories: United States, July 1963-June 1965
I I IAverage Percent Rate per
X-Code categories for hearing impairments number distri-in 1,000
thousandsbution population
Impairment of hearing (x06-x09)--------------- 8,549 100.0 45.7
Deafness, total, both ears; deaf-mutism (x06)------- 0.8 0.4Impaired hearing, severe (X07)---------------------- 2;;Impaired hearing except as in X06,X07 (X09)--------- 8,243 9::; 4:::
NOTE: For complete titles see Classification of Impairments (X-Code), appendix II.
300
zoEasLoa
g 2000_.
Eau1-aa
100
0Both sexes
AGE IN YEARS
■ Under 25
35,,, ❑ 25-44
Mole Femole
SEX—
Fitaure 5.Rate of hear inq impairmentsper 1,CILOPoPu-1ation,bj sexawlage.
original12 categories in four etiologic groups asfollows:
The
Infection(.1,.2, and .3)
Injury (.9)
Other and ill-defined conditions (.4,.5, .6,.7,.8,.X,and.Y)
Unknown to respondent (.0)
numbers inparenthesesaretheetiology codesshown in append-~ II which areincluded ir-eachofthe above groups.The “othera ndill-definedc on-ditions” group includes all cases due to namedcauses other than infectionor injury. It incIudescases said to bedueto “oldage” or describedas“hereditary,” with no specific disease given. Italso includes cases of hearingimpairmentcausedby continued exposure to loud noise.
Infection was reported as the cause ofhear-ing impairments in 20.5 percent of all cases(table 10). In 34.6 percent ofall cases, causesinthe group of other and ill-defined conditionswere given. Of the 2,956,000 cases in this group,2,583,000, or 30.2 percent of all cases, werereportedas beingcausedby ill-definedconditions(etiology code.Y) .Nocause ofany kindwas givenfor37.3 percent of all hearing impairments. Thisindicates that, generally, respondentswereunableto give specific causes for their hearing impair-ments.
9

Figure 6 illustrates the percent distributionof cases by etiologic group according toage. Thepercent of cases said to be due to infection orinjury decreased as age increased, while thepercent caused by other and ill-defined or un-known conditions increased with age. The ratesfor each etiologic group increased with age and,except for infection, were higher among malesthan among females.
In table 10, the etiologic class of congenitalor birth factors was included with other and ill-defined conditions because of the small number ofcases reported as being caused by these factors.Among persons under 45 years of age, however,congenital or birth factors were reported as thecause of hearing impairments in 163,000 cases,or 7.5 percent of all cases. This means that 1.2cases of hearing impairment per 1,000 personsunder 45 years were reported with congenitalor birth factors as the cause.
Region
Comparative data on hearing impairments byregion are presented in table 11. The rates forthe Northeast Region were lower than the ratesfor any of the other regions in every age-sexgroup shown. The highest rates were found in theSouth and West Regions. The percent distributionsof cases by age were quite similar for the regions.
Family Income.
Among persons under 65 years of age, thosewith a family income of less than $3,000 had arelatively high rate of hearing impairment (table12). For persons with higher incomes, therewere only slight differences between the ratesof hearing loss. Both males and females under 65years had similar trends in rates by incomegroups.
Greater differences between income groupswere found for persons 65 years of age and olderthan for younger persons. Among older persons,the rate of hearing impairment decreased steadilyfrom 242.5 per 1,000 persons with a family in-come of less than $3,000 to 173.3 per 1,000 per-sons with a family income of $7,000-$9,999. Therate then increased to 190.4 for persons with afamily income of $10,OOOor more. While a similar
For each age group,
50 Tetiology categories total to 100 percen
1.AGE IN YEARS
- under 4’5
~ 45-6440
m 65+
“
30
20
10
0
Figure 6. Percent distribution of hearing impairments,
11.3
Infection Injury
42.6.40.5 m
Other andIll-defined respondentconditions
ETIOLOGY
by et i 01 ogy according to age,
pattern was observed for males, the rate for fe-males decreased through the $4,000-$6,999 in-come interval and increased thereafter.
Activity Limitation
Very little activity limitation was associatedwith hearing impairments. About 95 percent ofthe persons with hearing loss reported no activit ylimitation of any kind because of this impair-ment. This figure was fairly consistent amongvarious age-sex groups as shown in table 13.
SPEECH IMPAIRMENTS
Speech impairments include stammering,stuttering, absence of larynx, speech or voicedefects resulting from surgery or other causes,and other or ill-defined “trouble” with speech.They are classified in categories X1O and Xll ofthe X-Code. Cases of deaf -mutism, which arecoded only as a hearing impairment, and cases
10

of speech defects due to cleft palate are not in-cluded as speech impairments. Only one speechdefect iscoded per person.
It is estimated that, during the period July1963-June 1965, an average annual number of1,298,000 persons hada speech defect—a rate of6.9 per 1,000 population. Of this number, 17.3percent, or 225,000 speech defects, were de-scribed as stammering or stuttering. The re-maining 82.7 percent were classified as otherspeech impairments.
Age, Sex, and Color
It can be seen from table D that more thanone-half (53.5 percent) of all reported speech de-fects were among children under 17 years of age,and 62.3 percent were among males.
For each of the age groups shown in table D,the rate of speech defects among males wasgreater than that among females. Children 6-16years of age had the highest rates of speech de-fects— 17.3 per 1,000 population among boys and8.7 among girls. However, it is quite possiblethat speech defects among younger children are
underestimated because a defect of this kind maynot be detected until the child enters school.Among adults, the rate of speech defects was
comparatively high for persons 65 years of ageand older primarily due to vascular lesions af-fecting the central nervous system.
The rate of speech defects among nonwhitepersons (10.2 per 1,000 population) was about 57percent higher than the rate among white persons(6.5). The rates for nonwhite persons were higherfor both males and females as shown in table 14.
Etiology
Physical diseases and injuries were reportedinfrequently as the causes of speech defects,particularly among younger people. The only de-fined cause of much importance among personsunder 45 years of age was congenital or birthfactors which were reported in 11.1 percent ofthe cases (table 15). In 36.8 percent of the casesamong younger persons no cause was given, andother and ill-defined conditions were reported asthe cause in about one-half of the cases. Mostof the 512,000 cases assigned to other and ill-defined cause s440,000 defects—were classifiedin an etiology code which would include casessaid to be caused by emotional or environmentalfactors (etiology code .Y in appendix II).
A large percentage (45.6 percent) of thecases among persons 45 years of age and olderwere caused by vascular lesions affecting thecent ral nervous system. No cause was stated inonly 13.1 percent of the cases among older per-sons.
Table D. Average prevalence of speech defects, by sex and age: United States, July1963-June 1965
Age
All ages ----------------------------
Under 6 years -----------------------------6-16 years --------------------------------17-24 years -------------------------------25-44 years -------------------------------45-64 years -------------------------------65 years and over -------------------------
Both Male Ferns lesexes
Average numberin thousands
=~
156539 3:; 1%137 82 55168 69148 ;: 59151 77 74
Ii I
Bothsexes Male Female
II I
Rate per 1,000population
%lt%t%6.6 8.5 5.03.7 $;
N;:; 10:2 7.7
11

Region
The rate of speech defects varied from 4.7per 1,000 population in the Northeast Region to9.1 in the South Region. These two regions hadthe lowest and highest rates, respectively, forall age-sex groups (table 16). The relativelyhigh rates in the South Region may reflect thehigh rates observed for the nonwhite population.
In every region, the rate for males was higherthan the rate for females and the rate for childrenwas higher than that for adults. The rate for fe-males in the South Region (6.7), however, wasslightly higher than the rate for males in theNortheast Region (6.4), reflecting the compara-tively high prevalence in the South Region.
Family Income
As family income increased from, less than$3,000 to $10,000 or more, the rate of speechdisorders among children under 17 years of agedecreased from 15.2 to 8.0 per 1,000 population(table 17). Among older persons, the correspond-ing decrease in rates was from 8.8 to 3.2.
Activity Limitation
Only about 20 percent of all persons with,speech disorders considered their activity limitedby this condition (table 18). Among persons 45years of age and older, however, limitation inusual activities “wasassociated with 36.9 percentof the cases. When activity limitation was re-ported, it usually involved limitation in majoractivity. Among persons under 45, 89.5 percentof the limiting cases shown in table 18 involvedthe major activity, while among older persons,94.5 percent of the cases were limiting to thisdegree. It is possible that, in some cases, thereported activity limitation was a residual effectof the underlying condition, such as stroke orcerebral palsy, that caused the speech impair-ment rather than of the speech disorder itself.
PARALYSIS, COMPLETE OR PARTIAL
Cases of residual paralysis, of all types anddegrees, which have continuedmonths ‘after the initial attack
12
for at least 3are included in
this report. The y are classified in the categoriesX40-X69 of the Classification of Impairments,according to the parts of the body affected andwhether the loss of musc}e function is completeor partial. Cases of paralysis agitans or Parkin-son’s disease are excluded.
It is estimated that the average annual preva-lence of paralysis in the noninstitutional popula-tion of the United States during the period July1963-June 1965 was 1,516,000 cases—a rate of8.1 per 1,000 population. This estimate also rep-resents the number of persons with paralysissince only one code in categories X40-X69 may,according to coding procedures, be assigned per”person.
The 1,516,000 cases of paralysis were classi-fied by X-Codes as shown in table E. In two in-stances codes for similar conditions have beencombined to obtain figures large enough to meetstandards of reliability y. About two-thirds of theestimated cases (67. 1 percent) involved eithercerebral palsy or partial paralysis of the ex-tremities and trunk (X50-X59). With the exceptionof the material shown in table E, all types, sites,and degrees of paralysis have been combined inthis report, since the prevalence of specifictypes of paralysis are low.
Age, Sex, and Color
The number of cases of paralysis per 1,000population was about seven times as great amongpersons 65 and older (26.8) as it was amongpersons under 25 years of age (3.8). (Seethe datafor all regions in table 22.) Between the 45-64-year and the 65-years-and-over age groups therate increased sharply—from 10.8 to 26.8,, Simi-lar increases in rates with age were found amongboth males and females. The rate for males,however, was greater than that for females, re-gardless of age.
As shown in table 19, the rate of all cases ofparalysis was slightly greater among white per-sons (8.2 per 1,000 population) than among non- “white persons (7.2 per 1,000 population). Non-white persons aged 45 years and over, however,———experienced a substantially higher rate-of paral-ysis than white persons of the sarn_e ages. Amongolder persons the rate for nonwhite persons was22.0, while the rate for white persons was 15.2. ~

Table E. Average Prevalence and percent distribution of cases of Paralvsfs. bv X-Code.,.-.categories:U=ited States, July 1963-June 1965”
-X-Code categories for paralysis
Paralysis (x40-X69)---------------------------------
Paralysis NOS (complete)of extremities and trunk
Upper extremity(ies),except finger(s) only (X40), (X41)--Finger(s) only (x42)--------------------------------------Lower extremi.ty(ies),except toe(s) only (X43)------------Paraplegia (x44), (x46)-----------------------------------Toes only (X45)-------------------------------------------Hemiplegia (X47)------------------------------------------Quadri,plegi,a(x48)----------------------------------------Other sites (x49)-----------------------------------------
Cerebral palsy; paralysis, partia1ok extremitiesand trunk
Cerebral palsy (and synonyms) (X50)-----------------------Partial paralysis, arm(s) or finger(s) (X51)--------------Partial paralysis, leg(s), any part(s’)_(X52)--------------partial paralysis, one side of body(X53)------------------Parti,alparalysis, other sites (x54):---------------------Parti,alparalysis, palsy, paresis—NOS (X59)--------------
Paralysis, complete or partial sitesexcept extremitiesand trunk
Paralysis, face (x60)-------------------------------------Paralysis, bladder or anal sphincter (x61)----------------Paralysis, other sites (x69)------------------------------
Averagenumberinthou-sands
1.516
5:
6181
14;35*
15012333520515550
79**
Percentdistri-bution
100.0
3.4
4.:5.3
9.;2.3*
:::22.113.510.23.3
5.2**
Rate per1,000popu-lation
8.1
0.3
0.:0.4
0.:0.2*
0.8:.;.
:::0.3
0.4**
NOTE: For complete titles see Classification of Impairments (X-Code), appendix II.
Among bothwhiteandnonwhitepersonstherateofparalysiswas greaterformalesthanforfe-males.
Etiology
Almost 85 percentof allcasesofparalysiswere attributedtopoliomyelitis,vascularlesionsaffectingthecentralnervoussystem,injury,orcongenitalor birthfactors.Causes otherthanthesefourwere giveninonly8.2percentofthecases,The respondentwas unableto reportacausein7.3percentofthecases.
The frequencyatwere reportedvaried
whichthedifferentcausesconsiderablywithage as
shown intable20 and figure7.Among personsunder45years ofagetheleadingcausesofparal-ysis were poliomyelitis,reportedas th~cause——..in45.6percentofthecases,and congenitalorbirthfactors,reportedas thecausein24.8per-centof thc$cases.Vascularlesionsaffectingthecentralnervoussystem,reportedinfrequentlybyyoungerpersons,were thecausein56.3percentof thecasesamong persons45 yearsandover.Despitethedifferencesbemveenthetwoagegroupsinthedistributionofcasesby cause,therateforolderpersonswas higherthanthatforyoungerpersonsineveryetiologicgroupexceptcongenitalor birthfactors.
13

For ,mh .Q. group,alolo’w COtagori,, 1,,01 ,0 100 P,rce”f
60 ~ m, ,. ,,.. s
50
40
20
10
0Pdmy,l(tl.
563
vascularl,s10 ”,, I“[”ryC4”lml .Or.,.s
,Y,l,m
■ --”--U“e.,45
Zz “5+
248
LaI 84
*
CmQmll.al 0, Other andbirth 10CI..S ,114011”.8
COndllloos
ETIoLOGY
Figure 7. Percent of cases of paralysis, by age andet i01ogy.
The distributions of cases by cause were sim-ilar among males and females (table 21). Males,however, reported injury more than twice as fre-quently as females (12.4 percent compared with5.6 percent of the cases). The majority of thecases in both groups were caused by either vas-cular lesions affecting the central nervous systemor poliomyelitis.
Region
The rate of all cases of paralysis variedfrom a low of 7.1 per 1,000 population in theNortheast Region to a high of 9.2 in the SouthRegion (table 22). The rate for persons 65 yearsand over was particularly high in the SouthRegion— 36.9 per 1,000 persons, compared withthe next highest rate of 24,5 in the North CentralRegion. In each region, the rate was higher formales than for females.
Family “Income
Among persons under 45 years of age, therates of cases of paralysis did not differ markedlyamong income groups. In this age group the high-est rate (5.4 per 1,000 population) was amongpersons with a family income of less than $3,000,while the lowest rate (4.0) was among persons witha family income of $3,000-$3,999 (table 23).
Among persons 45 years of age and older, how-ever, the rate of cases of paralysis decreasedsteadily with increasing income. The rate of 25.4cases per 1,000 population among older personswith a family income of less than $3,000 wasabout three times as high as the rate (8.4) amongolder persons with a family income of $10,000or more.
Activity Limitation
In 60.9 percent of all cases, persons withparalysis considered themselves limited in theiractivity (table 24). When activity limitation wasreported, it usually involved limitation in majoractivity. As shown in the table, 53.1 percent ofthe cases either prevented the paralyzed person’sperforming his major activity or limited him in;he amoun~ or kind of major activity.
100 -
80
z~+~ 60 -
z!-Ina+z: 40 -wa
20 -
o—
Limitation, but not inmajor octivity]
Limitation in amount orkind of major activityl
Unable to carry onmajor octivityl
Under 45 45-64 65+
AGE IN YEARS
lMajor activity refers to ability to work, keep house, or engagein school or preschool activities.
Figure 8. Percent d i str i bution of cases of paralysis
causing 1imitation of activity, by degree of I imita-
tion of activity according to age.
14

Of thecasesofparalysiscausinglimitationofactivity,theproportioninwhichthepersonwasunableto carryon hismajor activityincreasedwithage—from 26.6percentamongpersonsunder45 yearsto 70.3percentamong those65yearsand older(fig.8).
ABSENCE OF EXTREMITIES
In thisreportestimatesofmissingextremi-tiesareshownforbothmajorandminorextremi-ties.Absenceofmajorextremitiesincludescasesoflossofleg,foot,arm,orhandwhichareclassi-fiedas X20-X24,X26-X30,X32, and X33 intheClassificationof Impairments.Cases of lossofminor extremities(finger(s)or toe(s)only)areclassifiedby theX-Code categoriesX25, X31,andX34.
Of theestimated1,968,000casesofabsenceof extremities,only257,000were casesoflossof major extremities.The rate of absenceofmajor extremitieswas 1.4per 1,000populationandtherateofabsenceoffinger(s)or toe(s)onlywas 9.1.
The classificationofcasesofabsenceofex-tremitiesbyX-Codes isshown intableF.In61.5percentofthecasesofabsenceofmajorextremi-tiesthelossof a leg(s)was involved.Missingfinger(s)was reportedin 85.5percentof thecasesofabsenceofminorextremities.
Selected Characteristics
Most impairmentsofthistype-86.4percentofthecasesinvolvingmajor extremitiesand82.7percentof thecasesinvolvingfinger(s)or toe(s)only-were among males (table25).Becauseof
Table F. Average prevalence and percent distribution of cases of absence of extremi-ties, by X-Code categories:United States, July 1963-June 1965
X-Code categories for absence of extremities
Major extremi.ties(x20-x2.4), (x26-X30), (x32), (X33)-----------
U per extremity (X20-X24)-----------------------YArm(s (X20-X22)------------------------------------
Arm, at or above elbow, and arm NOS (X20)---------Arm, below elbow and above wrist (X21)------------Arms, both (X22).--------------------,-..------------
Hand(~)lexcept digits only (X23), (X24)------------Lower”extremi.ty(x26-x30)-----------------------
Leg(s) (x26-x28)------------------------------------Leg, at or above knee, and leg NOS (x26)----------Leg, below knee and above ankle (X27)-------------Le s, both (X28)----------------------------------
fFoot feet), except toe(s) only (X29), (X30)---------Upper and lower extremities (X32), (X33)--------
Minor extremities (x25), (X31), (X34)---------
Fin er(s) and/or thumb(s) (X25)---------------------7Toe s) only (X31)-----------------------------------
Finger(s) and/or thumb(s) and toe(s) (X34)----------
Averagenumber
inthousands
257
815237***
***
1,712
1,463237*
Percentdistri-bution
100.0
31.520.214.4
**
68.;61.530.424.9
***
100.0
85.513.:
Rate per1,000
population
1.6
***
0.90.80.40.3
***
9.1
7.81.3*
NOTE: For complete titles see Classificationof Impairments (X-Code),appendix II.
15

Table G. Average prevalence and percent distribution of cases of absence of extremi-ties among both sexes and among males, by age: United States, July 1963-June 1965
Sex and age
Both sexes
All ages----
Under 25 years----25-44 years -------45-64 years -------65 years and over-
Male
All ages----
Under 25 years----25-44 years -------45-64 years -------65 years and over-
Absence ofmajor extremities
Averagenumber
inthousands
257
5;105
79
222
4’;9462
Percentdistri-bution
100.0
19.:$.;
.
100.0
21.;42.327.9
Rate per1,000
population
1.4
1.:
:::
2.4
Absence offinger(s) or toe(s)
Averagenumber
inthousands
1,712
178460691383
1,416
123387590316
Percentdistri-bution
100.0
;;.;
40:422.4
100.0
2%;41.722.3
Rate per1,000
population
9.1
2.110.218.222.3
15.6
2.817.932.341.7
rates for males were considerably higher thanthe combined rates for both sexes (table G). Therate of cases of absence of extremities, bothmajor and minor, increased steadily withage.
The rate of all cases ofabsence ofextremi-ties was higher among white persons (10.7) thanamong nonwhite persons (9.l)asshownin table25.However, the rate for nonwhite persons washigher for cases of loss of major extremities,while the rate for white persons was somewhathigher for cases of lossoffinger(s) ortoe(s) only.
The number of cases of absence of major
extremities per 1,000 persons was small in allregions, varying from 1.0 in the West Region to1.5 inthe North Central and South Regions (table25). The rateof absence offinger(s) ortoe(s) onlyvaried *from a low of 7.4 in the Northeast Regionto a high of 10.5 in the North Central Region.
The rate of cases of absence of extremities,both major and minor, decreased with increasingfamily income. This was true both among per-sons under 65 years of age and amongpersons 65and older (table 26).
the small number of cases among females, the Etiology
Loss of extremities usually resulted fromaninjury. As shown in table 27, injury was reportedas the cause in 70.8 percent of the cases involv-ing major extremities and 92.4 percent of thecases involving finger(s) or toe(s) only. Othercauses, including infection, gangrene, and neo-plasms, were reported more frequently byolderpersons than by younger persons. For cases in-volving major extremities, causes other than in-
jury were given by24.2 percent ofpersons under65 years of age and by 40.5 percent ofthose65and older.
Activity Limitation
A high percentage (61.1percent) ofpersons
whohadamis sing major extremity (one or more)considered themselves limitedto some degree intheir usual activities (table 28). Of the 157,000persons who attributed actiyity limitation to thistype of impairment, 63,000 (or 40.1 percent) wereunable to perform their major activity, and an ad-
16

ditional 74,000 (or 47.1 percent) were limited inthe amount or kind of their major activity. It issignificant to note, however, that about one-halfof the persons under 45 years of age and aboutone-third of the older persons with this type ofimpairment had adjusted to their condition to theextent that they did not consider it limiting.
Loss of finger(s) or toe(s) only was not usuallya limiting condition. No activity limitation of anykind was reported in 95.3 percent of these casesamong persons under 45 years of age and in 96.3percent of these cases among older persons.
IMPAIRMENTS
And Absencel)
AND
(Except Paralysis
OF LIMBS, BACK,
TRUNK
This large group of impairments, which arereferred to in the text of this report as “orthopedicdefects ,“ consists of those defects which areclassified in categories X70-X89 of the Classifi-cation of Impairments (see appendix II). Ill-de-fined chronic difficulties described in terms suchas “stiffness, “ “wealaess,” “pain,” “trouble,”“spasms,” and “swelling” and involving muscles,joints, limbs, back, or trunk are classified incategories X70-X79 according to the site. Thesecategories also include reports of old strains.sprains, and dislocations of these sites. Cate-gories X80-X89 include curvature of the spine,clubfoot, and other specified structural deformi-ties of the limbs, back, and trunk.
In addition to cases of paralysis and absenceof extremities, all conditions pertaining to dis-placement of intervertebral discs are excludedfrom X70-X89. Ill-defined reports of “trouble”of these sites, if due to arthritis or other activechronic disease, are coded only to the diseaseand are not assigned an X-Code. Disfigurementof the face and deviations from normal size,weight, or height are also excluded.
The totals shown for orthopedic defects arecounts of conditions only, since it is possible fora person to be classified in more than one of thecategories X70-X89. Therefore, unlike the esti-mates for the other impairment groups shown inthis report, the numbercannot be interpreted aswith orthopedic defects.
of orthopedic defectsthe number of persons
Estimates of orthopedic defects are shownin this report for four subgroups by site as wellas for all sites combined. The four subgroups andthe X-Codes included in each are:
(a)
(b)
(c)
(d)
Back or spine only (X70-X72, X80, andX81)
Upper extremities and shoulders, but noother site (X73, X74, and X86-X88)
Lower extremities only, or hip(s) withany other site (X75-X77 and X82-X85)
Multiple sites not involving the hip andnot elsewhere classified (NEC), and sitesnot classifiable in (a), (b), or (c), suchas chest or ribs (X78, X79, and X89)
For the period July 1963- June 1965 it is esti-mated by the survey that the average annual prev-alence of orthopedic defects was 17,742,000 --a rate of 94.8 per 1,000 population. About three-fourths of all orthopedic defects involved eitherthe back or spine or the lower extremity and hip.
Data on orthopedic defects by X-Code classi-fications, grouped by site, are shown in table H.The largest single category was X70-ill-definedback and spine conditions—in which 27.4 percentof all orthopedic defects and 75.1 percent of backor spine defects were classified. Except in tableH, estimates of orthopedic impairments areshown only for the four major subgroups listedabove.
Age and Sex
The rate of orthopedic impairments per 1,000population increased considerably with age asshown in table 29. While this higher prevalence oforthopedic defects with advancing age was charac-teristic of defects involving the upper extremity,the lower extremity, and other or multiple sites,the rates for back or spine defects were verysimilar in age groups over 24 years.
The sites for which orthopedic defects weremost frequently reported varied with age as illus-trated in figure 9. Among children under 17 yearsof age, orthopedic impairments affecting the lowerextremity and hip were reported far more fre-quently than other types of orthopedic defects.
17

Table H. Average prevalenceand percent distributionof impairments (exceptparalysis.and absence) of limbs, back, and trunk, by X-Code categories according to site:United States, July 1963-June 1965 ‘ -
Site and X-Code categoriesfor impairmentsof limbs, back, and trunk
Back or spine (X70-X7~),(x80), (x81.x)--------
Back NOS, spine NOS, vertebra NOS (X70)-------------Cervical or thoracic region (X71)-------------------Coccygeal region (X72)------------------------------Structuraldeformities of spine (x80)---------------Spina bifida (x81.x)--------------------------------
Upper extremity and shoulder (x73), (x74),(x86-x88)------------------------------------
Shoulder and arm above wrists (x73)-----------------Wrist, hand, finger, thumb (X74)--------------------Deformity, neck or shoulder (X86)-------------------Deformity,finger(s),thumb(s) (X87) --------------&Deformity,upper extremity(ies)(X88)---------------
Lower extremity and hip (X75-X77),(X82-X85)--
Hip and/or pelvis(withany other site in X70-X79)(x75)--------------------------------------------.-
Knee, leg NOS (x76)---------------------------------Ankle, foot, toe (X77)------------------------------Flatfoot (x82)--------------------------------------Clubfoot (x83)--------------------------------------Deformity, lower extremity(ies)(X84)---------------Deformity, hip and/or pelvis (X85)------------------
Other and multiple, NEC (X78), (X79), (x89)---
Multiple sites, NEC (X78)---------------------------Other and ill-definedsites (X79)-------------------Deformity, trunk bones, NEC (x89)-------------------
Averagenumberin
thousands
6,486
4,868868126604ft
2,925
1,1611,040
42391290
6,623
7562,8531,544272130936133
1,709
1,34631647
Percentclistri-bution
100.0
75.113.4
;::*
100.0
39.735.61.413.49.9
100.0
11.443.123.34.12.014.12.0
100.0
78.818.52.8
Rate per1,000
population
34.7
26.04.60.73.2*
15.6——
:::0.2
;:;
35.4
7.2
M
NOTE: For complete titles see Classificationof Impairments (X-Code),appendix 11,
Among persons17 yearsand older,orthopedicimpairmentsmost frequentlyaffectedeitherthebackorspine,or thelowerextremityandhip.
Orthopedicdefectsof each sitewere moreprevalentamong males thanamong females.Byage,however,therewasvariationinthisrelation-ship.Ingeneral,theratesformalesweregreaterthanthoseforfemalesamong personsundertheage of65.Among persons65 years of ageandolder,however, the rates for femalesweregreaterforeachofthefoursubgroups.
Color
The overallrateof orthopedicdefectsper1,000populationwas greateramong whiteper-sons (96.5) thanamong nonwhitepersons(82.4)as shown intable30.The rateforwhitepersonswas alsohigherforeverysiteexceptotherormultiplesites.The greatestdifferencebetween
thetwo groupswas intheratesofbackor spinedefectsforwhichtherateforwhitepersonswas36.0,whiletheratefornonwhitepersonswas24.6.
18

—
u’.,,
.0 ~, ?1‘$: $
f,.
‘j
20 891I
,,0 ,,,
m
o rII. .
““d,,,, ,,.2. . . . . . .,.,. .*. -
“’‘“ ‘!!!~
Figure 9. Percent d i str ibut ion of impairments (except paral YSis and absence), by site according to age. “
By age, rates among white persons werehigher only among persons under 45 years of age.At older ages, nonwhite persons had a higherrate of orthop~dic impairment of each site.
Etiology
The etiology of orthopedic defects is shownin table 31 by age and in table 32 by sex. Injury,reported in 69 percent of all cases, was by farthe most important cause of orthopedic defects.By site, the percentage of cases caused by injuryvaried from 56.9 percent of back or spine defectsto 83.6 percent of defects of the upper extremityand shoulder. By age, it varied from 60.1 percentamong persons under 25 to 72.1 percent amongpersons 25-44 years of age. Injury was reportedas the cause of 73.0 percent of all cases amongmales and 64.4 percent of all cases among fe-males.
Among persons under 25 years of age therewas another important cause— congenital or birth
factors. Although only 6.4 percent of all caseswere caused by congenital or birth factors, 20.8percent of the cases among young people wereattributed to these factors.
Other causes, including ill-defined condi-tions, were reported for only 10.2 percent of allcases. In 14.4 percent of the cases the cause wasunknown to the respondent.
In figure 9 it was illustrated that the sitesmost frequently affected by orthopedic defectsvaried with age. This is reflected in table 31 bythe relatively high prevalence of residual defectsresulting from injury to these sites. In additionto injury, congenital or birth factors were alsoreported most frequently as the cause of casesinvolving the lower extremity and hip among youngpeople under 25 years of age. While the prevalenceof orthopedic defects caused by injury was highfor impairments Mb of the back or spine andof the lower extremity and hip among persons25 years and older, the prevalence of cases re-sulting from other and unknown causes was higher
19

for back or spine defects. Among persons 65years and older, however, residual impairmentsresulting from fracture of the pelvis probably con-tributed to the particularly high prevalence oforthopedic defects involving the lower extremityand hip.
Region
Im the West Region there were 110.4 ortho-pedic defects per 1,000 population—a rate whichwas about 43 percent higher than the rate of 77.3in the Northeast Region (table 33). The ratesin the North Central and South Regions—97. 1and 98.7, respectively—were also substantiallygreater than the rate in the Northeast. The preva-lence of orthopedic defects was lowest in theNortheast Region, not only for all cases combined,but also for each site by age. The distributionsof orthopedic defects by site were similar in eachregion.
Family Income
Persons under 65 years of age with a familyincome of less than $3,000 experienced relativelyhigh rates of orthopedic defects of each site (table34). At higher incomes there were only slightdifferences among the rates for persons of theseages. For persons under 65, the rate of all casesdropped from 113.1 among persons with an incomeof less than $3,000 to 85.8 among persons with anincome of $3,000-$3,999 and to 80.5 among per-sons with an income of $10,000 or more.
Among persons 65 years and over, there wasa more marked decrease in the prevalence oforthopedic impairments with increasing familyincome. The rate decreased from 224.4 per 1,000population among older persons with a familyincome of less than $3,000 to 127.4 among thosewith a family income of $10,000 or more.
Activity Limitation
The percentage of cases causing activitylimitation varied with age and with the part of thebody affected. As shown in table 35, persons 65years and older reported activity limitation in33.8 percent of all cases, while younger personsreported limitation in 20.5 percent of all cases.
Among persons under 65 years of age, an ortho-pedic defect prevented the impaired person’s per-forming his major activity in only 1.6 percent ofall cases. When activity limitation was associatedwith orthopedic impairment, persons of all agesreported limitation in amount or kind of majoractivity for about 60 percent of the limiting cases.
Activity limitation was reported most fre-quently for those defects involving other ormultiple sites— in 31.5 percent of the’ casesamong persons under 65 years of age and in 40.0percent of the cases among older persons. Or-thopedic defects of the upper extremity andshoulder caused limitation of activity in only 12.3percent of the cases among younger persons andin 19.6 percent of the cases among persons 65years and older.
INCREASED PREVALENCE OF
IMPAIRMENTS
With the exception of speech defects and ab-sence of extremities, there has been, a markedincrease in the prevalence estimates for all typesof impairments produced by the Health InterviewSurvey since the first year of data collection dur-ing July 1957- June 1958 (table J). While somepart of this increase represents an actual increasein the occurrence of impairments, there are otherfactors related to data collection and processingwhich have contributed to overall changes in theprevalence rates.
(1) During the course of the survey, therehas been a continuing attempt to improve col-lection methods and techniques. Although the con-tent of the basic questionnaire has not changedappreciably since the beginning of the surveythere has been considerable revision from yearto year in the wording and format of the questions.These changes have improved the quality andcompleteness of the collected material but havereduced its value for purposes of trend analysis.
(2) The cumulative experience in collectiontechniques on the part of the interviewers tendstoward the collection of more complete data asthe survey progresses. Improvements in trainingmethods and in the quality control of the dataalso influence the completeness of the reporteddata.
20

Table J. Rate per 1,000 population of selected impairments:United States, July 1957-June 1958, July 1959-June 1961, and July 1963-June 1965
Impairment
All visual impairments----------------------------Severe visual impairments-----------------------Other visual impairments------------------------
Hearing impairments-------------------------------Speech defects------------------------------------Paralysis, complete or partial--------------------Absence of major extremi-ti.es----------------------Absence of finger(s) or toe(s) only---------------Other impairmentsof limbs, back, trunk,all sites-
/ Rate per 1,000 population
18.0
1;:;34.66.55.6
;:;58.6
19.85.614.23;.;
5:41.5---74.9
28.8
2::;45.76.98.1
;::94.8
lU.S. National Health Survey, “Impairmentsby type, sex, and age, United States,July 1957-June 1958,” Health Statistics, PHS Pub. No. 584-B9, Public Health Servi-ce,Washington,U.S. Government Printing Office, Apr. 1959.
2U.S. National Health Survey, I!Selectedimpairmentsby etiology and activi-tYlimita-
tion, United States, July 1959-J?me 1961,” Health Statistics, PHS Pub. No. 584-B35,Public Health Service, Washington, U.S. Government Printing Office, July 1962.
(3)The processingofthecollecteddatahasalsobeenimproved.To insureaccuratecodingofthe materialcontainedin completedquestion-naires,codinginstructionswere clarifiedfromtime to time. Complete tabulationof reportedconditionsdependson accuratecodingof theseconditions.
(4)Sincethe estimatesare hssedon infer-mationobtainedinasample surveyofhouseholdrespondentsthey are subjectto qualificationsdiscussedat thebeginningofthereport.Aswaspointedout,theinformationobtainedfromhouse-
holdinterviewsdependson therespondent‘willi-ngness and abilityto answer questions.Thechangesin collectionmethods havebeenpartofa continuingefforttoobtainascompleteandac-curateinformationas possiblefrom householdrespondents—thesourceofthedataproducedbythe survey and thereforethe basic sourceofchangesinestimatedprevalenceofimpairments.
While thislistisnotexhaustive,itpointsoutwhatareconsideredtohethemajor areasre-sponsibleforvariationsover time intheesti-mated prevalenceofimpairments.
o
.
..
00
21

DETAILED TABLES
Table 1.
2.
3.
4.
5.
6.
7.
8.
9.
10.
11.
12.
13.
14.
15.
16.
L7.
18.
VISUAL IMPAIRMENTS
Average prevalence and percent distribution of visual impairments,by age accord-ing to sex: United States, July 1963-June 1965----------------------------------
Average prevalence and percent distribution of visual impairments,by age accord-ing to color: United States, July 1963-June 1965--------------------------------
Prevalence and percent distribution of visual impairments, by etiology accordingto age: United States, July 1964-June 1965--------------------------------------
Prevalence and percent distribution of visual impairments, by etiology accordingto sex: United States, July 1964-June 1965--------------------------- -----------
Average prevalence and percent distribution of visual impairments,by age accord-ing to geographic regipn: United States, July 1963-June 1965--------------------
Average prevalence and percent distribution of visual impairments, by family in-come according to age: United States, July 1963-June 1965-----------------------
Average prevalence and percent distribution of visual impairments, by degree oflimitation of activity according to sex: United States, July 1963-June 1965-----
Average prevalence and percent distribution of visual impairments, by degree oflimitation of activity according to age: United States, July 1963-June 1965-----
HFARING IMPAIRMENTS
Average prevalence and percent distribution of hearing impairments, by age ac-cording to color and sex: United States, July 1963-June 1965--------------------
Average prevalence and percent distribution of hearing impairments, by etiologyaccording to sex and age: United States, July 1963-June 1965--------------------
Average prevalence and percent distribution of hearing impairments, by age ac-cording to sex and geographic region: United States, July 1963-June 1965--------
Average prevalence and percent distribution of hearing impairments,by family in-come according to age and sex: United States9 July 1963-June 1965---------------
Average prevalence and percent distribution of hearing impairments, by degree oflimitation of activity according to sex and age: United States, July 1963-June l965-----------------------------------------------------------------------
SPEECH DEFECTS
Average’prevalence and percent distribution of speech defects, by age accordingto color and sex: United States, July 1963-June 1965----------------------------
Average prevalence and percent distribution of speech ’defects, by etiology ac-cording to age: United States, July 1963-June 1965------------------------------
Average prevalence and percent distribution of speech defects, by age accordingto sex and geographic region: United States, July 1963-June 1965----------------
Average prevalence and percent distribution of speech defects, by family incomeaccording to age: United States, July 1963-June 1965----------------------------
Average prevalence and percent distribution of speech defects, by limitation ofactivity according to sex and age: United States, July 1963-June 1965-----------
Page
24
24
25
26
27
28
29
30
31
32
33
34
35
36
36
37
38
38
22

DETAILED TABLES-Con.
Table 19.
20.
21.
22.
23.
24.
25.
26.
27.
28.
29.
30.
31.
32.
33.
34.
35.
36.
PARALYSIS
Average prevalence and percent distribution of cases of paralysis,by age accord-ing to color and sex: United States, July 1963-June 1965------------------------
Average prevalence and percent distribution of cases of paralysis, by etiologyaccording to age: tiited States, July 1963-June 1965----------------------------
Average prevalence and percent distribution of cases of paralysis, by etiologyaccording to sex: United States, July 1963-June 1965----------------------------
Average prevalence and percent distribution of cases of paralysis,by age accord-ing to aex and geographic region: United States, July 1963-June 1965------------
Average prevalence and percent distribution of cases of paralysis, by family in-come according to age and sex: United States, July 1963-June 1965---------------
Average prevalence and percent distribution of cases of paralysis, by degree oflimitation of activity according to sex and age: United States, July 1963-June l965------------------------------*----------------------------------------
ABSENCE OF EXTREMITIES
Average prevalence and percent distribution of cases of absence of extremities,by selected characteristics: United States, July 1963-June 1965-----------------
Average prevalence and percent distribution of cases of absence of extremities,by family income according to age: United States, July 1963-June 1965-----------
Average prevalence and percent distribution of cases of absence of extremities,by etiology according to age: United States, July 1963-June 1965----------------
Average prevalence and percent distribution of cases of absence of extremities,by limitation of activity according to age: United States, July 1963-June 1965--
IMPAIRMENTS OF LIM8S, BACK, AND TRUNK
Average prevalence a;~c~rcan; ~~~bution of impairments (except paralysis andabsence) of limbs, by age according to sex and site: UnitedStates, July 1963-June l$65-----------------------------------------------------
Average prevalence and percent distribution of impairments (except paralysis andabsence) of limbs, back, and trunk, by site according to color and age: UnitedStates, July 1963-June l965-----------------------------------------------------
Average prevalence and percent distribution of impairments (except paralysis andabsence) of limbs, back, and trunk,by etiology according to site and age: UnitedStates, July 1963-June 1965----------------------------- ------------------------
Average prevalence and percent distribution of impairments (except paralysis andabsence) of limbs, back, and trunk,by etiology according to site and sex: UnitedStates, July 1963-June l965-----------------------------------------------------
Average prevalence and percent distribution of impairments (except paralysisand absence) of limbs, back, and trunk, by site according to age and geographicregion: United States, July 1963-June 19.65--------------------------------------
Average prevalence and percent distribution of impairments (except paralysis andabsence) of limbs, back, and trunk, by site according to age and family income:United States, July 1963-June l965----------------------------------------------
Average prevalence and percent distribution of impairments (except paralysis andabsence) of limbs, back, and trunk,by de ree of limitation of activity according
5to age and site: United States, July 196 -June 1965-----------------------------
POPULATION
Population used in obtaining rates shown in this publicatioqby age and selectedcharacteristic: United States, July 1963-June 1965-----------------------------
Page
39
39
40
41
42
43
44
45
46
46
47
48
50
52
54
55
56
57
23

Table 1. Averageprevalenceand percentdistributionof visual impairments,by age accordingto sex: UnitedStates,July 1963-June1965
[Dakwe based on household ,nteryiews of the civilian, noninstitutional population. The survey design, general qualifications,~ndin fomation on t,he mliabili~y
of the estimates are given in kppendix I. Definitions of terms are given inAppendix II]
Other visual impairments .-All visual impairments Severe visual impairments
::%r~
inthou-sands
Rateper1,000popu-lation
Rateper1,000popu-lation
6.6—
0.61.5
2:::97.5
5.1
Averagenumberinthou-sands
Averagenumber
inthou-sands
4,163—
595678
1,;::
788
1,927
Rateper1,000popu-lation
Percentdistri-bution
Percentdistri-bution
Percentdistri-bution
100.0
Sex and age
Both sexes
All ages-------------- 5.390 100.0 28.8 1.227 100.0—
4.3
2;::21.447.7
100.0
22.2
Under 25 years --------------25-44years-----------------45-64 years-----------------65-74 years-----------------75 yeare and over-----------
Male
All ages--------------
Under 25 years--------------25-44 years-----------------45-64 years-----------------65-74 years-----------------75 years and over-----------
6487’44
1,4991,1261,373
2,391
340377711465498
2,999
308367788661875
12.013.827.820.925.5
1:::39.6100.9228.8
26,4
1;::38,992.4195.7
31.1
53
2;;263585
464
*
10;105198
763
*
1::159388
14.316.329.820.718,9
100.0
1%:32.777.4131.3
21.2100.0
14,215.829.719.420.8
*
23.;22.642.7
100.0
5.:19.720.850.9
312353601360300
2,236
283324639502487
16.218.331.218.715.6
100.0
::.;
28:622.521.8
1:::32.971.5117.9
23.2
1!:?32.682.0140.8
**
2$:77.8
7.9
1.;7.626.0112.2
Female
All ages-------------- 100.0
Under 25 years--------------25-44 years -----------------45-64 years-----------------65-74 years -----------------75 years and over -----------
1;::40.2107.9253.0
.,
Table 2. Average prevalence and percent distribution of visual impairments, by age according to color: UnitedStates, July 1963-June 1965
[Ss-a headrots on table fl
-----Severe visual imAll visual impairments irments
Rateper1,000popu-lation
Other visual imuaLrments
TLveragelumber Percentin distri-thou- butionsands4
weragelumber Percentin distri-thou- butionsands
Rateper1,000pOpu-lation 1
heragenumber Percentin distri-thou -- butionsands
Rateper1,000>Opu-~Lation
Color and age
+
4,163 100.0
2,513 60.41,650 39.6
Total
All ages --------------
i-
1,227 100.0
378 30.8849 69.2
I
It5,390 100.0 28.8
2,891 53.6 17.02,499 46.4 145.6
6.6—
4;::
6.2
4:::
9.4
22.2
Under 65 years--------------65 years and over-----------
14.896,2
22.2
14.496.0
22.6
White
All ages-------------- 4,684 \ 100.0I 28.4
%-t% T3,665 100.0
2,146 58.61,519 41.4
Under 65 years--------------65 years and over-----------
2,425 51.8 16.32,259 48.2 142.8
+
207 100.0
47.31% 52.7
Nonwhite
All ages-------------- m 498 I 100.0
Under 65 years --------------65 years and over -----------
367 73.7131 26.3
17.798.1
.—
24

Table 3. Prevalence and percent distribution of visual impairments, by etiology according to age: UnitedStates, July 1964-June 1965
[Datamc based on household intsrvievs of the civilian, no,iwtit.tionni pwwlutmn. “!.. .Lr,n} des,,~, q..,r.rl[ qu?lifle~f.j~ns, *R2 inf~~mxtion On the reliability
of the estimatw are ~i,on in lppcndix 1. lJoCinitions of,tcvms are gi,e” in $ppcndiy H]
Other visua 1 impairment aAll visual impairment Severe visua 1 impsirmenta
Rateper1,000pOpu-lation
Rateper1,000popu-lation
Rate
1%0popu-lation
Age and etiologyl Numberin
thOU-aands
Wmberin
thou-sands
Numberin
thOu-aands
Percentdistri-bution
Percentdistri-bution
Percentdistri-bution
All ages
All causes ------------ 5,717
1,372
362
928
322
914
279
522
1,017
3,136
100.0 3003—
7.3
1.9
4.9
1.7
4.9
1.5
2.8
5.4
18.3
1,342—
398
75
185
154
73
35
148
273
428
100.0 7.1 4,375 100.0 23.2
Cataract --------------------
Glaucoma --------------------
Other local eye diseaaes----
General diseases ------------
Injury (@th any othercause) --------------------
Congenital or birth factors-
Other and ill-definedconditions -----------------
Unknown to respondent -------
24.0
6.3
16.2
5.6
16.0
4.9
9.1
17.8
100.0
29.7
5.6
13.8
11.5
5.4
2.6
11.0
20.3
100.0
2.1
0.4
1.0
0.8
0.4
0.2
0.8
1.4
2.5
974
287
742
168
841
244
374
744
2,708
22.3
6.6
17.0
3.8
19.2
5.6
8.5
17.0
100.0
11.0
5.5
21.3
3.3
24.9
7.9
7.8
18.3
100.0
40.6
8.3
9.9
4.7
10.1
1.8
9.7
14.9
5.2
1.5
3.9
0.9
4.5
1.3
2.0
3.9
15.8
1.7
0.9
3.4
0.5
3.9
1.3
1.2
2.9
96.4
39.2
8.o
9.5
4.5
9.7
1.7
9.4
14.3
Under 65 years
All causes ------------
Cataract --------------------
Glaucoma----- L--------------
Other local eye diseaaea----
General diseasea ------------Injury(with any othercause) ---------------------
Congenita 1 or birth factor a-
Other and ill-definedconditions -----------------
Unknown to respondent -------
351
167
675
131
706
244
252
611
2,581
1,022
196
253
191
208
35
270
406
11.2
5.3
21.5
4.2
22.5
7.8
8.0
19.5
100.0
39.6
7.6
9.8
7.4
8.I.
1.4
10.5
15.7
2.1
1.0
3.9
0.8
4.1
1.4
1.5
3.6
149.3
59.1
11.3
14.6
11.0
12.0
2.0
15.6
23.5
54*
98
42
33
30
40
115
914
12,6
*
22.9
9.8
7.7
7.0
9.3
26.9
100.0
0.3
*
0.6
0.2
0.2
0.2
0.2
0.7
52.9
297
149
577
89
673
214
212
496
1.667
65 years and over
All causes ------------
Cataract --------------------
Glaucoma --------------------
Other local eye diseases----
General diseases ------------
Injury (with any othercause)---------------------
Congenital or birth factora-
Other and ill-definedconditions -----------------
Unknown to respondent -------
345
57
88
113
41*
108
158
37.;
6.;
9.6
12.[
4.;
*
11.8
17.:
20.0
3.3
5.1
6.5
2.4
*
6.2
9.1
677
138165
78
16S
30
162
248
lFor inclusions in each etiology group, aee page 5.
25

Table 4. Prevalence and percent distribution of visual impairments, by etiology according to sex: UnitedStates, July 1964-Jtine1965 - -
-.
[Datame bawd on household intm’w.us of th. .,11,.., noni.sot.ticmd population. The s.wc>y d.si:n, wned qualific.
of tho estimalcs arc given In ,ippcndix 1. Definitions of lcrms are given in .AppendixIs, d in fommlion on the reliability
All visual impairments Severe visual impairments Other visual impsirments
Rateper1,000pOpu-lation
Rateper1,000popu-lation
Rateper1,000popu -lation
Sex and etiology ] Numberinthou-sands
5,717
1,372
362
928
322
914
279
522
1,017
2,491
500
130
348
103
670
142
175
425
3,225
873
232
580
219
245
137
347
592
Numberinthou-sands
Numberinthou-sands
Percentdistri-buticm
Percentdiatri-bution
Percentdistri-bution
Both sexes
All cause a------------
Cataract --------------------
Glaucoma --------------------
Other local eye diseases ----
General diseases ------------
Injury (with any othercause )---------------------
Congenital or birth factora -
Other and ill-definedcondition s-----------------
Unknown to respondent -------
Male
All causes ------------
Cataract --------------------
Glaucoma --------------------
Other local eye diseases ----
General diseases ------------
Injury (with any othercause )---------------------
Congenital or birth factors -
Other and ill-definedconditions -----------------
Unknown to respondent -------
Female
All causes ------------
Cataract --------------------
Glaucoma --------------------
Other local eye disease s----
General diaeaaea ------------
Injury (with any othercause )---------------------
Congenital or birth factors-
Other and ill-definedconditions -----------------
Unknown to respondent -------
100.0—
24.0
6.3
16.2
5.6
16.0
4.9
9.1
17.8
100.0
20.1
5.2
14.0
4.1
26.9
5.7
7.0
17.1
100.0
27.1
7.2
18,0
6.8
7.6
4.2
10.8
18.4
30.3—
7.3
1.9
4.9
1.7
4.9
1.5
2.8
5.4
27.3
5.5
1.4
3.8
1.1
7.3
1.6
1.9
4.7
33.2
9.0
2.4
6.0
2.3
2.5
1.4
3.6
6,1
1,342
39E
75
185
154
7?
35
148
273
513
131,,<
67
42
53;!’
52
121
829
267
52
118
112
>!,
,!<
96
152
100,0 7,1 4,375 100,0 23.2
29.7
5.6
13.8
11.5
5.4
2,6
11,0
20.3
100.0
25.5
,,:
13.1
8.2
10.3
>,(
10.1
23.6
100.0
2.1
0.4
1,0
0.8
0.4
0.2
0.8
1.4
5,6
1.4>,c
0.7
0.5
0.6
Ye
0.6
1.3
8.5
974
287
742
168
841
244
374
744
1,979
22.3
6.6
17.0
3,8
19.2
5.6
8,5
17.0
100,0
18.6
5.4
14,2
3.1
31.2
5.9
6.2
15.4
100,0
5.2
1.5
3,9
0.9
4.5
1.3
2.0
3,9
21,7
4.0
1.2
3.1
0.7
6.8
1,3
1,3
3.3
24.7
369
107
281
61
617
117
123
304
2,396
32.2
6.3
14.2
13.5
?{
~<
11.6
18.3
2.7
0.5
1.2
1.2
>,C
$c
1.0
1,6
606
180
462
107
224
127
251
440
25,3
7,5
19.3
4.5
9.3
5.3
10.5
18.4
6.2
1.9
4.8
1.1
2.3
1.3
2,6
4,5
lFor inclusions in each etiology group, aee page 5.
26

Table 5. Average prevalenceand percent distributionof visual impairments,by age accordingtogeographicregion: United States, July 1963-June1965
[Data sre based on household interviews of the civilisn, noninstitutional population. The survey design, general qualifications, and informationon the reliability of the estimates are given in Appendix I. Definitions of terms are given in Appendix II]
All visual impairments Severe visual impairments Other visual impairments
Averagenumber
tRl-sands
Rateper1,000popu-lation
22.2
Rateper
1,000popu-lation
Avv~
t&l-sands
Rateper
1,000popu-lation
Averagenumber
ti%_l-sands
4,163
Region and age Percentdistri-bution
100.0
Percentdistri-bution
Percentdistri-bution
100.0
All regions
All ages-=-
Under 65 years---
65+ years--------
Northeast
All ages---
Under 65 years---
65+ years--------
North Central
All ages---
Under 65 years---
65+ years --------
South
AH ages---
Under 65 years---
65-i-years--------
West
All ages---
Under 65 years---
65+-years--------
5,390 28.8 1,227 100.0 6.6
2>891
2,499
1,022
521
501
1,377
686
691
2,204
1,254
950
786
430
357
53.6
46.4
100.0
51.0
49.0
100.0
49.8
50.2
100.0
56.9
43.1
100.0
54.7
45.4
17.0
145.6
21.9
12.4
111.6
25.8
14.2
134.1
38.7
24.1
193.8
26.0
15.6
136.4
378
849
222
63
160
311
82
229
539
190
349
154
44
110
30.8
69.2
100.0
28.4
72.1
100.0
26.4
73.6
100.0
35.3
64.7
100.0
28.6
71.4
2.2
49.5
4.8
1.5
35.7
5.8
1.7
44.5
9.5
3.6
71.2
5.1
2,513
1,650
800
459
341
1,066
604
462
1,665
1,064
601
632
60.4
39.6
100.0
57.4
42.6
100.0
14.8
96.2
17.2
10.9
76.0
20.0
56.7
43.3
100.0
63.9
36.1
100.0
12.5
89.7
29.2
20.4
122.6 “
20.9
1.6
42.0
386
246
61.1
38.9
14.0
94.0
27

Table 6. Average prevalence and percent distribution of visual impairments, by family incomeaccording to age: United States, July 1963-June 1965
[Data am based on household intewiews ofthe civilian,nminstitutimmlpopulation. The survey design, general qualifications, and informationon tbe reliability of tbe estimates me given in Appendix I. Definitions of terms are given in Appendix II]
11 visual impairments Severe visual impairments Other visual impairments
Averagenumber
inthou-sands
Rateper
1,000popu-lation
Averagenumber
inthOU -
sands
Rateper1,000popu -lation
22.2
Age andfamily income
All ages
‘‘All incomesl-
Under $3,000-----
$3,000-$3,999----
$4,000-$6,999----
$7,000-$9,999----
$lo,ooo+---------
Under 65 years
All incomesl-
Under $3,000-----
$3,000-$3,999----
$4,000-$6,999----
$7,000-$9,999----
$lo,ooo+---------
65+ years
All incomesl-
Under $3,000-----
$3,000-$3,999----
$4,000-$6,999----
$7,000-$9,999----
$lo,ooo+---------
eragember
Eu -ands
Rateper1,000popu-lation
Percentdistri-bution
Percentdistri-bution
Percentdistri-bution
5.390 100.0 28.8 1.227 100.0 6.6 4,163 100.0
t1,732
407
914
477
422
2,513
761
242
697
376
321
1,650
971
164
216
101
101
2,477
516
1,083
541
475
2,891
967
280
767
401
339
2,499
46.0
9.6
20.1
10.0
8.8
100.0
33.4
9.7
26.5
13.9
11.7
100.0
71.2
32.4
18.8
14.3
15.2
17.0
36.8
20.0
14.0
11.0
11.3
145.6
177.5
123.8
109.8
110.1
105.7
744
109
169
64
52
378
206
37
70
*
9<
849
538
72
99
39
35
60.6
8.9
13.8
5.2
4.2
100.0
54.5
9.8
18.5
*
*
100.0
63.4
8.5
11.7
4.6
4.1
21.4
6.8
2.9
1.7
1.7
2.2
41.6
11.7
22.0
11.5
10.1
100.0
49.8
25.6
15.9
12.6
13.5
14.8
7.8
2.6
1.3
*
*
49.5
63.3
37.8
34.4
30.4
27.2
30.3
9.6
27.7
15.0
12.8
100.0
58.8
9.9
13.1
6.1
6.1
28.9
17.3
12.7
10.3
10.7
96.2
114.2
86.0
75.0
78.8
78.5
1,509
236
316
141
136
60.4
9.4
12.6
5.6
5.4
lIncludes persons with unknown incomes.
28

Table 7. Average prevalence and percent distribution of visual impairments, by degree of limitation of ac-tivity according to sex: United States, July 1963-June 1965
;evere visual impairmentsAll visual impairments Other visual impairments
Sex and degree oflimitation of activity
Averagenumberinthou-sands
5,390
Rateper1,000popu-lation
28.8
.verageIUmber
tl%u-sands
1,227
Rateper1,000popu-lation
6.6
Averagenumberinthou-sands
4.163
Rateper1,000popu-lation
22.2
Percentdistri-bution
100.0
Percentdistri-bution
100.0—
53.6
27.6
21.3
4.7
46.4
100.0
Percentdistri-bution
100.0
Both sexes
Total -----------------
With limitation of activity- 1,285
483
618
184
4,105
2,391
611
279
262
71
1,780
2,999
674
204
357
113
2,325
23.8
9.0
11.5
3.4
76.2
100.0
6.9
2.6
3.3
1.0
21.9
26.4
658
339
261
58
569
464
3.5
1.8
1.4
0.3
3.0
5.1
627
144
357
126
3,536
1.927
15.1
3.5
8.6
3.0
84.9
100.0
3.4
0.8
1.9
0.7
18.9
21.2
Unable to carry on majoractivity l----------------
Limitation in amount orkind of major activityl --
Limitation,but not inmajor activityl----------
With no limitation ofactivity -------------------
~
Total-----------------
With limitationof activity- 25.6
11.7
11.0
3.0
74.4
100.0
6.7
3.1
2.9
0.8
19.6
31.1
271
175
85
*
193
763
58.4
37.7
18.3
*
41.6
100.0
3.0
1.9
0.9
*
2.1
7.9
341
104
176
61
1,586
2,236
286
40
180
66
1,950
17.7
5.4
9.1
3.2
82.3
100.0
3.8
1.1
1.9
0.7
17.5
23.2
3.0
0.4
1.9
0.7
20.2
Unable to carry on majoractivity l----------------
Limitation in amount orkind of major activity~ --
Limitation, but”not inmajor activityl ----------
With no limitationofactivity-------------------
Female
Total -----------------
With limitation of activity- 22.5
6.8
11.9
3.8
77.5
7.0
2.1
3.7
1.2
24.1
388
164
176
48
375
50.9
21.5
23.1
6.3
49.1
4.0
1.7
1.8
0.5
3.9
12.8
1.8
8.1
3.0
87.2
Unable to carry on majoractivityl ----------------
Limitation in amount orkind of major activityl --
Limitation ? but not inmajor activity l----------
With no limitation ofactivity -------------------
lmj or activity refers to ability to work, keep hOuse, or engage in school or preschool activities.
29

Table 8. Average prevalence and percent distribution of visual impairments, by degree of limitation of activityaccording to age: United States, July 1963-June 1965
[Data are based on household interview of the civilian, noninatib.ticmal population. The survey design, general q.ctlifications, WI information on the reliability of theestimates are given in Ippcndix I. Definitions of terms are ~ivon in Appendix Ifl
All visual impairments evere visual impairments )ther visual impairments
verageumberinthou-sands
5,390
ercentlistri-,ution
Rateper,000Opu-ation
verageumberinthou-sands
?ercentIistri->ution
Rateper1,000popu-lation
keragelumberin
thou-sands
Percentdistri-bution
kteperL,000)Opu-lation
Age and degree oflimitation of activity
All ages
Total----------------------
With limitation of activity ------
Unable to~carry on majoractivity ---------------------.
Limitation in amount or kind ofmajor activityl---------------
Limitation, but not in majoractivityl---------------------
With no limitation of activity---
Under 45 years
Total----------------------
With limitation of activity------
Unable to carry on majoractivityl---------------------
Limitation in amount or kind ofmajor activityl---------------
Limitation, but not in majoractivityi---------------------
With no limitation of ~ctivity---
45-64 years
Total----------------------
With limitation of activity------
Unable to carry on majoractivity l---------------------
Limitation in amount or kind ofmajor activityl---------------
Limitation, but not in majoractivityl---------------------
With no limitation of activity---
65 years and over
Total----------------------
With limitation of activity----U-
nable to,carry on majoractivity --------------------
Limitation in amount or kind o:major activ.ityl--------------
Limitation, but not in majoractivityl--------------------
With no limitation of activity--
100.0 28.8 1,227 100.0 6.6 4,163 100.0 22.2
1,285
483
618
184
4,105
1,392
190
*
107
58
1,202
1,499
23.8
9.0
11.5
3.4
76.2
100.0
13.6
*
7.7
4.2
86.4
100.0
6.9
2.6
3.3
1.0
21.9
10.5
1.4
*
0.8
0.4
9.1
39.6
658
339
261
58
569
119
61
*
30
*
59
259
53.6
27.6
21.3
4.7
46.4
I.oo.0
51.3
*
25.2
*
49.6
100.0
3.5
1.8
1.4
0.3
3.0
0.9
0.5
*
0.2
*
0.4
6.8
627
144
357
126
3,536
1,273
130
*
76
48
1,143
1,24C
173
*
105
35
1,06;
1,65(
32!
11(
17(
3!
1,32!
15.1
3.5
8.6
3.0
84.9
100.0
3.4
0.8
1.9
0.7
18.9
9.6
10.2
*
6.0
3.8
89.8
100.0
14.0
*
8.5
3.1
86.0
100.c
19.7
6.;
10.;
2.4
80.:
1.0
*
0.6
0.4
8.7
32.7
4.6
*
2.s
1.0
28.2
96.2
18.9
6.4
10.3
2.3
77.2
301
85
163
53
1>198
2,49!
79L
37:
34[
7:
1,70:
20.1
5.7
10.9
3.5
79.9
100.C
31.8
14.$
13.5
2.9
68.2
7.9
2.2
4.3
1.4
31.6
145.(
46.:
21.:
20.:
4.:
99.1
128
56
59
*
131
84S
465
26?
172
34
375
49.4
21.6
22.8
*
50,6
100.0
55.2
31.0
20.3
4.0
44.6
3.4
1.5
1.6
*
3.5
49.:
27.2
15.:
10.[
2.C
22.1
lmjor activitY refers to ability tO work, keep house, or engage in school or preschool activities.
30

Table 9. Average prevalence and percent distribution of hearing impairments, by age according to colorand sex: United States, July 1963-June 1965
[Dnta are based on bouselmld interview of the civilian, noninstitutional population. The stmvsy design, general qualifications, and information on the rcl-liability of the estimates are given in Appendix I. Definitions of terms are given in Appendix II]
Sex and age
Under
25-44
45-64
65-74
Both sexes
All ages----------
25 years----------
years-------------
years-------------
years-------------
75 years and over-------
Male
All ages----------
Under 25 years----------
25-44 years-------------
45-64 years-------------
65-74 years-------------
75 years and over-------
Female
All ages----------
Under 25 years----------
25-44 years-------------
45-64 years-------------
65-74 years-------------
75 years and over-------
gem:
tl% -sands
8,549
823
1,341
2,673’
1,808
1,904
4,785
444
787
1,591
1,o46
916
3,764
379
554
1,081
763
987
Total
Percentdistri-bution
100.0
9.6
15.7
31.3
21.1
22.3
100.0
9.3
16.4
33.2
21.9
19.1
100.0
10.1
14.7
28.7
20.3
26.2
Rateper
1,000popu-lation
45.7—
9.5
29.6
70.5
162.1
317.2
52.8
10.3
36.4
87.1
207.9
359.9
39.0
8.7
23.4
55.1
124.6
3
Averagenumber
inthou-sands
7,891
723
1,238
2,476
1,693
1,762
4,448
392
734
1,483
980
858
3,443
330
504
992
713
904
---W Lte
T
RatePercent perdistri- 1,000bution popu-
lation
100.0 I 47.8
9.2 9.7
15.7 30.8
31.4 72.1
21.5 164.6
22.3 318.3
T100.0 55.5
8.8 10.5
16.5 38.0
33.3 89.5
22.0 211.6
19.3 367.8
I100.0 40.6
9.6 8.8
14.6 24.1
28.8 55.9
20.7 126.1
26.3 282.2
Neragcnumber
tl%u-sands
658.—
100
103
197
116
142
337
52
53
108
66
58
321
48
50
89
50
84
Nonwhite
Percentdistri-bution
100.0
15.2
15.7
29.9
17.6
21.6
100.0
15.4
15.7
32.0
19.6
17.2
100.0
15.0
15.6
27.7
15.6
26.2
Rateper1,000popu-lation
29.8
8.3
20.2
55.0
133.5
304.1
32.0
8.8
23.2
63.3
165.0
273.6
27.8
7.8
17.8
47.5
106.6
329.4
31

Table 10. Average prevalence and percent distribution of hearing impairments,by etiology according tosex and age: United States, July 1963-June 1965
[Dataarebasw! on I,cmseholdinterviewsof the civilian, noninstitutionalpopulation. The survey design, general qualifications, $nd information on thereliab]l i of the estimates arc given in .lp~endix 1 Definitions of terms are given in A ,endix Ifl
Both sexes Male
Percentdistri-bution
Female
IAveragenumb er
inthou-sands
Averagenumb er
inthou-sands
Percentdistri-bution
Rateper1,000popu-lation
Averagenumber
inthou-sands
4,785
Rateper1,000popu-lation
Rateper1,000popu-lation
Age and etiologylPercentdistri-bution
All ages
All causes -------
Infection --------------
Injury -----------------
Other and ill-definedconditions ------------
Unknown ----------------
Under 45 years
All causes-------
Infection--------------
Injury-----------------
Other and ill-definedconditions------------
Unknown----------------
45-64 years
All causes -------
Infection --------------
Injury -----------------
Other and ill-definedconditions ------------
Unknown ----------------
65 years and over
All causes -------
Infection --------------
Injury-----------------
Other and ill-definedconditions------------
Unknown----------------
4==8,549 100.0 45.7 100.0 52.8 3,764 100.0 39.0
1,751
652
20.5
7.6
9.4
3.5
15.8
17.1
16.4
770
493
1,684
1,837
1,231
352
181
357
342
1.591
16.1
10.3
35.2
38.4
100.0
8.5
5.4
18.6
20.3
19.0
5.4
2.8
5.5
5.3
87.1
981
158
1,272
1,353
933
362
64
250
257
1,081
331
39
318
393
1,750
26.1
4.2
33.8
35.9
100.0
38.8
6.9
26.8
27.5
100.0
10.2
1.6
13.2
14.0
13.9
5.4
1.0
3.7
3.8
55.1
16.9
2.0
16.2
20.0
182.7
2,956
3,191
34.6
37.3
2,164 100.0
714
245
607
599
2,673
582
234
848
1,009
3,712
33.0
11.3
28.0
27.7
100.0
5.4
1.9
4.6
4.5
70.5
28.6
14.7
29.0
27.8
100.0
21.8
8.8
31.7
37.7
100.0
15.4
6.2
22.4
26.6
216.3
251
195
529
616
1,962
15.8
12.3
33.2
38.7
100.0
13.7
10.7
28.9
33.7
259.0
30.6
3.6
29.4
36.4
100.0
455
172
1,502
1,583
12.3
4.6
40.5
42.6
26.5
10.0
87.5
92.3
167
118
798
879
8.5
6.0
40.7
44.8
22.0
15.6
105.3
116.0
288
55
703
704
16.5
3.1
40.2
40.2
30.1
5*7
73.4
73.5
Ij?or inclusions in each etiology WOLIP , see page 8,
32

Table 11. Average prevalence and percent distribution of hearing impairments, by age according to sexand geographic region: United States, July 1963-June 1965
[Deiswe basedcmhmsc.hcddint,ervicws of the ci~tilitm, mnimtitutimalpqulatim.The survey design, general qualifications,andinformation cm the re.liability of the estimatm are given in .$ppendik I. Definitions of terms are ci>en in .4ppendix 1]
Region and age
All regions
All ages----------
Under 17 years----------17-24 years-------------25-44 years-------------45-64 years-------------65-74 years-------------75 years and over-------
Northeast
All ages----------
Under 17 years----------17-24 years-------------25-44 years-------------45-64 years-------------65-74 years-------------75 years and over-------
North Central
All ages----------
Under 17 years----------17-24 years-------------25-44 years-------------4J-64 years------7------65-74 years-------------75 years and over-------
Under17-2425-4445-6465-74
South
All ages----------
17 years----------years-------------years-------------years-------------~ears-------------
75 yea;s and over-------
West
All ages----------
Under 17 years----------17-24 years-------------25-44 years-------------45-64 years-------------65-74 years-------------75 years and over-------
Both sexes
Averagenumber
t%u-sands
8,549
513310
1,3412,6731.8081,904
1.728
%’285557369390
2,439
146
3:2742508574
2,842
184115409908604622
1,540
103
2%466328318
Percentdistri-bution
100.0
6.0
12:;31.321.122.3
100.0
4.6
1;:;32.221.422.6
100.0
6.o
1::230.420.823.5
100.0
6.5
1:::31.921.321.9
100.0
2;17.030.321.320.6
Rateper1,000popu-lation
45.7
l;::29.670.5162.1317.’2
37.1
5.2
2;:;54.8123.9258.4
4s.7
1;::30.568.6154.1309.6
49.9
1::;30.281.3189.5362.9
51.0
1::;34.781_.O193.7343.8
iverageumberinthou-sands
4.785
283162787
1,5911,046916
911
46
17;310194165
1,373
;;212;::
283
1,605
10064
248537351304
897
57
1%292198163
Male
Percentdistri-bution
100.0
5.9
12::33.221.919.1
100.0
5.$
18.934.021.318.1
100.0
5.8
1:::32.922.1‘20.6
100.0
6.2
12:!33.521.918.9
100.0
6.4
1?:;32.622.118.2
Rateper1,000popu-lation
52.f
1:::36.[87.1207.~359.5
40.7
5.5
31.:63.2147.E273.t
52.4
&34.685.5
200.7356.C
58.5
2::!39.0101.9243.6416.4
61.1
10.121.643.2102.6257.8390.9
Averagenumber
inthou-sands
3,764
230148554
1,081763987
817
34
11;247175225
1,067
X173290205290
1,237
84
12:371253317
643
45
1:;174129155
Female
Percent3istri-mtion
100.0—
6.1
1::?28.720.326.2
100.0
4.:
1.4.O30.221.427.5
100.0
6.2
12:;27.219.227.2
100.0
:::12.930.020.525.6
100.0
7.0
1;::27.120.124.1
Rateper1>000popu-lation
39.0-
1::;23.455.1
124.6285.4
33.8
4.5
18.;47.0105.0248.3
39.3
Ii::26.752.2114.7273.8
41.8
1::;22.363.0144.9322.2
41.5
1::227.059.8139.5305.1
33

Table 12. Average prevalence and percent distribution Of ‘nearing impaimnents, by family income accordingto age and sex: United States, July 1963-June 1965
[Da,tsme based m household].t,cm’iewsofLhecivilian,.Oninstit.tionalpcqmlaticm,The survey design,gemsmlq.alificaticms,andinfmmatimOD thereliabilityoftheestimates are given inAppendixI. Definitionsofterms.aregiveninAppendixII]
All ages Under 65 years 65 years and over
Rateper1,000popu-lation
Rateper
1,000popu-lation
216.3
Rateper
1,000Copu-lation
Averagenumber
tcu -sands
Averagenumber
inthou-sands
Averagenumberinthou-sands
Sex and family income Percentdistri-bution
?ercent~istri->ution
Percentdistri-bution
Both sexes
All incomesl------
Under $3,000------------
$3,000-$3,999-----------
$4,000-$6,999-----------
$7,000-$9,999-----------
$10,000 and over--------
u
All incomesl------
Under $3,000------------
$3,000-$3,999-----------
$4,000-$6,999-----------
$7,000-$9,999-----------
$10,000 and over--------
Female
All incomesl------
Under $3,000------------
$3,000-$3,999-----------
$4,000-$6,999-----------
$7,000-$9,999-----------
$10,000 and over--------
8,549 100.0 45,7 4,837 100.0 28.5 3,712 100.0
3,131
803
2,005
1,146
1,012
4,785
36.6
9.4
23.5
13.4
11.8
100.0
90.0
50.4
34.8
30.4
32.4
52.8
1,070
396
1,458
924
767
2,823
22.1
8.2
30.1
19.1
15.9
100.0
40.7
28.3
26.7
25.3
25.6
34.0
2,061
407
547
222
245
1,962
55.5
11.0
14,7
6.0
6.6
100.0
242.5
213.5
190.0
173.3
190.4
259.0-—
296.9
263.5
230.8
197.2
:208.8
182.7
1,604
484
1,207
683
592
3,764
1,527
319
798
463
420
103.9
64.4
42.4
36.2
37.6
39,0
539
235
883
571
468
2,014
532
160
576
353
300
19,1
8.3
31.3
20.2
16.6
100.0
26.4
7.9
28.6
17.5
14.9
45.5
35.7
32.6
31.2
30.9
23.2
36.8
21.5
20.9
19.4
20.3
1,065
249
324
112
124
1,750
54.3
12.7
16.5
5.7
6.3
100.0
33.5
10.1
25.2
14.3
12.4
100.0
40.6
8.5
21.2
12.3
11.2
202.7
1.64.4
1.51,2
154,5
174.4
78.9
38.0
27.4
24,5
27.1
996
158
223
110
121
56.9
9.0
12.7
6.3
6.9
llnclude~persons with unkncwn incomes.
34

Table 13. Average prevalence and percent distribution of hearing impairments, by degree of limitation of activityaccording to sex and age: United States, July 1963-June 1965
[Dataarebased O. bous.boldi.t.m’iewOftboci~’iliwnOnin~ti@OnOlPoPUl~tiOn.Th~sunq dc~% gen@mImmlificntiOns,andinformationonthereliabilityoftbeestimatesoregiw!nh .Ippondix1.Definitionsof terms arc fivcn in $ppendis 1~
Both sexes Male Female
Age and degree oflimitation of activity
Avwr
intilou-sands
Rateper
1,000popu-lation
iveragem-umberin
thou-sands
Rateper1,000popu-lation
Averagenumber
inthou-sands
Rateper1,000?Opu-Lation
Percentdistri-bution
Percentdistri-bution
Percentdistri-bution
All ages
100.0Total----------------------- 8,549 100.0 45.7 4,785 100.0 52.E 3,764 39.0
With limitation of activity-------
Unable to,carry on majoractivity ----------------------
Limitation in amount orkind of major activity l--------
Limitation, but not inmajor activityl----------------
With no limitation of activity----
461
145
219
97
8,088
2,164
127
*
70
41
2,037
!2.,673
5.4
1.7
2.6
1.1
94.6
100.0
5.9
*
3.2
1.9
94.1
100.0
2.5
0.8
1.2
0.5
43.2
16.4
1.0
*
0.5
0.3
15.4
70.5
253
99
118
37
4,532
1,231
64
*
37
*
1,168
1,591
68
*
37
*
1,523
1,962
5.3
2.1
2.5
0.8
94.7
100.0
5.2
*
3.0
*
94.9
100.0
2.e
1.1
l.?
0.4
50.0
19.0
1.0
*
0.6
*
18.0
87.1
207
46
101
60
3,557
933
63
*
33
*
870
1,081
5.5
1.2
2.7
1.6
94.5
100.0
6.8
*
3.5
*
93.2
100.0
2.1
0.5
1.0
0.6
36.9
13.9
0.9
*
0.5
*
12.9
55.1
Under 45 years
Total-----------------------
With limitation of activity-------
Unable to carry on msjoractivityl----------------------
Limitation in amount orkind of major activityl --------
Limitation, but not inmajor activityl ----------------
With no limitation of.activity ----
45-64 years
Total-----------------------
With limitation of activity -------
Unable to carry on majoractivityl----------------------
Limitation in amount orkind of major activityl --------
Limitation, but not inmajor activityl----------------
115
*
63
30
2,558
3,712
4.3
*
2.4
1.1
95.7
100.0
3.0
*
1.7
0.8
67.5
216.3
4.3
*
2.3
*
95.7
100.0
3.7
0.$
2.0
0.8
83.3
259.0
46
*
*
*
1,035
1,750
4.3
*
*
*
95.7
100.0
2.3
*
*
*
52.7
182.7
With no limitation of activity----
65 years and over
Total-----------------------
With limitation of activity -------
Unable to carry on msj oractivity l----------------------
Limitation in amount orlkind of major activity --------
Limitation, but not inmajor activity l----------------
219
108
86
*
3,493
5.9
2.9
2.3
*
94.1
12.8
6.3
5.0
*
203.6
122
73
44
*
1,841
6.2
3.7
2.2
*
93.8
16.1
9.6
5.8
*
243.0
98
35
42
*
1,652
5.6
2.0
2.4
*
94.4
10.2
3.7
4.4
*
172.4With no limitation of activity----
l~jor activity refers to ability to work, keep house , or engage in school or preschool activities.
35

Table 14. Average prevalence and percent distribution of speech defects, by age according to color andsex: United States, July 1963-June 1965
[Data are based cm household interviews of the civilian, noninstitutional population. The survey design, general qualifications, and information cm the reliability of the estimates are given in Appendix I. Definitions of terms are given in Appendix II]
WhiteI Total Nonwhite
Sex and age
F ~~n
I I
Average Ratenumber Percent perin distri- 1,000thou- bwtion popu-sands lation
Lveragezumber
tl%u-sands
Percentdistri-bution
Rateper1,000popu-lation
I IBoth sexes
All ages---------- 1,298 100.0 6.9
25 years---------- 832 64.1 9.6
226 100.0 10.2
155 68.6 12.9
70 31.0 7.0
138 100.0 13.1
100 72.5 16.9
37 26.8 8.0
6.5
I676 63.1 9.1
4.4
8.4
Under
25 years and over------- 466 35.9 4.6
Male
All ages ---------- 809 100.0 8.9
Under 25 years---------- 544 67.2 12.6
25 years and over------- 264 32.6 5.6
Female
All ages---------- 489 100.0 5.1
Under 25 years---------- 287 58.7 6.6
25 years and over ------- 202 41.3 3.8
396 36.9
I
I444 I 66.2 11.9
5.3
4.7
227 33.8
233 58.1 6.2
3.5168 I 41.9
Table 15. Average prevalence and percent distribution of speech defects, by etiology according to age:United States, July 1963-June 1965
[Sseheadnoteontable14]
All ages 45 years and overUnder 45 years
[:~mg~
Percentin distri-thou- butionsands
Rate
1%0popu-lation
Etiology $m~e
inthou-sands
RatePercentdi.stri- 1:%’0bution popu-
lation
Averagenumberinthou-sands
999
RatePercentdistri- l;GObution popu-
lationII
298 100.0 5.41,298
144
119
628
408
100.0 I 6.9 100.OI 7.6All causes--------
Vascular lesions, cen-tral nervous system----
Congenital or birthfactors----------------
Other and ill-definedconditions-------------
Unknown to respondent---
—
* *
11.1 0.8
136 45.6 2.5
*
2.1
0.7
11.1 I 0.8 *
111
512
368
9.2 0.6
48.4 3.4
31.4 2.2
* *
115 38.651.3 3.9
---4JE
36

Table 16. Average prevalenceand percent distributionof speech defects, by age accordingto sexand geographicregion: United States, July 1963-June1965
[Datame based on household inteMew~of the civilian, noninstitutional population. Thesurveydesign,generalqualification,and informationon the reliability ofthe estimates aregiven in AppendlxI. Definitions oftennsaregivenin AppendIxII]
Both sexes Male Female
Rateper1,000popu-lation
Averagenumber
inthou-sands
Averagenumber
inthou-sanda
1,298
695
603
221
Rateper
1,000popu-lation
Averagenumber
inthou-sanda
Rateper ~1,000popu-lation
Region and age Percentdistri-bution
Percentdistri-bution
Percentdistri-bution
All regions
All ages----
Under 17 years----
17 years and over-
Northeaat
All ages----
Under 17 years----
17 years and over-
North Central
All ages----
Under 17 years----
17 years and over-
%uth
All ages----
Under 17 years----
1.7years and over-
=
All ages----
Under 17 years----
17 years and over-
100 ● o
53.5
46.5
100.0
6.9
10.5
5.0
4.7
80$
46>
347
143
100. c
57.1
42.9
100.0
8.9
13.7
6.1
6.4
489
233
256
78
100.0
47.6
52.4
100.0
5.1
7.2
4.0
3.2
117
104
331
166
166
519
52.9
47.1
100.0
50.2
50.2
100.0
7.6
3.3
6.2
8.7
4.9
9.1
14.0
6.4
7.5
74
69
207
113
94
321
194
127
137
51.7
48.3
.100.0
54.6
45.4
100.0
60.4
39.6
100.0
9.5
4.7
7.9
11.5
5.7
11.7
18.6
7.5
9.3
43
35
124
53
71
197
93
105
89
55.1
44.9
100.0
42.7
57*3
100.0
47.2
53,3
100.0
5.6
2.1
4.6
5.7
4.0
6.7
9.2
5.4
287
232
227
55.3
44.7
100.0 5.7
8.3
4.5
126
101
55.5
44.5
11.4
5.3
81
56
59.1
40.9
14.4
6.2
45
45
50.6
50.6
37

Table 17. Average prevalence and percent distribution of speech defects,by family income i~cco~d-ing to age; United States, July 1963-June 1965
[Data sw based on household interviews of the civilisn, noninstitutionalpopulation. Tbe survey design, general qualifications, and informationonthe reliability of tbe estimates are given in Appendix I. Definitions of terms are given in Appendix II]
I All ages Under 17 years 17 years and over
Family income Average Ratenumber Percent
distri- 1:%0ti%u- bution popu-sands lation
Rate?ercent perdistri- 1,000bution popu-
lation
Rateper
1,000popu-lation
heragenumber
tRl-sands
Averagenumber
tlRl-sands
Percentdistri-bution
=4====All incomesL-- 1,298 100.0 6.9
Under $3,000------ 370 28.5 10.6
$3,000-$3,999----- 129 8.14,000-$6,999----- 387
$
2%:7,000-$9,999----- 202 15.6 2::10,000 and over-- 151 11.6 4.8
695 603 100.0 500
150
2;:13585
21.6 15.210.2 12.533.2 10.2:;.; 9.2
. 8.0
220
1:~6766
36.5
2;:;11.110.9
%:4.42.93.2
lIncludes persons with unknown incomes.
Table 18. Average prevalence and uercent distribution of Sueech defects. bv limitation of activ-~ty”according to S;X and age: United States; July 1963-J&e”1965
[%. head”ote cm table IT]
Both sexes FernaleMale
Age andlimitation ofactivity
Averagenumber
inthou-sands
Rateper
1,000popu-lation
kveragenumberinthou-sands
Rateper
1,000popu-lation
Averagenumber
inthou-sands
Rateper11,000popu-lation
Percentdistri-bution
Percentdistri-bution
Percentdistri-bution
AIS ages
Total ------- 489 100.0 5.16.9
1.4
5.5
7.6
809
152
657
643
100.0
18.8
81.2
100.0
8.9
1.7
7.2
9.9
With limitationof activity------
With no limitationof activity------
263 20.3
1,035 79.7
111
378
357
22.7
77.3
100.0
1.2
3.9
Under 45 years
Total------- 5.3
With limitationof activity------
With no limitationof activity------
1.4
8.6
6.4
65
292
132
18.2
81.8
100.0
1.0
4.3
153 15.3
847 84.8
1.2
6.4
5.4
88
555
166
13.7
86.3
100.0
45 years and over & 4.5Total -------
With limitationof activity------
With no limitationof activity------
110 36.9 2.0
3.4
64
102
38.6
61.4
2.5
3.9
47
85
35.6
64.4
1.6
188 63.1 2.9—-
38

Table 19. Average prevalence and percent distribution of cases of paralysis, by age according to colorand sex: United States, July 1963-June 1965
[DataWe b~~dcmho”s~holdinterviews of the ci,ilian, noninstitutional population. The survey design, general qualifications, and information On the r~-liability of the estimates are given in Appendix I. Definitions of terms are given in .Appendix ID
Total White Nonwhite
Averagenumber
inthou-sands
Rateper
1,000popu-lation
iveragenumber
inthou-sands
Rateper1,000popu-lation
Averagenumber
inthou-sands
Rateper
1,000popu-lation
Sex and age Percentdistri-bution
Percentdistri-bution
Percentdistri-bution
Both sexes
All ages----------
Under 4.5years----------45 years and over-------
~
All ages----------
Under 45 years----------45 years and over-------
Female
All ages----------
Under 45 years----------45 years and over-------
1.516 100.0 8.1 1.357 100.0 8.2 158 100.0
645871
788
345443
727
300428
42.557.5
100.0
43.856.2
100.0
;:.;.
4.915.8
8.7
1%?
7.5
12:;
;::
710
319391
647
276372
43.856.2
100.0
44.955.1
100.0
42.757.5
12;
8.9
12::
7.6
1:::
31.668.4
100.0
66.;
100.0
70.:
7.4
22.:
6.9
21.:
Table 20. Average prevalence and percent distribution of cases of paralysis,age: United States, July 1963-June 1965
by etiology accoFding to
~ce he.dnote on table 19]
All ages Under 45 years 45 years and over
Etiology Averagenumber
tXl-sands
RatePercent perdistri- 1,000bution popu-
lation
Averagenumber
inthou-sands
Percentdistri-bution
Rateper1,000popu-lation
Averagenumber
inthou-sands
Rateper1,000popu-lation
Percentdistri-bution
All causes-------- 645 100.0 4.9 871
157
49073
*
:;
100.0 1.5.8
Poliomyelitis-----------Vascular lesions,central nervous system-Injury------------------Congenital or birthfactors----------------
Other and ill-definedconditions-------------
Unknown to respondent---
451 I 29.71 2.4 294
6;
160
%
45.6
10.;
24.8
2.2
0.;
1.2
18.0
56.38.4
2.9
8.91.3
*
H
519140
34.2 2.89.2 0.7
171 I 11.3 I 0.9 *
0.40.3
8.47.7
39

Table 21. Average prevalence and percent distribution of cases of paralysis,by etiology accordingto s=: United States,July 1963-June 1965
[Data are based cm household interviews of the civilian, noninstitutional population. The survey design, general qualifications, and informationon the reliability of the estimates are given in Appendix I. Definitions of terms are given in Appendix II]
Etiology
Both sexes
All causes------------------------------------------------------
Poliomyelitis----------------------------------------------------------
Vascular lesions, central nervous system----------------------------
Injury----------------------------------------------------------------
Congenital or birth factors-------------------------------------------
Other and ill-defined conditions--------------------------------------
Unknown to respondent-------------------------------------------------
Male
All causes-------------------------------------------------------
Poliomyelitis----------------------------------------------------------
Vascular lesions, central nervous system ------------------------------
Injury-----------------------------,------------------------------------
Congenital or birth factors--------------------------------------------
Other and ill-defined conditions--------------------------------------
Unknown to respondent-------------------------------------------------
Female
All causes------------------------------------------------------
Poliomyelitis---------------------------------------------------------
Vascular lesions, central nervous system------------------------------
Injury----------------------------------------------------------------
Congenital or birth factors-------------------------------------------
Other and il.-defined conditions--------------------------------------
Unknown to respondent--------------------------- ----------------------
Averagenumber
t%l-sands
1,516
451
519
140
171
125
111
788
243
250
98
93
50
55
727
208
269
41
78
75
56
Percentdistri-bution
100.0—
29.7
34.2
9.2
11.3
8.2
7.3
100.0
30.8
31.7
12.4
11.8
6.3
7.0
100.0
28.6
37.0
5.6
10.7
10.3
7.7
Eiateper1,000pc,pu-la.tion
.—
8.1
2.4
2.8
0.7
0.9
0.7
0.6
8.7
2.7
2.8
1.1*
1.0
0.6
0.6
7.5
2.2
2.8
0.4
0.8
0.8
0.6
40

Table 22. Average prevalence and percent distribution of cases of paralysis, by age according to sexand geographic region: United States, July 1963-June 1965
[Dateme bawd m householdinterviewsofthecitilim,mninstituticmdpopulation.Thes.nq’design, general qualifications, and information on thereliability of the estimates are given in Appendix I.Definitions of terms are given in .Ippendix 117
Male
Percentdistri-bution
FemaleBoth sexes
Averagenumber
tGl-sands
Rateper1,000popu-lation
Rateper1,000popu-lation
Averagenumber
t%l-sands
1,516
Rate
1:%0popu-lation
iveragemmber
t&’u-sands
Region and age Percentdistri-bution
Percentdistri-bution
100.0
All regions
All ages---------- 100.0 8.1 788 8.7 727 100.0 7.5
Under 25 years----------
25-44 years -------------
45-64 years -------------
65 years and over-------
327
318
410
460
333
67
77
95
94
411
92
85
108
126
527
111
92L44
181
245
.57
64
64
60
21.6
21.0
27.0
30.3
100.0
20.1
23.1
28.5
28.2
100.0
3.8
7.0
10.8
26.8
7.1
3.3
6.6
9.4
20.9
7.7
178
168
214
229
179
37
39
55
47
214
22.6
21.3
27.2
29.1
100.0
4.1
7.8
11.7
30.2
8.0
149
150
196
231
154
20.5
20.6
27.0
31.8
100.0
3.4
6.3
10.0
24.1
6.4
2.9
6.3
7.6
17.9
7.3
Northeast
All ages-----------
Under 25 years----------
25-44 years-------------
45-64 years-------------
65 years and over-------
20.7
21.8
30.7
26.3
100.0
3.7
7.0
11.2
24.5
8.2
30
38
40
46
197
19.5
24.7
26.0
29.9
100.0
North Central
All ages----------
Under 25 years ----------
25-44 years -------------
45-64 years-------------
65 years and over-------
22.4
20.7
26.3
30.7
100.0
21.1
17.527.3
34.3
100.0
23.3
26.1
26.1
24.5
3.7
6.7
10.0
24.5
9.2
4.1
6.8
12.9
36.9
8.1
52
42
57
64
272
58
60
69
84
124
24.3
19.6
26.6
29.9
100.0
21.3
22.1
25.4
30.9
100.0
4.2
6.9
10.8
27.8
9.9
4.3
9.413.1
38.7
8.4
41
44
50
62
255
52
3175
97
121
20.8
22.3
25.4
31.5
100.0
20.4
12.229.4
38.0
100.0
3.3
6.8
9.0
21.8
8.6
3.8
4.312.7
35.5
7.8
South
All ages----------
Under 25 years ----------
25-44 years -------------
45-64 years-------------
65 years and over-------
West
All ages----------
25 years----------
years -------------
years -------------
Under
25-44
45-64
4.0
8.5
11.1
22.9
31*
32
35
25.0*
25.8
28.2
4.4*
11.2
29.5
*
31.4
25.6*
*
38
31*
*
9.6
10.6*65 years and over-------
41

Table 23. Average prevalence and percent distribution of caaes of paralyaia, by family income accordingto age and sex: United Statea, July 1963-June 1965
[Data are basedcm householdi.tewiws of thecivilian,mxinstit.t.ionalpopulation,The survey design, general qualifications, and information on thereliability of the estimates are given in Appendix I. Definitionsof termsaregiven in Appendix II]
All ages Under 45 yeara 45 years and over
Averagenumber
tl%.l-sanda
1.516
Rateper1,000popu-lation
Rateper1,000popu-lation
Percentdistri-bution
Rateper1,000popu-lation
weragelumberinthOU-
sands
Averagenumber
inthOU-
sanda
Sex and family income Percentdistri-bution
Percentdistri-bution
Both sexes
All incomesl------
Under $3,000------------
$3,000-$3,999-----------
$4,000-$6,999-----------
$7,000-$9,999”----------
$10,000 and over--------
Male
All incomeal------
Under $3,000------------
$3,000-$3,999-----------
$4,000-$6,999-----------
$7,000-$9,999-----------
$10,000 and over--------
Female
All incomeal------
Under $3,000------------
$3,000-$3,999-----------
$4,000-$6,999-----------
$7,000-$9,999-----------
$10,000 and over--------
100.0 8.1 645 100.0 4.9 871 100.0 15.8
497
135
382
234
191
788
32.8
8.9
25.2
15,4
12.6
100.0
14.3
8.5
6.6
6.2
6.1
8.7
16.8
9.2
7.4
5.7
6.3
7.5
12.2
7.9
5.9
6.7
5.9
103
44
219
146
116
345
60
fc
125
68
59
300
43
*
94
78
57
16.0
6.8
34.0
22.6
18.0
100.0
L7.4
*
36.2
19.7
17.1
100.0
14.3
*
31.3
26.0
19.0
5.4
4:0
5.0
5.0
5.2
5.3
6.5
*
5.7
4.7
5.3
4.5
4.3
*
4.2
5.3
5.1
394
91
163
89
75
443
200
45
86
41
40
428
194
46
78
48
35
45.2
10.4
L8.7
10.2
8.6
100.0
45.1
10.2
19.4
9.3
9,0
100.0
45.3
10.7
18.2
11.2
8.2
25.4
18.4
12.2
10.7
8.4
17.1——
31.9
19.9
12.9
9.6
8.6
14.7
20.9
17;2
11.7
11.9
8.2
260
69
211
108
99
727
237
66
171
126
92
33.0
8.8
26.8
13.7
12.6
100.0
32.6
9.1
23.5
17.3
12.7
1Includes persons with unknown incomes.
42

Table 24. Average prevalence and percent distribution of cases of paralysis, by degree of limitation of activityaccording to sex and age: United States, July 1963-June 1965
[kta are bawd on housohold intcrviows of th~ civilian, nonin.tit.timwl population. The suwos t!mign, general qmdifimtions, rind infcmnatim on the reliahiliiy of theoxtimntw are ~ivon in Appendix I. Definitions of terms nro ~iwm in Appendix II]
Both sexes Male
Percentdistri-bution
Female
Age and degree oflimitation of activity
Averagenumber
t&-sands
Rate
1500pOpu-lation
8.1—
4.9
2.4
1.9
0.6
3.2
4.9
Rateper1,000popu-lation
iveragelumberinthou-sanda
788—
489
271
159
59
299
345
Averagenumber
hthOU-
aanda
Rate
1%0pOpu-lat ion
Percentdistri-bution
100.C—
60.$
29.2
23.t
7.8
39.1
100.0
Percentdistri-bution
All agea
Total----------------------- 1,516—
923
444
361
118
593
100.C—
62.1
34.4
20.2
7.5
37.9
100.0
8.7—
5.4
3.0
1.8
0.7
3.3
5.3
727—
43L
17:
202
5~
292
30C
100.0—
59.7
23.8
27.8
8.1
40.3
100.0
7.5—
With limitation of activity-------
Unable tolcarry on msjoractivity -------------------- --
Limitation in amount orkind of major activity t--------
Limitation, but not inmajor activity l----------------
With no limitation of a6tivity----
4.5
1.8
2.1
0.6
3.0
Under 45 years
Total----------------------- 645
327
87
158
82
318
4.5
With limitation of activity-------
Unable to carry on majoractivity l----------------------
Limitation in amount orkind of major activity l--------
Limftstion, but not inmajor activity l ----------------
With no limitation of activity----
50.7
13.5
24.5
12.7
49.3
100.0
61.5
27.8
27.3
*
38.8
100.0
74.8
52.6
19.8
*
25.2
182
47
91
44
163
214
2.5
0.7
1.2
0.6
2.4
10.8
52.8
13.6
26.4
12.8
47.2
100.0
2.8
0.7
1.4
0.7
2.5
11.7
145
40
67
37
155
196
48.3
13.3
22.3
12.3
51.7
100.0
2.2
0.6
1.0
0.6
2.3
45-64 years
Total----------------------- 410
252
114
112
*
159
10.0
With limitation of sctivity-------
Unable to carry on majoractivity l----------------------
Limitstion in amount orkind of major activity l--------
Limitation, but not inmajor activity l----------------
6.6
3.0
3.0
*
4.2
26.8
20.0
14.1
5.3
*
6.8
131
74
45
*
83
229
175
149
*
*
54
61.2
34.6
21.0
*
38.8
100.0
7.2
4.0
2.5
*
4.5
30.2
121
40
68
*
76
231
61.7
20.4
34.7
*
38.8
100.0
6.2
2.0
3.5
*
3.9With no limitation of activity----
65 yeara and over
Total----------------------- 46o
344
242
91
*
116
24.1
With limitation of activity-------
Unable to,carry on majoractivity ----------------------
Limitation in amount orkind of major activity l--------
Limitation, but not inmajor activity l----------------
76.4
65.1
*
*
23.6
23.1
19.7
*
*
7.1
169
93
67
*
62
73.2
40.3
29.0
*
26.8
17.6
9.7
7.0
*
6.5With no limitation of activity----
l~jor activity refers to ability towork,keep house, or engage in school or preschool activities.
43

Table 25. Average prevalence and percent distribution of cases of absence of extremities, by se-lected characteristics: United States, July 1963-June 1965
[Data are basedOnhouseholdinterviews of the civiliarr, noninstitutional population. The survey design, general qualifications, and informationon the reliability of the estimatss are given in Appendix I. Definitions of terms are given in Appendix II]
Selectedcharacteristic
Total -------
Sex
Mele --------------
Female------------
Age
Under 65 years----
65 years and over-
Color
White-------------
Nonwhite----------
Region
Northeast---------
North Central-----
South-------------
West--------------
Averagenumberinthou-sands
1,968
1,638
331
1,507
462
1,769
200
402
639
596
331
Total
Percentdistri-bution
100.0
83.2
16.8
76.6
23.5
89.9
10.2
20.4
32.5
30.3
16.8
RateperL,000?opu-Lation
10.5—
18.1
3.4
8.9
26.9
10.7
9.1
8.6
12.0
10.5
11.C
Absence of majorextremity
$-y
inthou-sands
257
222
35
178
79
214
43
59
81
86
31
Percentdistri-bution
100.0
86.4
13.6
69.3
30.7
83.3
16.7
23.0
31.5
33.5
12.1
Rateper1,000popu-lation
1.4
2.4
0.4
1.0
4.6
1.3
1.9
1.3
1.5
1.5
1.0
Absence of fin er(s) ortoe(s7
Averagenumber
inthou-sands
1,712
1,416
296
1,328
383
1,555
157
343
559
510
300
?ercentlistri->ution
100.0
82.7
17.3
77.6
22.4
90.8
9.2
20.0
32.7
30.0
17.5
Sateper1,000popu-lation
9.1
15.6
3.1
7.8
22.3
9.4
7.1
7.4
10.5
9.0
9.9
44

Table 26. Average prevalenceand percent distributionof cases of absence of extremities,by fam-ily income accordingto age: United States,July 1963-June1965
[Data are based cm household interviews of the oivilien, noninstitutional population. The survey design, general quehfkations, and informationon the reliability of the estimates are given in Appendix I. Definitions of terms are given in Appendix II]
Age andfamily income
All ages
All incomesl--
Under $3,000------
$3jOOO-$6,999-----
$7,000 and over---
Under 65 years
All incomesl--
Under $3,000------
$3,000-$6,999-----
$7,000 and wer
65 vears and over
All incomesl--
Under $3,000------
$3,000-$6,999-----
$7,000 and over---
Averagenumber
inthou-s’ands
1,968
540
766
571
1,507
275
640
521
462
265
126
50
Total
Percentdistri-bution
100.0
27.4
38.9
29.0
100.0
18.2
42.5
34.6
100.0
57.4
27.3
10.8
Rateper
1,000popu-lation
10.5—
15.5
10.4
8.?
8.9
lo.j
9.3
7.8
26.9
31.2
26.3
19.5
Absence of maiorextremity-
Averagenumber.
t%l-sands
257
94
88
59
178
46
70
49
79
48
*
*
Percentdistri-bution
100.0
36.6
34.2
23.0
100.0
25.8
39.3
27.5
100.0
60.8
*
*
Rateper1,000popu-lation
1.4
2.7
1.2
0.9
1.0
1.7
1.0
0.7
4.6
5.6
*
*
Absence of finger(s)ortoe(s)
Averagenumberinthou-sands
1,712
446
679
511
1,328
230
570
472
383
217
109
39
Percentdistri-bution
100.0
26.1
39.7
29.8
100.0
17.3
42.9
35.5
100.0
56.7
28.5
10.2
Rateper1,000popu-lation
9.1
12.8
9.2
7.4
7.8
8.7
8.3
7.1
22.3
25.5
22.8
15.2
llnclUdes persons with unknown incomes.
45

Table 27. Average prevalence and percent distribution of cases of absence of extremities, by etiology ac-cording to age: United States, July 1963-June 1965
@ataw? based on household inlerk,ews of tbe c]vilta., nonin.l,lulional population. The .ur!my design, general qualifications, and information cm the reliability
of the csllmul.s are gIv@” in $ppcmcltx 1, Dcfinilion~ of term. we given in Appendix 1~
Absence of major Absence of fin er(s) orextremity toe (s?I Total
Average Ratenumber Percent per
in distri- :L,000thou- bution popu-sands Iation
Age and etiology Averagenumb er
inthou-sands
Percentdistri-bution
Rateper1,000popu-lation
iverageLumber
t%l-sands
Rateper1,000>opu-Lation
Percentdistri-bution
All ages
All causes ------------- 1.968 100.0 10.5 257—
18275
100.0—
70.829.2
100.0
1.4 1,712 100.0 9.1
1,582’ 9;.$ 8.5130 . 0.7
Injury-----------------------All other causes-------------
Under 65 years
All causes -------------
+
1,76h 89.6205 10.4
1,507 100.0
1,377 91.4130 8.6
9.41.1
8.9 1.0 1,328 100.O 7.8
0.8 1,241 9;.; 7.30.3 87 . 0.5
178
Injury -----------------------All other causes -------------
8.10.8
26.9
13543
79
75.824.2
-iOo.0
65 years and over
All causes ------------- 4.61 383 I 100.0] 22.3462 I 100.0
Injury -----------------------All other causes ------------- 21.--E 22.6
4.44732
59.540.5
2.7 3;: 88.8 19.81.9 11.2 2.5
Table 28. Average prevalence and percent distribution of cases of absence of extremities, by limitation ofactivity according to age: United States, July 1963-June 1965
r~eheadnote0.table277
Absence of fin er(s) ortoe(s?
Absence of majorextremityTotal
Age andlimitation of activity
RatePercent per5istri- 1,000>ution popu-
lation
:le:e
inthou-sands
Rateper1,000popu-lation
Averagenumber
t&l-sands
Percentdistri-bution
RateperL,000)opu-Lation
Averagenumb er
t%l -sands
Percentdistri-bution
All ages
Total ------------------
With limitation of activity --With no limitation ofactivity --------------------
Under 45 years
Total ------------------
With limitation of activity --With no limitation ofactivity --------------------
45 years and over
Total ------------------
With limitation of activity --With no limitation ofactivity -------: ------------
100.0 9.1I
1,968—
228
1,740
711
68
643
1,258
161
1,097
100.0—
11.6
88.4
100.0
9.6
90.4
100.0
12.8
87.2
10.5—
1.2
9.3
5.4
0.5
4.9
22.8
1.4—
0.8
0.5
0.6
0.3
0.3
3.3
1,712—
71
1,641
637
30
607
1,074
40
1,034
4.1 0.4
95.9 8.899 38.5
-3-= =-l-+95.3 4.6
100.0 19.5-L36 49.3
183 100.0
2.9
19.9
120 65.6 2.2
1.1
3.71 0.7
--.3--&
46

Table 29. Average prevalence and percent distribution of impairments (except paralysis and absence) oflimbs, back, and trunk, by age according to sex and site: United States, July 1963-June 1965
[Data are based cm household interviews of the civilian, noninstitutional population. The survey design, general qualifications, and infonution cm the ra-liability of theestimatos aregiven in.4ppendix I. Definitions ofterms aregiven in.\ppendis I~
Site and age
Female
Percentdistri-bution
100.0
Male
Percentdistri-bution
100.0—
1:::35.231.513.9
100.0
Both sexes
Rateper
1,000popu-lation
104.4
Averagenumberinthou-sands
8.277
Rateper1,000popu-lation
85.8
Averagenumber
inthou-sands
17,742—
1,5061,8415,6475,549.3,199
6,486
165704
2,4802,186951
2,925
287282839934582
6,623
Rateper1,000popu-lation
94.8—
22.889.3
124.6146.4186:4
34.7
3::;.54.757.755.4
15.6
4.313.718.524.633.9
35.4
Averagenumber
inthou-sands
9,465
8321,0003,3312,9861,316
33187
2:;1,3051,109409
1,690
167185556540242
3,667
Percentdistri-bution
100.0—
1::231.831.318.0
100.0
1::;38.233.714.7
100.0
9.8
2::!31.919.9
100.0
All sites
All ages----------
24.8104.1154.1163.4173.7
35.1
674841
2,3162,5641,883
3,299
1::;28.031.022.7
100.0
20.776.497.7130.7196.5
34.2
Under 17 years----------17-24 years -------------25-44 years-------------45-64 years-------------65 years and over-------
Back or spine
All ages----------
Under 17 years----------17-24 years-------------25-44 years-------------45-64 years-------------65 years and over-------
2.1
4::;34.812.8
100.0
1%;32.932.014.3
100.0
3;::60.460.754.0
18.6
1:::25.729.531.9
40.4
4::1,1751,077543
1,235
120
2:;394340
2,957
3.012.335.632.616.5
100.0
9.7
2;:;31.927.5
100.0
32:!49.654.956.7
12.8
::;11.920.135.5
30.7
12.824.627.842.581.2
8.2
Upper extremity
and shoulder
All ages----------
Under 17 years----------17-24 years -------------25-44 years---:---------45-64 years -------------65 years and over-------
Lower extremity and hip
All ages----------
16.745.553.355.266.9
10.2
14.0
2:::28.226.3
100.0
Under 17 years----------17-24 years -------------25-44 years-------------45-64 years-------------65 years and over-------
976708
1,8121>8421,286
1,709
14.710.727.427.819.4
100.0
14.834.440.048.675.0
9.1
561437
1,1531>008507
921
15.311.931.427.513.8
100.0
415271658;;:
787
Other and multiple, NEC
All ages----------
4.0
3:::35.717.3
1.3
2:;13.123.1
Under 17 years----------17-24 years-------------25-44 years-------------45-64 years-------------65 years and over-------
1;?517587380
4.6
3::534.322.2
1.2
l::i15.522.1
37
3!;329159
1.1
1::;18.021.0
41
2X258221
47

Table 30. Average prevalence and percent distribution of impairments (except paralysis and absence) oflimbs, back, and ttmnk, by site according to color and age: United States, July 1963-June 1965
[Datame based on household interviews of the civ!lian, noninstitutional population. The survey design, general qualifications, and information on the re-liability oflheest,mates aregiven in Append,x I. Definitions ofterms aregiven in Appendix I]
Age and site
All ages
All sites ---------
Back or spine -----------
Upper extremity andshoulder ---------------
Lower extramity and hip-
Other and multiple, NEC-
Under 45 years
All sites ---------
Back or spine -----------
Upper extremity andshoulder ---------------
Lower extremity and hip-
Other and multiple, NEC-
45 years and over
All sites ---------
Back or spine -----------
Upper extremity andshoulder ---------------
Lower extremity and hip-
Other and multiple, NEC-
Total
TAveragenumb er Percentin distri-
thou- butionsands
L7,742 100.0
6,486 36.6
2,925 16.5
6,623 37.3
1,709 9.6
Q=-PQ-3,348 37.2
1,409 15.7
3,496 38.9
741 8.2
I+
3,137 35.9
L1,516 17.3
3,128 35.8
967 11.1
Rateper
1,000popu-latiOI
94.
34.
15.
35.
9.
68.
25.
10.
26.
5.
158.
57.
27.
56.
17.
Averagenumber
inthou-sands
15,924
5,944
2,635
5,878
1,467
8.113
3,094
1,260
3,114
645
7,810
2,850
1,376
2,763
822
White
Percentdistri-bution
100.0
37.3
16.5
36.9
9.2
100.0
38.1
15.5
38.4
8.0
100.0
36.5
17.6
35.4
10.5
I Nonwhite
I
Rate Averageper number
1,000 inpopu- thou-lation sands
T96.5 1,819
36.0 542
16.0 289
35.6 746
8.9 242
-t-
70.6 881
26.9 254
11.0 149
27.1 381
5.6 96
+
155.8 938
56.8 288
27.4 140
55.1 365
16.4 145
Percentdistri-bution
100.0
29.8
15.9
41.0
13.3
100.0
28.8
16.9
43.2
10.9
100.0
30.7
14.9
38.9
15.5
lateper.,000}opu-.ation
82.4
24.6
13.1
33.8
11.0
51.4
14.8
8.7
22.2
5.6
190.8
58.6
28.5
74.3
29.5
48

Table 31. Average prevalence and percent distribution of impairments (except paralysia and ab-sence) of limbs, back, and trunk, by etiology according to site and age: United States, JUIY1963-June 1965
[Data are based cm household intswiwvs of the civilian, noninstitutional population. The survey design, general qualifications, endinfonnation
ontbereliability of theestimates aregiven in Appendix I. Definitions ofte& are-given in Appendix II]
Age and etiology
All ages
All causes----------------------------
Injury--------------------------------------Congenital or birth factors-----------------
Other and ill-defined conditions------------Unknown to respondent-----------------------
Under 25 years
All causes----------------------------
Injury--------------------------------------Congenital or birth factors-----------------
Other and ill-defined conditions------------Unknown to respondent-----------------------
25-44 years
All causea----------------------------
Injury--------------------------------------Congenital or birth factors-----------------
Other and ill-defined conditions------------Unknown to respondent-----------------------
45-64 years
All causes----------------------------
Injury--------------------------------------Congenital or birth factors-----------------
Other and ill-defined conditions------------Unknown to respondent-----------------------
65 years and over
All causes----------------------------
Injury--------------------------------------Congenital or birth factors-----------------
Other and ill-defined conditions------------Unknown to respondent-----------------------
Averagenumber
inthou-sands
17,742
12,2371,135
1,8112,560
3,347
2,013696
267372
5,647
4,074250
539785
5,549
3,950146
611843
3,199
2,20044
395560
All sites
Percent~istri-mtion
100.0—
69.06.4
10.214.4
100.0
60.120.8
1!:!
100.0
72.14.4
1;:;
100.0
7;.:.
11.015.2
100.0
68.81.4
12.317.5
Rateper
1,000popu-lation
94.8
65.46.1
1;:;
38.6
23.28.0
3.14.3
124.6
89.95.5
11.917.3
146.4
104.23.9
16.122.2
186.4
12;.;.
23.032.6
Back or apine
Averagenumber
tl%-sands
6,486
3,690238
9451,613
868
50470
114180
2,480
1,459103
. 358560
2,186
1,25352
328553
951
4747’<
145320
Percentdistri-bution
100.0
56.93.7
14.624.9
100.0
58.18.1
13.120.7
100.0
58.84.2
14.422.6
100.0
57.32.4
15.025.3
100.0
Kateper1,000popu-lation
34.7
5.80.8
;:;
54.7
32.22.3
1;::
57.7
33.11.L
8.;14.t
55.L
27.~5
8.:18.;
50

Table 31. Average prevalence and percent cltsf:ributj.on of impairments (except p%~alys~s awl ab-aence) of limbs, back, and trunk, by etiology according to site and age: United States, July1963-June 1965—Con.
@ata are based orIhousehold i~tewiws of the civilian, mminstitutional populratiom The survey design, general qualifications, amdinfotmationon the reliability ofthe estimates sregiven in Appendix I. Definitiorrsoftermsaregivenin AppendlxE]
,
Upper extremityand shoulder Lower extremityand hip Other and multiple,NEC
I
Percentdistri-bution
Averagenumber
inthou-sands
Rate Averagenumber
1%0 inpopu- thou-lation sands
Per centdistri-bution
Rate Averagenumber
inthou-sands
1.709
{ate?er,000>pu-ation
9.1
Percentdistri-bution
100.0
78.81.8
1?:;
100.0
71.1*
**
100.0
per1,000popu-lation
2,925
2,446133
200145
570
100.0
+83.64.5
6.85.0
100.0
13.1 4,7530.7 734
531::; 605
71.8 2;.$11.1 .
8.o 2.89.1 3.2
100.0 19.4
52.3 1$;32.1 .
U ::;
100.0 40.0
1,34730
136196
225
160*
**
517
u0.71.0
2.6
1.8*
**
11.4
6.6 1,684
880;::. 540
* 120* 144
18.5 1,812
46966
**
839
82.311.6
**
100.0
80.5 32.25.7 2.3
16.1 1,4590.8 103
72838
4331
934
86.84.5
5.13.7
100.0
428*
%
587
82.8*
5.810.3
100.0
80.2*
8.310.7
100.0
9.4*
0.71.2
15.5
12.4*
1.31.7
22.1
0.9 1080.7 141
6.o 2.47.8 3.1
24.6 1,842 100.OI 48.6I
20.6 1,447* 67
779*
;;
582
471*
E
83.4*
U
100.0
80.9*
12.05.7
78.6 38.23.6 1.8
471*
4963
380
1.9 1621.6 165
8.8 4.39.0 4.4
33.9 1,286I
100.0 ] 75.0
75.2 56.4* *L
27.5 967* *
4.1 1401.9 155
288*
4051
75.8*
10.513.4
16.8*
2.33.0
51
10.9 8.212.1 9.0

Table 32. Average prevalence and percent distribution of impairments (except paralysis and ab-sence) of limbs, back, and trunk, by etiology according to site and sex: United States, July1963-June 1965
[Data are based on household interviews of the siviIian, ncminstitutbud population. The survey design, general qualifications, andinfonuationon therelinbilityof theeetimates sregiven in Appendix I. Definitions of terms aregiven in Appendix II]
Sex and etiology
Both sexes
All causes----------------------------
Injury--------................--------------
Congenital or birth factors-----------------
Other and ill-defined conditions------------
Unknown to respondent-----------------------
Male
ALI causes----------------------------
Injury--------------------------------------
Congenital or birth factors-----------------
Other and ill-defined conditions------------
Unknown to respondent-----------------------
Female
All causes----------------------------
Injury-----------.--.--”----------------------
Congenital or birth factors-----------------
Other and ill-defined conditions------------
Unknown to respondent-----------------------
All sites
iveragemmb erin
thou-sands
17,742
12,237
1,135
1,811
2,560
“9,465
6,910
607
811
1,138
8,277
5,327
528
1,000
1,422
Percentdistri-bution
100.0
69.0
6.4
10.2
14.4
100.0
73.0
6.4
8.6
12.0
100.0
64.4
6.4
12.1
17.2
Rateper
L,000popu-lation
94.8
65.4
6.1
9.7
13.7
104.4
76.2
6.7
8.9
12.5
85.8
55.2
5.5
10.4
14.7
Back or spine
Averagenumber
inthou-sands
6,486
3,690
238
945
1,613
3,187
1,986
104
412
685
3,299
1,704
134
532
928
Percentdistri-bution
100.0
56.9
3.7
14.6
24.9
100.0
62.3
3.3
12.9
21.5
100.0
51.7
4.1
16.1
28.1
Rateper1,000popu-lation
34.7
19.7
1.3
5.1
8.6
35.1
21.9
1.1
4.5
7.6
34.2
17.7
1.4
5.5
9.6
52
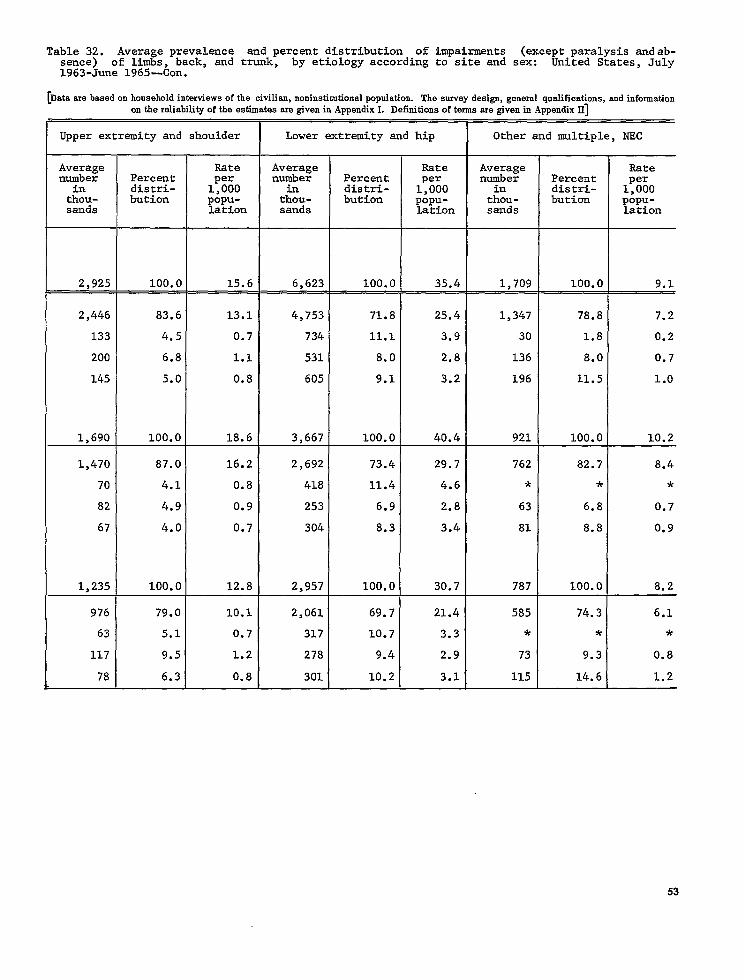
Table 32. Average prevalence and percent distribution of impairments (exceptparalysisandab-sence) of limbs,back, and trunk, by etiologyaccording to site and sex: United States,July1963-June1965-Con.
[Data me based m hrwmhold interviews of the civilian, rmninstitutirm.1 population. The survey design, general qualifications, and information.onthereliability oftbe estimates aregiven in Appendix I. Definitions ofterms aregiven in Appendix IIJ
Upper extremityand
Averagenumber
inthou-sands
2,925
2,446
133
200
145
1,690
1,470
70
82
67
1,235
976
63
117
78
Percentdistri-bution
100.0
83.6
4.5
6.8
5.0
100.0
87.0
4.1
4.9
4.0
100.0
79.0
5.1
9.5
6.3
:houlder
Rateper1,000popu-lation
15.6
13.1
0.7
1.1
0.8
18.6
16.2
0.8
0.9
0.7
12.8
10.1
0.7
1.2
0.8
Lower extremityand hip
gxat?
inthou-sands
6,623
4,753
734
531
605
3,667
2,692
418
253
304
2,957
2,061
317
278
301
Percentdistri-bution
100.0
71.8
11.1
8.0
9.1
100.0
73.4
11.4
6.9
8.3
100.0
69.7
10.7
9.4
10.2
Rateper1,000popu-lation
35.4
25.4
3.9
2.8
3.2
40.4
29.7
4.6
2.8
3.4
30.7
21.4
3.3
2.9
3.1
Other and multiple,NEC
Averagenumber
inthou-sands
1,709
1,347
30
136
196
921
762
*
63
81
787
585
*
73
115
Percentdistri-bution
100.0
78.8
1.8
8.0
11.5
100.0
82.7
*
6.8
8.8
100.0
74.3
*
9.3
14.6
Rateper1,000popu-lation
9.1
7.2
0.2
0.7
1.0
10.2
8.4
*
0.7
0.9
8.2
6.1
*
0.8
1.2
53

Table 33. Average prevalence and percent distribution of impairmentsof limbs, back,
(except paralysis and absence)and trunk, by site according to age and geographic region: United States, July 1963.
June 1965
[Dataam based on household interviews of the civilian, noninstitutional pop.la~ion. ‘Tiw s.mey dcsigs, genernl qualifications, and information o. the re-liability of the estimates are given in ..4ppe”dixI.Definitions of terms are given in Appendix In
All ages Under 45 years 45 years and over
Averagenumber
inthou-sands
Region and site Rateper1,000popu-lation
Rateper1,000popu-lation
Rateper1>000popu-lation
iveragemmb erinthou-sands
kveragenumberinthou-sands
Percent~istri-bution
Percentdistri-bution
Percentdistri-bution
All regions
All sites---------
Back or spine-----------Upper extremity andshoulder---------------
Lower extremity and hip-Other and multiple, NEC-
Northeast
All sites---------
Back or spine-----------Upper extremity andshoulder---------------
Lower extremity and hip-Other and multiple, NEC-
North Central
All sites ---------
Back or spine-----------Upper extremity,andshoulder---------------
Lower extramity and hip-Other and multiple, NEC-
South
All sites ---------
Back cm spine-----------Upper extremity andshoulder---------------
Lower extremity and hip-Other and multiple, NEC-
West
All sites---------
Back or spine-----------Upper extremity andshoulder---------------
Lower extremity and hip-Other and multiple, NEC-
17,742 100.0 94.8 8,994 100.0 68.1 8,748 100.0 158.9
6,486
2,925
6,6231,709
3,602
36.6
16.5
37.39.6
100.0
34.7
15.6
35.49.1
77.3
3,348
1,409
3,496741
1,808
37.2
15.7
38.98.2
100.0
25.4
10.7
26.55.6
56.6
3,137
1,516
3,128967
L,795
35.9
17.3
35.811.1
100.0
57.0
27.5
56.817.6
122.6
44.1
22.5
44.811.1
160.3
61.0
27.6
55.216.5
180.0
57.7
31.1
67.523.6
179.4
1,327
611
1,372292
5,180
1,975
857
1,::;
5,625
1,870
947
2,167641
3,335
1,314
510
1,202310
36.8
17.0
38.18.1
100.0
28.5
13.1
29.56.3
97.1
37.0
16.1
35.38.7
98.7
32.8
16.6
38.011.2
110.4
681
281
717129
2,619
37.7
15.5
39.77.1
100.0
21.3
8.8
22.54.0
70.1
26.7
11.1
26.85.4
66.8
23.0
10.9
26.56.4
83.9
646
330
656163
2,561
975
441
881264
2,89L
927
500
1,084379
1,502
589
245
508161
36.0
18.4
36.59.1
100.0
38.1
17.2
;$$.
100.0
32.1
17.3
37.513.1
100.0
38.1
16.5
36.39.0
100.0
33.2
16.8
38.511.4
100.0
999
416
1,001202
2,735
943
447
1,084262
1,832
725
265
694148
38.1
15.9
38.27.7
100.0
34.5
16.3
39.69.6
100.0
39.4
15.3
36.09.3
43.5
16.9
39.810.3
39.6
14.5
37.98.1
33.2
12.1
31.86.8
39.2
16.3
33.810.7
70.3
29.3
60.719.2
——
54

Table 34. Average prevalence and percent distribution of impairments (except paralysis and absence) oflimbs, back, and trunk, by site according to age and family income: United States, July 1963-June 1965
[Data are based cm household interviews of the civilian, noninstitutional population. The sun’ey design, general audificatians, and informnticm on thereliability of thecwtimatesar egiven in \ppendix I. Definitions of terms nrepi~cnin Ippendis Ifi
All ages Under 65 years 65 years and over
iii~
ti%l-sands
17,742
6,486
2,9256,6231,709
4,879
1,565
8061,:;;
1,546
581
252569143
4,821
1,846.
7971,;;:
3.147
Rateper1,000popu-lation
94.8—
34.7
15.635.49.1
140.3
iveragemmb erinthou-sands
14,544—
5,534
2,3435,3381,329
2,972
995
4661,141370
1,203
474
188433109
4,387
1,703
7221,567396
2,985
1,182
4861,;:;
2,410
946
387908168
Rateper1,000popu-lation
85.6
Averagenumber
inthou-sands
3,199—
951
5821,286380
1,907
57C
34C740257
343
107
1::35
434
143
1;:42
162
Rateper1,000popu-lation
186.4—
55.4
33.975.022.1
224.4
67.1
40.087.130.2
180.0
56.1
34.171.418.4
150.7
49.7
26.4,60.114.6
126.5
Family income and site Percentdistri-bution
100.0—
36.6
16.537.39.6
100.0
Percentdistri-bution
100.0—
38.1
16.136.79.1
100.0
33.5
15.738.412.4
100.0
39.4
15.636.09.1
ioo.o
38.8
16.535.79.0
100.0
Percentdistri-bution
100.0
All incomesl
All sites---------
Back or spine-----------Upper extremity andshoulder---------------
Lower extremity and hip-Other and multiple, NEC-
32.6
13.831.47.8
113.1
37.9
17.743.414.1
85.8
33.8
13.430.97.8
80.2
31.1
13.228.67.2
81.9
29.7
18.240.211.9
100.0
29.9
17.838.813.5
100.0
31.2
19.039.710.2
100.0
32.9
17.539.99.7
100.0
Under $3,000
All sites---------
Back or spine-----------Upper extremity andshoulder---------------
Lower extremity and hip-Other and multiple, NEC-
32.1
16.538.612.9
100.0
45.0
23.2;:.:
.
97.1
$3,000-$3,999
All sites---------
Back or spine-----------Upper extremity andshoulder---------------
Lower extremity and hip-Other and multiple, NEC-
37.6
16.336.89.2
100.0
36.5
15.835.79.0
83.7
$4,000-$6,999
All sites---------
Back or spine-----------Upper extrenri.tyandshoulder---------------
Lower extremity and hip-Other and multiple, NEC-
38.3
16.536.19.1
100.0
32.1
13.830.27.6
83.4
$7,000-$9,999
All sites---------
Back or spine-----------Upper extremity andshoulder---------------
Lower extremity and hip-Other and multiple, NEC-
1,226
5201,151249
2,574
979
42;
178
39.0
16.536.67.9
100.0
32.5
13.83:.:
.
82.4
39.6
16.33;.;
.
100.0
32.4
13.329.66.5
80.5
44
3570*
164
27.2
21.643.2
*
100.0
20.1
22.651.2
*
34.3
27.354.6
*
127.4
$10,000 and over
All si,tes---------
Back or spine-----------Upper extremity andshoulder---------------
Lower extremity and hip-Other and multiple, NEC-
38.0
16.538.56.9
31.4
13.631.85.7
39.3
16.137.77.0
31.6
12.930.35.6
33
3784*
25.6
28.765.3
*
‘Includespersons with unknown incomes.
55

Table 35. Average prevalence and percent distribution of impairmentsback, and trunk,
(except paralysis and absence) of limbs,by degree of limitation of activity according to age and site: United States, July 1963-June
1965
[Data are based on household ,nterv,ews of the civ,l,an, noninstitutional population. Tbe suwey design, general qualifications, and information cm tbe reliability of tbe
estimates areglven in Appendix 1. Definitions of terms aregiven in Appendixll]
All ages Under 65 years 65 years and over
Site and degree oflimitation of activity
Averagenumber
tl%u-sands
17,742
RateperL,000>Opu-Lation
94.8_
21.7
2.9
13.0
7;:!
34.7
Averagenumber
inthou-sands
143544
Rateper1,000popu-lation
85,6
Averagenumber
t;%sands
3,199
Rate
1:%0popu-lation
186.4-
62.9
17.9
37.7
12$:
55.4
21.5
4.9
14.7
3;:;
33.9
6.6
*
4.3
27.;
75.0
Percentdistri-bution
100.0
Percentdistri-bution
100.0
Percentdistri-bution
100.0—
33.8
9.6
20.2
62:;
100.0
All sites
Total-----------------------
With limitation of activity-------Unable tolcarry on majoractivity ----------------------Limitation in amount orkind of major activity l--------Limitation, but not inmajor activityl----------------
With no limitation of activity----
4,065
545
2,441
1,07913,677
6,486
22.9
3.1
13.8
7%;
100.0
2,985
238
1,794
95311,558
5,534
20.5
1.6
12.3
7;::
100.0
17.6
1.4
10.6
6;:;
32.6
1,080
307
647
1262,119
951
Back or spine
Total-----------------------
With limitation of activity-------Unable to carry on majoractivity l----------------------Limitation in amount orkind of major activityl--------
Limitation, but not inmajor activityl----------------
With no limitation of activity----
Upper extremity and shoulder
Total-----------------------
1,769
160
1,139
4694,717
2,925
27.3
2.5
17.6
7;:?
100.0
13.7
1.7
8.8
8;:;
100.0
20.0
3.6
10.6
8;:;
100.0
33.4
5.6
19.9
6kg
9.5
0.9
6.1
2$;
15.6
2.1
0.3
1.4
1::2
35.4
7.1
1.3
3.8
2:::
9.1
3.(
O,j
1.5
0.76.1
1,399
77
887
4364,135
2,343
288
Ye
184
2,0:;
5>338
880
88
471
3214,458
1,329
418
49
253
116910
25.3
1.4
16.0
7L?
100.0
12.3
*
7.9
8?.?
100.0
16.5
1.6
8.8
6.o83.5
100.0
31.5
3.7
19.0
6;:;
8.2
0,5
5.2
2:::
13.8
1.7
*
1.1
12:;
31.4
5.2
0.5
2.8
2;:;
7.8
2.5
0.3
1.5
0.75.4
369
84
253
5::
582
114
*
74
46;
13286
445
149
234
8;;
38C
38.8
8.8
26.6
6;:;
100.0
19.6
*
12.7
80. !
100.0
With limitation of activity -------Unable tolcarry on majoractivity ----------------------Limitation in amount orkind of major activityl--------Limitation, but not inmajor activityl----------------
With no limitation of activity----
401
51
258
2, 5;;
6,623
1,325
237
704
3845,298
1,709
570
96
340
1341,139
Lower extremity amd hip
Total -----------------------
With limitation of activity-------Unable to carry on majoractivity l----------------------Limitation in amount or\i?d of major activity l--------
Llmltation, but not in’major activityl----------------
With no limitation of activity ----
Other and multiple, NEC
Total -----------------------
34.6
11.6
18.2
6::;
100.0
25.9
8.7
13.6
4:::
22.1
With limitation of activity-------Unable tolcarry on majoractivity ----------------------Limitation in amount orkind of major activity l--------Limitation, but not inmajor activity l----------------
With no limitation of activity----
152
47
87
22:
40.0
12.4
22.9
60. !
8.9
2.7
5.1
13. !
l~jor activity refers to ability to work, keep house, or engage in school or preschool activities.
56

Table 36. Populationused in obtaining rates shown in this publication, by age and selectedcharacteristics:United States,July 1963-June1965
[Data me based on household interviews of the sivilk, noninstitutional population. Thesurvey design, general qualifications, and informationon the reliability of the estimates are given in Appendix I. Definitions of terms are given in Appendix II]
All Under 6-16 17-24 25-4& 45-64 65-74 75 yearsages 6 years years years years yeara years and overSelectedcharacteristic
TOTAI)
Both sexes------------
Male------------------------Female----------------------
COLOR
White
Both sexes------------
Male------------------------Female----------------------
Nonwhite
Both sexes------------
Male------------------------Female----------------------
REGION
Northeast
Both sexes------------
Male------------------------Female----------------------
North Central
Both sexes------------
Male------------------------Female----------------------
SQ!4.Qk
Both sexes------------
Male------------------------Female----------------------
~
Both sexes------------
Male------------------------Female----------------------
Populationin thousands
187,109
90,69296,417
165,045
80,15584,890
22,064
24,879
12,66412,215
21,041
10,75110,290
3,838
41,254 20,605 45,315 37,898 11,156 6,002
2,5453,458
5,536
2,3333,203
467
20,95320,301
35,548
18,09517,454
5,705
9,60311,002
18,094
8,4439,651
2,511
21,61923,696
40,220
;:,;:;>
5,095
18,27619,622
34,319
16,57017,749
3,579
5,0326,124
10,287
4,6325,655
869
10,53611,528
46,578
22,40024,178
53,351
;:,:::>
56,982
27,41829,563
30,198
1,9131,925
5,644
2,8212,824
7,181
2,8582,847
9,747
4,9324,815
11,976
1,1611,350
4,917
2,2842,633
5,613
2,2872,808
11,625
5,5516,074
12,608
1,7061,873
10,157
4,8985,259
10,823
400469
2,979
1,3131,666
3,297
212255
1,509
603906
1,854
7951,059
1,714
730984
925
3,6753,506
7,753
;,W;2
4,301
6>1285,848
12,778
6,4606>318
6,753
2,6932,920
6.859
6,1246,483
13,529
6,3567,173
7,554
5,2635,560
11.163
1,5101,787
3,187
1,4411,746
1,693
3,1883,671
3,216
5,2715,891
5,755
14,68615,512
2,1962,105
3,4333,320
1,4381,777
3,5883,966
2,8452,911
768925
417508
57
See footnoteat end of table.

Table 36. Population used in obtaining rates shown in this publication, by age and selectedcharacteristics: United States, July 1963-June 1965—COn.
[Data are based cm household interviews of the oivilian, rmninstitutionaI population. The survey design, general qualifications, andinforrnationon the reliahilityofthe estimates aregivenin Appendix I. Definitions of terms are given h Appendix11]
I I IAllages
Under 6-16 17-24 25-44 45-646 years years years years years
65-74 75 yearsyears and overSelected characteristic
FAMILY INCOME
Under $3,000
Both sexes------------
Population in thousands
34,787
15,434
19,353
15,921
3,907
1,952
1,955
2,435
5,931
3,003
2,928
3,263
4,463
2,081
2,383
2,026
4,945
2,127
2,817
3,260
7,041
2,684
4,358
3,031
5,190
2,183
3,007
1,339
3,310
1,404
1,906
567
Male ------------------------
Female----------------------
$3,000-$3,999
Both sexes------------
Male ------------------------
Female----------------------
7,520
8,401
57,574
1,250
1,186
9,377
1,663
1,600
13,235
883
1,143
6,291
1,465
1,794
15,333
1,314
1,717
10,459
665
673
2,040
279
288
840
$4,000-$6,999
Both sexes------------
Male----:-------------------
Female----------------------
28,499
29,075
37,747
18,882
18,864
31,220
4,769
4,608
5,229
2,693
2,536
2,997
6,746
6,490
9.383
2,810
3,481
3.596
7,511
7,821
11,239
5,259
5,200
7,019
1,020
1,020
901
384
455
380
$7,000-$9,999
Both sexes------------
1,688
1,908
3,085
5,533
5,705
8,582
3,696
3,323
7,654
4,057
3,597
424
477
878
428
451
145
235
409
166
243
Male ------------------------
Female----------------------
4,703
4,679
7,615
$10,000 and over
Both sexes------------
Male ------------------------
Female ----------------------
15,738
15,482
1,522
1,475
3,892
3,723
1,594
1,491
4,079
4,503
lInCIUdes persons with unknown incomes.
NOTE : For official population estimates for more general use, see Bureau of the Census reportson the civilian population of the United States, in Current Population Reports: Series p-20, p-25,and P-60.
!
58

APPENDIX 1
TECHNICAL NOTES ON METHODS
Background of This Report
This report is one of a series of statistical reportsprepared by the National Health Survey. It is based oninformation collected in a continuing nationwide sampleof households in the Health Interview Survey, a majorpart of the program.
The Health Interview Survey utilizes a question-naire which, in addition to personal and demographiccharacteristics, obtains information on illnesses,’ in-juries, chronic conditions and impairments, and otherhealth topics. As data relating to each of these variousbroad topics are tabulated and analyzed, separate re-ports are issued which cover one or more of the specifictopics, The present report is based primarily on theconsolidated sample for 104 weeks of interviewingending June 1965.
The population covered by the sample for theHealth Interview Survey is the civilian, noninstitutionalpopulation of the United States living at the time ofthe interview. The sample does not include membersof the Armed Forces, U.S: nationals living in foreigncountries, or crews of vessels.
Statistical Design of the
Health Interview Survey .
General @w.-The sampling plan of the surveyfollows a multistage probability design which permitsa continuous sampling of the civilian population ofthe United States. The first stage of this design con-sists of drawing a sample of 357 from about 1,900geographically defined primary sampling units (PSU’S)into which the United States has been divided. A PSUis a oounty, a group of contiguous counties, or astandard metropolitan statistical area.
With no loss in general understanding, the re-maining stages can be combined and treated in thisdiscussion as an ultimate stage. Within PSU’S, then,ultimate stage units called segments are defined insuch a manner that each segment contains an expectedrdne households. A segment consists of a cluster ofneighboring households or addresses. Two general
types of segments are used: (1) area segments whichare defined geographically, and (2) B segments whichare defined from a list of addresses from the DecennialCensus and the Survey of Construction. Each week arandom sample of about 90 segments is drawn. In theapproximately 800 households in these segments, house-hold members are interviewed concerning factors re-lated to health.
Since the household members interviewed eachweek are a representative sample of the ~pulation,samples for successive weeks can be combined intolarger samples. Thus the design permits both continuousmeasurement of characteristics of high incidence orprevalence in the population and, through the largerconsolidated samples, more detailed analysis of lesscommon characteristics and smaller categories. Thecontinuous collection has administrative and operationaladvantages as well as technical assets, since it per-mits field work to be handled with an experienced,stable staff. .
Sample size and geo.gvaphic detail. —The nationalsample plan for the 24-month period ending June 1965included about 268,000 persons from 84,000 householdsin ahout 9,400 segments.
The overall sample was designed in such a fashionthat tabulations can be provided for each of the majorgeographic regions and for urban and rural sectors ofthe United States.
Collection of data. — Field operations for the house-hold survey are performed by the U.S. Bureau of theCensus under specifications established by the NationalCenter for Health Statistics. In accordance with thesespecifications the Bureau of the Census selects thesample, conducts the field interviewing as an agentof the Center, and performs a manual edit and codingof tbe questionnaires, The Health Interview Survey, usingCenter electronic computers, carries out further editingand tabulates the edited data.
Estimating methods. -Each statistic produced bythe survey—for example, the number of persons whohave a hearing impairment in a specified period-isthe result of two stages of ratio estimation. In the firstof these the control factor is the ratio of the 1960
59

decennial population count to the 1960 estimated popu-lation in the National Health Survey’s first-stage sampleof PSU’S. These factors are applied for some 25 color-residence classes.
Later, ratios of sample-produced estimates of thepopulation to official Bureau of the Census figures forcurrent population in about 60 age-sex-color classesare computed and serve as second-stage factors forratio estimating.
The effect of the ratio estimating process is tomake the sample more closely representative of thepopulation by age, sex, color, and residence, thus re-ducing sampling variance.
As noted, each week’s sample represents the pop-ulation living during that week and characteristics ofthat population. Consolidation of samples over a timeperiod, say a calendar quarter, produces estimates ofaverage characteristics of the U.S. population for thatcalendar quarter. Similarly, population data for a yearare averages of the four quarterly figures.
General Qualifications
Nonresponse. —Data were adjusted for nonresponseby a procedure which imputes to persons in a house-hold which was not interviewed the characteristics ofpersons in households in the same segment which wereinterviewed. The total noninterview rate was 5 percent:1 percent was refusal, and the remainder was primarilydue to the failure to find any eligible householdrespondent after repeated trials.
The interview pvocess. —The statistics presentedin this report are based on replies secured in interviewsof persons in the sampled households. Each person 19years of age and over available at the time of interviewwas interviewed individually. Proxy respondents withinthe household were employed for children and for adultsnot available at the time of the interview, provided therespondent was closely related to the person aboutwhom information was being obtained.
There are limitations to the accuracy of diagnosticand other information collected in household interviews.For diagnostic information, the household respondentcan, at best, pass on to the interviewer only the infor-mation the physician has given to the family. Forconditions not medically attended, diagnostic informa-tion is often no more than a description of symptoms.However, other facts, such as the number of disabilitydays caused by the condition, can be obtained moreaccurately from household members than from anyother. source, since only the persons concerned are ina position to report this information.
Rounding of numbers. —The original tabulationson which the data in this report are based show allestimates to the nearest whole unit. All consolidationswere made from the original tabulations using theestimates to the nearest unit, In the finsl published
tables the figures are rounded to the nearest thousand,although these are not necessarily accurate to thatdetail. Devised statistics, such as rates and percentdistributions, are computed after the estimates onwhich these are based have been rounded to the nearestthousand.
Population figuws. —Some of the published tablesinclude population figures for specified categories ~Ex-cept for certain overall totals by age and sex, whichare adjusted to independent estimates, these figuresare based on the sample of households in the NationalHealth Survey. These are given primarily to providedenominators for rate computation and for this purposeare more appropriate for use with the accompanyingmeasures of health characteristics than other populationdata that may be available. In some instances thesewill permit users to recombine published data intoclasses more suitable to their specific needs. Withthe exception of the overall totals by age and sexmentioned above, the population figures differ fromcorresponding figures (which are derived from differentsources) published in reports of the Bureau of theCensus. For population data for general use, see theofficial estimates presented in Bureau of the Censusreports in the P-20, P-25, and P-60 series.
Reliability of Estimates
Since the estimates are based on a sample, theywill differ somewhat from the figures that wouldhave been obtained if a complete census had beentaken using the same schedules and instructions ,andinterviewing personnel and procedures. As in any sur-vey, the results are also subject to measurement error.
The standard error is primarily a measure ofsampling variability, that is, the variations that mightoccur by chance because only a sample of the pop-ulation is surveyed. As calculated for this report,the standard error also reflects part” of the variationwhich arises in the measurement process. It doesnot include estimates of any biases which might liein the data. The chances are about 68 out of 100 thatan estimate from the sample would differ from a com-plete census by less than the standard error. Thechances are about 95 out of 100 that the difference wouldbe less than twice the standard error and about 99 outof 100 that it would be less than 2?4times as large.
The relative standard error of an estimate is ob-tained by dividing the standard error of the estimate bythe estimate itself and is expressed as a percentageof the estimate. Included in this appendix are chartsfrom which the relative standard errors can be deter-mined for estimates shown in this report. In order toderive relative errors which would be applicable to awide variety of health statistics and which could beprepared at a moderate cost, a number of approxima-tions were required. As a result, the charts provide
60

an estimate of the approximate relative standard errorrather than the precise error for any specific aggre-gate or percentage.
Three classes of statistics for the health surveyare identified for purposes of estimating variances.
Nawow ~ange. —This class consists of(1) statisticswhich estimate a population attribute, e.g., the numberof persons in a particular income group, and (2) sta-tistics for which the measure for a single individual forthe period of reference is usually either O or 1, onoccasion may take on the value 2, and very rarely is 3.
Medium Yange. —This class consists of other sta-tistics for which the measure for a single individual forthe period of reference will rarely lie outside the rangeo to 5.
Wide Yange. —This cIass consists of statistics forwhich the measure for a single individual for the periodof reference frequently will range from Oto a number inexcess of 5, e.g., the number of days of bed disabilityexperienced during the year.
In addition to classifying variables according towhether they are narrow-, medium-, or wide-range,statistics in the survey are further defined as
Type A —Statistics on prevalence and incidencedata for which the period of reference inthe questionnaire is 12 months.
Type B—Incidence-type statistics for which theperiod of reference in the questionnaireis 2 weeks.
Type C— Statistics for which the reference periodis 6 months.
Only the charts on sampling error applicable todata contained in this report are presented.
General rules foy determining relative samplingmors.—The “guide” on page 62. together with the fol-lowing rules, will enable the reader to determine ap-proximate relative standard errors from the charts forestimates presented in this report.
Rule 1. Estimates of aggregates: Approximate rel-ative standard errors for estimates of ag-
gregates, such as the number of personswith a given characteristic, are obtainedfrom appropriate curves on page 63.The number of persons in the total U.S.population or in an age-sex class ofthe total population is adjusted to officialBureau of the Census figures and is notsubject to sampiing error.
Rule 2, Estimates of percentages in a percent dis-tribution: Relative standard errors forpercentages in a percent distribution of atotal are obtained from appropriate curveson page 64. For values which do not fall onone of the curves presented in the chart,visual interpolation will provide a satis-factory approximation.
Rule 3. Estimates of rates where the numevatoris a subckzss of the denominator: Thisrule applies for prevalence rates or wherea unit of the numerator occurs, with fewexceptions, only once in the year for anyone unit in the denominator. For example,in computing the rate of orthopedic impair-ments per 1,000 population, the numeratorconsisting of persons with the impairmentis a subclass of the denominator which in-cludes all persons in the population. Suchrates if converted to rates per 100 maybetreated as though they were percentagesand the relative standard errors obtainedfrom the chart, P8AN-M. Rates per 1,000,or on any other base, must first be con-verted to rates per 100; then the percentagechart will provide the relative standarderror per 100.
Rule 4. EstimateS.of vates where the numevator isnot a subclass of tlzedenominator: (Notre-quired for statistics presented in thisreport.)
61

Guide to Use of Relative Standard Error Charts
The code shown belowidentifiestheappropriate aggregate,ILpercentage;(2)thenumber of calendarcurve to be used in estimatingtherelativestandard quartersofdatacollection;(3)thetypeofthestatisticerrorofthestatisticdescribed.The fourcomponents as describedon page 61;and(4)therangeofthesta-of eachcode describethestatisticas follows:(1)A= tisticasdescribedon page61.
Statistic
Number of:Impairments,by type---------------------------------
Persons in the U.S. population,or totalnumber ofpersons in any age-sex category---------------------
Percentagedistributionof:Impairments,by characteristic---------y-------------
Prevalencerates of impairments:Per 1,000 total populationor per 1,000 persons inany subgroupof the total U.S. population-----------
Use:
Rule Code on page
~Not subject to samplingerror
2
3
P8AN-M
P8AN-M
63
64
64
62

Relative standard errors for aggregates based on eight quarters of data collectionfor data of all types and ranges
100 1,000 10,000 100,OFO
Size of estimate (in thousands)
E=mple of use of chart: An aggregate of 5,000,000 (on scale at bottom of chart) for aNarrow range type A statistic (code: A8AN) has a relative standard error of 1.9 percent,read from scale at left side of chart, or a standard error of 95,000 (1.9 percent of5,000,000). For a. Wide range type B statistic (code: A8BW), an aggregate of 10,000,000has a relative error of 9,3 percent or a standard error of 930,000 (9.3 percent of10,000,000).
63

10Q
60
50
40
30
20
‘aix
ill.?.5
.7
.$
.3
.11
Relative standard errors for percentages based on eight quarters of data collectionfor type A data, Narrow and Medium range
(Base of percentage shown on curves in millions)
II 11111 !1!1,1’1 I I I I I I 1’[. . ..
i~,,,, I* I 1’1 I 1 I ! 1 1 I I ! I 1 1“1,. ,.. (
lx , . ,, , I ,,7~-,1,., . . .,
‘~, ,-:, .: .’ ”,’” ., :....., :.!:,., ..:.:: ::;:
ICode: PSAN~M
Type Adata
Narrow and medium
1 10 100
Estimated percentage
Example of use of chart: An estimate of 20 percent (on scale at bottom of chart) basea onan estimate of 10,OOO,OOO has a relative standard error of 2.8 percent (read from the scaleat the left side of the chart), the point at which the curve for a base of 10,000,000 in-tersects the vertical line for 20 percent. me standard error in percentage points isequal to 20 percent X 2.8 percent or 0.56 percentage points.
64

APPENDIX II
DEFINITIONS OF CERTAIN TERMS USED IN THIS REPORT AND
cLAsswcATIobI OF IMPAIRMENTS(x-coDE)
Demographic and Economic Terms
Age. —The age recorded for each person is the ageat last birthday. Age is recorded in single years andgrouped in a variety of distributions depending upon thepurpose of the table.
Color. -The population is divided into two groupsaccording to color, “white” and “nonwhite.” Nonwhiteincludes Negro, American Indian, Chinese, Japanese,and so forth. Mexican persons are included with whitepersons unless definitely known to be of another race.
Income of family OYof urn-elated individuals. —Eachmember of a family is classified according to the totalincome of the family of which he is a member. Withinthe household all persons related to each other by blood,marriage, or adoption constitute a family. Unrelatedindividuals are classified according to their own income.
The income recorded is the total of all income re-ceived by members of the family in the 12-monthperiod preceding the week of interview. Income from allsources is included, e.g., wages, salaries, rents fromproperty, pensions, and help from relatives.
Re.@on.—For the purpose of classifying the pop-ulation by geographic area, the States are grouped intofour regions. These regions, which correspond to thoseused by the Bureau of the Census, are as follows:
Rep”on States Included
Northeast ------- Maine, New Hampshire, Vermont,hlassachusetts, Rhode Island,Connecticut, New York,New Jersey, Pennsylvania
North Central --- Michigan, Ohio, Indiana, Illinois,Wisconsin, Minnesota, Iowa,Missouri, North Dakota,South Dakota, Nebraska, Kansas
South ----------- Delaware, Maryland, District ofColumbia, Virginia, West Virginia,North Carolina, South Carolina,Georgia, Florida, Kentucky,Tennessee, Alabama, Mississippi,Arkansas, Louisiana, Oklahoma,Texas
West ----------- Montana, Idaho, Wyoming, Colorado,New Mexico, Arizona, Utah, Nevada,Alaska, Washington, Oregon,California, Hawaii
Terms Relating to Chronic Conditions
Condition. —A morbidity condition, or simply acondition, is any entry on the questionnaire which de-scribes a departure from a state of physical or mentalwell-being. It results from a positive response to oneof a series of “illness-recall” questions. In the codingand tabulating process, conditions are selected or clas-sified according to a number of different criteria, suchas whether they were medically attended, whether theyresulted in disability, whether they were acute or chron-ic, or according to the type of disease, injury, impair-merit, ”or symptom reported. For the purposes of eachpublished report or set of tables, only those conditionsrecorded on the questionnaire which satisfy certainstated criteria are included.
Conditions, except impairments, are coded by typeaccording to the International Classification of Diseaseswith certain modifications adopted to make the codemore suitable for a houaehold-interview-type survey.
Chvonic condition. — A condition is considered to bechronic if (1) it is described by the respondent in termsof one of the chronic diseases on the “Check List ofChronic Conditions” or in terms of one of the types ofimpairments on the “Check List of Impairments,” or(2) the condition is described by the respondent ashaving been first noticed more than 3 months be-fore the week of the interview.
All impairments are chronic conditions.Impairment. —Impairments are chronic or per-
manent defects, resulting from disease, injury, or con-genital malformation. They represent a decrease in orloss of ability to perform various functions, particularlythose of the musculoskeletal system and the senseorgans. All impairments are classified by means of aspecial supplementary code for impairments. Hence,code numbers for impairments in the Manual of theInternational Statistical Classification of Diseases,Injwies, and Causes of Death (ICD) are not used. In
65

the supplementary code (referred to as the X-Code),impairments are grouped according to the type offunctional impairment, site, and etiology. Type and siteare expressed by the numbers XOO-X99, and etiologyis indicated by adding to each type the appropriate 1-digit code from one of the two lists of etiologic factors. ‘The X-Code is shown later in this appendix, and de-tailed coding instructions are given in the HealthInterview Surveyts Medical Coding Manual and the ShovtIndex.
The selected types of impairments included in thisreport, with their X-Code inclusion numbers, are:
1.
2.
3.
4.
5.
6.
Visual impairments (XOO-X05)a. Severe visual impairments (XOO)b. Other visual impairments (XO1, X02, X03,
X05) 1
Hearing impairments (X06-X09)
Speech defects (X1O, Xl 1)
Absence of extremities (X20-X34)a. Absence of major extremities, i.e., arm,
leg, hand, or foot (X20-X24, X26-X30,X32, X33)
b. Absence of minor extremities, i.e., fin-ger(s) or toe(s) only (X25, X31, X34)
Paralysis, complete or partial (X40-X69)
Impairments (except paralysis or absence) oflimbs, back, trunk (X70-X79, X80-X89)
Etiology of impairments. —In this report the etiol-ogy of an impairment is its cause in terms of what therespondent considers the cause. The interviewer asksfor the cauae of each impairment reported. The listsof etiologic codes are shown at the end of this appendix.
Pevsons with chyonic conditions. —The estimatednumber of persons with chronic conditions is based onthe number of persons who, at the time of the interview,were reported to have one or more chronic condition.
Prevalence of conditions. —In general, prevalenceof conditions is the estimated number of conditions ofa specified type existing at a specified time or the av-erage number existing during a specified interval oftime. The prevalence of chronic conditions is definedas the number of chronic cases reported to be presentor assumed to be present at the time of the interview;those assumed to be present at the time of the inter-view are cases described by the respondent in termsof one of the chronic diseases on the “Check List ofChronic Conditions” and reported to have been presentat some time during the 12-month period prior to theinterview.
1Codes XO1-X05 were revised July 1, 1964. See text under “Visual
Impairments” and the list of X-Codes at the end of this appendix.
Terms Relating to Disability
Chronic activity limitation. — Persons with chronicconditions are classified into four categories accordingto the extent to which their activities are limited atpresent as a result of these conditions. Since the usualactivities of preschool children, school-age children,housewives, and workers and other persons differ, adifferent set of criteria is used for each group. Thereis a general similarity between them, however, as willbe seen in the descriptions of the four categories below:
1.
2.
Persona unable to cawy on major activity fovtheir group (major activity refers to ability towork, keep house, or go to school)
Preschool children: inability to take part inordinary play wf.th otherchildren.
School-age children: inability to go to school.
Housewives: inability to do any housework.
Workers and allother persons: inability to work at a job
or business.
Persona limited in the amount ov kind of majovactivity pevfomned (major activity refers toability to work, keep house, or go to school)
Preschool children:
School-age children:
Housewives:
Workers and allother persons:
limited in the amount orkind of play with otherchildren, e.g., need spe-cial rest periods, cannotplay strenuous games, -cannot play for long pe-riods at a time.
limited to certain typesof schools or in school at-tendance, e.g., need spe-cial schools or specialteaching, cannot go toschool full time or forlong periods at a time.
limited in amount or kindof housework, e.g., cannotlift children, wash or iron,or do housework for longperiods at a time.
limited in amount or kindof work, e.g., need spe-cial working aids or spe-cial rest periods at work,cannot work full time or
66

for long periods at a time, tivities, such as church,cannot do strenuous work. clubs, hobbies,civicproj-
3. Pevsorw not limited in major activity but other-ects, or shopping.
wise limited (major activity refers to ability to Workers and allwork, keep house, or go to ‘school) other persons: not limited in regular
Preschool children:
School-age childrem
Housewives:
not classified in this cate-gory.
not limited in going toschool but limited in par-ticipation in athletics orother extracurrictdar ac-tivities.
not limited in houseworkhut limited in other ac-
work activities but limit-ed in other activities,such as church, clubs,hobbies, civic projects,sports, or games.
4. Persons not limited in activitiesIncludes persons with chronic conditions whoseactivities are not limited in any of the ways de-scribed above.
CLASSIFICATION OF IMPAIRMENTS (X-Code)
History and Purpose
This classification of impairments was developed by the Division of Public Health Methods in theyears 1955-1956 in order to provide—in the relatively simple detail required for household-healthsurveys—a method of coding certain residuals of diseases and injuries so that both the present effectand the underlying cause could be reflected within one diagnostic code.
The X-Code is essentially a regrouping and expansion of the Supplementary Y-Codes, Y50-Y88, ofICD, Volulnc 1
Abbreviations and Special Use of Parentheses
NOS = not otherwise specifiedNEC = not elsewhere classified
In addition to the usual purpose, parentheses are used to enclose words or phrases that may or maynot be specified but, if used with a given diagnosis, do not change the code assignment of that diagnosis.For example, tlParalYsis (complete) bti legs x44” means that the code number is X44 whether or not
the modifier “complete” is specified; “glaucoma (congenital)” means that ccmgenital glaucoma is codedin the same manner as glaucoma not specified as congenital.
LIST OF IMPAIRMENTS, BY TYPE AND SITE (XOO-X99)
(The lists of l-digit etiology codes are shown following X99)
Impairment of Vision (XOO-X05) – Revised July 1, 19642
Xoo
Xo1
X02X03
X05
Visual impairment: Inability to read ordinary newspaper print with glasses, and impairmentindicating no useful vision in either eyeBlind in one eye, with impairment as in X03Blind in one eye, with impairment as in X05Visual impairment: Inability to recognize a friend walking on the other side of the street ANDother visual difficulty, but NOT as in XOO-X02Impaired vision except as in XOO-X03
—-2The X-Codes for visual impairments in use during the period July 1963-June 1964 were as follows:
XOO Inclusions the same as listed aboveXO1 Blind in one eye, other eye defective but not impaired as in S00X02 Blind in one eye, other eye good or not mentionedX05 Impaired vision except as in S00-S02, one or both eyes
See text uhder “Visual Imp&rrnents” for an explanation of the effect of the revision on estimatee presented in this repat.
67

Impairment of Hearing (X06-X09)
X06 Deafness, total, both ears including deaf-mutismIncludes persons, with or without speech, who are completely deaf and cannot be benefited bya hearing aid
X07 Impaired hearing, severeIncludes persons who have some hearing but cannot hear ordinary conversation (except withhearing aid)
X09 Impaired hearing except as in x06, X07Includes: deafness NOS; hard of hearing NOS; “trouble with hearing” NOS; impaired hearing,one or both ears, not classifiable to x06, X07
Impairment of Speech, intelligence, Special Sense (X1 O-X19)
X1O Stammering, stutteringXl 1 Other speech defect
ExcZudes deaf-mutism (X06) and cleft palate speech (X91)X12 LOSS or impairment of sense of smell and/or tasteX13 Loss or disturbance of sensation NECX14 Special learning disability ~affecting school progressX15 Mental deficiency, mongolismX16 Mental deficiency, severe except in mongolismX17 Mental deficiency, moderateX18 Mental deficiency, mildX19 Mental deficiency, degree not specified
Absence, Loss, Extremities, and Certain Other Sites (X20-X39)
UppeY Extremity
X20 Arm, at or above elbow, and arm NOSX21 Arm, below ellmw and above wristX22 Arms, bothX23 Hand, except finger(s) or thumb(s) onlyX24 Hands, both, except fingers or thumbs onlyX25 Finger(s) and/or thumb(s), only, one OYboth hands
LoweY Extremity
X26 Leg, at or above knee, and leg NOSX27 Leg, below knee and above ankleX28 Legs, bothX29 Foot, except toe(s) onlyX30 Feet, both, except toes onlyX31 Toe(s) only, one or both feet
Upper and LowGY Extremities
X32 One upper (arm or hand) with one lower (leg or foot), except digits onlyX33 Three or more (arm, hand, leg, foot) except digits onlyX34 Finger(s) and/or thumb(s) and toe(s)
Certuin OtheY Sites
X36 Absence, lungX37 Absence, kidneyX38 Absence, breastX39 Absence, rib, or other bone, joints, muscles, without loss of extremity
68

Paralysis, Complete or Partial, All Sites, Except as in XOO-X19 (X40-X69)
Paralysis NOS (Complete) of Extremities and Tnmk (X40-X49)
X40X41X42x43x44x45X46x47X48x49
Upper extremity, one, except finger(s) onlyUpper extremities, bothFinger(s) onlyLower extremity, one, any part except toe(s) onlyLower extremities, both (paraplegia)Toe(s) onlyParaplegia with bladder or anal sphincter involvementOne side of body, one upper and one lower, same side (hemiplegia)Three or more major members, or entire body (quadriplegic)Paralysis, NOS, or of other sites of extremities or trunk (complete)
Cerebral Palsy; Paralysis, Partial, of Extremities and Trunk (2Y50-X59)
Includes: Paresis, palsy, paralytic “weakness,” or “tremor”
X50
X51X52x53x54x59
Cerebral palsy (and synonyms)Includes “spastic” if present since birth (congenital)
Partial paralysis, arm(s) or finger(s)Partial paralysis, leg(s) any part(s) (“drags foot”)Partial paralysis, one side of body (hemiparesis)Partial paralysis, other sites of extremities or trunkPartial paralysis, palsy, paresis - NOS
Paralysis, Complete or Partial, Sites Except Extremities or Trunk (X60-X69)
X60 Paralysis, complete or partial, face (Bell’s palsy or paralyais)X61 Paralysis, complete or partial, bladder or anal sphincter, without mention of paralysis of
{~mremit iesX69 Paralysis, complete or partial, sites not of extremities, trunk, nor affecting special senses
or speech
Nonparalytic Orthopedic Impairment (Chronic) NEC (X70-X79)
Excludes:Includes:
paralysis (X40-X69); specified deformities in X80-X89 and all “disc” conditions (ICD 735)limitation of motion NEC; stiffness (complete or partial); “flail joint”; instability of joint;frankly ill-defined, symptomatic, but chronic difficulty, weakness, “trouble,” pain, swelling,“limping,” involving muscles, joints, limbs, back or trunk, of *WZ ca~e, cw due tohealed injuries 3 mos+ OY to past and now inactive diseases; old (3 mos+) sprains, strains,or dislocations with effect not elsewhere classifiable, or not stated.
Orthopedic Iinpainnent (Chronic) NEC Involm”ng:
X70x71X72x73
x74x75
X76x77
X78x79
Back NOS, spine NOS, vertebra NOS (low) (lumbosacral) (sacro-iliac) (entire)Cervical or thoracic region of back, spine, vertebraeCoccygeal region of back, spine, vertebrae (last bone of spine)Shoulder, upper arm, forearm above wrist; arm NOSWrist, hand, finger, thumb - sites in X73 not involvedHip and/or pelvis, alone, or with any other site in X70-X79
Excludes congenital dislocation of hip (X85.X)Knee, leg NOS, - hip not involvedAnkle, foot, toe, - sites in X76 not involved
Excludes impairments involving arches of fmt, feet (X82)Multiple sites NEC (back and legs) (fingers and toes) (legs and arms) (arms and back)Other and ill-defined sites “
Includes: rib; trunk NOS; “side” NOS; limping, staggering, stumbling, “trouble in walking,” NOSExcludes: jaw (X92); and at~ic gait (paralysis, partial)
69

Specified Deformity of Limbs, Back, Trunk (X80-X89)
X80 Curvature and other structural deformities of spine or back, except as in X81.XIncludes all structural deformities of spine or back, except spinabifidaExcludes chronic back conditions in X70-X72, and chronic disc conditions (735)
X81.X Spina bifida (with meningocele) (always congenital)X82X83X84
X85x86
X87x88
X89
Flatfoot (including weak or fallen arches and other difficulty with arches)ClubfootDeformity, other and multiple, lower extremity, NEC
Includes: genu valgum (knock knee); genu varum (howleg); tibial torsion; hammer toe; hal.luxvalgus or varus; any deformity of toe; deformity leg NOS, foot NEC, kneeExcludes X82, X83
Dislocation, congenital, and other deformity hip and/or pelvisDeformity, neck or shoulder regionIncludes: torticollis; Sprengel’s deformity; deformity of neck and/or shoulder
Deformity finger(s), thumb(s), onlyDeformity, upper extremity, except as in X86, X87
Includes deformity of: arm(s); hand(s) and finger(s), butExcludes deformity involving fingers, thumbs, only
Deformity, trunk hones, NECIncludes: pigeon breast; cervical rib; postural defect NEC
Defect, Abnormality, Special Impairment, NEC (X90-X99)
X90X91X92
x93x94x95X96x97X98x99
Disfigurement, scarring, face, nose, lips, earsCleft palate and harelip (with speech defect)Other dentofacial handicap
Includes: malocclusion; congenital anomalies of teeth; deformity or absence of jaw; absence,or deficient number of teeth; deformities of palate and of other oral structures NEC
Deformity of skull (hydrocephaly) (microcephaly)DwarfismGigantism (excessively overheight)Obesity (excessively overweight)Excessively underweightArtificial orifice (opening) or valve (surgical), any site (colostomy)Special impairment. ill-defined site
Includes:- “birtb injury” or “brain injury,” at ages 3 mos+, without statement about type ofresidual; deformed NEC, site or type not indicated. Includes also ill-defined “after effects,”of tuberculosis of bones and joints, gonococcal infection, poliomyelitis, encephalitis, ricketsExcludes “strokes” without mention of effects
LISTS OF 1-DIGIT ETIOLOGY CODES
Far Visual Impairments Only (XOO-X05) –Revised July 1, 19643
.0
.1
.2
.3
.4
.5
.6
Unknown or unspecified originCataract, any origin except as in .5-.9 (with any condition in .4)Cataract with glaucoma, any origin except as in .5-.9Glaucoma, any origin except as in .5-.9, without catmact (with any in .4)Other local eye diseases (any infection of eye)Diabetes (with cataract or glaucoma)Diseases of the arteries NEC
3In this report etiologic data for visual impairments are shown only for the JuIy 1964-June 1966 period.
70

.7 Vascular lesions, central nervous system (with arteriosclerosis) (with hypertension)
.8 Neoplasm
.9 Accident or injury except at birth
.X Congenital origin NEC or birth injury
.Y Conditions not in .0-.9 or ..X (noncongenital) (nontraumatic) (not localized to eye) (hereditary)(old age) (“age” NOS)
For All Impairments Except af Vision (X06-X99)
.0 Unknown or unspecified origin
.1 Tuberculosis, any site
.2 Poliomyelitis
.3 Other infection or inflammation; ulcer; any site (general) (local) (scarlet fever) (meningitis)(encephalitis) (arthritis) (osteomyelitis) (neuritis) (etc.)
.4 Neoplasm
.5 Diabetes (with gangrene)
.6 Diseases of arteries (with gangrene) (general arteriosclerosis)
.7 Vascular lesions, central nervous system
.8 Rickets and osteomalacia
.9 Accident or injury except at birth
.X Congenital origin or birth injury
.Y Diseases and conditions except as in .0-.9 or .X (noncongenital) (nontraumatic) (noninflammatory)(hereditary) (old age) (“age” NOS)
PREFERENCE RULES USED WHEN MULTIPLE ETIOLOGIES ARE GIVEN
For Visual Impairments On[y [XOO-X05)
Select one cause as follows:
.9 and any other(s): prefer .9 (injury);
.5 and any other(s) except .9: prefer .5 (diabetes);
.7 and any except .9 or .5: prefer .7 (vascular lesions, CNS);If .9, .5, .7 are not applicable: prefer .8 (neoplasm);”If .9, .5, .7, .8 are not applicable: prefer .6 (arteries NEC);If .5-.9 are not-involved, prefer any in .1-.4 over .X or .Y.If local diseases of eye, only, are mentioned, code:
cataract and glaucoma to .2cataract with any in .4 to .1
glaucoma with any in .4 to .3other multiple local eye diseases to .4
For All Impairments Except of Vision (X06-X99)
Select one cause as follows:
.9 and any other(s): prefer .9 (injury);
.7 and any except .9: prefer .7 (vascular lesions, CNS)If .9 or .7 are not applicable: prefer the etiology code for the cause that started the chain ofevents.
000
71

APPENDIX Ill . QUESTIONNAIRE.1 he items !relow show tho exact content and wording of the !msi c questimrmke used in the nationwide household survey of the U.S. National
Health Survey. The actual questionnaire is designed for a household as a unit and irrcl”des widitimral spaces for reports on more than one pereon,condition, acciderr(., or hospitalization. Such repetitive spaces are omitted in this illustration.
CONFIDENTIAL - The N::Io.+1 H,*lth S.W;Z m ..+.rizd by P+Ii. L.w 652 :f the !4th congress (7OSt.: 489; 42 U.S.C. 242c). N1 informationwhich would wmit :d..ttftc. t:.. of Khe mdivd..l wdl be field SICICdY Conftdcnrul. wdl be used only by persons ensas.d i. ..d for the Purposes
13UD5SZT BURSAU NO. 68-R620.10
of the survey, ..d will not be disclosed or ml...ed t. others for any other purposes (22 FR 1687)..—.
APPROVAL EXPIRES JULY 15, 196S
FOmM NHS.HIS.1 (FY.4S) flwl-d US. DEPARTMENT OF COMMERCE(7-2*.641 .
.“~CAL1 OF T?IZ CEt48U,ACTIM. AS COLLZCTINO A.ENT FOR 77-I= 1. C&scio...ice
U.S. PUBLIC HEALTH SERVICE of
NAT 1ON ALAl~EfRAL:915 S URVEY quesci.ntuim.
2. ., Ad&ss or descripri.n of locario. 3. Iden. 4. R&&l 5. sample 6. ;:u 7. a. segment No.Address
8. &ialcode
code
C!lYb. Segment type
I St.teI I I I I I
b. M*iIing .ddre.s if nor rhown in 2 . U Same .s shown in 2. [f this questionnaire is for 8. “‘EXTRA” unit in . B .x NTA segment, enter:Address .Secisl No. of
Item No.original ,Smnple If in NTA %~menc al=o enter
by which found“K
IsE
Afor FIRST unit lisce on SXOP.*F
CnY ,*C. SEGMENT LIST
SHEET NO. LfNE NO.~deI c. Nmme of specinl dwelling plnce
=
Ask items 9 ..d 10 ONLY if ‘(RtuaI” box is mtiked
10. a, COW or Rem free~ - Do.s thl. plac. hav. 10 or nmr. acr.s?
~] b. ~Rem_J--D..s At.pl.c.you r.ntfmv. 10.rmor...s?s? I
[O Yes
7c.During th. P..+ 12 months didsol.. of cr.Ps, Iiv.+a.k, andoth.r farm products from ~h.pi... amount to $s0 Or m.,.?
1
2= Yes 4QN0
I, d. During tho past 12 months
I did SObS Of .r0P5, hV9-1 stock, and orh.r farmII
products from th. PI.c.
Iamount t. $2S0 ., more?
11I 3 n Yes saNo1I
r“ I
iINTERVIEWER: Check T.ble I for disberes. Enter tbe c.lu!
SEno persons with di.beres, check the “NOI
, 1 I , 1
11. Type of living quarters (Ch..k on. box)
D Hotwimg Unit m Other unit
ALL sefmenm (ask if item 2 a .ddrcss identifies s SINGLE-UNIT .Uuccure).
12 Ar. them any occ.pl.d o, va..mt living q.ort.m BESIDES YOUR OWN --. . I. the b.xmnen!? . . . . . m Y,s--S_ L a No
--.. thlsfloor? . . . . . . . aYes--S L U No. . 0. my e,her floor
of this building? . . . . . D Yes--S— L l_J No(FiN T.bh X for each qtmrter# NOT ?is&d)
ALL se ments (s’k if item 2 a identifies ●nrire floor or ur.mmbered pan of floor in sMULTf-&JIT structure).
13, Am them any ec.upi.d O, v...”t Ii,lng quart.,. BESIDES YOUR OWN --If item 28 identifies entire floor
. . .n ,hi, floor?
If item 2 s identifies Parr of floor, specify part a Yes--S_L —= No
-- in th. -. of this floor? (FII1 Table X for each quarters NOT listed).
TA .“d NTA segments (ask m mll unirs EXCEP S’APARTMENT HOUSES).14. Is th.r. ,.ny .th.r buildipg . . this pr.p.rty for P.OPI. m Iiv. in - .Nh.r oc..pi.d or v.c.”t?
=Yes--S_ L —DNo
(Fill Table X for each qu.rf.r. NOT Ifst.d)
I Telepbo”e No.
15. What is th. t.!aphon. numb.r h...? ~
numbers of .11 Frsons who have been repomd .s b.vir..g diabetes.II box.
m Nose (Le.ve ‘Thank You” lecmr and depsrc)D column““rnbers —, .—, —, —.f:jl~;;bc,tCShsu;P&aemr
16. RECORO OF CALLS AT HOUSEHOLDItem I 1 I corn. I 2 Icom.1 3 i cm. I 4 I coal. I 5 I coin.
, I I
Entire household -D~c: - --------Time
--------
DateRecordof return Cccl. No .—calls forindividual Dmerespondents
Co]. No_ Time
17, REASON FOR NONINTERVIEW
TYPE+ A B c z
~ R,fusd (m.ctlbi In Fo.atnot..) m w.=t – m..eas..d o Dmr.olisb.d Ir.ret-view nor obmined for:
o l$c.nc mr home - repeated n Vmcmc - Se.send o I. sunple by mistskeu Uaumf re8idence ●lsewhere o Eliminated i. sub-scm~le COls.
Reason + 0 Temporarily absent ~ Armed Forces D Built after April 1, 1962 because:
m Other isP..dfY> o Other (sp.clfy) CI Ocher (sP.cJir.)
1s. st.gn.cuxeof hmerviewer 19. Code
I FOR OFFICEUSE ONLY 01 02 D3 04 05 06 07 08
FOOTNOTES ANO COMhfENTSII
FOR_OB5ERVE0 HOUSEHOLOI
II (slgrmure of C+server)1
TABLE X - LIVING QUARTERS DETERMINATIONS AT LISTEO ADDRESSA,. th.,. USE OR CHARACTERISTICS(np.cify loc*-
CLASSIFICATION IF HU IN B SEGMENT ASK
f1.”) quart.,’ OCCUPIED ALL QUARTERS Nm n 1“ wh.t y.arfor more th.a” LOCATION
(If before J&y 196J3)Do th. OCCU. De th.se (3P..IIY hmthm) :Py
W*,* th. soj r#;r an;:: o~:p
Whet was th. nameOF UNIT pants of quart.,. ho..:
P(Add Fill (~*elry l“’’um~ e{ th. hsux.hold
th~n* (%*cffy O[f.c, .Cc.ss A kltch.n or .c.u- =epmr~ce q“mfwr.~ nure
h..d of thes.I.e.rf.r,) quor. f er.at.d?
Yes No. Item.$ No. (EX.81P1**:
,*,s k and <d: ;: Ouf- :;:$m+ ::;* &%’& j:m;.:,:fg,, TG:Y 0“ ‘p’” “ Rmnsrks(Fill
d Jr,..m.nt, ●ot with .IIY ,h,e”gh ~2$
for .Xcluslv. q“.m- lncem’ewlnd 110.,)
oth., g~”p=ommon hell? “s.? fr f{r.t half or
far of p.opl.? tfm- , ,~,, ,f ,., f h., f.)
.a.ah “.1,.)
m.Pl Ye’ No Kc. No Ye’ No HU tjj:?;
(1) (2) (s*) (3b) (4) (5.) (5b) (’sa) (6b) (7.) (7b) (B) (9.) (9b\ ( 10) (11) (12)
1
73

1. . . Wh.* is the nom. of *h. head of this ho..ph.ld? (Enter name i. first column)b. Whm are the name. .+ .11 other person. who Ii V. her.? (List .11 persons who live here). . 1 have listed (Read names). Is th.,. any... . 1s. staying here now, such os friends, relatives, or roamers? 0 Yes* m Nod. Hove I missed ..yonewh. USUALLY Ii”.. h.,. but Is “.W away from home? , . . . . . . . . . . . . . . . . . . . 0 Y.,* O No. . D. any of the people in this household hove . home anywhere else? . . . . . . . . . . . . . . . . . , . . . , . . , . n Yes* n No
If my adult maIes listed, ask: ● Apply household mcmbembip NI .s
f. Are any of the per. . . . i. this household now . . full-time .CNV. duty with the Armed Forces of theU“lted St.t.s? . . . . . . . . . . . . . . . . . . . . . . . . . . . . . . . . . . . . . . . . . . s . . . . . . . . . . . . . . . . . . U Yes [D.M.) O No
2. Enter ml.cic.nship to head: for example, wife, daughter, grandson, mother-in-law, partner, roomer, roomer’s wife, etc.
3. How old were you . . your lost birthdoy? (Also, check Race and Sex for each person)
Last name o
.---- ——--———---Fit*, name
If 17 ye.rsoldoc over, ask: (Upule.r. th.tper.on. mdec 17 .reorh.ve been Dud 17 Y,S.Areyo. omvmmded, widowed, divorced, separated, orn.vermarri.d?
n Never marriedmarried (ocher than annulled) check the “Uad.r 17 yr.s.~~
(Check one box for each per...)O Minded O LNvorced
b.x but Sivem.rit.l SC.CUSin . f.otoote,) O W,dowed n Sep.,mted
For all persons 17 years old or over, ask:
o. Dld y.. work a? any time I.st week or the week before? (For females add) - not counting work around the ho...?nund. 17yrs.
a. n Yes
If “No,” ask BOTH Q. Sb and 5.:n No---------------
b. E... th..gb ye.. did not work during the past 2 week., do y.. have a lob or business?b. o Yes o No
. . Were you looking for work or . . Layoff front a lob?---------------
If “Yes,” to Q. 5c, ask:c. o Yes D N.
d. Which - looking for work or on layoff from . iob?
——— — — ----------
If male 45 years old or over mnd .11 “No’s,” .s~d. O L..k,rw O Layoff r= Both
—--- ———-— —-—---
e. Am y.. retired? a. a Yes o No
If related erso”s 19 year. old or over U. listed in addition to the respondent, say
H fWe would Ike to hove d I od.lts who ore at home take part in the interview. 1. your --, Your --, 8?.., of home now?n .& home 0, Under lp yea,,
If other cfigible respondents are at home, ask:(Interview a Not ., home
Would you please ask --, --, .1.., r. loin .s?for self)
This s.rvey covers .I1 kind’ of 111.. s..s. Thea. first qu.stl. n. refer to LAST WEEK AND THE WEEK BEFORE, th.t i., the period Q Yesoutlined i. red . . this calendar. (Hand calendar)
o0 No
. . w.- y.. sick .t ..y tIm. LAST WEEK OR THE WEEK BEFORE - (the 2 weeks show. on that ..lendmr)?b. What was the nmtte,?C. Did yO” have .anyth!ng .1s. d.ring th.t p.rl.d?
-------------------------------------------------------------- ---------------, 0. LAST WEEK OR THE WEEK BE FORE, dldyoutake ..ym.dl.ine .rtr..ti.nt f.r.nycondlti.. (beside’, ,.whlch youmldm. .b..t)?, o ye.
b. F.arwh.t..ndltion?m No
c. Did you t.k. any m.dl.lnefora”y other c..d!tlo”?-------------------------------------------------------------- ---------- —----
. . LAST WEEK OR THE WEEK BEFORE, did you have any o..identsor i.1.rlc.s?b. What were they?
o Y=. n No
c. Old ye. hove o“y other accidents or f“i”,i.S du,l”g *hot 2 week period?-------------------------------------------------------------- ---------------a. Old . . EVER have . . (any other) accident or [.Iwy ?hat .NII bother. you m affects y.. 1. any wny?
1‘ b. 1. w at way doe. it bother y..? (Record pr.se”c effects)o Yes D N.
Now I am going m mod o list of conditi.”s. n Yes (1)1. Please tell me if y.., your --, et.., hove had my of these co.di!l.”s DURING THE PAST 12 MONTHS?
O No
(Read Card A, condition by condition; record in his column any conditions m.nrioncd for the person)
-------------------------------------------------------------- -------- —------. Do you, your --, et.., have a“y of THESE ..andlti.a”s? n Yes D No
(Red Card B, co”dicio. by co”dirion; recurd i“ his column any conditions mencio”ed for the person)
!. a. Do you have any .th., ailment,, co”dlrl.m., o, problems WIth y.., heolth?b. What is the c.ndk.n? (Record condition itself if still prc?ent;
O Yesotherwise record present effects. )
o N.
c. Any other problem. with yew he.lth?
1.0. Have you bean in a hospltol at any time since a year ago? m Yes o = No
If “Yes,” ash fnclude stays im,”~si”g homes,
b. How m.”y times w.r. y.. in the h.spit.l d.ring that period? rest homes, or SLnulac plsces.No. of times
R For persom 19 years old or over, show who responded for (or we.. present duti..q the asking of) Q. 6-13. If persons
(For
O Responded for wlf - entirely
responded for elf, show whether entirely or partly. For persons under 19 show who responded for them. If eligible
1.6- 13)
o Respond.d I., self - P.dY
respond.”t is “.C home” but did not respond for self, enter the reason in a footnote. cd. was respo.d.nt
lNTERVIEWkR: Check Table 1 for eye conditions or vision problems (i”cl”dir.& cataracts mud glaucoma) affecting persons 6 years old U No eye m“~icio. or
cm over. For each such person ask: __~.d~,~LeEs ________
14. G C.. y.. see wd i enough to rood .rdl..ary n.wsp.p., prl.t with glasses? m Ye, (.4.k b)If “Yes” to a, ask:
n No (STO----- — _________
b. Can y.. . . . well e“c.ugh to recognize . f,l.nd walking o“ the other side of the street?I-J Ye, (STOP) a No (A.k
If “No” to b, ask:_______________n Great deaf
. . How much trouble would Y.. say that you hove in .e.l.g -- a sre.t deal, some, or hordly ..Y at .Il?o some
D Hamffy any o, None
I INTERVIEWER: Examine ages in question 3 for children .“. year old or .“der, then check ch. appropriate box in question 15 a.
I I I15. m m Baby (babies) one year or i
I b. Ar= birt.fds) for b.by (babies) ~ c. Was- - born in the hospital? \ d. Wh.. we. -. b.m? (Et., m..th, Ay -d ~.,junder fisted. (e. to Q. 15 b) , a“d dekvery for mother shown 1
m No baby (babies) o“e yem I in Table U? a ye. (Go to Q. 25 d i
I m No (Q. t. Q. 16) Monthor “ndm listed, (% to Q. 16)1
Day Year -a Yes ?% m Q. 16) I
I nN. f130t. Q.15d(If bfrfAd.t. 1. on or .ft.r date .h.vm In qu..tlon 10, fill . . . IIne of
/ Table II for mother and on. 11.. 1., child,~ ~
1
Now I have some question. b..+ p.r.h . . . . of medicine. First, I wont t. ask Y.. about medicines prescribed by a doctor - -
6. . . LAST WEEK OR THE WEEK BEFORE, dld any... i. the ~mlly buy or .btol. any kind of medicine prescribed by a doctor?
D Yes m No fG. ,. Q. 17)
If “Yes, ” ask:
b. What IS the nom. of the medicine? (Enter ..me of medicine in column (.) of T.ble P. If name is unknown, enter “DK” in column (a) andask What condition i. 1? for? The. enter the .ondit,on in .cdum” (b).)
. . LAST WEEK OR THE WEEK BEFORE, did my... buy or obtain any OTHER medicine prescribed by . doctor?
D YeS (R.-. Sk Q. 16b) n No (Fxll mmolnfna c.lumna Of Table P for each m.dlcln.a rworled)
74

Turn to Csrd J, and ask:
7. m LAST WEEK OR THE WEEK BEFORE, did .any.ne in th. family buy or obtain any rn.dicin. NOTPr... rrd.d by . d..i.r? This (Sh.w Cwd 1) i. . fist of SOME of the items i. which w. ❑ r. i.wr.st.d.
D Yes n No (Go to Q. 18) INTERVIEWER
If “Y..,” ●sk: “lrapainnems,, or
b. What 1. *h. n.m. .f the m.di.i..? (EIImr nam. OZkind of ~=di.ine to COIW. (.) of Tabt. NP.)“condicions,s cm Card Areported in question 16
., LAST WEEK OR THE WEEK BEFORE, did ony.n. b.y or obt. in .ny OTHER medic l.. NOT pr... rid.d by . doctor?or 17, should be c.criedback to Table I if they
m YCS (Re-e-k(2.f7b) a No (Fill rmalnlna column. of Table NP to, each mdfc{ne rePorted)do not already .pp,arthere.
.abl. P - PRESCRIBE MEDICINES
N.rne of medicine(If name ,s unknown enter “DK>’ Who! condltlon is the -- for?
Who was I* pmscdbd for? Which week W.. the -- bought,(,%1., column n“.mb.r How much did it ..s
I i. ..1. (*) and ~a:k CO1.(b).)LAST WEEK —or the WEEK
(b)or s.& BEFORE LAST? (d)
(.)mu.,. I cents
u L.st week O Week befoce 1-------------------- IO Before 2 weeks (STOP) $
. bl. NP - NON PRESCRIBED MEDICINESI
Nsme of medicineWhm IS !h. -- ~.n.r.lly &fly#-us.d for by this Which w..k wCS the -- bought, How much
(If r..me is unknow~,, enter family? LAST WEEK —or th. WEEKp#f~:=o,, ,EFORE LAST,
did it cost? Wh.ra w.. ii bought?the kind of med:canc) (e)
of ~.Tcy)(a) (b) (d) DON*CS IC,”CS (3I
o Last week o Week befrx. I n Drw .,.re n Other (Specify)— ---- —----- ---- I m Grocery store
n Before 2 weeks (STOP) s I m blail orde, houseNow I hav. a f.w q..sti..s about smokina -- 0
For each person 17 pars old or over, asfc D Under 17 Y,.,,
!. m. Have y.. crooked ot 1..s9 . . . h.ndrcd clgw.ttes d.ring your entir. Ii f.? = n y=If ‘{Ycs,$, ask:
o No (c% to 21)-----------------
b. Owing k. period wh.” y.. w.,. smoking the mozi, how nm”y cig.r.tt.’ . d.y did y.. .’..IIY smoke? b. Per day OR PCCweek
‘. n. Do you sm.ke cigar.tt.s “OW? a n Yes
If “Y..,” ask qu.?.rio”s 19b AND 19.. If “No,” go m question 2W.
n No (G. {o 20)---- -------------
b. On th, .v.ra!e, nb..t how nm.y cig.r.tt.s . day do p. srn.k.? b. Per day OR w week----- -------- ____
c. Tw.lv. month. ago, how many cig.ac.tt.s . day wer. you smoking? n same O D,dm,t smoke
G per day OR p- week----- ------------
If “No” to question 19a, ask BOTH q.cs!io”< 20a AND 20b:cc. to W.., I.. 21
0 Non.
a. O. the av. mge, about how many .lgar. tt. s a day war. y.. snwki. g 12 nm”ths ago? . De, day OR P= =.ek
b. How long he. i~ b... since you srnok.d .ig.ar.Nes fairly r.gulady?
------ ------ ----- .
b. months OR ym,s
For each mol. 17 years old or over ask questions 21 AND 22: D Fem. .1 und.z 17. m Ha,. y., ,m.k.d at l...+ 10 cigars d.,ing Y.., .ntlr. Ilf.? - 0 y.. a No (OO i. 22)
b. 0. YOU.mok. CIIP,S now?-------- ------- --
If “Yes” 102 lb, 8Shb. = Yes (Ask c) m No (A.k d)-------------- ---
. . Akwt how nm”y . Igar’ ❑ dmy do you . . wily snmk.?r’.: Pe c
=. -+7-- .-12B-w+ ---
If “No” co 21b, ash
d. Abaut how long k-m N bmm since you snmk.d 3 c+ mora clwrs a w..k?months _OR ye,rs _
d, m NEVER smoked 3 or mom . week.0. Hsv. you .rnoked at I..st 3 pa.k.g.s of pipe tobacco during yaw .“tir. [i f.? m i-g Y.. m N. (2ToPJ
b. 0. yG+l‘Cd. a PIP+ now?--------- --------
If 4{Y,s11 to 22b, ask:b.
-----------------n Ye, (Ask c) D No (A.k o
c. About how “.”y plp.f”l’ of tobacco o day do y.” .stm[ly m’n.aim? OR f~ek
If “No’! to 22b, .skc. _&.-. - --- -=-
d. About hcw Io.g has It b... ‘In.e y.. .m.ked 3 or mom pipef.ls . w-k?manchs _ OR ye.,s _
d n NEVER smoked 3 or more . weekF., e.ch rnsfe 17 years old or over, .sk:
. 0. Old YOU.v.r serv. in th. Arm.d Fc.r..s of the Unit.d States?D Fem. ., urider 17
If “Yes,” ask:n Ye. O No----------------
b. W., .ny of you, .ervtc. during . war? O Yes (A.k d O NoCAnk CO
If “Yes,” ask:---------------- .
c. O.d.g which w,, dld y.. s.w.?o mu n Korean
23 **Nops to 23b, ask:m orb,,----------------
d. Was any of your ,.rvl c. b.tween J.”. 27, 19S0, and Jwtuary 31, 1955? Ig Yes ON.
If 17 ~CSCSold 0, WKr, ask:, a. What IS th. highest gr.d. you .tmnd.d in sch.acd? (Ctrcle \ighcst grzde attended or che& “None”.) -
U Under 17men: 12345678Hlgk 1234ColIe#e: I 2 3 4 5+O Noms
b. Did you finish *h. -- ~md. (y..,)?---------------- .m Yes a No
Tut” to Card K and ask: o. Which of th.s. i..wn. groups m r.s.nts your total cconbi..d family i...m. far the p.’t 12 m..fh., *hat is, y..r’s, your - -’s, ●t.?
Group
f(Show Card K). !.. l.d. l“come mm .11 sources, such as wag.., s.l.ri..r socinl security or r.tirmmnt fm..f its, h.lp frwn rdativ.s,rmt. frun Fi.petiy, d S. f.arfh.
75

—01.3.
x-
m
B)—
—
—
.
1!ues-,0.10.
(b)—
—
—
Table I - ILLNESSES,
~
Dld [f covditi.a., is cm C+ C, enter
ANY For all c,fier illnesses andTIME resent effect. of “old”
‘ktalk lni~ics - or
to a If doctor t.lked t., ask:d..t. hat did th. doctor say it was -
about Id he glvo lt a rnedl.cd ..mne.? a SYMPTOMr.., kM doctor NOT talked to, record. . .? ri in.1 entry and .sk (d-2) -
d-!) .s required. . .L––------–––---A .,
I‘M’%w&3’iik k?kwdf~~$m QuestioB 9 OrBEFORE, ask:What port of th. ~dy w.= h.,t? Whatwos th. ca.s. of. . .iWho? kind of Iniwy was 19?
(If “Cause” is a. injury,(For injuries or sccide”ts which ent=r-<AccidentV, .r
.ppened before the past 2 ‘Vni.ry)’ and fill Table A.eeks, enter the present effects.;
1.) I [.+1) I (d-2).-, , .- -.gYe*
~ No
m:imw.
(b)
IiPAIRMENTS, AND INJURIESKIND PART OF BOOY LAST WE-
For anyentcyi” col. (d-1) or Ask only f.c OR THECOI. (d.2) chat includes the IMPAIRMENTS, “CURRENT” WEEIwords: INJURSE$ ●nd PRESENT
nF %.n,e n--------
have toK cut down
rEFFECTS BEFORE for as., “mm dldyo.r. . . much as a
I-AX** Inl[mmnr,tion can’. y.” day?Allergy” Tumor 1.:; ,.:-- -Asthma “Condition”cyst ‘<Disease” Ache (except Neuralgia to cutGrowth “Trouble” head.the) NeuritisStroke ●
dmvmon theBleedir,.s Pain~$d clot .%,, things you
—----- —-- —— --.%.. . . . “’”ally do?
.Sk cancer T.mmWhafklmd of. . . iS It? cyst ulcer
Gmvnh Weak●For .“ ALLERGY or H.mouhaw WeaknessSTROKE, ask ,Snf.ction
What Qa,t of the body IS effected?Howdmesthe allergy
I
;b;w-d;t~ljo;----------- (Ch.d(stroke) dffoct you? Ea, o,e ●-(oncot bath)
1Head-(, ull,scmlp,face) No
Back -(upper, middSe, l.wer) (QOArm - (sh.auld&, u9Per, eltaw, IOw=, ~1,
w,ist, h.a& oneo, botk)Leg -(b+, upper, knee, lowm, ankle, ad
foot; one o, bmh)(d-3) (d-4) (e)I
one) (Oh.. ken.>
Yes No Y,.
+ (Go +f.cd.
m)
(n (6) (h)
.
T Table II - HOSPITALIZATIONSCol. USE YOUR CALENDAR
lNTEFWf EWER: No.
7
For what condition did yeu e~,ter the
You sold that you w.r. l. the How many Complete from entries inc.+ (c) and (dx h“’pl*”i -- de ye. knew the, medical name?of
Enter TOTAL hespltal(encqtwicq ●tc. )durlrw night’ w.r. or, ,f not clear ask the quesuons.
number qf Pep th. p..t y.or --hospic.lx~atio.s son
you 1. *h.hospital? How many of HOWm..y of W.r. y..
(If medical .ame not known, encec
recorded m Wh.ndld youmntor thmhospitolquestion 13.
these --r.sponde”c’. description.)
(thin last time)?these -- still in the
j fff exa .tnumber not
nighfs WW. .Ighfs ware hospitol (Entv must show CAUSE, KIND, ANDE (Enter mo”fh, dayandy.ar; if Srnou.n,accept 1. fh- POSt [.3Sf we-k last Sunday PART OF BODY in ssmedecail as2 exact date not k“oum, obtain bed estimate.) 12 m.nfhs? or tfw week “Ight? req”iredin Table I): e8ff,71d0.) befam?.-
<N”rnb*,J J (d
LIET.blc A - ACCIOENTS AND INJURIES
Li~mNo. 1.Whan dld !he a=cldant hnppm? 2. Atthetlme ofthaac.ld*nh what part of the body wos hurt? Wh.atkind of In(urywaslt? A.ythlngels.?
Table IYea Put(s) of body Kiid of injury (injuries)
::;~d H gt::~o~--
Iast week Month01 weekbefore(0. to Q.s)
3, a. Warn. car, truck, b.soro9h.r mot.rv&l.lo involvmd inthoaccldont fnanywq? . . . . . . . . . . . . . . . . . . . . . OY.S ON. (@to Q.4)
b. Wa’mor. thcm..e mowrv.hl.l* 1nv.lv.d? . . . . . . . . . . . . . . . . . . . . . . . . . . . . . . . . . . . . . . . . . . . . . . 0 Yes (Mote thm one) o No
.. Wo’lt(.ith. ton.) roovlngotth. tinm?, . . . . . . . . . . . . . . . . . . . . . . . . . . . . . . . . ...!.... . . . . . . . . 0 Yes o No
4. a. Wh*r*dldth. a.ctd..thopp.n - athomear sore. oth.rploc.?
I n At home (inside house) zOJAt borne (adjacent premises) u %n. ocher place
If “Someotherp lace,” ask:
b. What kind of Pldce was It?
30 Street .ndbighwsy (includes ro.dw.y) so School (includes school pzernisec)
4D Form 70 pke of recreation and sports, except at .cbool
so Industrial place (includes premise.) em other ($P*cIO NI. Pi... wh.m ..acld.”th+~.ned)
i. Wereyo. at work of your fob or b.dness A.. the occident happened?
lo Yes 20N0 S0 ~iIe in ~med,e.~i’”’ 40 Under 17 at time of .ccide”t
INTERVIEWER: R.tum to Table I and complete therescof this lin..
76

) T.I.L I _ II I NFSSFS NAPAIRMEN1
IHowmanydaysdld
Y..ha.. t.
cutdownduringthattwow..kp.,led?
(i)
,.. . .. . .--. .-----, . .. ..... .. ...rlng If 6-16 If “YCS” ff .01. (m) To
Dld yov flrsi .oti.. your . . . i, checked,lot two Y=acs Old. : $,5* (did H h.pp..) during th. post (ni*..
..k ask 3 months ., before that thn.? .sk: “[*WW
.ried, How many ask:
~1 i
Did you
0’+/ mmny days did How(’=h.ck on.) Did y.. first
flrstnoNc. CON-
.YS did your . . . m.ny it during TINUE
our . . . kup YOU d.y. did Be{.,. or- ‘“tic” ‘* th. past if col.
,ep y.” from y.. r... 3 ,6 (did N h.pp..) IZ month. (m) is
, bad all school keep yO” omhs1’
during the past or for. chcckec
r m.st of d.,ing from work (GO .s. 2 w..ks O, th t time? or the
,. day? that two during to b.fo,. that tlm.? COrldi-
w.ek that two cd. + If W)uring tim is
pied? w..k [P)) P*SC 2 weeks, “
p.rl.d?
o. Cardssk: A or isWhl .h week, an im-la.? week O; P.~*th. week before? ment;
Other-wise,
STOP
AND IN
iBOUT.W m,”)Icy,luringhe P.,t2 rn.n+h
,.*,.. r . . .,.pt youn bed,11 or,Ost ofhe day?
URIES - ContinuedAsk after competing 1.SC .ondicic.n for each
If 1 or If “Y..” P-so..more days C- .01. (.),in coI. (q) ask, PI.... If *1],,, q.. p~ea=e ]f ~~1~,.l~i$,
and .01. ABOUT look at or “3” i“ look at in COI. (v),
(i) is how m.”y ..ch Sf.t~ Cd.(r), ask, the t.” ask:bIank or times ml.”r 0“ this IS this cord, Is thischecked during ih. c.,d, because of Card [. b......“None:’ past 12 Card - -. 0.y of the Wkch of a“y ofSSk months (Show Card . ..~+i... .“* .f the . ..d-Ww. any have y.” E, F, G, or you hm,e those INO”S y.”of th. se S**” 0, H ?s appre ,O[d me ‘ta+e- told m.-- do y. talked te a ~’i’@ about? about?during doctor Th.n +.!1 If “Yes,” ;**;o” If “YC.,”[..t w..k ab..f w which ask: b..r, in “’k’. . the y..r ‘tat* m””* Which?
fits youterm, of :;;::;x O,
w..k . ..? (Enter X on h.a,+h.before? b.st, in line for Ii”. for
If<”Yes.” t.ms of each eachask:
I
h.alth. condition condk ionHow (If *’4”, go named.)
m.ny? m COL (v)) 11 named.)
1
(r) (s) (t) (“) # I (v) (w) +
W.,. O“Y .P.,.ti.”.p.rfwm.d 0“ yO. during
H-II. stay at th. hospital?
ff “Yes,” ssk:
. . What was th. “m. of *h. .p.mtlon?
b. Any oth.r .pmr.tio”s?
Ig Yes o N.
,so,. ,, - ““al-, , Al-,&*, ,“IXQ
Wet is th. n.m. md .ddres. c.f th. h.spitol y.. w.r. I.?
fEntet fidl name of hospital, .treet or highway on which ft is Zocated,city and St.te; if city not knom, enter county.)
(i)
N.me of hozw.iwl
‘&~r----------------------~-C~w-=d-S~at= -----------------
N.m. of h.spitaf
-------------------------------------------------S4rce[ ! CIIY and Stat.
N.me ofhospital-------------------------s,,.., f&y md %,.
----------------------
—
2
r3L
After completi.iTable 11 for .11persons, cayeach co”d,t,oni“ cd. (h) orCO1. (i) back toTable I if itdoes not alr..d:appear there ancberc arc “1” omore nights inco]. (f) ORthe entry i“ ..1(h) ., .01. (i)is = “~p.i~ment$ ‘ OR mco;itp on
77

;ard A
Check List of Chronic Conditions
L
2.
3.
4.
z
6.
7.
8.
9.0.
1.
2.
3.
4.
5.
Asthma
Tuberculosis
chronic bronchitis
Repeated attacks of sinus trouble
Rheumatic fever
Hardening of the arteries
High blood pressure
Heart trouble
Stroke
Trouble with varicose veins
Hemorrhoids or piles
Hay fevec
Tumor, cyst or growth
Chronic gallbladder or liver trouble
Stomach UICCI
16.
17.
18.
19.
20.
21.
22.
23,
24.
25.
26.
27.
28.
Any other chronic stomach
cmuble
IGdney stones or chronickidney trouble
hfental illness
Anbricis or ~heumatism
Diabetes
Tbymid trouble or goiter
Any allergy
Epilepsy
Chronic nervous trouble
Cancer
Cbmnic skin trouble
Hernia or Iuptuce
Prostate trouble
:ord B
L
2.
3.
4.
5,
6.
7.
8.
9.
0.
L
Check List of Selected Impairments
Deafness or serious trouble hearing with one of bxh ears
Serious trouble seeing with one or both eyes even when wearing glasses
CIeft palate
Any speech defect
Missing fingers, hand, or arm --- toes, foot, or leg
Palsy
Paralysis of any kind
Repeated trouble with back or epine
Club foot
Permanent stifhess or any deformity of the foot, Ieg, fingers, arm, or bacl
Any condition present since birth
Card E
For:Workers and other persons except
Housewives attd Children
L
2.
3.
4.
Not abIe to woIk at akL
Able m work but limited in amount
of work or kind of work.
Able m work buc Iimited in kind or amoumt
of ocher activities.
Not Iimited in any of tbe above ways.
Cord F
For: Housewife
L
2.
3.
4.
Not able to keep house at all.
Able to keep house but limited in amount
or kind of housework.
Able to keep house but limited in kind or
amount of other activities.
Not limited in any of the abave ways.
;wd G
:Or:
;hildren fmm 6 ihro.gh 16 years old
Not able to go to schooI at all.
!. Able to go to school but limited to certain
types of schooIs or in school attendance
L Able m go to school but limited in otbeI
activities.
i. Not limited in any of tbe atmve ways.
hwd H
‘or: Children under 6 years old
Not able to take part at all in ordinary
play with other children.
Able co play with other children but
limited in amount or kind of play.
Not limited in any of the alxve ways.
Curd I
For: Mobility
1. h{ust stay in bed all or most of the
time.
2. hfust stay in tbe house all or most of
tbe time.
3. Need the help of another person in
getting amu”d inside or outside the
house.
4. Need the help of some special aid,
such as a cane or wbeelcbair, in
getting am”nd inside or outside the
house.
5. Not limited in any of the above ways.
Card K
For: Total combfned family income
during past 12 mort!hs
Group A. Under $500 (Includhg loss)
GrouP B. $500- $S99
Group C. $1,000- $1,999
Group D. $2,000- $2,999
Group E. $3,000- $3,999
Group F. $4,000- $4,999
GmUP G. $5,000- $6,999
Group H. $7,000- $9,999
Group I. $10,000-$14,999
Group J. $15,000 and over

OUTLINE OF REPORT SERIES FOR VITAL AND HEALTH Statistics
Public Health Service Publication No. 1000
Series 1. Progvams and collection procedu~es.— Reports which describe the general programs of the National
Seyies 2.
SeYies 3.
Series 4.
Series 10.
Series 11.
SeFies 12.
Series 13.
SeTies 20.
SeFies 21.
Series 22.
Center for Health Statistics and its offices and divisions, data collection methods used, definitions,and other material necessary for understanding the data.
Data evaluation and inet?zods research. —Studies of new statistical methodology including: experi-mental tests of new survey methods, studies of vital statistics collection methods, new analyticaltechniques, objective evaluations of reliability of collected data, contributions to statistical theory.
Analytical studies.— Reports presenting analytical or interpretive studies based on vital and healthstatistics, carrying the analysis further than the ex~ository types of reports in the other series.
Documtmts and committee ~eports. — Final reports of major committees concerned with vital andhealth statistics, and documents such as recommended model vital registration laws and revised birthand death certificates.
Data from the Health Intwview Suvvey. —Statistics on illness, accidental injuries, disability, use ofhospital, medical, dental, and other services, and other health-related topics, based on data collectedin a continuing national household interview survey.
Data from tke Health Examination Szi~vey.— Data from direct examination, testing, and measure-ment of national samples of the population provide the basis for two types of reports: (1) estimatesof the medically defined prevalence of specific diseases in the United States and the distributions ofthe population with respect to physical, physiological, and psychological characteristics; and (2)analysis of relationships among the various measurements without reference to an es@icit finiteuniverse of persons.
Data from tke Institutional Population SuYveys.— Statistics relating to the health characteristics ofpersons in institutions, and on medical, nursing, and personal care received, based on nationalsamples of establishments providing these services and samples of the residents or patients.
Data from the Hospital DiscJlar@ SuYvey. -Statistics relating to discharged patients in short-stayhospitals, based on a sample of patient records in a national sample of hospitals.
Data on moytality. —Various statistics on mortality other than as included in annual or monthlyreports— special analyses by cause of death, age, and other demo~gaphic variables, also geographicand time series analyses.
Data on natality, wzayyiage, and divoyce. —Various statistics on natality, marriage, and divorce otherthan as included in annual or monthly reports—s pecial analyses by demographic variables, alsogeographic and time series analyses, studies of fertility.
Data fyom the National Natality anit Mortality Surveys. —Statistics on characteristics of births anddeaths not available from the vital records, based on sample surveys stemming from these records,including such topics as mortality by socioeconomic class, medical es~erience in the last year oflife, characteristics of pregnancy, etc.
For a list of titles of reports published in these series, write to: Office of Information
National Center for Health StatisticsU.S. Public Health ServiceWashington, D.C. 20201