FTIR study of surfactant bonding to FePt nanoparticles
7
Journal of Magnetism and Magnetic Materials 266 (2003) 178–184 FTIR study of surfactant bonding to FePt nanoparticles Nisha Shukla*, Chao Liu, Paul M. Jones, Dieter Weller Seagate Technology, 1251 Waterfront place, Pittsburgh, PA 15222, USA Received 27 November 2002; received in revised form 11 February 2003 Abstract FePt nanoparticles coated with 2 nm thick films of surfactant have been studied as candidates for magnetic recording media. The self-assembly of these nanoparticles is influenced by the properties of their surfaces which are coated with a layer of mixed oleic acid and oleyl amine. These surfactant coated FePt nanoparticles were characterized using Fourier transform infrared spectroscopy (FTIR). The observation of both n(COO) and n(C=O) vibrational modes indicates that oleic acid bonds to the FePt nanoparticles in both monodentate and bidentate forms. The oleylamine bonds to the FePt nanoparticles through electron donation from the nitrogen atom of the NH 2 group. The FTIR spectra indicate that there is a conversion of the alkyl chains from the oleyl form (cis-9-octadecenyl) to the elaidyl form (trans-9- octadecenyl) during the synthesis of the FePt nanoparticles. This is revealed by the presence of several vibrational absorption bands in the region of the olefinic C–H stretching modes. The presence of elaidyl groups on the FePt surfaces is very important because the structures of the oleyl groups and the elaidyl groups are quite different and are expected to pack differently around the FePt nanoparticles. This in turn will influence the self-assembly of nanoparticles on substrates. r 2003 Elsevier B.V. All rights reserved. PACS: 82.80.Gk; 83.80.Qr Keywords: Surfactants; Nanoparticles; FePt; FTIR 1. Introduction FePt nanoparticles have high magnetic aniso- tropy and have potential use as a magnetic medium for patterned data storage applications [1]. These nanoparticles are coated with surfactant films of mixed oleic acid (cis-9-octadecenoic acid) and oleylamine (cis-9-octadecenoic amine). The properties of these surfactant coatings control the stability of the particles in solution and the dynamics of their self-assembly on surfaces. Although there have been a number of studies of the self-assembly of FePt nanoparticles on sub- strates there are no prior studies of the surfactant coatings on the surfaces of these nanoparticles. The objective of this work is to characterize oleic acid and oleylamine surfactant coatings on FePt nanoparticles and to determine their mode of bonding to the nanoparticle surfaces. Films of unsaturated fatty acids and surfactants are widely used as surface coatings in electronics, optical, and biomedical applications [2,3]. As a result there have been a number of reports of the ARTICLE IN PRESS *Corresponding author. E-mail address: [email protected] (N. Shukla). 0304-8853/$ - see front matter r 2003 Elsevier B.V. All rights reserved. doi:10.1016/S0304-8853(03)00469-4
-
Upload
nisha-shukla -
Category
Documents
-
view
214 -
download
2
Transcript of FTIR study of surfactant bonding to FePt nanoparticles

ARTICLE IN PRESS
Journal of Magnetism and Magnetic Materials 266 (2003) 178–184
*Corresp
0304-8853/
doi:10.1016
FTIR study of surfactant bonding to FePt nanoparticles
Nisha Shukla*, Chao Liu, Paul M. Jones, Dieter Weller
Seagate Technology, 1251 Waterfront place, Pittsburgh, PA 15222, USA
Received 27 November 2002; received in revised form 11 February 2003
Abstract
FePt nanoparticles coated with 2 nm thick films of surfactant have been studied as candidates for magnetic recording
media. The self-assembly of these nanoparticles is influenced by the properties of their surfaces which are coated with a
layer of mixed oleic acid and oleyl amine. These surfactant coated FePt nanoparticles were characterized using Fourier
transform infrared spectroscopy (FTIR). The observation of both n(COO) and n(C=O) vibrational modes indicatesthat oleic acid bonds to the FePt nanoparticles in both monodentate and bidentate forms. The oleylamine bonds to the
FePt nanoparticles through electron donation from the nitrogen atom of the NH2 group. The FTIR spectra indicate
that there is a conversion of the alkyl chains from the oleyl form (cis-9-octadecenyl) to the elaidyl form (trans-9-
octadecenyl) during the synthesis of the FePt nanoparticles. This is revealed by the presence of several vibrational
absorption bands in the region of the olefinic C–H stretching modes. The presence of elaidyl groups on the FePt
surfaces is very important because the structures of the oleyl groups and the elaidyl groups are quite different and are
expected to pack differently around the FePt nanoparticles. This in turn will influence the self-assembly of nanoparticles
on substrates.
r 2003 Elsevier B.V. All rights reserved.
PACS: 82.80.Gk; 83.80.Qr
Keywords: Surfactants; Nanoparticles; FePt; FTIR
1. Introduction
FePt nanoparticles have high magnetic aniso-tropy and have potential use as a magneticmedium for patterned data storage applications[1]. These nanoparticles are coated with surfactantfilms of mixed oleic acid (cis-9-octadecenoic acid)and oleylamine (cis-9-octadecenoic amine). Theproperties of these surfactant coatings controlthe stability of the particles in solution and the
onding author.
address: [email protected] (N. Shukla).
$ - see front matter r 2003 Elsevier B.V. All rights reserve
/S0304-8853(03)00469-4
dynamics of their self-assembly on surfaces.Although there have been a number of studies ofthe self-assembly of FePt nanoparticles on sub-strates there are no prior studies of the surfactantcoatings on the surfaces of these nanoparticles.The objective of this work is to characterize oleicacid and oleylamine surfactant coatings on FePtnanoparticles and to determine their mode ofbonding to the nanoparticle surfaces.Films of unsaturated fatty acids and surfactants
are widely used as surface coatings in electronics,optical, and biomedical applications [2,3]. As aresult there have been a number of reports of the
d.
ARTICLE IN PRESS
N. Shukla et al. / Journal of Magnetism and Magnetic Materials 266 (2003) 178–184 179
characterization of oleic acid films adsorbed on thesurfaces of materials such as soda lime-silicate,silica glasses, soda-silicate [4,5], apatite, dolomite[6], and titania [7]. The Fourier transform infraredspectroscopy (FTIR) studies of oleic acid adsorp-tion on soda lime-silicate indicate that oleic acid isadsorbed on the soda lime-silicate as both metal-oleate and oleic acid hydrogen bonded to Si–OHsites [4,5]. In contrast, it has been reported thatoleic acid is adsorbed on fused silica only ashydrogen bonded oleic acid. On the soda-silicateglass it is reported that oleic acid completelydeprotonates and bonds to Na+ ions as oleate.Ince et al. [7] have reported that adsorption ofoleic acid on apatite and dolomite occurs pre-dominantly as oleate at pH=10, whereas at pH=4some fraction is present as oleic acid. Thistle-thwaite et al. [8] have reported that on the rutileform of TiO2, oleic acid adsorption at pH=3 and9 is dependent on the nature of the particular oxidesample. Oleic acid monomers are adsorbed to Ti4+
Lewis acid sites by coordination as s-bondedligands through the carbonyl group oxygen. Theoleic acid dimers were reported to bond to twoadjacent Lewis sites via their hydroxyl oxygenatoms. At pH=3 it was observed that theCH=CH group interacted with surface OH2
+
groups. In summary, there are a variety of modesof oleic acid bonding to surfaces that might beobserved on FePt nanoparticles.In this paper we have used FTIR to study a
mixture of oleic acid and oleylamine bonded to thesurfaces of FePt nanoparticles. We have observedthat oleylamine bonds molecularly to the nano-particle surfaces with the NH2 group intact. Oleicacid bonds to the FePt nanoparticles in bothmonodentate form (RC(=O)–O–M) and biden-tate form (RCO2–M). FTIR results also indicatethat there is some isomerization of the oleyl groupsfrom the cis form to the trans form (elaidyl groups)during synthesis of the FePt nanoparticles.Although several studies of oleic acid adsorbedon surfaces at room temperature have beenreported in the literature, none of these studieshave reported isomerization of oleic acid. Whilethe oleic acid films observed in prior studies wereadsorbed at room temperature, adsorption of oleicacid and oleylamine on the FePt nanoparticles
occurs at 286�C during synthesis and is accom-panied by isomerization. Our observation of theisomerization of the oleyl chains of oleic acid andoleylamine during FePt nanoparticle synthesisprovides insight into the formation of surfactantmonolayers on nanoparticles.
2. Experimental
FePt nanoparticles were prepared using thesynthesis described by Sun et al. [9,10]. In thissynthesis monodispersed FePt nanoparticles wereobtained by reaction of iron pentacarbonyl andplatinum (II) acetylacetonate in a solution ofdioctylether and surfactant. The surfactant usedduring synthesis was a 1:1 mixture of oleic acidand oleylamine. Once synthesized, the FePtnanoparticles were washed using a polar solvent(ethanol, CH3CH2OH) followed by washing with anon-polar solvent (hexane, C6H14).Following synthesis the nanoparticles were
subjected to additional washing cycles to removeexcess surfactant from the synthesis solution. The‘excess surfactant’ is the fraction in solution notbonded to the FePt nanoparticles. The originalmixture of surfactant coated nanoparticles andexcess surfactant in dioctylether was first mixedwith 10 parts of ethanol causing the particles toprecipitate. The mixture was centrifuged to sepa-rate the particles from the solution. The super-natant solvent consisting of dioctylether andsmaller nanoparticles was then discarded and thenanoparticles were redispersed in non-polar hex-ane. This sequence of precipitation in ethanol,centrifuging to separate the solvent, and redisper-sion in hexane was then repeated three times.Finally, the nanoparticles were dispersed inhexane. This procedure was sufficient to producea dispersion of 3–4 nm diameter FePt nanoparti-cles suspended in hexane with no surfactant in thesolution.The nanoparticles were characterized using
FTIR. In order to obtain the FTIR spectra adrop of the nanoparticle solution was placed onthe surface of a diamond attenuated total reflec-tance (ATR) FTIR cell and the solvent wasallowed to dry. All FTIR spectra were taken using
ARTICLE IN PRESS
1000 1200 1400 1600 2400 2600 2800 3000 3200 3400
2670
2922
1709
1648
2854
3006
Inte
nsity
Wavenumber (cm-1)
N. Shukla et al. / Journal of Magnetism and Magnetic Materials 266 (2003) 178–184180
a Nicolet Nexus 670 spectrometer with a deuter-ated triglyceride sulfate (DTGS) detector. Spectrawere obtained using 4 cm�1 resolution and 32scans were taken for statistical averaging. FTIRspectra of the pure samples of oleic acid, elaidicacid, and oleyl amine were obtained by putting adrop of the surfactant dissolved in hexane onto thediamond ATR cell and letting the solvent evapo-rate before taking the spectrum.The oleic acid, oleylamine, elaidic acid, ethanol,
and hexane (anhydrous) were bought from AldrichChemical Co. and were used without furtherpurification. The ethanol was obtained in sure sealbottles with very low water content (o0.002%).
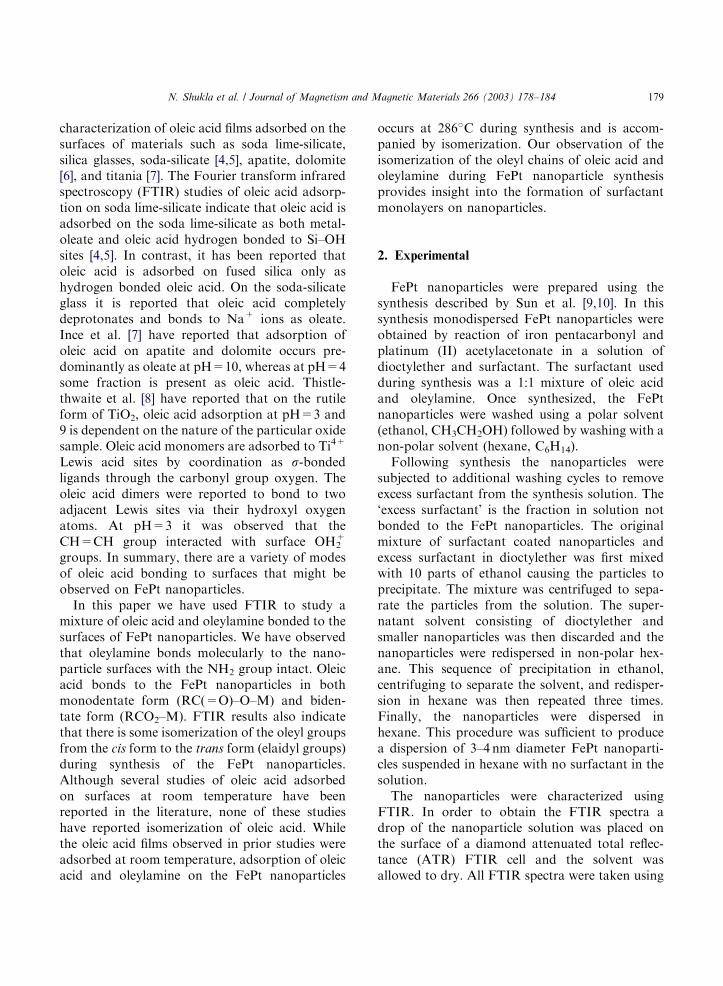
Fig. 1. FTIR spectra of pure oleic acid in 1000–3500 cm�1
region.
3300
1593
1647 3006
2922
2854
1000 1200 1400 1600 2400 2600 2800 3000 3200 3400
Inte
nsity
Wavenumber (cm-1)
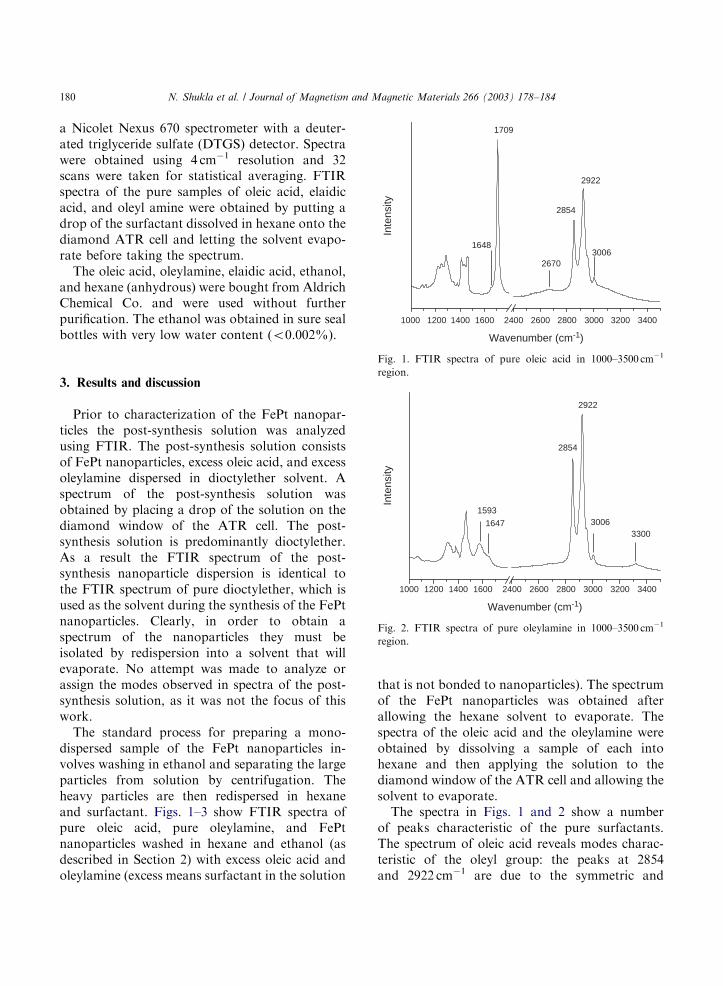
Fig. 2. FTIR spectra of pure oleylamine in 1000–3500 cm�1
region.
3. Results and discussion
Prior to characterization of the FePt nanopar-ticles the post-synthesis solution was analyzedusing FTIR. The post-synthesis solution consistsof FePt nanoparticles, excess oleic acid, and excessoleylamine dispersed in dioctylether solvent. Aspectrum of the post-synthesis solution wasobtained by placing a drop of the solution on thediamond window of the ATR cell. The post-synthesis solution is predominantly dioctylether.As a result the FTIR spectrum of the post-synthesis nanoparticle dispersion is identical tothe FTIR spectrum of pure dioctylether, which isused as the solvent during the synthesis of the FePtnanoparticles. Clearly, in order to obtain aspectrum of the nanoparticles they must beisolated by redispersion into a solvent that willevaporate. No attempt was made to analyze orassign the modes observed in spectra of the post-synthesis solution, as it was not the focus of thiswork.The standard process for preparing a mono-
dispersed sample of the FePt nanoparticles in-volves washing in ethanol and separating the largeparticles from solution by centrifugation. Theheavy particles are then redispersed in hexaneand surfactant. Figs. 1–3 show FTIR spectra ofpure oleic acid, pure oleylamine, and FePtnanoparticles washed in hexane and ethanol (asdescribed in Section 2) with excess oleic acid andoleylamine (excess means surfactant in the solution
that is not bonded to nanoparticles). The spectrumof the FePt nanoparticles was obtained afterallowing the hexane solvent to evaporate. Thespectra of the oleic acid and the oleylamine wereobtained by dissolving a sample of each intohexane and then applying the solution to thediamond window of the ATR cell and allowing thesolvent to evaporate.The spectra in Figs. 1 and 2 show a number
of peaks characteristic of the pure surfactants.The spectrum of oleic acid reveals modes charac-teristic of the oleyl group: the peaks at 2854and 2922 cm�1 are due to the symmetric and
ARTICLE IN PRESS
+ CO
OR
3006
2922
2854
1626
1565
1000 1200 1400 1600 2400 2600 2800 3000 3200 3400
Inte
nsity
Wavenumber (cm-1)
NH3R
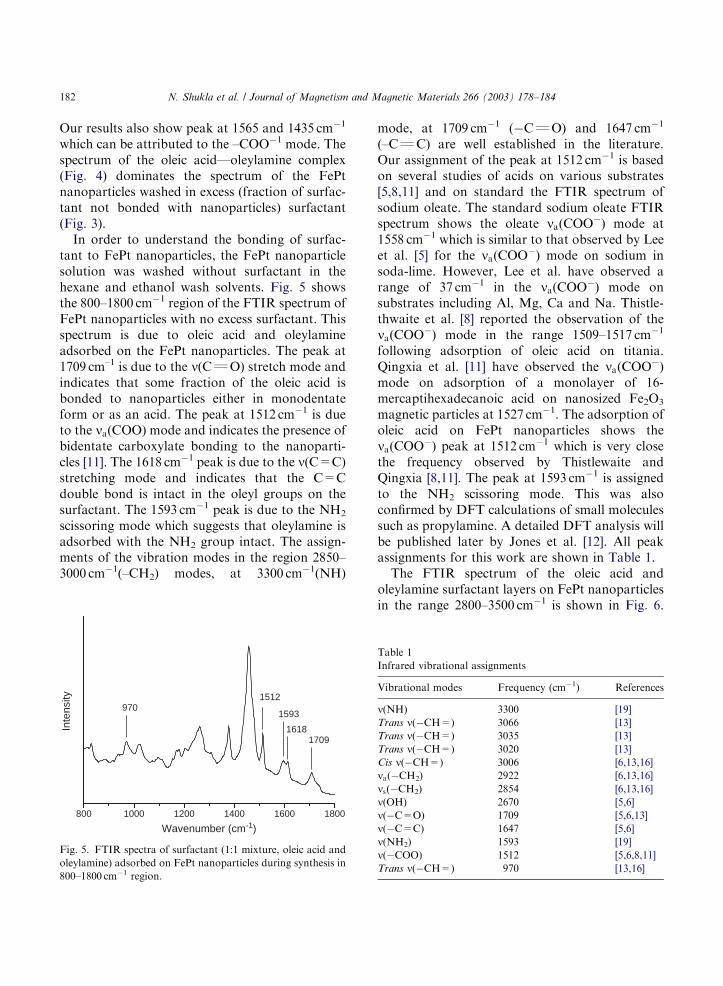
Fig. 4. FTIR spectra of pure surfactant mixture (1:1, oleic acid
and oleylamine) in 1000–3500 cm�1 region.
3006
2922
2854
1626
1565
1000 1200 1400 1600 2400 2600 2800 3000 3200 3400
Inte
nsity
Wavenumber (cm-1)
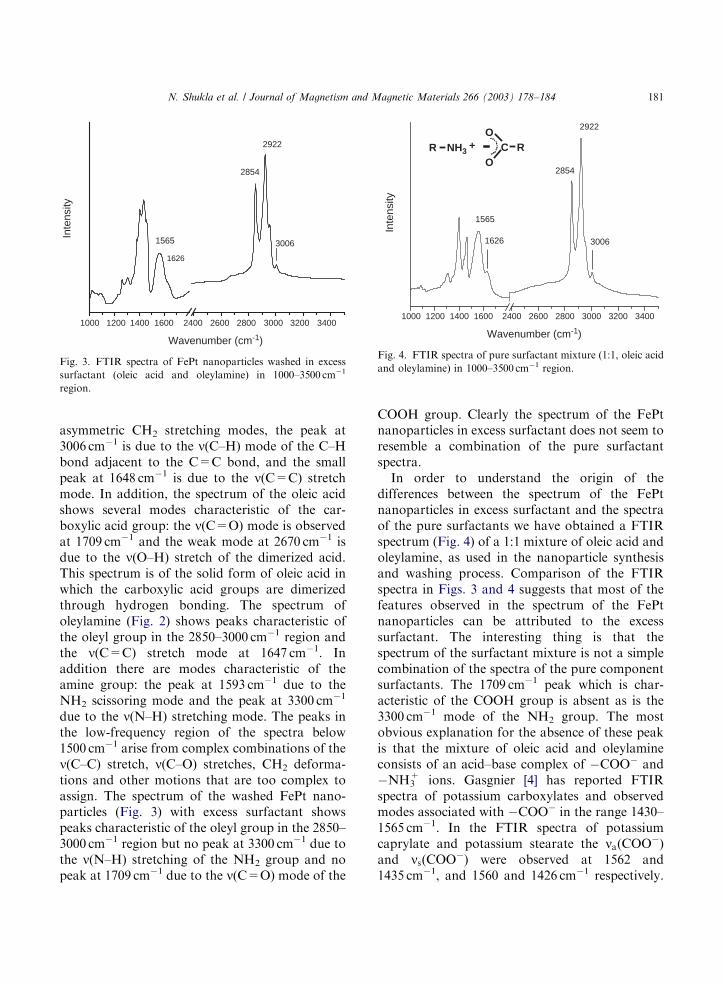
Fig. 3. FTIR spectra of FePt nanoparticles washed in excess
surfactant (oleic acid and oleylamine) in 1000–3500 cm�1
region.
N. Shukla et al. / Journal of Magnetism and Magnetic Materials 266 (2003) 178–184 181
asymmetric CH2 stretching modes, the peak at3006 cm�1 is due to the n(C–H) mode of the C–Hbond adjacent to the C=C bond, and the smallpeak at 1648 cm�1 is due to the n(C=C) stretchmode. In addition, the spectrum of the oleic acidshows several modes characteristic of the car-boxylic acid group: the n(C=O) mode is observedat 1709 cm�1 and the weak mode at 2670 cm�1 isdue to the n(O–H) stretch of the dimerized acid.This spectrum is of the solid form of oleic acid inwhich the carboxylic acid groups are dimerizedthrough hydrogen bonding. The spectrum ofoleylamine (Fig. 2) shows peaks characteristic ofthe oleyl group in the 2850–3000 cm�1 region andthe n(C=C) stretch mode at 1647 cm�1. Inaddition there are modes characteristic of theamine group: the peak at 1593 cm�1 due to theNH2 scissoring mode and the peak at 3300 cm
�1
due to the n(N–H) stretching mode. The peaks inthe low-frequency region of the spectra below1500 cm�1 arise from complex combinations of then(C–C) stretch, n(C–O) stretches, CH2 deforma-tions and other motions that are too complex toassign. The spectrum of the washed FePt nano-particles (Fig. 3) with excess surfactant showspeaks characteristic of the oleyl group in the 2850–3000 cm�1 region but no peak at 3300 cm�1 due tothe n(N–H) stretching of the NH2 group and nopeak at 1709 cm�1 due to the n(C=O) mode of the
COOH group. Clearly the spectrum of the FePtnanoparticles in excess surfactant does not seem toresemble a combination of the pure surfactantspectra.In order to understand the origin of the
differences between the spectrum of the FePtnanoparticles in excess surfactant and the spectraof the pure surfactants we have obtained a FTIRspectrum (Fig. 4) of a 1:1 mixture of oleic acid andoleylamine, as used in the nanoparticle synthesisand washing process. Comparison of the FTIRspectra in Figs. 3 and 4 suggests that most of thefeatures observed in the spectrum of the FePtnanoparticles can be attributed to the excesssurfactant. The interesting thing is that thespectrum of the surfactant mixture is not a simplecombination of the spectra of the pure componentsurfactants. The 1709 cm�1 peak which is char-acteristic of the COOH group is absent as is the3300 cm�1 mode of the NH2 group. The mostobvious explanation for the absence of these peakis that the mixture of oleic acid and oleylamineconsists of an acid–base complex of �COO� and�NH3
+ ions. Gasgnier [4] has reported FTIRspectra of potassium carboxylates and observedmodes associated with �COO� in the range 1430–1565 cm�1. In the FTIR spectra of potassiumcaprylate and potassium stearate the na(COO
�)and ns(COO
�) were observed at 1562 and1435 cm�1, and 1560 and 1426 cm�1 respectively.
ARTICLE IN PRESS
N. Shukla et al. / Journal of Magnetism and Magnetic Materials 266 (2003) 178–184182
Our results also show peak at 1565 and 1435 cm�1
which can be attributed to the –COO�1 mode. Thespectrum of the oleic acid—oleylamine complex(Fig. 4) dominates the spectrum of the FePtnanoparticles washed in excess (fraction of surfac-tant not bonded with nanoparticles) surfactant(Fig. 3).In order to understand the bonding of surfac-
tant to FePt nanoparticles, the FePt nanoparticlesolution was washed without surfactant in thehexane and ethanol wash solvents. Fig. 5 showsthe 800–1800 cm�1 region of the FTIR spectrum ofFePt nanoparticles with no excess surfactant. Thisspectrum is due to oleic acid and oleylamineadsorbed on the FePt nanoparticles. The peak at1709 cm–1 is due to the n(CQO) stretch mode andindicates that some fraction of the oleic acid isbonded to nanoparticles either in monodentateform or as an acid. The peak at 1512 cm�1 is dueto the na(COO) mode and indicates the presence ofbidentate carboxylate bonding to the nanoparti-cles [11]. The 1618 cm�1 peak is due to the n(C=C)stretching mode and indicates that the C=Cdouble bond is intact in the oleyl groups on thesurfactant. The 1593 cm�1 peak is due to the NH2scissoring mode which suggests that oleylamine isadsorbed with the NH2 group intact. The assign-ments of the vibration modes in the region 2850–3000 cm�1(–CH2) modes, at 3300 cm�1(NH)
800 1000 1200 1400 1600 1800
9701512
1709
1593
1618Inte
nsity
Wavenumber (cm-1)
Fig. 5. FTIR spectra of surfactant (1:1 mixture, oleic acid and
oleylamine) adsorbed on FePt nanoparticles during synthesis in
800–1800 cm�1 region.
mode, at 1709 cm�1 (�CQO) and 1647 cm�1
(–CQC) are well established in the literature.Our assignment of the peak at 1512 cm�1 is basedon several studies of acids on various substrates[5,8,11] and on standard the FTIR spectrum ofsodium oleate. The standard sodium oleate FTIRspectrum shows the oleate na(COO
�) mode at1558 cm�1 which is similar to that observed by Leeet al. [5] for the na(COO
�) mode on sodium insoda-lime. However, Lee et al. have observed arange of 37 cm�1 in the na(COO
�) mode onsubstrates including Al, Mg, Ca and Na. Thistle-thwaite et al. [8] reported the observation of thena(COO
�) mode in the range 1509–1517 cm�1
following adsorption of oleic acid on titania.Qingxia et al. [11] have observed the na(COO
�)mode on adsorption of a monolayer of 16-mercaptihexadecanoic acid on nanosized Fe2O3magnetic particles at 1527 cm�1. The adsorption ofoleic acid on FePt nanoparticles shows thena(COO
�) peak at 1512 cm�1 which is very closethe frequency observed by Thistlewaite andQingxia [8,11]. The peak at 1593 cm�1 is assignedto the NH2 scissoring mode. This was alsoconfirmed by DFT calculations of small moleculessuch as propylamine. A detailed DFT analysis willbe published later by Jones et al. [12]. All peakassignments for this work are shown in Table 1.The FTIR spectrum of the oleic acid and
oleylamine surfactant layers on FePt nanoparticlesin the range 2800–3500 cm�1 is shown in Fig. 6.
Table 1
Infrared vibrational assignments
Vibrational modes Frequency (cm�1) References
n(NH) 3300 [19]
Trans n(�CH=) 3066 [13]
Trans n(�CH=) 3035 [13]
Trans n(�CH=) 3020 [13]
Cis n(�CH=) 3006 [6,13,16]
na(�CH2) 2922 [6,13,16]
ns(�CH2) 2854 [6,13,16]
n(OH) 2670 [5,6]
n(�C=O) 1709 [5,6,13]
n(�C=C) 1647 [5,6]
n(NH2) 1593 [19]
n(�COO) 1512 [5,6,8,11]
Trans n(�CH=) 970 [13,16]
ARTICLE IN PRESS
2800 2900 3000 3100 3200 3300 3400 3500
3350
3039
3066
3020
3006
Inte
nsity
Wavenumber (cm-1)
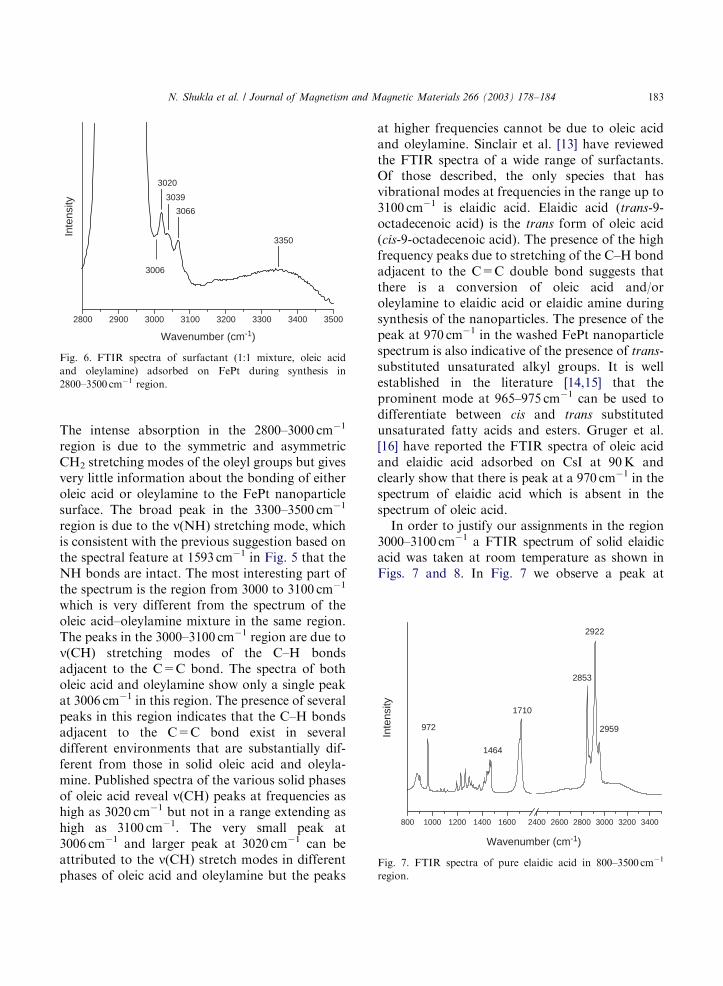
Fig. 6. FTIR spectra of surfactant (1:1 mixture, oleic acid
and oleylamine) adsorbed on FePt during synthesis in
2800–3500 cm�1 region.
800 1000 1200 1400 1600 2400 2600 2800 3000 3200 3400
1464
2959
2853
2922
1710
972
Inte
nsity
Wavenumber (cm-1)
Fig. 7. FTIR spectra of pure elaidic acid in 800–3500 cm�1
region.
N. Shukla et al. / Journal of Magnetism and Magnetic Materials 266 (2003) 178–184 183
The intense absorption in the 2800–3000 cm�1
region is due to the symmetric and asymmetricCH2 stretching modes of the oleyl groups but givesvery little information about the bonding of eitheroleic acid or oleylamine to the FePt nanoparticlesurface. The broad peak in the 3300–3500 cm�1
region is due to the n(NH) stretching mode, whichis consistent with the previous suggestion based onthe spectral feature at 1593 cm�1 in Fig. 5 that theNH bonds are intact. The most interesting part ofthe spectrum is the region from 3000 to 3100 cm�1
which is very different from the spectrum of theoleic acid–oleylamine mixture in the same region.The peaks in the 3000–3100 cm�1 region are due ton(CH) stretching modes of the C–H bondsadjacent to the C=C bond. The spectra of botholeic acid and oleylamine show only a single peakat 3006 cm�1 in this region. The presence of severalpeaks in this region indicates that the C–H bondsadjacent to the C=C bond exist in severaldifferent environments that are substantially dif-ferent from those in solid oleic acid and oleyla-mine. Published spectra of the various solid phasesof oleic acid reveal n(CH) peaks at frequencies ashigh as 3020 cm�1 but not in a range extending ashigh as 3100 cm�1. The very small peak at3006 cm�1 and larger peak at 3020 cm�1 can beattributed to the n(CH) stretch modes in differentphases of oleic acid and oleylamine but the peaks
at higher frequencies cannot be due to oleic acidand oleylamine. Sinclair et al. [13] have reviewedthe FTIR spectra of a wide range of surfactants.Of those described, the only species that hasvibrational modes at frequencies in the range up to3100 cm�1 is elaidic acid. Elaidic acid (trans-9-octadecenoic acid) is the trans form of oleic acid(cis-9-octadecenoic acid). The presence of the highfrequency peaks due to stretching of the C–H bondadjacent to the C=C double bond suggests thatthere is a conversion of oleic acid and/oroleylamine to elaidic acid or elaidic amine duringsynthesis of the nanoparticles. The presence of thepeak at 970 cm�1 in the washed FePt nanoparticlespectrum is also indicative of the presence of trans-substituted unsaturated alkyl groups. It is wellestablished in the literature [14,15] that theprominent mode at 965–975 cm�1 can be used todifferentiate between cis and trans substitutedunsaturated fatty acids and esters. Gruger et al.[16] have reported the FTIR spectra of oleic acidand elaidic acid adsorbed on CsI at 90K andclearly show that there is peak at a 970 cm�1 in thespectrum of elaidic acid which is absent in thespectrum of oleic acid.In order to justify our assignments in the region
3000–3100 cm�1 a FTIR spectrum of solid elaidicacid was taken at room temperature as shown inFigs. 7 and 8. In Fig. 7 we observe a peak at

ARTICLE IN PRESS
2950 2975 3000 3025 3050 3075 3100
3060
3035
3020
Inte
nsity
Wavenumber (cm-1)
Fig. 8. FTIR spectra of pure elaidic acid in 2950–3100 cm�1
region.
N. Shukla et al. / Journal of Magnetism and Magnetic Materials 266 (2003) 178–184184
970 cm�1 which is due to trans form of theunsaturated fatty acid as observed by Gruger et al.[16]. In Fig. 8 we observe all three peaks at 3020,3035 and 3060 cm�1 associated with the n(�CH)modes adjacent to C=C bond in elaidic acid.The isomerization of oleic acid to elaidic acid
can occur during the synthesis of the FePtnanoparticles. This reaction has been observedduring the hydrogenation of oleic acid on Ru–Sncatalysts [17] and on sol–gel supported Ru [18].This prior observation supports our suggestionsthat isomerization is occurring during FePtnanoparticle synthesis and that we have observedelaidyl groups on their surfaces.The presence of elaidyl groups on the FePt
surfaces is very important because the structures ofthe oleyl groups and the elaidyl groups are quitedifferent and are expected to pack differentlyaround the FePt nanoparticles. This in turn willinfluence the self-assembly of nanoparticles onsubstrates.
4. Conclusions
Oleic acid bonds to FePt nanoparticles in bothmonodentate and bidentate forms. The oleylamine
bonds to FePt nanoparticles molecularly with theNH2 group intact. We observe conversion of oleylform to elaidyl form (conversion of the cis-9-octadecenyl group to a trans-9-octadecenyl group)during synthesis. This isomerization must occur asa result of the synthesis of the FePt nanoparticlesat high temperature since it is not observed duringadsorption of oleic acid on surfaces at roomtemperature.
References
[1] S. Sun, D. Weller, C.B. Murray, in: M.L. Pluner, J. van
Ek, D. Weller (Eds.), The Physics of Ultra-high-density
Magnetic Recording, Springer Series in Surface Science,
Vol. 41, Springer, New York, 2001.
[2] A. Ulman, An Introduction to Ultra-thin Organic Film
from Langmuir–Blodgett to Self-assembly, Academic
Press, Boston, MA, 1991.
[3] G.L. Smay, Glass Technol. 26 (1985) 46.
[4] M. Gasgnier, J. Mater. Sci. 20 (2001) 1259.
[5] D.H. Lee, R.A. Condrate Sr., J. Mater. Sci. 34 (1999) 139.
[6] D.H. Lee, R.A. Condrate Sr., W.C. Lacourse, J. Mater.
Sci. 35 (2000) 4961.
[7] D.E. Ince, C.T. Johnston, B.M. Moudgil, Langmuir 7
(1991) 1453.
[8] P.J. Thistlethwaite, M.S. Hook, Langmuir 16 (2000) 4993.
[9] S. Sun, C.B. Murray, D. Weller, Liesl Folks, A. Moser,
Science 287 (2000) 1989.
[10] C. Liu, T.J. Klemmer, N. Shukla, X. Wu, D. Weller, M.
Tanase, D. Laughlin, J. Magn. Magn. Mater. 266 (2003)
this issue.
[11] Qingxia Liu, Zhenghe Xu, Langmuir 11 (1995) 4617.
[12] P.M. Jones, N. Shukla, C. Liu, Y.T. Hsia, D. Weller, in
preparation.
[13] R.G. Sinclair, A.F. Mckay, G.S. Myers, R.N. Jones,
J. Am. Chem. Soc. 74 (1952) 2578.
[14] H.W. Lemon, C.K. Cross, Can. J. Res. 27B (1949) 610.
[15] R.S. Rasmussen, R.R. Brattain, J. Chem. Phys. 15 (1947)
120.
[16] C. Vogel-Weill, A. Gruger, Spectrochim. Acta Part A 52
(1996) 1737.
[17] M.J. Mendes, O.A.A. Santos, E. Jordao, A.M. Silva, Appl.
Catal. A: General 217 (2001) 253.
[18] C.M.M. Costa, E. Jordao, M.J. Mendes, O.A.A. Santos,
F. Bozon-Verduraz, React. Kinet. Catal. Lett. 66 (1999)
155.
[19] W. Erley, J.C. Hemminger, Surf. Sci. 316 (1994)
L1025–L1030.