FTIR AS HCN MEASUREMENT METHOD IN A FLUID CATALYTIC ... Guido Lenaers.pdf · FTIR AS HCN...
11
FTIR AS HCN MEASUREMENT METHOD IN A FLUID CATALYTIC CRACKING UNIT G. Lenaers , E. Damen, R. Brabers, W. Aerts, B. Baeyens, W. Wouters VITO, Flemish Institute for Technological Research, Unit MRG, Project group Air Quality Measurements, Boeretang 200, 2400 Mol, Belgium e-mail: [email protected] KEYWORDS – FTIR, HCN, catalytic cracking, flue gas matrix ABSTRACT - In the cracking process of a Fluid Catalytic Cracking Unit (FCCU) hydrogen cyanide (HCN) is formed during the regeneration of the catalyst. The goal of this study is to investigate if Fourier Transform InfraRed spectroscopy (FTIR) is a potential alternative HCN measurement method to the EPA OTM-29 wet chemistry method. The Gasmet DX-4000 FTIR-analyser used in this investigation proved during laboratory tests to have potential for the measurement of HCN in a typical flue gas matrix by behaving linear between 0.5 en 150 mg/Nm 3 HCN. During the FTIR measurement campaign executed on the chimney stack of the catalytic regenerator unit also wet chemical sampling was performed according to EPA OTM-29 that served as the reference method. The measured actual gas matrix is generated in the laboratory and a dedicated FTIR-library file is established for HCN-concentrations ranging from 5 to 150 mg/Nm 3 . This library file consists of the components present in the gas matrix, the list of interfering components per component, the selected and -according to the interferences- optimised infrared areas for analysis per component, and advanced corrections for cross interferences. The difference between the generated HCN-concentrations and the measured values are maximum 2.1 ppm at 125 ppm; 0.2 ppm at 42 ppm; 0.6 ppm at 20 ppm en 0.4 ppm at 4 ppm. All interferences have been successfully corrected for. The comparison for the other gas components between generated and measured values shows differences of a few percent. Also during the generation of the actual gas matrix HCN is determined over the OTM-29 method. The generated concentrations and the measured values compare within 2%. This proves that the OTM-29 method can serve as a reference method when performing emission measurements on the FCCU. Finally, the FTIR-measurements on the FCCU have been processed with the dedicated library file and the results for HCN compared to those of the OTM-29 determinations yielding an average difference of -5.5% +/- 9.4%. It is concluded that FTIR has the potential for an alternative HCN measurement method on a FCCU. INTRODUCTION In the refinery process of crude oil the residual fraction containing heavy components is fed to a Fluid Catalytic Cracking Unit (FCCU) for conversion to petrol, diesel, LPG etc. With the help of heat and a catalyst the long hydrocarbon chains are cracked into shorter ones. The mixture formed is then fractionated. During the cracking process cokes are formed. These consist of molecules with high molecular mass that contain over 90% carbon. The cokes deposit on the catalyst and deactivate it. To restore the activity of the catalyst the cokes are burned off in the regenerator under addition of air to the fluidised catalyst. Nitrogen compounds that are present on the cokes also react in the regenerator; see Figure 1. At first hydrogen cyanide (HCN) and ammonia (NH 3 ) are formed followed by nitrogen oxide (NO) and dioxide (NO 2 ). The chemical reactions will reach an equilibrium and the resulting gas mixture will contain rest quantities of HCN. The HCN concentration in the emitted flue gas will be dependent on the type of cracking unit, the process conditions and the aftertreatment system installed. Also, HCN and NOx concentrations are interconnected.
Transcript of FTIR AS HCN MEASUREMENT METHOD IN A FLUID CATALYTIC ... Guido Lenaers.pdf · FTIR AS HCN...
FTIR AS HCN MEASUREMENT METHOD IN A FLUID CATALYTIC
CRACKING UNIT
G. Lenaers, E. Damen, R. Brabers, W. Aerts, B. Baeyens, W. Wouters
VITO, Flemish Institute for Technological Research, Unit MRG,
Project group Air Quality Measurements, Boeretang 200, 2400 Mol, Belgium
e-mail: [email protected]
KEYWORDS – FTIR, HCN, catalytic cracking, flue gas matrix
ABSTRACT - In the cracking process of a Fluid Catalytic Cracking Unit (FCCU) hydrogen cyanide (HCN) is formed during the regeneration of the catalyst. The goal of this study is to investigate if
Fourier Transform InfraRed spectroscopy (FTIR) is a potential alternative HCN measurement method
to the EPA OTM-29 wet chemistry method.
The Gasmet DX-4000 FTIR-analyser used in this investigation proved during laboratory tests to have
potential for the measurement of HCN in a typical flue gas matrix by behaving linear between 0.5 en
150 mg/Nm3 HCN. During the FTIR measurement campaign executed on the chimney stack of the
catalytic regenerator unit also wet chemical sampling was performed according to EPA OTM-29 that
served as the reference method.
The measured actual gas matrix is generated in the laboratory and a dedicated FTIR-library file is
established for HCN-concentrations ranging from 5 to 150 mg/Nm3. This library file consists of the
components present in the gas matrix, the list of interfering components per component, the selected
and -according to the interferences- optimised infrared areas for analysis per component, and advanced
corrections for cross interferences. The difference between the generated HCN-concentrations and the
measured values are maximum 2.1 ppm at 125 ppm; 0.2 ppm at 42 ppm; 0.6 ppm at 20 ppm en 0.4
ppm at 4 ppm. All interferences have been successfully corrected for. The comparison for the other
gas components between generated and measured values shows differences of a few percent.
Also during the generation of the actual gas matrix HCN is determined over the OTM-29 method. The
generated concentrations and the measured values compare within 2%. This proves that the OTM-29
method can serve as a reference method when performing emission measurements on the FCCU.
Finally, the FTIR-measurements on the FCCU have been processed with the dedicated library file and
the results for HCN compared to those of the OTM-29 determinations yielding an average difference
of -5.5% +/- 9.4%. It is concluded that FTIR has the potential for an alternative HCN measurement
method on a FCCU.
INTRODUCTION
In the refinery process of crude oil the residual fraction containing heavy components is fed to
a Fluid Catalytic Cracking Unit (FCCU) for conversion to petrol, diesel, LPG etc. With the
help of heat and a catalyst the long hydrocarbon chains are cracked into shorter ones. The
mixture formed is then fractionated. During the cracking process cokes are formed. These
consist of molecules with high molecular mass that contain over 90% carbon. The cokes
deposit on the catalyst and deactivate it. To restore the activity of the catalyst the cokes are
burned off in the regenerator under addition of air to the fluidised catalyst.
Nitrogen compounds that are present on the cokes also react in the regenerator; see Figure 1.
At first hydrogen cyanide (HCN) and ammonia (NH3) are formed followed by nitrogen oxide
(NO) and dioxide (NO2). The chemical reactions will reach an equilibrium and the resulting
gas mixture will contain rest quantities of HCN. The HCN concentration in the emitted flue
gas will be dependent on the type of cracking unit, the process conditions and the
aftertreatment system installed. Also, HCN and NOx concentrations are interconnected.

Figure 1: Nitrogen reactions during the regeneration of the catalyst
In the Flemish Region an official request was made to change the regulation for HCN
emissions in the sector of oil refineries for installations for the catalytic cracking over the
fluid bed method at regeneration of the catalyst. Next to a proposed new monthly average
limit value of 50 mg/Nm3 -up from 5 mg/Nm
3- the addition of Fourier Transform InfraRed
spectroscopy (FTIR) as a continuous measurement method for HCN is requested. At present
the HCN emissions need to be determined over the draft EPA OTM-29 wet chemistry
method. This method specifically takes account for problems in the analytical determination
of HCN emissions in catalytic cracking units mainly by using a 6N NaOH absorption solution
to keep the pH above 12 and thus preventing the loss of gaseous HCN from this solution.
The goal of this study is to investigate if FTIR has the potential for an alternative HCN
measurement method at a FCCU. The EPA OTM-29 wet chemistry method is used as a
reference method. The study is commissioned by the Flemish Government in relation to the
request mentioned above.
This paper first describes the suitability tests executed on the FTIR in the laboratory prior to
the measurements on the FCCU. Following the FCCU measurements experiments were
conducted on reconstructed gas matrices to fine tune the FTIR. Finally the HCN FCCU
emissions measured by FTIR and over the EPA OTM-29 are compared.
FTIR SUITABILITY TESTING
The portable Gasmet DX-4000 FTIR-analyser used in this investigation was subjected to a
series of suitability tests it had to pass before the actual HCN FCCU measurements could
start:
1. Recording of new water reference spectra with reproducibility check
2. Establishing a calibration line between 0.1 and 3 times the Emission Limit Value
(ELV) for HCN in dry nitrogen gas including determination of linearity and
reproducibility check
3. Establishing a calibration line between 0.1 and 3 times the ELV for HCN in wet
nitrogen gas including determination of linearity
4. Establishing a calibration line between 0.1 and 3 times the ELV for HCN in a fixed
flue gas matrix including determination of linearity
5. Measurement of a flue gas matrix of varying composition together with HCN
As a reference laboratory VITO is equipped with an infrastructure for the accurate generation
of a gas matrix of known concentrations. As well water vapour as inorganic gasses can be
generated in a carrier gas.
Water is almost always present in an infrared (IR) spectrum in small to sometimes very large
concentrations. It adsorbs IR radiation in a large part of the IR spectrum. Thus water has a

high chance to interfere with other components. Carefully recorded water reference spectra
that are periodically re-recorded are crucial for the data quality. Not only are they needed for
an accurate water concentration measurement but they also serve the correction for water
interferences. Keep in mind that in flue gasses usually the components of interest are at the
ppm level whereas water is at the percent level.
Water reference spectra are recorded from 1 to 28 vol%. A linear regression yields a
coefficient of determination (R2) of 1 indicating a linear behaviour. The repetition of the
experiment shows very reproducible results with R2 equal to 1 and with the same equation for
the regression line.
Establishing a calibration line between 0.1 and 3 times the ELV for HCN in dry nitrogen gas
ended up in generating a concentration range of 0.5 to 150 mg/Nm3 as the general ELV in the
Flanders Region is 5 mg/Nm3 next to the requested 50 mg/Nm
3 (see above). A linear
regression yields a R2 of 1 indicating a linear behaviour. The repetition of the experiment
shows very reproducible results with R2 equal to 1 and with the same equation for the
regression line. The FTIR has two reference spectra for HCN at 20 and 50 ppm. The FTIR
measures in ppm; 1ppm HCN equals 1.21 mg/Nm3.
For the repetition of the above experiment in wet nitrogen gas the water concentration was 10
to 11% as expected in the FCCU flue gas. Also here linear regression yields a R2 of 1
indicating a linear behaviour.
In the next step the above experiment was executed in a fixed flue gas matrix consisting of
CO2, H2O, SO2, NO2, NO, CO and C3H8. Figure 2 shows the reference values for all
components per step of the matrix generation. These values are at the expected level in the
FCCU flue gas except for propane that was added as a hydrocarbon without knowing at this
stage if hydrocarbons are present nor what the concentration level might be. As can be seen
from Figure 3 the HCN regression has a R2 of 1 and the calibration line shows a coefficient
near 1 and an intercept of only -0.2 ppm.
Finally, the expected concentration of HCN in the FCCU flue gas was generated at an almost
constant level while CO2, H2O, SO2, NO2, NO, CO and C3H8 were varied individually over a
wide concentration range. The aim of this exercise is to investigate if the individual matrix
components can be determined over this wide concentration range in the presence of the other
components including HCN. If so, a reliable measurement of the FCCU gas matrix is
possible. This is required later to be able to accurately generate this matrix when developing a
dedicated libraryfile for the measurement of HCN at the FCCU.
The libraryfile used in the present experiment was already partially optimised in order to get a
reliable measurement. The FTIR uses a libraryfile when analysing the recorded spectrum.
This file consists of the components present in the matrix, a list of interfering components per
component, the selected areas in the infrared spectrum for analysis per component adapted to
the interfering compounds, and if necessary advanced corrections for remaining cross
interferences. For each component in the file at least one reference spectrum is available; at
least two for non-linear behaviour. The better the libraryfile the smaller the residual infrared
spectrum. This spectrum is the difference between the measured and calculated spectrum and
needs to be as small as possible; at best around the noise level.
Figure 4 shows the reference values for all components per step of the matrix generation. In
Figure 5 the comparison is given between the reference and measured HCN concentrations
for each step. The difference is fairly small and constant and about 1.5 ppm on a level of 30
ppm i.e. 5%. The other components are measured within 10 % with a few exceptions. It is

concluded that the composition of the FCCU gas matrix can be measured in a reliable way on
the condition that no components are present that are not (yet) included in the libraryfile.
Figure 2: Reference values per step used in establishing the HCN calibration line in flue gas
Figure 3: HCN calibration line in flue gas

Figure 4: Reference values per step for the measurement of a varying flue gas matrix
Figure 5: Comparison between reference and measured values for HCN
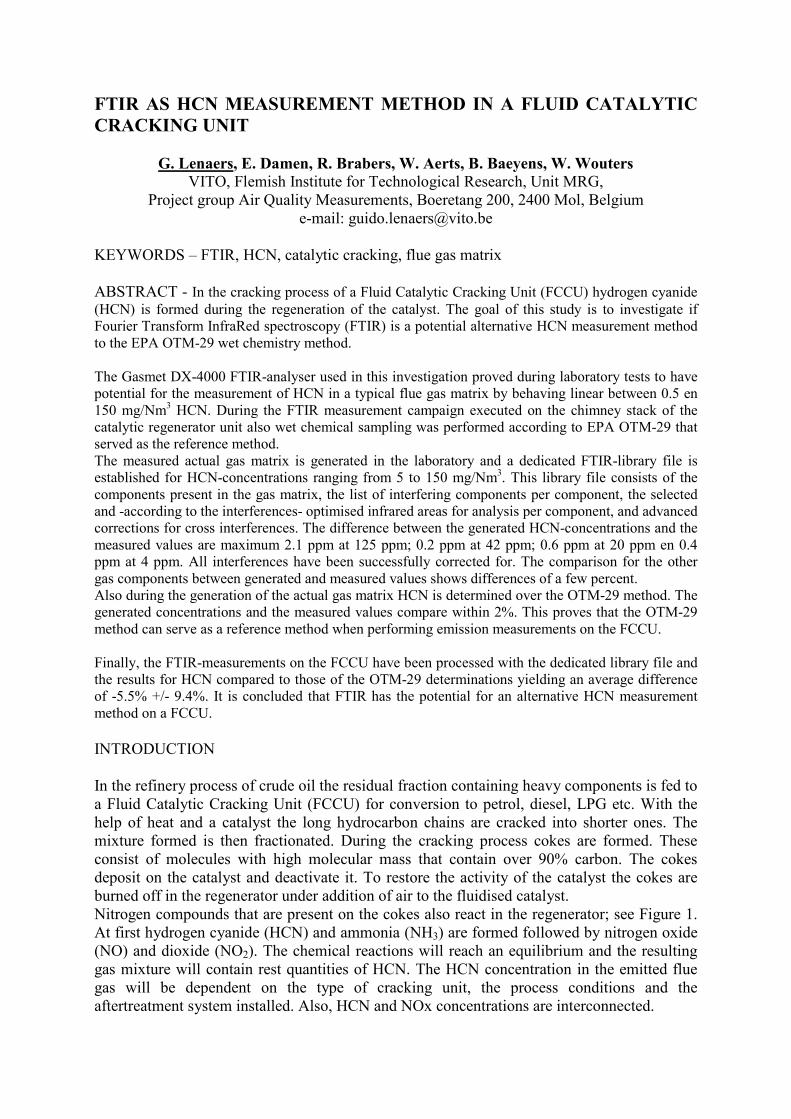
FCCU MEASUREMENTS
To enable the actual measurements on the flue gas of the FCCU-regenerator a measurement
set-up was built that allowed next to the FTIR measurements simultaneous sampling
according to EPA OTM-29 that serves as the reference method. The hot flue gas was sampled
over a 180°C heated out-stack filter and over at 160°C heated Teflon sampling lines to avoid
condensation. The system included valves that allowed for admitting nitrogen to the FTIR on
a daily basis in order to take a background spectrum. A modem allowed for the on-line
control over the FTIR and for checking relevant flows in the system. The OTM-29 impinger
sampling trains were equipped with a purpose built third impinger as shown in Figure 6 that
allowed for the insertion of a pH electrode to make sure that the pH in this impinger did not
fall below 12 as requested by the method.
Figure 6: Picture of wet chemical HCN sampling according to EPA OTM-29
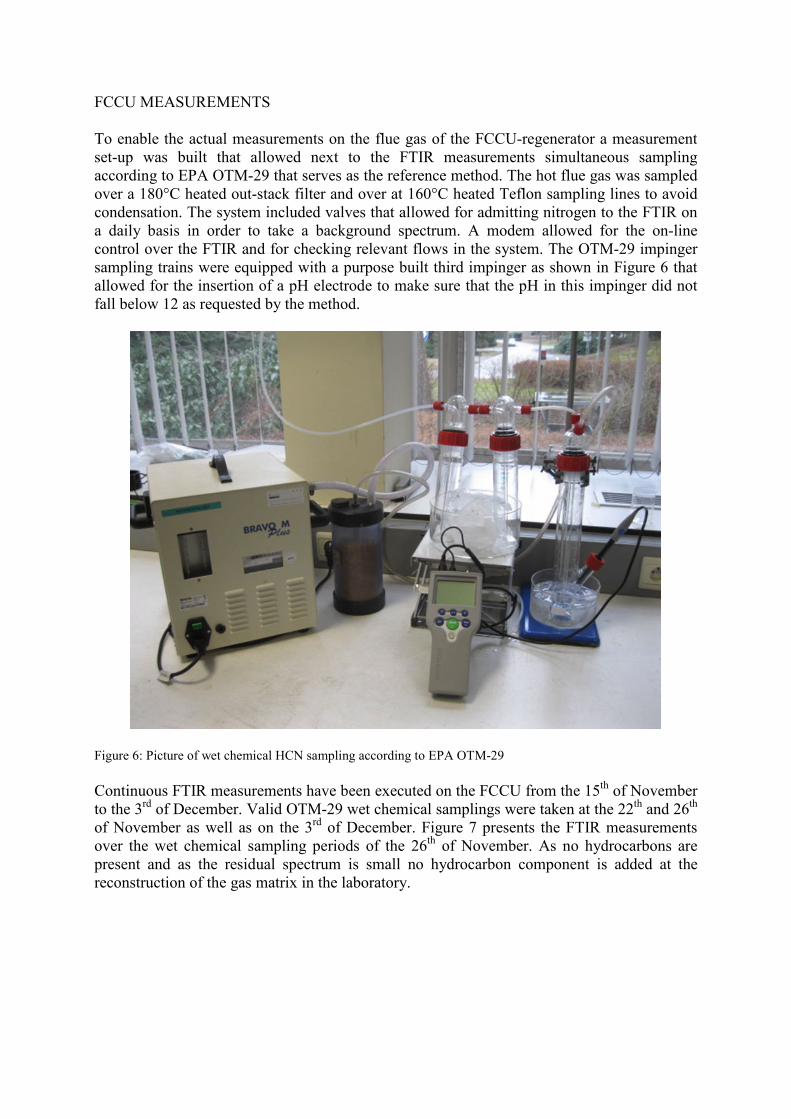
Continuous FTIR measurements have been executed on the FCCU from the 15th of November
to the 3rd of December. Valid OTM-29 wet chemical samplings were taken at the 22
th and 26
th
of November as well as on the 3rd of December. Figure 7 presents the FTIR measurements
over the wet chemical sampling periods of the 26th of November. As no hydrocarbons are
present and as the residual spectrum is small no hydrocarbon component is added at the
reconstruction of the gas matrix in the laboratory.
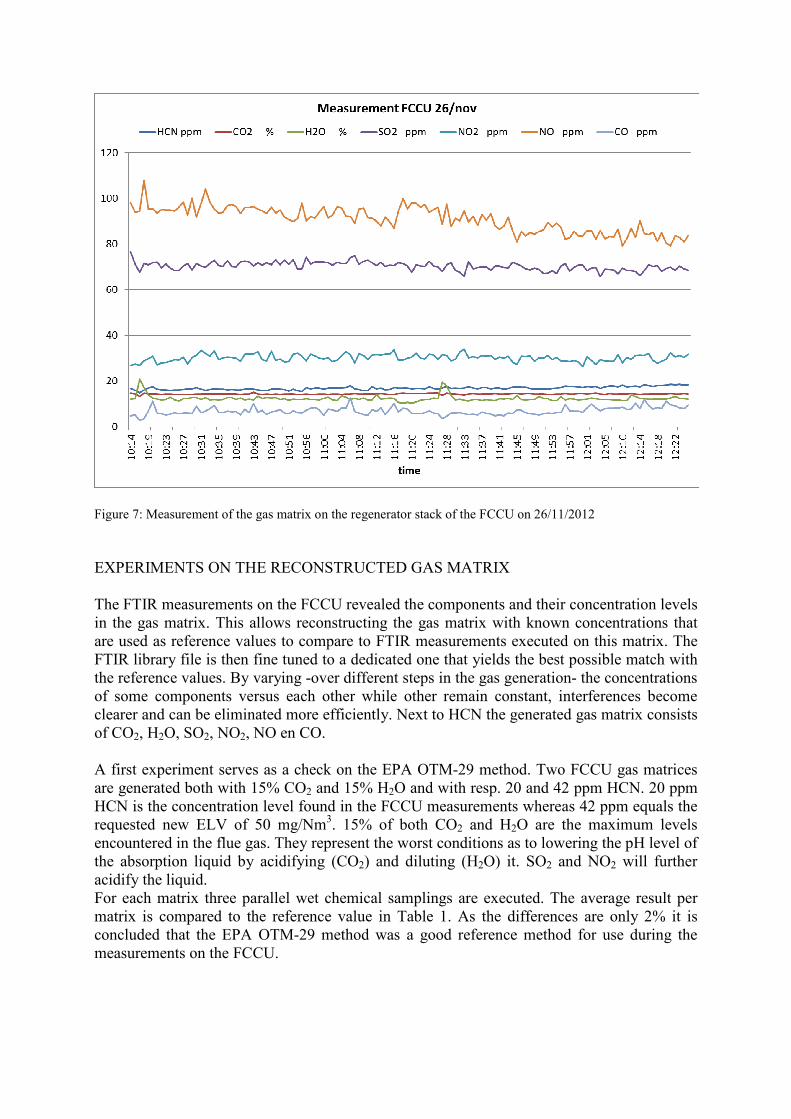
Figure 7: Measurement of the gas matrix on the regenerator stack of the FCCU on 26/11/2012
EXPERIMENTS ON THE RECONSTRUCTED GAS MATRIX
The FTIR measurements on the FCCU revealed the components and their concentration levels
in the gas matrix. This allows reconstructing the gas matrix with known concentrations that
are used as reference values to compare to FTIR measurements executed on this matrix. The
FTIR library file is then fine tuned to a dedicated one that yields the best possible match with
the reference values. By varying -over different steps in the gas generation- the concentrations
of some components versus each other while other remain constant, interferences become
clearer and can be eliminated more efficiently. Next to HCN the generated gas matrix consists
of CO2, H2O, SO2, NO2, NO en CO.
A first experiment serves as a check on the EPA OTM-29 method. Two FCCU gas matrices
are generated both with 15% CO2 and 15% H2O and with resp. 20 and 42 ppm HCN. 20 ppm
HCN is the concentration level found in the FCCU measurements whereas 42 ppm equals the
requested new ELV of 50 mg/Nm3. 15% of both CO2 and H2O are the maximum levels
encountered in the flue gas. They represent the worst conditions as to lowering the pH level of
the absorption liquid by acidifying (CO2) and diluting (H2O) it. SO2 and NO2 will further
acidify the liquid.
For each matrix three parallel wet chemical samplings are executed. The average result per
matrix is compared to the reference value in Table 1. As the differences are only 2% it is
concluded that the EPA OTM-29 method was a good reference method for use during the
measurements on the FCCU.

Table 1: Comparison between HCN wet chemical and reference values for the reconstructed matrix
wet chem. HCN measured HCN average HCN reference Differ. vs ref Differ. vs ref
test mg/Nm3 mg/Nm
3 mg/Nm
3 mg/Nm
3 %
1 23.7
2 23.5 23.7 24.2 -0.5 -2.1
3 24.0
1 50.1
2 48.7 49.6 50.8 -1.2 -2.4
3 50.1
In the main experiment the generated water concentration varies between the steps from 10 to
15% and the CO2 concentration from 12 to 15%. Meanwhile HCN is generated between 5 and
150 mg/Nm3 i.e. from the current ELV -and also 0.1 times the requested ELV- till 3 times the
requested ELV. The aim is to investigate if the FTIR analyser ‘can’ be used to compare its
measured values to an ELV.
Figure 8 gives the reference values per generation step for all components. Figure 9 then
shows the comparison for HCN between reference and measured values for each step. The
measured values are calculated starting from two libraryfiles: the dedicated ‘FTIRVito4.lib’
and the ‘FTIRbaselib’. This last one is a base library that was included at delivery of the
FTIR. It is not optimised for the gas matrix and serves here to show the difference to the
dedicated library. In Figure 9 the difference between the reference values and those from the
FTIRVito4.lib are plotted on the secondary axis. These differences are small: maximum 2.1
ppm at 125 ppm; 0.2 ppm at 42 ppm; 0.6 ppm at 20 ppm en 0.4 ppm at 4 ppm. An increase in
the differences below 4 ppm is not to be expected as the FTIR was shown to behave very
linear for HCN in flue gas. All interferences have been corrected for to a large extent. The
FTIRbaselib delivers values too low and suffers from interferences.
The likewise comparison for the other components yields differences of a few percent at
maximum; see e.g. Figure 10 for NO. The FTIRbaselib is only at an acceptable level for H2O.
On the basis of these experiments it is concluded that FTIR has the potential to guard an ELV
for HCN.
COMPARISON OF HCN FCCU EMISSIONS MEASURED BY FTIR AND OVER THE
EPA OTM-29 METHOD
The FTIR FCCU measurements are recalculated starting from the dedicated libraryfile
FTIRVito4.lib and the results are compared to those of the wet chemical reference method
EPA OTM-29 in Table 2. For comparison, the table also presents the results when starting
from the FTIRbaselib. It can be concluded that the dedicated libraryfile delivers comparable
results to the reference method: the average difference is -5.5% +/- 9.4%. The baselibrary
does not deliver comparable results.
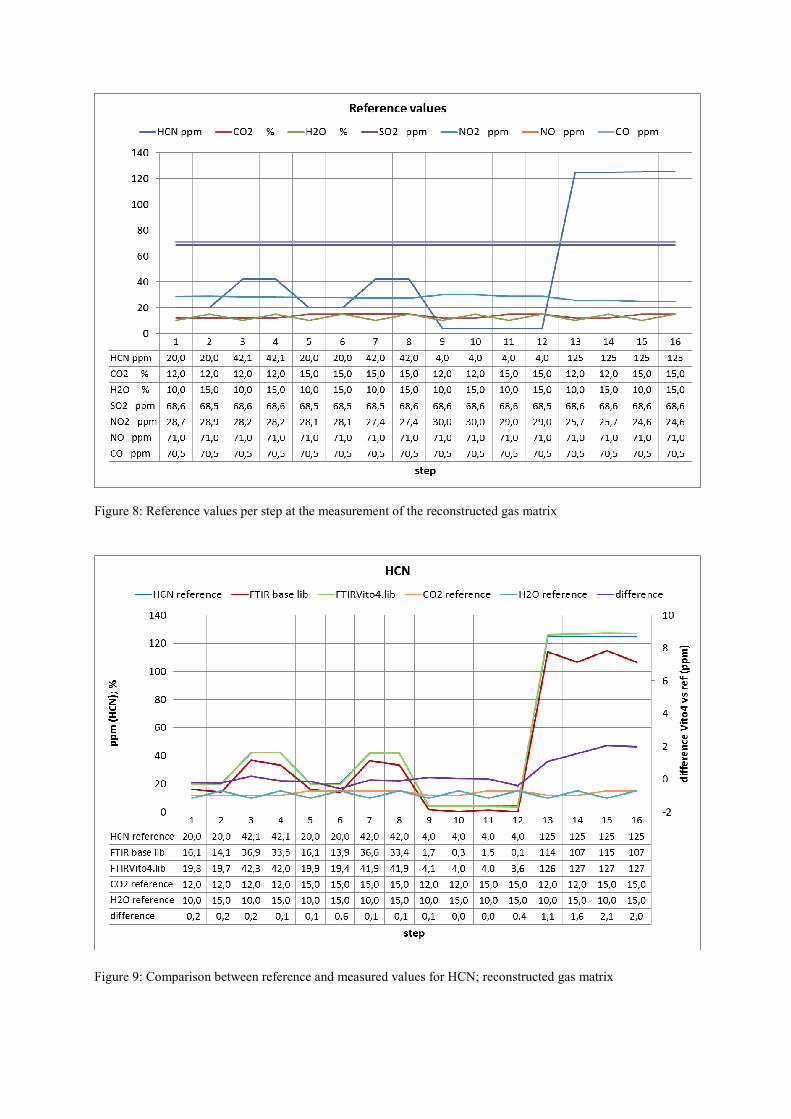
Figure 8: Reference values per step at the measurement of the reconstructed gas matrix
Figure 9: Comparison between reference and measured values for HCN; reconstructed gas matrix

Figure 10: Comparison between reference and measured values for NO; reconstructed gas matrix
Table 2: Comparison of the final FTIR and wet chemical reference HCN measurements on the FCCU
Date Time FTIR FTIR Wet chemical Difference FTIR VITO4 LIB
2012 base LIB VITO4 LIB VITO vs wet chemical
mg/Nm³ mg/Nm³ mg/Nm³ %
22/nov 11:10-12:10 13,8 17,5 20,0 -12,4
12:19-13:19 15,1 18,8 18,8 0,0
26/nov 10:15-11:15 16,0 19,8 24,0 -17,5
11:25-12:25 17,2 21,0 23,5 -10,9
3/dec 12:35-13:35 19,4 23,3 23,1 0,8
13:45-14:45 21,9 25,6 24,0 7,0
average
-5,5
STDEV
9,4

CONCLUSION
The scientific conclusion of this study is that FTIR has potential as a continuous measurement
method for HCN at FCCU’s. The term ‘continuous measurement method’ covers two possible
options. As a FTIR-analyser intrinsically measures continuously a first option is the use in
short term periodical measurements during which the FTIR analyser measures continuously.
Within CEN TC 264 the new Working Group WG36 is working on an EN standard for
periodical FTIR measurements. This standard will built on the UK Technical Guidance Note
TGN M22 and the US EPA method 320 (or comparable ASTM D 6348 test method).
A second option is the use as AMS (Automated Measurement Systems) or CEMS
(Continuous Emissions Monitoring Systems). In this case the FTIR-analyser measures
continuously without interruption.
It should be stressed that quality assurance is necessary according to national, European or
international standards. Furthermore, the use of FTIR should be left to those with a sufficient
knowledge of the base principles of FTIR as well as of the software for spectral analysis.
LITERATURE
EPA Draft method OTM-29 revised March, 2011
Other test method 29 – Sampling and analysis for hydrogen cyanide emissions from
stationary sources
http://www.epa.gov/ttn/emc/prelim.html
EN 14181: 2004
Stationary source emissions – Quality assurance of automated measuring systems
NBN EN 15267-3 : 2008
Air quality - Certification of automated measuring systems - Part3: Performance criteria and
test procedures for automated measuring systems for monitoring emissions from stationary
sources
EPA test method 320
Measurement of vapour phase organic and inorganic emissions by extractive Fourier
Tranform Infrared (FTIR) spectroscopy
http://www.epa.gov/ttn/emc/promgate/m-320.pdf
ASTM D6348 - 12
Standard Test Method for Determination of Gaseous Compounds by Extractive Direct
Interface Fourier Transform Infrared (FTIR) Spectroscopy
Environment Agency TGN M22 Technical Guidance Note (Monitoring)
Measuring stack gas emissions using FTIR instruments, Version 3, March 2012
http://www.environment-agency.gov.uk/business/regulation/31831.aspx
CEN/TS 14793 : 2005
Stationary source emission - Intralaboratory validation procedure for an alternative method
compared to a reference method