FSV Investor Presentation Apr2015 - Colliers
26
Investor Presentation April 2015
Transcript of FSV Investor Presentation Apr2015 - Colliers

Investor PresentationApril 2015

Forward-looking statementsCertain statements included herein constitute “forward‐looking statements” within the meaning of the U.S. Private Securities Litigation Reform Act of 1995. Such forward‐looking statements involve known and unknown risks, uncertainties and other factors which may cause the actual results, performance or achievements of the Company, or industry results, to be materially different from any future results, performance or achievements expressed or implied by such forward‐looking statements. Such factors include, among others, the following: general economic and business conditions, which will, among other things, impact demand for the Company’s services, service industry conditions and capacity; the ability of the Company to implement its business strategy, including the Company’s ability to acquire suitable acquisition candidates on acceptable terms and successfully integrate newly acquired businesses with its existing businesses; changes in or the failure to comply with government regulations (especially safety and environmental laws and regulations); and other factors which are described in the Company’s filings with the Canadian securities regulators and the U.S. Securities and Exchange Commission.
2
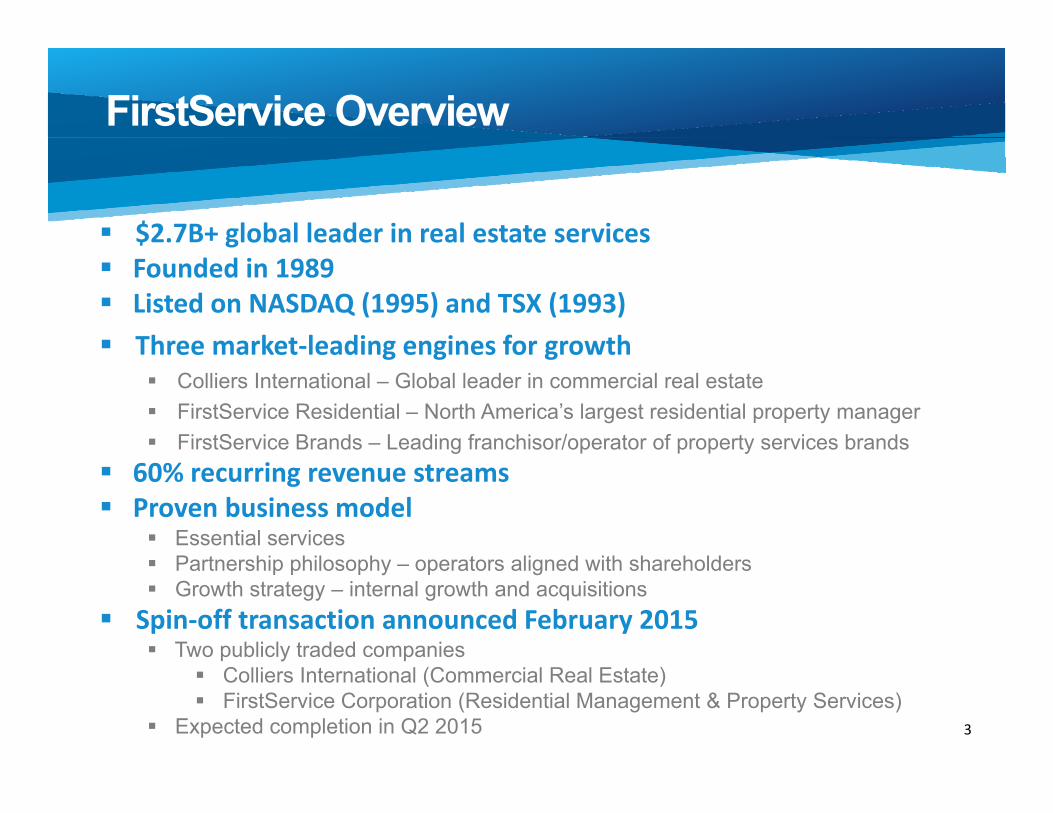
FirstService Overview
3
$2.7B+ global leader in real estate services Founded in 1989 Listed on NASDAQ (1995) and TSX (1993) Three market‐leading engines for growth
Colliers International – Global leader in commercial real estate FirstService Residential – North America’s largest residential property manager FirstService Brands – Leading franchisor/operator of property services brands
60% recurring revenue streams Proven business model
Essential services Partnership philosophy – operators aligned with shareholders Growth strategy – internal growth and acquisitions
Spin‐off transaction announced February 2015 Two publicly traded companies
Colliers International (Commercial Real Estate) FirstService Corporation (Residential Management & Property Services)
Expected completion in Q2 2015

FirstService Overview - continued
Strong cash flow & balance sheet Low CAPEX, highly variable costs Low financial leverage, ample growth capital
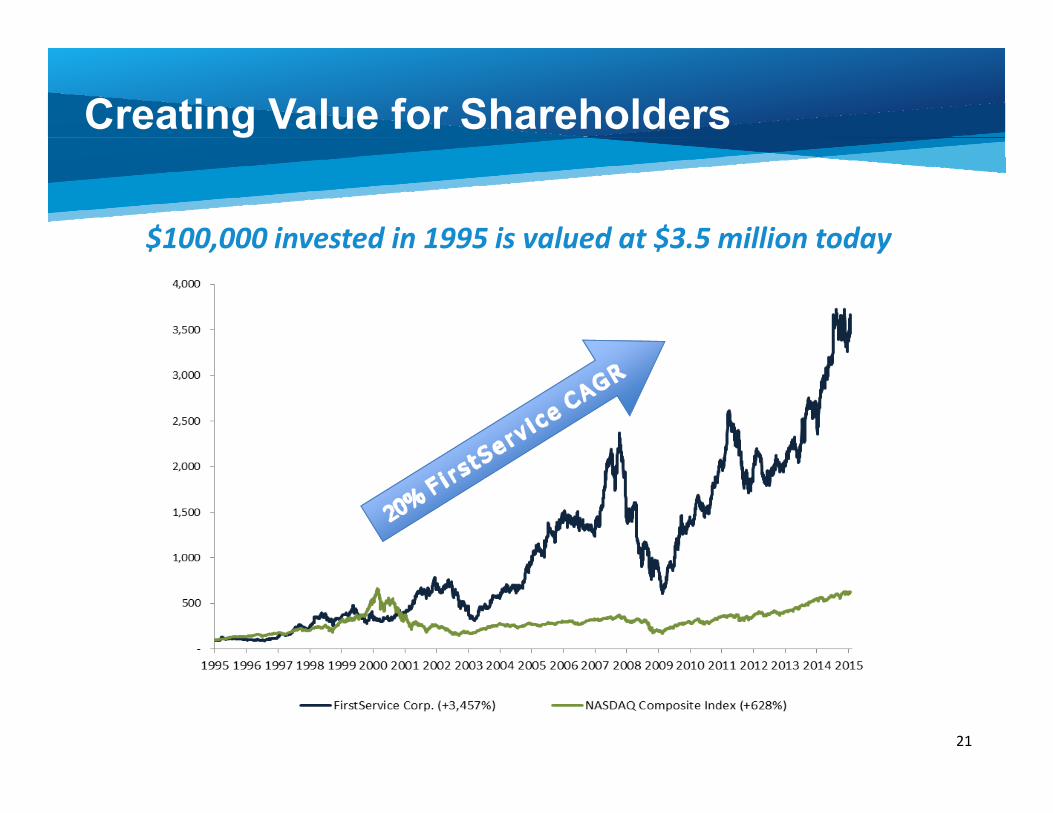
Successful track record $100K invested in 1995 is worth $3.5 million today 20% CAGR over 20 years (vs. NASDAQ at 10%)
20%+ insider ownership $0.40 annual dividend on common shares Significant potential for future share value growth
Real estate services is one of largest global markets Growth in market share, services and geography Margin expansion across service lines
4
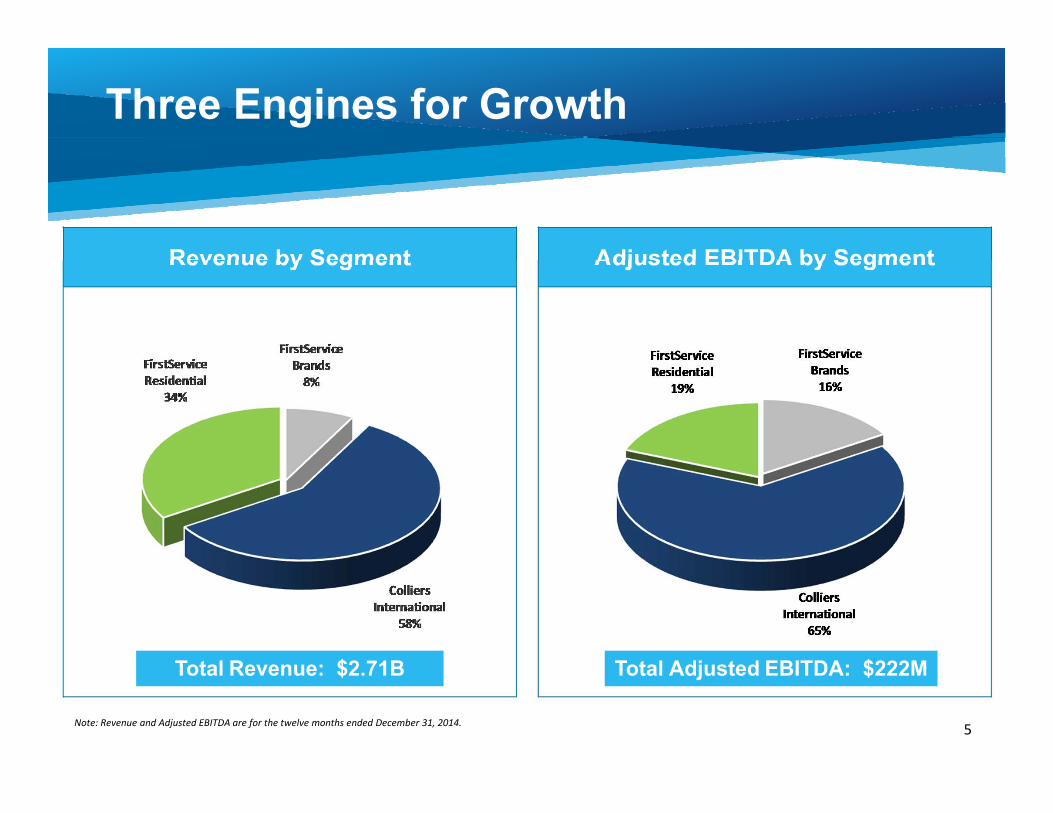
Adjusted EBITDA by SegmentRevenue by Segment
Three Engines for Growth
5Note: Revenue and Adjusted EBITDA are for the twelve months ended December 31, 2014.
Total Revenue: $2.71B Total Adjusted EBITDA: $222M

Revenue by GeographyRevenue by Service
Diversified Revenue Streams
6Note: Revenue is for the twelve months ended December 31, 2014.

Colliers International
Global leader in commercial real estate 219 company-owned offices in 41 countries + franchises in 26
countries
Global brand Initial investment 2004 – Revenue up 6X, EBITDA up 10X 3rd most recognized brand – The Lipsey Co. (2015 brand survey) Ranked #5 global outsourcer – G100 (up from #17 last year)
Growth strategy Expand share in major markets; expand global coverage Add services, multi-market retainers, other CRE services Recent acquisitions: AOS (France, Belgium); 4 tuckunders (UK, ANZ)
Improve operational effectiveness Increase EBITDA margins above 10% by 2016
Revenue $1.58B | EBITDA $157M
7Note: Revenue and Adjusted EBITDA are for the twelve months ended December 31, 2014.

Achieving greater geographic diversification
Achieving a higher % of non-transaction revenues
Colliers International
8
2004
2004 2014
2014
Sales and Lease Brokerage
Management and Advisory Services
Americas
Rest of the World
$250M Revenue $1.58B Revenue
$250M Revenue $1.58B Revenue

A d j u s t e d E B I T D A & m a r g i n
R e v e n u e
Colliers International
9
US$ m
illions
US$ m
illions
CAGR20%
CAGR26%

FirstService Residential
Largest player in North America Condos, co-ops, master planned and active adult communities Highly fragmented ~ 5% market share Rebranded to “FirstService Residential” (in 2013)
7,000 properties under management 1.6 million residential units managed; 3 million residents $8+ billion annual spend 100+ offices across North America
90% recurring revenue Long-term contracts, 95%+ retention rates
Growth strategy Increase share, add markets, expand services
Improve operational effectiveness Consolidate back offices to 2 shared service centres Drive EBITDA margins to 8% by 2018
Revenue $920M | EBITDA $46M
10Note: Revenue and Adjusted EBITDA are for the twelve months ended December 31,2014.

FirstService Residential
11
Scale brings differentiation Virtually impossible to replicate advantages
$8B in annual operating budgets “Buying power” is leveraged to benefit clients
Exclusive financial and banking programs $2.5B+ in client funds creates highest yields/lowest costs
Proprietary insurance programs $1B+ annual spend reduces costs/expands coverage
Energy conservation and procurement Proprietary databases - procure energy/upgrade infrastructure
High standards of transparency/accountability
Leading market position

A d j u s t e d E B I T D A & m a r g i n
R e v e n u e
FirstService Residential
12
US$ m
illions
US$ m
illions
CAGR13%
CAGR7%
Note: Adjusted EBITDA includes $5.9M of re‐branding and related costs in 2013 and elevated employee medical costs of $9.0M in 2014, both of which are non‐recurring.
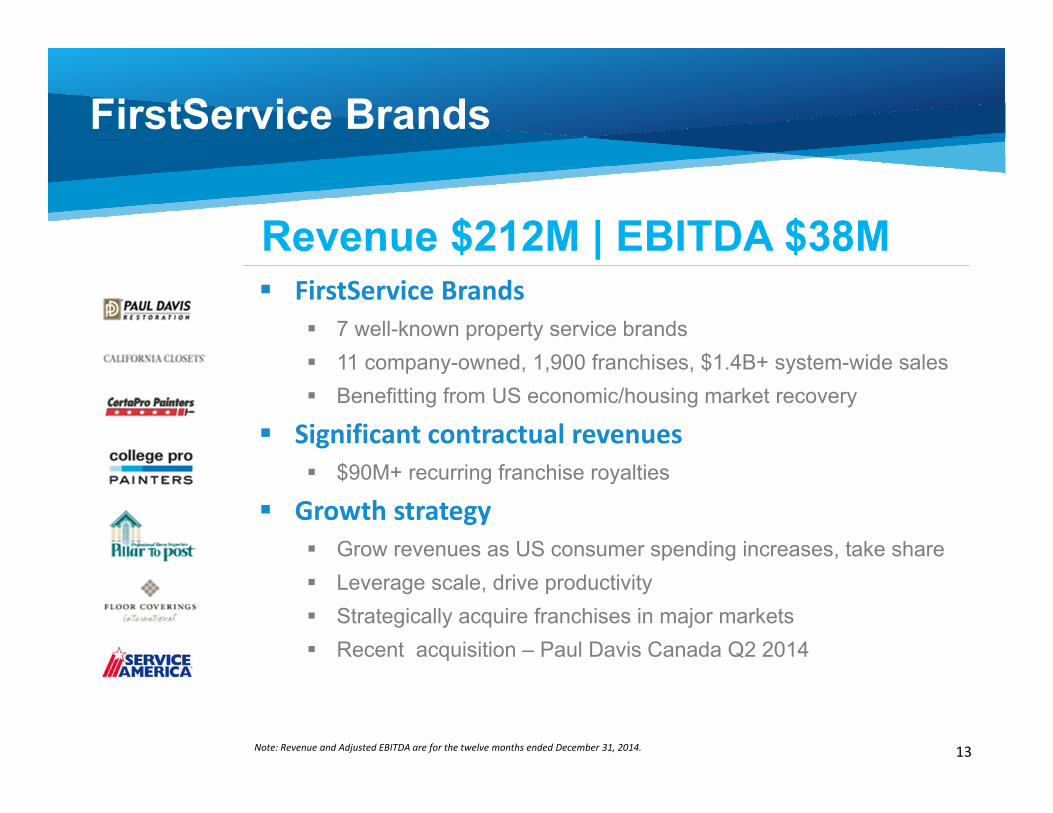
FirstService Brands
Revenue $212M | EBITDA $38M
13Note: Revenue and Adjusted EBITDA are for the twelve months ended December 31, 2014.
FirstService Brands 7 well-known property service brands 11 company-owned, 1,900 franchises, $1.4B+ system-wide sales Benefitting from US economic/housing market recovery
Significant contractual revenues $90M+ recurring franchise royalties
Growth strategy Grow revenues as US consumer spending increases, take share Leverage scale, drive productivity Strategically acquire franchises in major markets Recent acquisition – Paul Davis Canada Q2 2014

A d j u s t e d E B I T D A & m a r g i n
R e v e n u e
FirstService Brands
14
US$ m
illions
US$ m
illions
CAGR7%
CAGR7%
Financial Overview
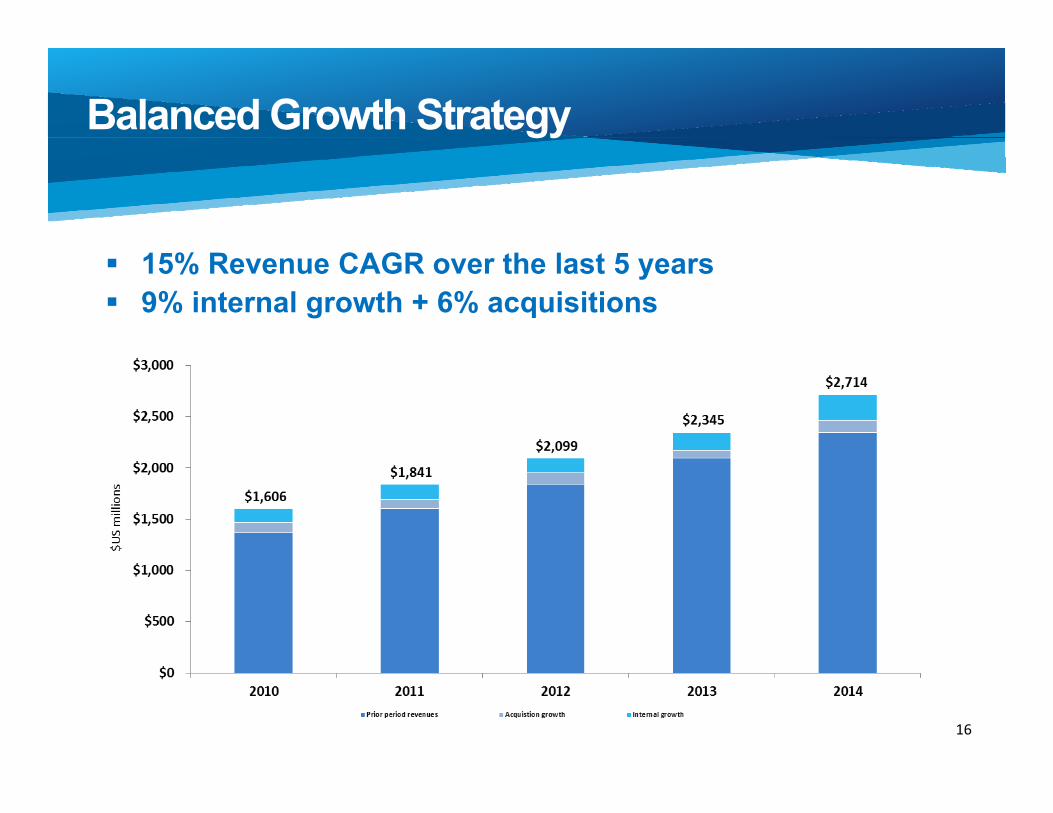
Balanced Growth Strategy
15% Revenue CAGR over the last 5 years 9% internal growth + 6% acquisitions
16

Successful Track Record
Revenue Adjusted EBITDA
15% five year CAGR 24% five year CAGR
(US$ millions)
17
(US$ millions)

Adjusted EPS
Successful Track Record
Operating Cash Flow
(US$ millions)(US$)
33% five year CAGR 14% five year CAGR
$24
18
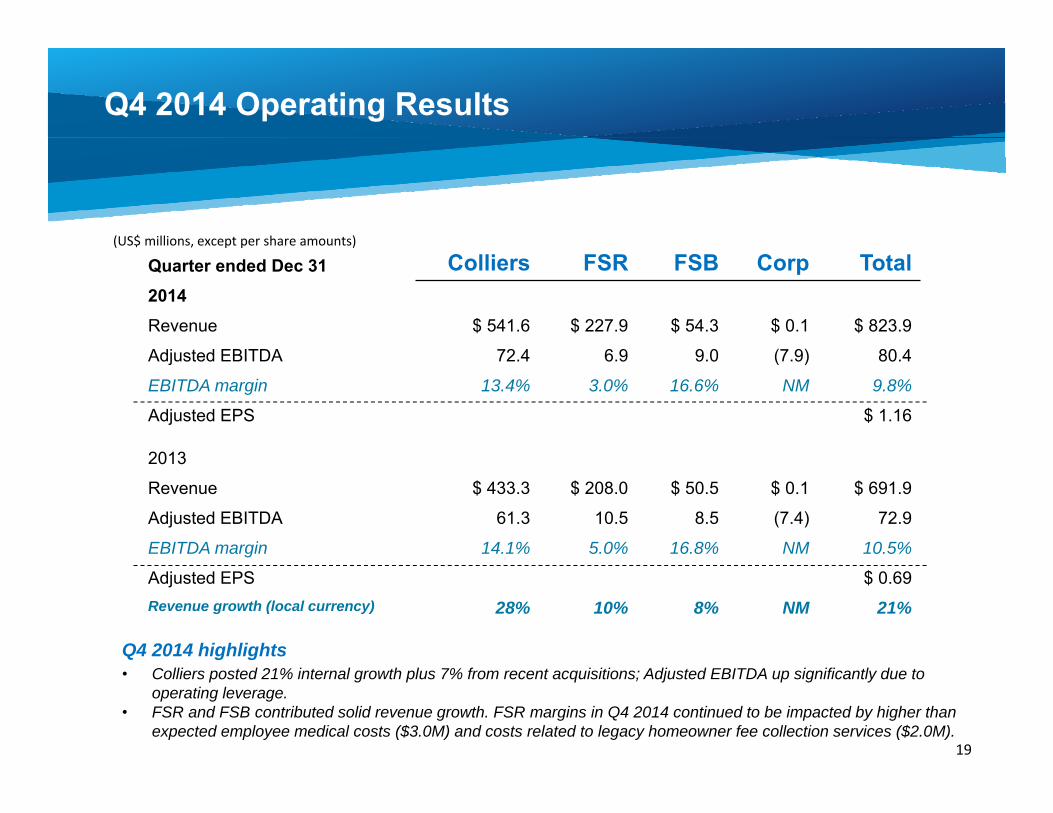
Quarter ended Dec 31 Colliers FSR FSB Corp Total2014Revenue $ 541.6 $ 227.9 $ 54.3 $ 0.1 $ 823.9
Adjusted EBITDA 72.4 6.9 9.0 (7.9) 80.4
EBITDA margin 13.4% 3.0% 16.6% NM 9.8%
Adjusted EPS $ 1.16
2013
Revenue $ 433.3 $ 208.0 $ 50.5 $ 0.1 $ 691.9
Adjusted EBITDA 61.3 10.5 8.5 (7.4) 72.9
EBITDA margin 14.1% 5.0% 16.8% NM 10.5%
Adjusted EPS $ 0.69Revenue growth (local currency) 28% 10% 8% NM 21%
19
(US$ millions, except per share amounts)
Q4 2014 Operating Results
Q4 2014 highlights• Colliers posted 21% internal growth plus 7% from recent acquisitions; Adjusted EBITDA up significantly due to
operating leverage.• FSR and FSB contributed solid revenue growth. FSR margins in Q4 2014 continued to be impacted by higher than
expected employee medical costs ($3.0M) and costs related to legacy homeowner fee collection services ($2.0M).

Leverage
20
(US$ millions) Dec 31, 2014 Dec 31, 2013
Net debt $ 336.6 $ 230.1
Redeemable non-controlling interests 231.0 222.1
Shareholders’ equity 233.2 249.0
Total capitalization $ 800.8 $ 701.2
Net debt / Adjusted EBITDA 1.4x 1.3x
Net debt / total capitalization 42% 33%
(Adjusted EBITDA less capex) / net interest 11.9x 6.9x
Highlights• Increased revolver to $500 from $350 in Q2 2014 to provide financial flexibility and capacity for acquisitions
• Capex of $53 in 2014; 20% reduction expected for 2015
• Lower leverage ratio for Q4 2014, with seasonal increase expected in Q1 and Q2 2015
• Weighted average cost of debt at the end of Q4 2014 was approximately 3%
21
Creating Value for Shareholders
$100,000 invested in 1995 is valued at $3.5 million today

Create Future Share Value
(US$ millions) 22
Assumptions Trailing 5 Years 5 Year Outlook Internal growth CAGR 9% 5% Acquisition CAGR 6% 6% Total revenue growth 15% 11%

Adjusted EPSAdjusted EBITDA
Net Debt / Adjusted EBITDA
Create Future Share Value
(US$ millions)
23

Summary
24
$2.7B+ global leader in real estate services
Three platforms for growth
60% recurring revenues
Proven business model
Significant insider ownership and long tenured team
Strong cash flows & balance sheet
Successful track record – 20% CAGR over 20 years
$0.40 annual dividend on common shares
Significant potential for growth Announced spin-off to create two publicly traded companies,
Colliers International and FirstService Corporation – Q2 2015

Appendix – Adjusted EBITDA Reconciliation
25
Quarter ended Dec. 31 Year ended Dec. 31
2014 2013 2014 2013
Net earnings from continuing operations $ 37.8 $ 28.1 $ 89.4 $ 46.6
Income tax 10.7 16.0 31.8 22.2
Other expense (income) - 0.3 (1.0) (1.5)
Interest expense, net 4.4 4.2 14.2 21.5
Operating earnings 52.9 48.6 134.4 88.8
Depreciation and amortization 18.2 14.6 62.4 71.9
Acquisition-related items 5.9 2.1 11.8 10.5
Stock-based compensation expense 3.4 7.6 13.1 12.7
Adjusted EBITDA $ 80.4 $ 72.9 $ 221.7 $ 183.9
(US$ millions)

Appendix – Adjusted EPS Reconciliation
26
Quarter ended Dec. 31 Year ended Dec. 31
2014 2013 2014 2013
Diluted net earnings (loss) per share from continuing operations $ 0.45 $ 0.11 $ 1.15 $ (0.48)
Non-controlling interest redemption increment 0.36 0.51 0.53 1.25
Acquisition-related items 0.16 0.05 0.31 0.30
Amortization of intangible assets, net of tax 0.11 0.10 0.43 0.73
Stock-based compensation expense, net of tax 0.08 0.19 0.31 0.33
Adjusted EPS $ 1.16 $ 0.96 $ 2.73 $ 2.13
(US$)