
FSprof: An In-Kernel File System Operations Profiler - Am-utils
12
FSprof: An In-Kernel File System Operations Profiler Nikolai Joukov,Charles P. Wright, and Erez Zadok Computer Science department Stony Brook University Stony Brook, NY 11794-4400 Technical Report FSL-04-06 kolya,cwright,[email protected] ABSTRACT Developing efficient file systems is difficult. Often, profiling tools are useful for analyzing system bottlenecks and correcting them. Whereas there are several techniques to profile system call activ- ity or disk-block activity, there are no good tools to profile file systems—which logically reside below system calls and above disk drivers. We developed a tool called FSprof that instruments existing file systems’ source code to profile their activity. This instrumen- tation incurs negligible runtime overhead. For file systems that do not have source code available, we also developed a thin file-system wrapper. When a profiled file system runs, it records operation frequencies and precise latencies and sorts them into configurable exponential buckets. We wrote additional tools to help verify, ana- lyze, and display the profiling data. We ran FSprof on several popular Linux file systems: Ext2, Ext3, Reiserfs, and a stackable (layered) file system called Wrapfs. Our analysis revealed interesting discoveries about file systems and ben- chmarks. We analyzed bi-modal and even tri-modal distributions we found in certain operation latencies, which result from com- plex interactions between file system caches and disks. We illus- trate how simple file system designs can lead to serious lock con- tention and slow down the entire operating system. We show how seemingly similar file system benchmarks can unexpectedly behave rather differently. We also observed that a tiny percentage of certain calls can have a disproportionate overall effect. FSprof is the first tool specifically designed for analyzing file system behavior, using high precision and a fine level of detail. FSprof helps developers collect and organize information, then di- agnose and optimize file system performance. Categories and Subject Descriptors C.4 [Performance of Systems]: Measurement Techniques and Per- formance Attributes; D.4.3 [Operating Systems]: File Systems Management; D.4.8 [Operating Systems]: Performance—Mea- surements, Monitors, and Operational Analysis General Terms Design, Measurement, Performance Permission to make digital or hard copies of all or part of this work for personal or classroom use is granted without fee provided that copies are not made or distributed for profit or commercial advantage and that copies bear this notice and the full citation on the first page. To copy otherwise, to republish, to post on servers or to redistribute to lists, requires prior specific permission and/or a fee. Copyright 200X ACM X-XXXXX-XX-X/XX/XX ...$5.00. Keywords File Systems, Profiling, Instrumentation 1. INTRODUCTION File systems control access to data; therefore, their performance is critical to many applications. Developing file systems is a dif- ficult task. Profiling tools are generally helpful in debugging and optimizing complex software systems. Alas, there are no profiling tools available specifically for file systems. Today, file system de- velopers must use one of several unsatisfactory techniques to pro- file file systems: • System call monitoring can show which file-system–related system calls applications invoke. The system call API is sim- ilar to file system APIs, but it is unsuitable for file system monitoring for two reasons. First, system calls do not map perfectly to file system events. For example, every system call that accesses a file name (e.g., open or mkdir) results in a file system lookup operation that translates pathnames to OS objects, typically followed by a permission-checking operation. In other words, file system designers develop to a different API than the system call API. Second, memory- mapped operations do not show up as system calls, but result in file system read page or write page operations, in- voked from a page fault handler. This means that system call tracing for the purpose of file system profiling ignores im- portant and commonly-used memory-mapped events. • Disk-device or block-level profiling shows raw block read and write requests going to a disk device [30]. However, at this low level, vital file system information is lost. At the device level, all we see are block reads and writes, and their offsets within the disk. There is no knowledge about whether the block is data or meta-data; what the block’s offset within a file is; what other blocks the block relates to; and more. • For network file systems such as NFS, protocol-level or packet- level profiling is often done [9]. Such profiling is limited by the protocol and often does not accurately reflect the file system’s operations. One reason is that network file system clients cache information and change sequences of opera- tions; because of this they appear different inside the net- work file system client’s OS vs. the network. Similarly, net- work file system servers perform caching and processing be- fore executing file system operations, so the network profile is representative of neither the client’s nor the server’s file- system activity. 1
Transcript of FSprof: An In-Kernel File System Operations Profiler - Am-utils
FSprof: An In-Kernel File System Operations Profiler
Nikolai Joukov, Charles P. Wright, and Erez ZadokComputer Science department
Stony Brook UniversityStony Brook, NY 11794-4400
Technical Report FSL-04-06
kolya,cwright,[email protected]
ABSTRACTDeveloping efficient file systems is difficult. Often, profiling toolsare useful for analyzing system bottlenecks and correcting them.Whereas there are several techniques to profile system call activ-ity or disk-block activity, there are no good tools to profile filesystems—which logically reside below system calls and above diskdrivers. We developed a tool called FSprof that instruments existingfile systems’ source code to profile their activity. This instrumen-tation incurs negligible runtime overhead. For file systems that donot have source code available, we also developed a thin file-systemwrapper. When a profiled file system runs, it records operationfrequencies and precise latencies and sorts them into configurableexponential buckets. We wrote additional tools to help verify, ana-lyze, and display the profiling data.
We ran FSprof on several popular Linux file systems: Ext2, Ext3,Reiserfs, and a stackable (layered) file system called Wrapfs. Ouranalysis revealed interesting discoveries about file systems and ben-chmarks. We analyzed bi-modal and even tri-modal distributionswe found in certain operation latencies, which result from com-plex interactions between file system caches and disks. We illus-trate how simple file system designs can lead to serious lock con-tention and slow down the entire operating system. We show howseemingly similar file system benchmarks can unexpectedly behaverather differently. We also observed that a tiny percentage of certaincalls can have a disproportionate overall effect.
FSprof is the first tool specifically designed for analyzing filesystem behavior, using high precision and a fine level of detail.FSprof helps developers collect and organize information, then di-agnose and optimize file system performance.
Categories and Subject DescriptorsC.4 [Performance of Systems]: Measurement Techniques and Per-formance Attributes; D.4.3 [Operating Systems]: File SystemsManagement; D.4.8 [Operating Systems]: Performance—Mea-surements, Monitors, and Operational Analysis
General TermsDesign, Measurement, Performance
Permission to make digital or hard copies of all or part of this work forpersonal or classroom use is granted without fee provided that copies arenot made or distributed for profit or commercial advantage and that copiesbear this notice and the full citation on the first page. To copy otherwise, torepublish, to post on servers or to redistribute to lists, requires prior specificpermission and/or a fee.Copyright 200X ACM X-XXXXX-XX-X/XX/XX ...$5.00.
KeywordsFile Systems, Profiling, Instrumentation
1. INTRODUCTIONFile systems control access to data; therefore, their performance
is critical to many applications. Developing file systems is a dif-ficult task. Profiling tools are generally helpful in debugging andoptimizing complex software systems. Alas, there are no profilingtools available specifically for file systems. Today, file system de-velopers must use one of several unsatisfactory techniques to pro-file file systems:
• System call monitoring can show which file-system–relatedsystem calls applications invoke. The system call API is sim-ilar to file system APIs, but it is unsuitable for file systemmonitoring for two reasons. First, system calls do not mapperfectly to file system events. For example, every systemcall that accesses a file name (e.g., open or mkdir) resultsin a file system lookup operation that translates pathnamesto OS objects, typically followed by a permission-checkingoperation. In other words, file system designers develop toa different API than the system call API. Second, memory-mapped operations do not show up as system calls, but resultin file system read page or write page operations, in-voked from a page fault handler. This means that system calltracing for the purpose of file system profiling ignores im-portant and commonly-used memory-mapped events.
• Disk-device or block-level profiling shows raw block readand write requests going to a disk device [30]. However, atthis low level, vital file system information is lost. At thedevice level, all we see are block reads and writes, and theiroffsets within the disk. There is no knowledge about whetherthe block is data or meta-data; what the block’s offset withina file is; what other blocks the block relates to; and more.
• For network file systems such as NFS, protocol-level or packet-level profiling is often done [9]. Such profiling is limitedby the protocol and often does not accurately reflect the filesystem’s operations. One reason is that network file systemclients cache information and change sequences of opera-tions; because of this they appear different inside the net-work file system client’s OS vs. the network. Similarly, net-work file system servers perform caching and processing be-fore executing file system operations, so the network profileis representative of neither the client’s nor the server’s file-system activity.
1
• Whole-kernel profilers provide information about the CPUexecution time of every OS function, including file systemfunctions. These profilers use a combination of sampling andhooks at function entry/exit points to produce an approxima-tion of how much CPU and I/O each function used, and a cor-responding call graph. Unfortunately, these profilers do nothave file-system–specific information so they must record in-formation on every kernel function, leading to higher over-heads. Finally, the profiles do not provide the distribution oftime used by a function, but rather the average time used.
In other words, existing profiling techniques are unsuitable forprecise file system profiling. This is not surprising, since none ofthese techniques operate at the exact level of the file system: systemcalls are above, disk-block and networks are below file systems,and whole-kernel profiling is too general and therefore inefficient.
File systems are complex pieces of software that may interactwith several other subsystems: the VM system and page caches,disk device drivers, and networks. As such, file systems includea mix of CPU-intensive and I/O-intensive operations with widelyvarying latencies and frequencies. These interactions are non-trivialand make it particularly difficult to analyze file system behavior.
The lack of proper file system profiling tools has forced file sys-tem developers to resort to ad-hoc or indirect techniques to analyzefile system behavior. Our experience over the last decade is nodifferent. For example, we often wrote small programs to micro-benchmark a specific file system operation, typically by calling sys-tem calls; as mentioned above, system calls embody multiple filesystem operations and thus cannot separate the behavior of each filesystem operation. At other times we used a large compile to bench-mark a file system, Postmark [14] to stress meta-data operations, orfsx [18] to stress the file system’s interaction with the VM.
In this paper we introduce FSprof, the first profiling tool that wasspecifically designed for analyzing file system behavior. FSprofcan provide accurate counts of each file system operation at the filesystem level, and very precise timing for file system operations.FSprof operates in two modes. First, if source code is available,FSprof instruments the file system source with built-in profilingand timing. This instrumentation was carefully designed to ensurethat the overhead introduced was negligible: less than 100 CPUcycles per file system operation and below 1% of elapsed time forI/O-intensive workloads. Second, if source code is not available,we have developed a thin file-system wrapper with FSprof built in,which can be mounted on top of any other file system, to interceptand measure the mounted-on file system’s operations.
Using FSprof we analyzed several common file system bench-marks: a few compile benchmarks, Postmark, and a recursive grepmicrobenchmark. Our analysis revealed several unexpected results.First, we scientifically verified that file systems contain complexinteractions; this was seen in bi-modal and tri-modal operation la-tency distributions we found, investigated, and explained. Second,we found that for some common combinations of file systems andbenchmarks, a small fraction of operations accounted for the vastmajority of time the file system spent executing a certain type ofoperation; this implied that small changes in benchmarks can re-sult in non-negligible performance differences. We show that filesystems’ performance is generally sensitive to a disproportionallysmall number of operations. Third, we found that seemingly simi-lar (large-compile) benchmarks can produce rather different resultsdue to differences in file system operation mixes. Finally, we showthat file systems must be designed very carefully, or face significantperformance bottlenecks (i.e., lock contention), or worse—hurt theperformance of the entire operating system.
FSprof is a unique tool that for the first time offers kernel de-
velopers a direct window into the inner workings of file systems.We believe that FSprof is a promising tool and technique, becausewe were able to discover and explain several counter-intuitive file-system behaviors in just a few months with FSprof. With very lowoverheads and precise measurements, we hope that FSprof will be-come a common tool used by file system developers in the future.
The rest of this paper is organized as follows. Section 2 describesthe guiding principles of our design and Section 3 describes the im-plementation of our system. We evaluate our system in Section 4.In Section 5 we present several usage scenarios and analyze profilesof several real-world file systems and workloads. We describe re-lated work in Section 6. We conclude and discuss future directionsin Section 7.
2. DESIGNWhen designing FSprof, we made three main decisions: latency
aggregation, using exponential buckets to collect results, and onlyprofiling VFS operations.
Latency aggregation We capture the latency of file system op-erations. It can serve as an ideal metric for file system profilingbecause the operation latency contains information about the oper-ation’s CPU execution time as well as the associated I/O requestdelays.
Capturing the function execution latency is simple, and requiresminimal code instrumentation. Early code-profiling tools rejectedlatency as a viable performance metric, because in multitasking en-vironments the program can be rescheduled at any arbitrary pointin time, perturbing the results. Fortunately, execution in the Unixkernel is different from execution in user space. The kernel can bepreempted only at certain points, when the file system operationspecifically waits on I/O requests, waits to get a lock, or yields theCPU. Most functions have only a few such points, and their pres-ence simply adds to the possible delay (as observed by both theuser and FSprof). Some kernels can be compiled with kernel codeexecution preemption enabled. However, even in that case, profilesgenerated by single processes are not affected by the preemption aswe show in Section 5.1.2. Analyzing multi-process workloads on apreemptible kernel is beyond the scope of this paper.
Exponential buckets The captured latencies are sorted and storedin exponential buckets. Different code execution paths form differ-ent peaks on the histogram; therefore, there is no need to preserveinformation about every individual execution of an operation.
Collecting statistical information in buckets is a common pro-gram profiling technique, which allows measuring the most in-teresting information without burdensome storage and processingrequirements. Usually, information is stored in linear histogramswhere information is distributed in buckets that represent severalCPU instructions or code lines. In contrast, we store the number ofoperations with a given latency in the bucket corresponding to thatlatency. Therefore, our histogram is not directly tied to the sourcecode. Nevertheless, the distribution of latencies forms well-definedpeaks that can be easily correlated with the file system code. Weused exponentially distributed buckets because the difference be-tween the latencies of the different execution paths can be severalorders of magnitude. For example, to return cached informationmight take tens of instructions (i.e., only a few nanoseconds), butto access the disk or network takes tens of milliseconds.
VFS operations profiling We capture latencies of only VirtualFile System (VFS) operations. This allows us to add minimal mem-ory and time overheads, while capturing all file-system–related ac-tivities. The VFS interface defines a limited set of operations on
2
0 100 200 300 400 500 600 700 800
Num
ber
of o
pera
tions
Bucket (2 x-1 <= N < 2 x
CPU Cycles) Elapsed time (x2
34 CPU Cycles)
z
y
x
5
10
15
20
25
30 0
5 10
15 20
25 30
35 40
0
100
200
300
400
500
600
700
800
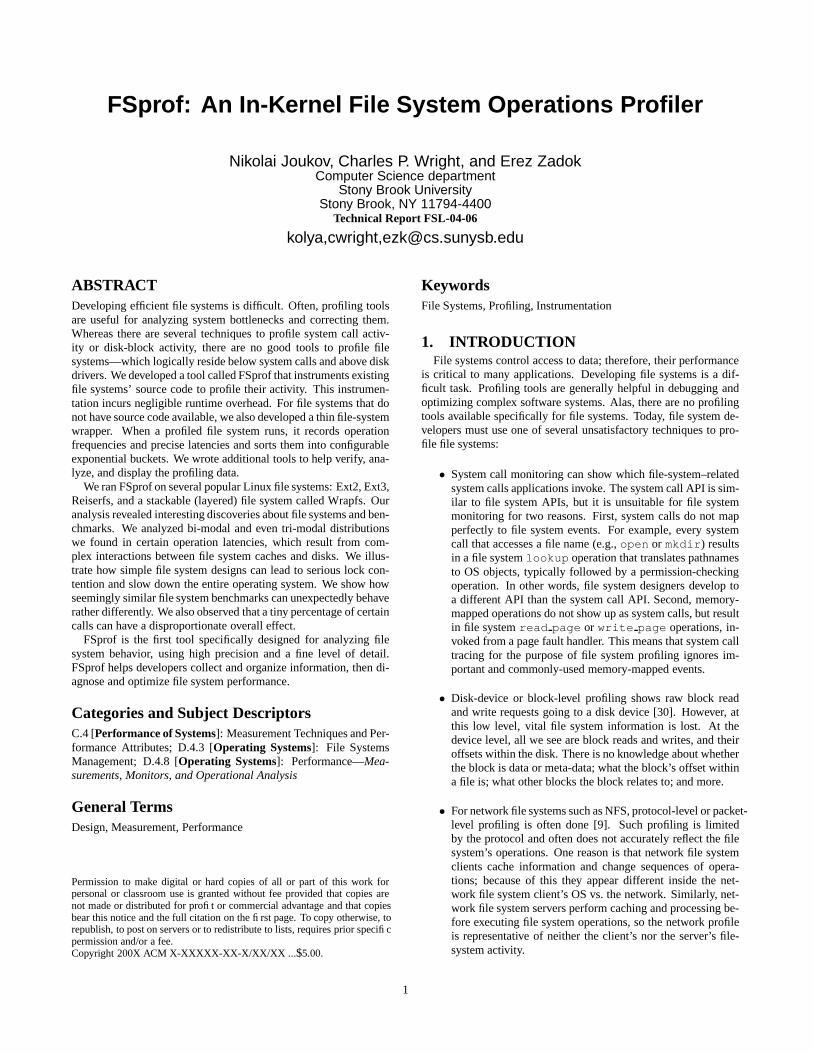
Figure 1: Profile of the Ext2 lookup operation under the ker-nel build workload. (Number of operations in every bucket.)
0 1e+08 2e+08 3e+08 4e+08 5e+08 6e+08 7e+08
Tot
al d
elay
(C
PU
cyc
les)
Bucket (2 x-1 <= N < 2 x
CPU Cycles) Elapsed time (x2
34 CPU Cycles)
z
y
x
5
10
15
20
25
30 0
5 10
15 20
25 30
35 40
0
1e+08
2e+08
3e+08
4e+08
5e+08
6e+08
7e+08
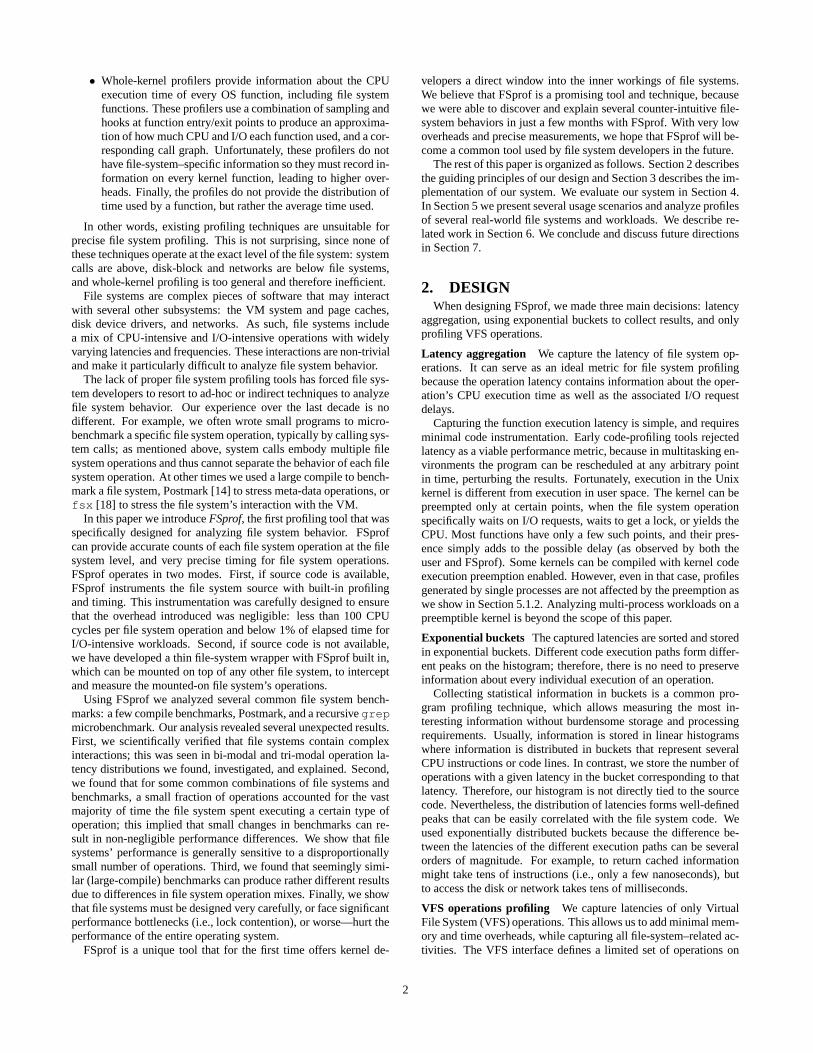
Figure 2: Profile of the Ext2 lookup operation under the ker-nel build workload. (Total delay of each bucket.)
file system primitives, which are the only interface between the up-per OS layers and a file system. Therefore, it is sufficient to profileVFS operations to collect information about all of a file system’sactivity. There are 74 VFS operations on five objects, but most filesystems only define a subset of them (e.g., Ext2 defines functionsfor only 28 VFS operations).
Not all measured latencies directly contribute to the total systemand elapsed time (including I/O) as seen by user space, becausesome VFS operations call other VFS operations. For example, aftera directory entry is found, lookup calls read inode to locateand read the on-disk inode structure into memory. Therefore, oneneeds to understand the file system call graph structure to correlatethe total system and I/O times with the captured profile. Fortu-nately, in many cases the call graph structure can be inferred fromthe profile. Operations that call other VFS operations often havelatency distribution peaks that are a superposition of the peaks ofthe called operations. More details about the VFS operation callgraphs and modes of operation can be obtained using incrementalprofiling techniques described in Section 5.1.1.
To capture the dependence of file system operations on a certainpart of a run, we save the latency distribution at pre-defined inter-vals. Therefore, the profile is a 4-dimensional view of file systemoperations consisting of:
• VFS operation• Latency• Number of operations with this latency• Elapsed time interval
Figure 1 shows an example 3D view of the lookup operation onExt2. The z axis contains the number of operations that fall within
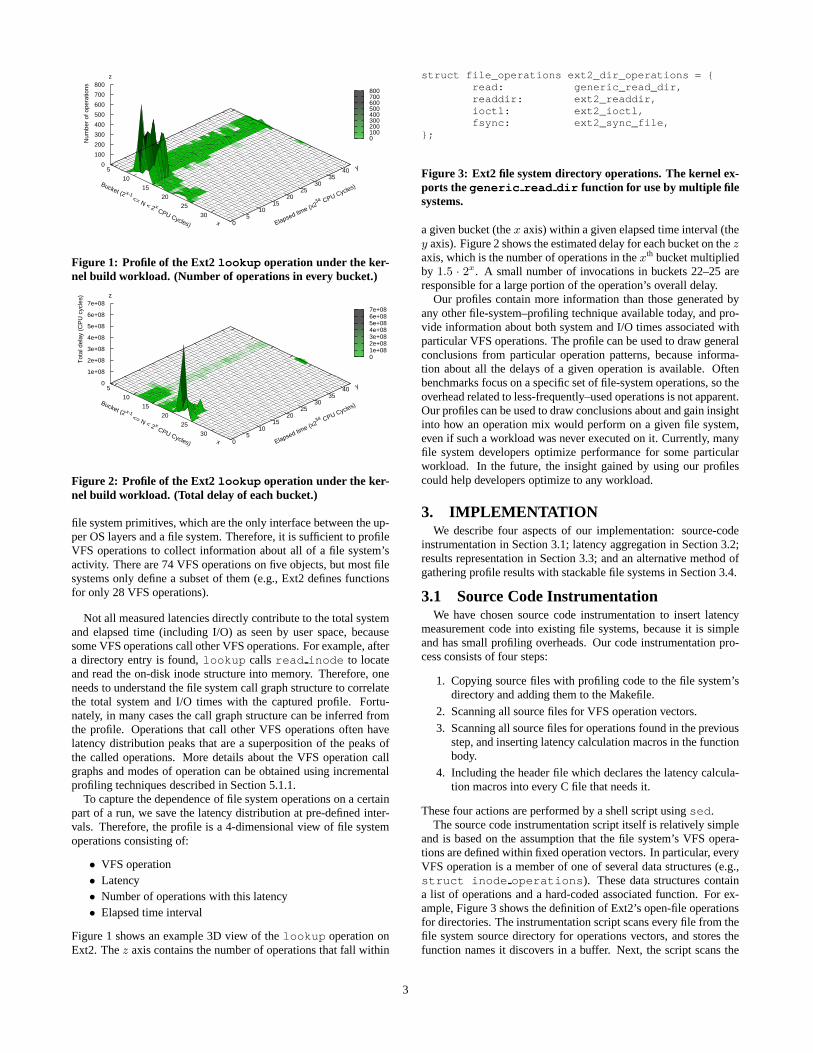
struct file_operations ext2_dir_operations = {read: generic_read_dir,readdir: ext2_readdir,ioctl: ext2_ioctl,fsync: ext2_sync_file,
};
Figure 3: Ext2 file system directory operations. The kernel ex-ports the generic read dir function for use by multiple filesystems.
a given bucket (the x axis) within a given elapsed time interval (they axis). Figure 2 shows the estimated delay for each bucket on the zaxis, which is the number of operations in the xth bucket multipliedby 1.5 · 2x. A small number of invocations in buckets 22–25 areresponsible for a large portion of the operation’s overall delay.
Our profiles contain more information than those generated byany other file-system–profiling technique available today, and pro-vide information about both system and I/O times associated withparticular VFS operations. The profile can be used to draw generalconclusions from particular operation patterns, because informa-tion about all the delays of a given operation is available. Oftenbenchmarks focus on a specific set of file-system operations, so theoverhead related to less-frequently–used operations is not apparent.Our profiles can be used to draw conclusions about and gain insightinto how an operation mix would perform on a given file system,even if such a workload was never executed on it. Currently, manyfile system developers optimize performance for some particularworkload. In the future, the insight gained by using our profilescould help developers optimize to any workload.
3. IMPLEMENTATIONWe describe four aspects of our implementation: source-code
instrumentation in Section 3.1; latency aggregation in Section 3.2;results representation in Section 3.3; and an alternative method ofgathering profile results with stackable file systems in Section 3.4.
3.1 Source Code InstrumentationWe have chosen source code instrumentation to insert latency
measurement code into existing file systems, because it is simpleand has small profiling overheads. Our code instrumentation pro-cess consists of four steps:
1. Copying source files with profiling code to the file system’sdirectory and adding them to the Makefile.
2. Scanning all source files for VFS operation vectors.
3. Scanning all source files for operations found in the previousstep, and inserting latency calculation macros in the functionbody.
4. Including the header file which declares the latency calcula-tion macros into every C file that needs it.
These four actions are performed by a shell script using sed.The source code instrumentation script itself is relatively simple
and is based on the assumption that the file system’s VFS opera-tions are defined within fixed operation vectors. In particular, everyVFS operation is a member of one of several data structures (e.g.,struct inode operations). These data structures containa list of operations and a hard-coded associated function. For ex-ample, Figure 3 shows the definition of Ext2’s open-file operationsfor directories. The instrumentation script scans every file from thefile system source directory for operations vectors, and stores thefunction names it discovers in a buffer. Next, the script scans the
3

file system source files for the functions found during the previousphase. A profiling startup macro called FSPROF PRE(op) is in-serted at the beginning of every function found to begin measuringthe latency. Every return statement and the end of void functions ispreceded with an FSPROF POST(op) macro, which ends the la-tency measurement. In both cases, op is replaced with the name ofthe current VFS operation. For non-void functions of type f type,the return statements are transformed from return foo(x) to:
{f_type tmp_return_variable = foo(x);FSPROF_POST(op);return tmp_return_variable;
}
This transformation captures the latency of the expression foo(x).Often, file systems use generic functions exported by the kernel.
For example, the Ext2 file system uses the generic read dirkernel function for its read operation as shown in Figure 3. Tocapture the latencies of such external functions, we created a sepa-rate C file with wrappers for these functions that are instrumentedusing the standard macros. These wrapper functions have the namesof the wrapped functions preceded by the FSprof prefix. We useactual wrapper functions as opposed to inline functions or macros,so that our function has an address for the operations vector to use.The same prefix is inserted for all external functions in the opera-tion vectors. Our wrapper functions are similarly instrumented withthe macros and are called instead of the original external functions.
The instrumentation program is a shell script with sed frag-ments, and is only 220 lines long. The script does not parse Cprogram code; instead, it looks for particular patterns within file-system code. Despite its simplicity, the script successfully instru-mented all the file systems we tried it on (Ext2 and Ext3 [8], Reis-erfs 3.6 and 4.0 [22], NFS [20], NTFS [24], and FiST-generatedstackable file systems [33]) under Linux kernel versions 2.4.24 and2.6.8. We have paid special attention to detecting possible parsingerrors. In particular, the script provides informative error messagesif a deviation from expected patterns is detected.
3.2 Latency AggregationThe FSPROF PRE(op) macro declares a variable to store the
time and a call to the FSprof pre function that actually writesthe time into that variable. Before returning the invocation time,the FSprof pre function also updates a per-operation counter.The FSPROF POST(op) macro calls the FSprof post func-tion, which takes the operation name and the function invocationtime stored by FSprof pre as arguments. It queries the currenttime and calculates the operation latency. Then it adds the latencyto the total operation’s latency value and adds one to bucket k suchthat 2k−1
≤ latency < 2k. (Bucket sizes can be configured, butwe primarily used log
2buckets.) By having separate counters in
the FSprof pre and FSprof post functions, post-processingscripts can verify that there were no errors in code instrumentation,storing values, and sending the profile to user-space.
To profile fast VFS operations, we needed to measure the timewith a resolution of tens of nanoseconds. The only simple andfast way to do it is to use the CPU cycle counter (TSC on x86),which is built into most modern microprocessors. This method isfast because querying the counter consists of just a single CPU in-struction. On Linux, other less precise and slower time-keepingfunctions (e.g., gettimeofday) eventually use the same counter. Onmultiprocessor systems, Linux synchronizes the cycle counters onall the CPUs with a precision of one microsecond. The scheduleris trying to schedule the task on the same CPU as it ran on before.If, however, a task is rescheduled to another processor, then the
measured latency has only a microsecond precision. Fortunately,the probability that a fast VFS operation is rescheduled is smallbecause the quantum of time a process is allowed to run (usually1/10 of a second) is much longer than the latency of the fast op-erations. On the other hand, a slow operation’s latency is not se-riously affected by an errant microsecond, because the buckets aredistributed exponentially. Therefore, we believe that our profile re-sults are credible even on multiprocessor systems. To be consistent,we store and analyze all time values in terms of CPU cycles.
The profile can be accessed through an entry in the /proc filesystem. Profiles can be read from /proc in plaintext format. Plain-text is more convenient than binary data, because it is directly human-readable and powerful text processing utilities can be used to ana-lyze it. The overhead associated with generating the plaintext pro-file is small, because the results are generally small and reading theprofile is a rare operation. Writing to the per-file–system /procentry resets the profile’s counters.
3.3 Results RepresentationWe wrote a script that generates 2-dimensional and 3-dimensional
views from the 4-dimensional profile data. We found the followingthree data views for a particular VFS-operation especially useful:
• The number of invocations with a given latency within eachelapsed-time interval.
• The total number of invocations with a given latency.• The total operation latency in each elapsed-time interval.
The last two views are obtained from the original 4D profiles bysumming up the values in one of the dimensions.
In addition, the data-processing script checks the profile for con-sistency. In particular, for every operation, results in all of thebuckets are summed and then compared with the total number ofoperations. These numbers are added to the profile during differentprofiling phases, so this verification catches potential code instru-mentation errors.
We created a set of scripts that generate formatted text views andGnuplot [11] scripts to generate 3D and 2D views of the data. Allthe figures representing profiles in this paper were automaticallygenerated.
3.4 Stackable ProfilingStackable file systems are a layer between the VFS code and
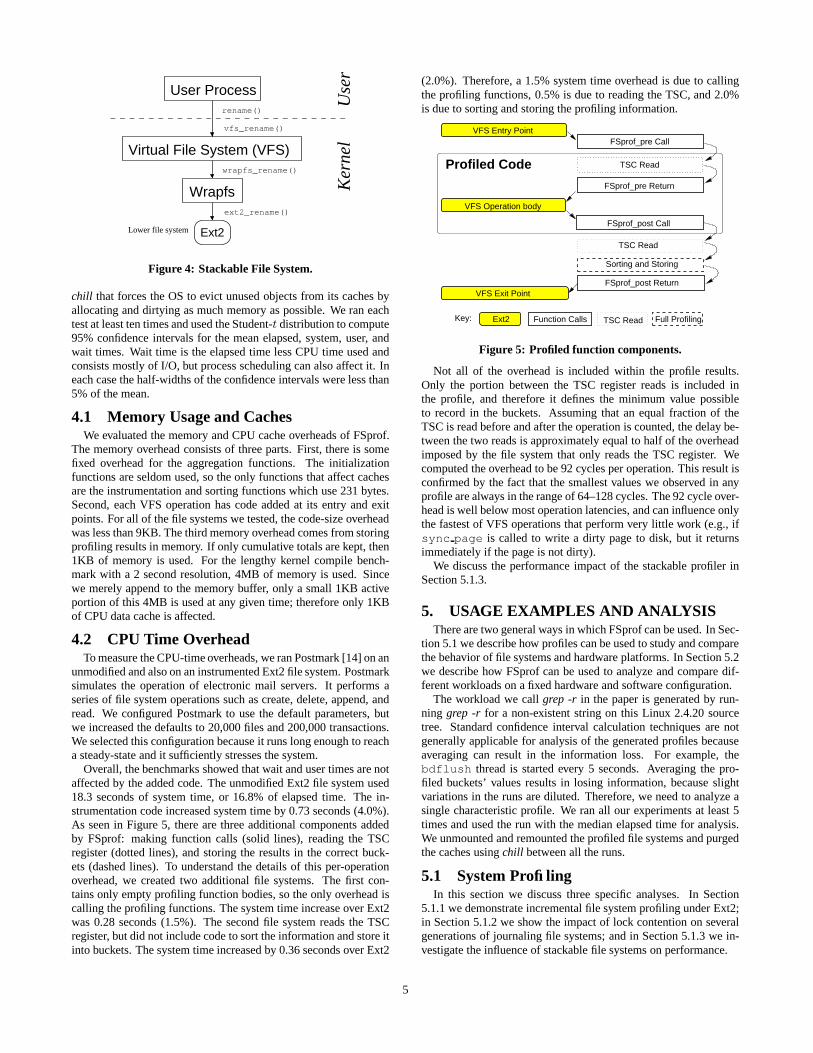
lower-file systems (e.g., Ext2) [33]. They appear as normal filesystems to the VFS code that invokes VFS operations and as theVFS to the file system they are layered on. Essentially, they passthrough the calls from the VFS to the file system they are layeredon as shown in Figure 4. This makes them ideal for profiling filesystems whose source code is not available. We instrumented asimple pass-through stackable file system, called Wrapfs, that ispart of the open-source FiST toolkit [33]. We analyze the resultingoverheads for the instrumented stackable Wrapfs in Section 5.1.3.
4. EVALUATIONUsing Ext2 as a baseline, we evaluated the overhead of FSprof
with respect to memory usage, CPU cache usage, latency added toeach profiled operation, and execution time.
We conducted all our experiments on a 1.7GHz Pentium 4 ma-chine with 256KB of cache and 1GB of RAM. It has an IDE systemdisk, and the benchmarks ran on a dedicated Maxtor Atlas 15,000RPM 18.4GB Ultra320 SCSI disk with an Adaptec 29160 SCSIcontroller. We unmounted and remounted all tested file systems be-fore every benchmark run. We also ran a program we wrote called
4
Ext2
Wrapfsext2_rename()
User Process
Virtual File System (VFS)
rename()
vfs_rename()
Ker
nel
Use
r
wrapfs_rename()
Lower file system
Figure 4: Stackable File System.
chill that forces the OS to evict unused objects from its caches byallocating and dirtying as much memory as possible. We ran eachtest at least ten times and used the Student-t distribution to compute95% confidence intervals for the mean elapsed, system, user, andwait times. Wait time is the elapsed time less CPU time used andconsists mostly of I/O, but process scheduling can also affect it. Ineach case the half-widths of the confidence intervals were less than5% of the mean.
4.1 Memory Usage and CachesWe evaluated the memory and CPU cache overheads of FSprof.
The memory overhead consists of three parts. First, there is somefixed overhead for the aggregation functions. The initializationfunctions are seldom used, so the only functions that affect cachesare the instrumentation and sorting functions which use 231 bytes.Second, each VFS operation has code added at its entry and exitpoints. For all of the file systems we tested, the code-size overheadwas less than 9KB. The third memory overhead comes from storingprofiling results in memory. If only cumulative totals are kept, then1KB of memory is used. For the lengthy kernel compile bench-mark with a 2 second resolution, 4MB of memory is used. Sincewe merely append to the memory buffer, only a small 1KB activeportion of this 4MB is used at any given time; therefore only 1KBof CPU data cache is affected.
4.2 CPU Time OverheadTo measure the CPU-time overheads, we ran Postmark [14] on an
unmodified and also on an instrumented Ext2 file system. Postmarksimulates the operation of electronic mail servers. It performs aseries of file system operations such as create, delete, append, andread. We configured Postmark to use the default parameters, butwe increased the defaults to 20,000 files and 200,000 transactions.We selected this configuration because it runs long enough to reacha steady-state and it sufficiently stresses the system.
Overall, the benchmarks showed that wait and user times are notaffected by the added code. The unmodified Ext2 file system used18.3 seconds of system time, or 16.8% of elapsed time. The in-strumentation code increased system time by 0.73 seconds (4.0%).As seen in Figure 5, there are three additional components addedby FSprof: making function calls (solid lines), reading the TSCregister (dotted lines), and storing the results in the correct buck-ets (dashed lines). To understand the details of this per-operationoverhead, we created two additional file systems. The first con-tains only empty profiling function bodies, so the only overhead iscalling the profiling functions. The system time increase over Ext2was 0.28 seconds (1.5%). The second file system reads the TSCregister, but did not include code to sort the information and store itinto buckets. The system time increased by 0.36 seconds over Ext2
(2.0%). Therefore, a 1.5% system time overhead is due to callingthe profiling functions, 0.5% is due to reading the TSC, and 2.0%is due to sorting and storing the profiling information.
VFS Entry Point
TSC Read
FSprof_pre Return
Sorting and Storing
Full ProfilingTSC ReadFunction CallsExt2
FSprof_post Call
FSprof_pre Call
Profiled Code
VFS Operation body
TSC Read
FSprof_post Return VFS Exit Point
Key:
Figure 5: Profiled function components.
Not all of the overhead is included within the profile results.Only the portion between the TSC register reads is included inthe profile, and therefore it defines the minimum value possibleto record in the buckets. Assuming that an equal fraction of theTSC is read before and after the operation is counted, the delay be-tween the two reads is approximately equal to half of the overheadimposed by the file system that only reads the TSC register. Wecomputed the overhead to be 92 cycles per operation. This result isconfirmed by the fact that the smallest values we observed in anyprofile are always in the range of 64–128 cycles. The 92 cycle over-head is well below most operation latencies, and can influence onlythe fastest of VFS operations that perform very little work (e.g., ifsync page is called to write a dirty page to disk, but it returnsimmediately if the page is not dirty).
We discuss the performance impact of the stackable profiler inSection 5.1.3.
5. USAGE EXAMPLES AND ANALYSISThere are two general ways in which FSprof can be used. In Sec-
tion 5.1 we describe how profiles can be used to study and comparethe behavior of file systems and hardware platforms. In Section 5.2we describe how FSprof can be used to analyze and compare dif-ferent workloads on a fixed hardware and software configuration.
The workload we call grep -r in the paper is generated by run-ning grep -r for a non-existent string on this Linux 2.4.20 sourcetree. Standard confidence interval calculation techniques are notgenerally applicable for analysis of the generated profiles becauseaveraging can result in the information loss. For example, thebdflush thread is started every 5 seconds. Averaging the pro-filed buckets’ values results in losing information, because slightvariations in the runs are diluted. Therefore, we need to analyze asingle characteristic profile. We ran all our experiments at least 5times and used the run with the median elapsed time for analysis.We unmounted and remounted the profiled file systems and purgedthe caches using chill between all the runs.
5.1 System ProfilingIn this section we discuss three specific analyses. In Section
5.1.1 we demonstrate incremental file system profiling under Ext2;in Section 5.1.2 we show the impact of lock contention on severalgenerations of journaling file systems; and in Section 5.1.3 we in-vestigate the influence of stackable file systems on performance.
5
1 10
100 1000
10000 write_super
5 10 15 20 25 30 35
Bucket (2n-1 <= x < 2n CPU Cycles)
Num
ber
of o
pera
tions
1 10
100 1000
10000 write_inode 1
10 100
1000 10000 sync_page
1 10
100 1000
10000 release 1
10 100
1000 10000 readpage
1 10
100 1000
10000 read_inode 1
10 100
1000 10000 readdir
1 10
100 1000
10000 read 1
10 100
1000 10000 open
1 10
100 1000
10000 lookup 1
10 100
1000 10000 follow_link
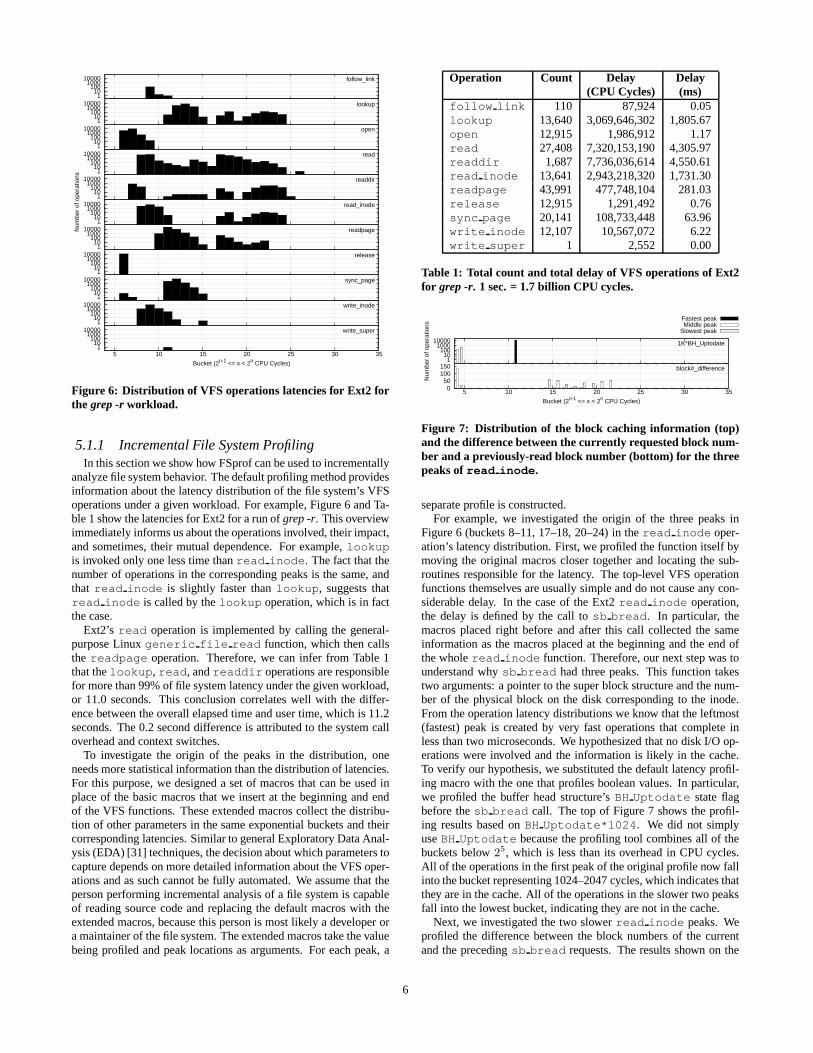
Figure 6: Distribution of VFS operations latencies for Ext2 forthe grep -r workload.
5.1.1 Incremental File System ProfilingIn this section we show how FSprof can be used to incrementally
analyze file system behavior. The default profiling method providesinformation about the latency distribution of the file system’s VFSoperations under a given workload. For example, Figure 6 and Ta-ble 1 show the latencies for Ext2 for a run of grep -r. This overviewimmediately informs us about the operations involved, their impact,and sometimes, their mutual dependence. For example, lookupis invoked only one less time than read inode. The fact that thenumber of operations in the corresponding peaks is the same, andthat read inode is slightly faster than lookup, suggests thatread inode is called by the lookup operation, which is in factthe case.
Ext2’s read operation is implemented by calling the general-purpose Linux generic file read function, which then callsthe readpage operation. Therefore, we can infer from Table 1that the lookup, read, and readdir operations are responsiblefor more than 99% of file system latency under the given workload,or 11.0 seconds. This conclusion correlates well with the differ-ence between the overall elapsed time and user time, which is 11.2seconds. The 0.2 second difference is attributed to the system calloverhead and context switches.
To investigate the origin of the peaks in the distribution, oneneeds more statistical information than the distribution of latencies.For this purpose, we designed a set of macros that can be used inplace of the basic macros that we insert at the beginning and endof the VFS functions. These extended macros collect the distribu-tion of other parameters in the same exponential buckets and theircorresponding latencies. Similar to general Exploratory Data Anal-ysis (EDA) [31] techniques, the decision about which parameters tocapture depends on more detailed information about the VFS oper-ations and as such cannot be fully automated. We assume that theperson performing incremental analysis of a file system is capableof reading source code and replacing the default macros with theextended macros, because this person is most likely a developer ora maintainer of the file system. The extended macros take the valuebeing profiled and peak locations as arguments. For each peak, a
Operation Count Delay Delay(CPU Cycles) (ms)
follow link 110 87,924 0.05lookup 13,640 3,069,646,302 1,805.67open 12,915 1,986,912 1.17read 27,408 7,320,153,190 4,305.97readdir 1,687 7,736,036,614 4,550.61read inode 13,641 2,943,218,320 1,731.30readpage 43,991 477,748,104 281.03release 12,915 1,291,492 0.76sync page 20,141 108,733,448 63.96write inode 12,107 10,567,072 6.22write super 1 2,552 0.00
Table 1: Total count and total delay of VFS operations of Ext2for grep -r. 1 sec. = 1.7 billion CPU cycles.
150 100
500
block#_difference
5 10 15 20 25 30 35
Bucket (2n-1 <= x < 2n CPU Cycles)
Num
ber
of o
pera
tions
1 10
100 1000
10000 1K*BH_Uptodate
Fastest peakMiddle peak
Slowest peak
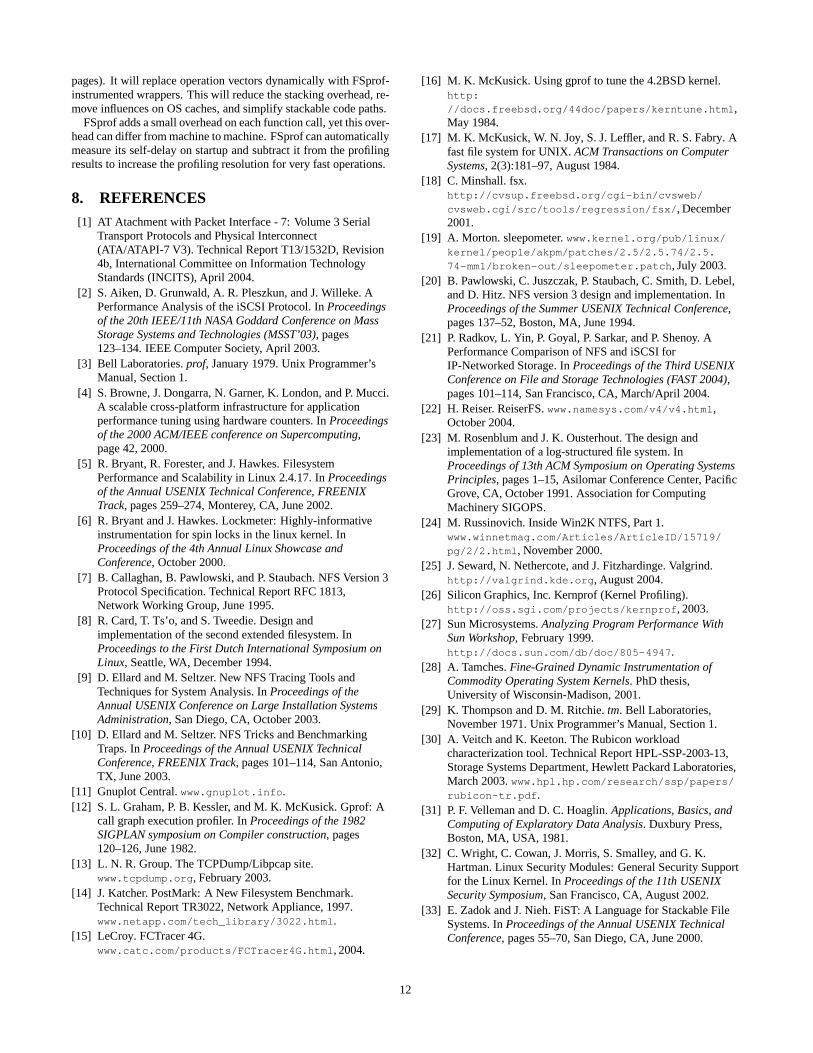
Figure 7: Distribution of the block caching information (top)and the difference between the currently requested block num-ber and a previously-read block number (bottom) for the threepeaks of read inode.
separate profile is constructed.For example, we investigated the origin of the three peaks in
Figure 6 (buckets 8–11, 17–18, 20–24) in the read inode oper-ation’s latency distribution. First, we profiled the function itself bymoving the original macros closer together and locating the sub-routines responsible for the latency. The top-level VFS operationfunctions themselves are usually simple and do not cause any con-siderable delay. In the case of the Ext2 read inode operation,the delay is defined by the call to sb bread. In particular, themacros placed right before and after this call collected the sameinformation as the macros placed at the beginning and the end ofthe whole read inode function. Therefore, our next step was tounderstand why sb bread had three peaks. This function takestwo arguments: a pointer to the super block structure and the num-ber of the physical block on the disk corresponding to the inode.From the operation latency distributions we know that the leftmost(fastest) peak is created by very fast operations that complete inless than two microseconds. We hypothesized that no disk I/O op-erations were involved and the information is likely in the cache.To verify our hypothesis, we substituted the default latency profil-ing macro with the one that profiles boolean values. In particular,we profiled the buffer head structure’s BH Uptodate state flagbefore the sb bread call. The top of Figure 7 shows the profil-ing results based on BH Uptodate*1024. We did not simplyuse BH Uptodate because the profiling tool combines all of thebuckets below 25, which is less than its overhead in CPU cycles.All of the operations in the first peak of the original profile now fallinto the bucket representing 1024–2047 cycles, which indicates thatthey are in the cache. All of the operations in the slower two peaksfall into the lowest bucket, indicating they are not in the cache.
Next, we investigated the two slower read inode peaks. Weprofiled the difference between the block numbers of the currentand the preceding sb bread requests. The results shown on the
6

1 10
100 1000
10000
100000 1e+06 1e+07 1e+08 1e+09write_super
5 10 15 20 25 30 35
Bucket (2n-1 <= x < 2n CPU Cycles)
Num
ber
of o
pera
tions
Tot
al d
elay
(C
PU
cyc
les)
1 10
100 1000
10000
100000 1e+06 1e+07 1e+08 1e+09write_inode
1 10
100 1000
10000
100000 1e+06 1e+07 1e+08 1e+09sync_page
1 10
100 1000
10000
100000 1e+06 1e+07 1e+08 1e+09release
1 10
100 1000
10000
100000 1e+06 1e+07 1e+08 1e+09readpage
1 10
100 1000
10000
100000 1e+06 1e+07 1e+08 1e+09readdir
1 10
100 1000
10000
100000 1e+06 1e+07 1e+08 1e+09read
1 10
100 1000
10000
100000 1e+06 1e+07 1e+08 1e+09lookup
1 10
100 1000
10000
100000 1e+06 1e+07 1e+08 1e+09dirty_inode
Number of operationsTotal delay (CPU cycles)
Figure 8: Profile of Reiserfs 3.6 (default configuration) underthe grep -r workload.
1 10
100 1000
10000
100000 1e+06 1e+07 1e+08 1e+09write_super
5 10 15 20 25 30 35
Bucket (2n-1 <= x < 2n CPU Cycles)
Num
ber
of o
pera
tions
Tot
al d
elay
(C
PU
cyc
les)
1 10
100 1000
10000
100000 1e+06 1e+07 1e+08 1e+09write_inode
1 10
100 1000
10000
100000 1e+06 1e+07 1e+08 1e+09sync_page
1 10
100 1000
10000
100000 1e+06 1e+07 1e+08 1e+09release
1 10
100 1000
10000
100000 1e+06 1e+07 1e+08 1e+09readpage
1 10
100 1000
10000
100000 1e+06 1e+07 1e+08 1e+09readdir
1 10
100 1000
10000
100000 1e+06 1e+07 1e+08 1e+09read
1 10
100 1000
10000
100000 1e+06 1e+07 1e+08 1e+09lookup
1 10
100 1000
10000
100000 1e+06 1e+07 1e+08 1e+09dirty_inode
Number of operationsTotal delay (CPU cycles)
Figure 9: Profile of Reiserfs 3.6 (with notail) under the grep -rworkload.
bottom of Figure 7 indicate that there is a strong correlation be-tween the peaks and the profiled value. In particular, 88% of theoperations in the middle peak are requests to read inodes locatedclose to a previously read inode. On the other hand, 94% of theread requests in the slowest peak are requests to read inodes lo-cated 16K–8M disk blocks away from the last read inode. We knowthat blocks with close block numbers are usually located physicallyclose to each other. Therefore, we can conclude that the middlepeak is defined by the reads that do not require long disk head seeksand the right peak is defined by the operations that do require them.These results correspond to our knowledge of Ext2, which uses anFFS-like allocation scheme [8]. Inodes in the same directory arestored in the same cylinder group (so they have close block num-bers), but inodes in different directories are spread throughout thedisk.
5.1.2 Lock Contention and Journaling
0 2 4 6 8
10
5 10 15 20 25 30 35
Bucket (2n-1 <= x < 2n CPU Cycles)
write_super
Ela
psed
tim
e (4
G C
PU
cyc
les)
> 100 Operations11-100 Operations
1-10 Operations
0 2 4 6 8
10
5 10 15 20 25 30 35
Bucket (2n-1 <= x < 2n CPU Cycles)
read
Ela
psed
tim
e (4
G C
PU
cyc
les)
> 100 Operations11-100 Operations
1-10 Operations
Figure 10: Latency distribution compared to elapsed time forwrite super (left) and read (right) on Reiserfs 3.6 (defaultconfiguration).
0
2
4
6
8
5 10 15 20 25 30 35
Bucket (2n-1 <= x < 2n CPU Cycles)
write_super
Ela
psed
tim
e (4
G C
PU
cyc
les) > 100 Operations
11-100 Operations1-10 Operations
0
2
4
6
8
5 10 15 20 25 30 35
Bucket (2n-1 <= x < 2n CPU Cycles)
read
Ela
psed
tim
e (4
G C
PU
cyc
les) > 100 Operations
11-100 Operations1-10 Operations
Figure 11: Latency distribution compared to elapsed time forwrite super (left) and read (right) on Reiserfs 3.6 (with no-tail).
In this section we demonstrate how FSprof can be used to dis-cover lock contention problems in file systems. We profiled Reis-erfs 3.6 under the grep -r workload. Reiserfs 3.6 is now the defaultfile system in several distributions of Linux. The profile with thedefault Reiserfs configuration is shown in Figure 8. By default,Reiserfs enables tail merging which combines small files and theends of files into a single disk block. As seen in Figure 9, wealso profiled Reiserfs with the notail option, which disables tailmerging. The first interesting observation we can make is that thewrite super operation takes longer than most other operations:64M–1G CPU cycles (0.038–0.58 seconds) for the default config-uration, and 16M–128M CPU cycles (0.009–0.075 seconds) withnotail. The second observation is that there is a clear correlationbetween the longest dirty inode, read, and write superoperations. When the latency distribution is viewed along withelapsed time, the correlation becomes especially obvious as shownin Figures 10 and 11. We can see that the long operations are ex-ecuted every 5 seconds, which suggests that they are invoked bythe bdflush kernel thread to update access time information ofthe accessed inodes. The correlation between several operations iscaused by the write super operation, which always takes theBig Kernel Lock (BKL), a global kernel lock in Linux. The otheroperations must wait for the write super operation to finish.This observation is especially important because it shows that Reis-erfs 3.6 blocks not only its own operations, but those of other filesystems and also many other kernel functions, for significant peri-ods of time.
Figure 12 shows the distribution of latencies of Ext3. The Ext3write super operation takes less than 4K CPU cycles, becauseit updates the journal asynchronously. It calls the Linux journalinginterface’s log start commit function and releases the BKLshortly after that. In contrast, the Reiserfs 3.6 write super op-eration calls flush old commits, which returns only after allupdates are written to disk. Since this operation is performed whilethe file system’s superblock and the BKL are held, the file systemand the kernel are blocked for the duration of the whole operation.The bdflush kernel thread is started 5 seconds after the previousrun completes. This suggests that every 5 seconds, several mountedReiserfs partitions may each sequentially block the kernel for up to0.58 seconds—even if the CPU is free to service other processes.
7

1 10
100 1000
10000
100000 1e+06 1e+07 1e+08 1e+09write_super
5 10 15 20 25 30 35
Bucket (2n-1 <= x < 2n CPU Cycles)
Num
ber
of o
pera
tions
Tot
al d
elay
(C
PU
cyc
les)
1 10
100 1000
10000
100000 1e+06 1e+07 1e+08 1e+09write_inode
1 10
100 1000
10000
100000 1e+06 1e+07 1e+08 1e+09sync_page
1 10
100 1000
10000
100000 1e+06 1e+07 1e+08 1e+09release
1 10
100 1000
10000
100000 1e+06 1e+07 1e+08 1e+09readpage
1 10
100 1000
10000
100000 1e+06 1e+07 1e+08 1e+09read_inode
1 10
100 1000
10000
100000 1e+06 1e+07 1e+08 1e+09readdir
1 10
100 1000
10000
100000 1e+06 1e+07 1e+08 1e+09read
1 10
100 1000
10000
100000 1e+06 1e+07 1e+08 1e+09open
1 10
100 1000
10000
100000 1e+06 1e+07 1e+08 1e+09lookup
1 10
100 1000
10000
100000 1e+06 1e+07 1e+08 1e+09follow_link
1 10
100 1000
10000
100000 1e+06 1e+07 1e+08 1e+09dirty_inode
1 10
100 1000
10000
100000 1e+06 1e+07 1e+08 1e+09bmap
Number of operationsTotal delay (CPU cycles)
Figure 12: Profile of the Ext3 file system under the grep -r work-load.
1 10
100 1000
10000
100000 1e+06 1e+07 1e+08 1e+09release
5 10 15 20 25 30 35
Bucket (2n-1 <= x < 2n CPU Cycles)
Num
ber
of o
pera
tions
Tot
al d
elay
(C
PU
cyc
les)
1 10
100 1000
10000
100000 1e+06 1e+07 1e+08 1e+09sync_page
1 10
100 1000
10000
100000 1e+06 1e+07 1e+08 1e+09sync_inodes
1 10
100 1000
10000
100000 1e+06 1e+07 1e+08 1e+09readpages
1 10
100 1000
10000
100000 1e+06 1e+07 1e+08 1e+09readdir
1 10
100 1000
10000
100000 1e+06 1e+07 1e+08 1e+09read
1 10
100 1000
10000
100000 1e+06 1e+07 1e+08 1e+09permission
1 10
100 1000
10000
100000 1e+06 1e+07 1e+08 1e+09open
1 10
100 1000
10000
100000 1e+06 1e+07 1e+08 1e+09lookup
1 10
100 1000
10000
100000 1e+06 1e+07 1e+08 1e+09alloc_inode
Number of operationsTotal delay (CPU cycles)
Figure 13: Profile of the Reiserfs 4 file system under the grep -rworkload.
At the time of this writing, Reiserfs 4.0 became available in ver-sion 2.6.8.1-mm2 of the Linux kernel. Using FSprof, we instru-mented Reiserfs 4.0 under 2.6.8.1-mm2 with kernel preemption en-abled. We profiled Reiserfs 4.0 under the grep -r workload. Resultspresented in Figure 13 demonstrate that the file system behavior isvery different from that of Reiserfs 3.6. According to the generalLinux development trend, Reiserfs 4.0 never takes the BKL. Thatis why Reiserfs 4.0 does not use the write super operation—
because it is called with the BKL held. This tends to reduce lockcontention considerably and improve Reiserfs 4.0’s performanceoverall. However, inode access time updates are still the longestindividual operations in Reiserfs 4.0. In Reiserfs 4.0, the lookupoperation has only a single peak that is slower than the fastest peakin Ext3, but faster than the middle peak (the fastest disk I/O) inExt3. The lookup operation has also improved significantly fromReiserfs 3.6 to 4.0.
We also noticed that the readdir operation takes longer onReiserfs 4.0 than 3.6. Upon inspection of the Reiserfs 4.0 code, wefound out that its readdir operation also schedules read-aheadsfor the inodes of the directory entries being read. This is an opti-mization which was previously noted by NFSv3 developers—thatreaddir operations are often followed by stat(2) operations(often the result of users running ls -l); that is why NFSv3 im-plements a special protocol message called READDIRPLUS whichcombines directory reading with stat information [7]. Consequently,Reiserfs 4.0 does more work in readdir, but this initial effortimproves subsequent lookup operations. Overall, this is a goodtrade-off for this workload: Reiserfs 4.0 used 60.6% less systemtime and I/O time than 3.6.
To verify that the changes in the Reiserfs profile are not causedby the Linux kernel changes between 2.4 and 2.6, as well as to esti-mate the impact of kernel preemption, we profiled Ext3 on 2.6.8.1-mm2. The Ext3 code has not changed significantly between 2.4 and2.6. The resulting profile is very similar to the one shown in Figure12. Therefore, we conclude that the improvement in Reiserfs 4.0 isindeed thanks to the code changes. We have not observed any ar-tifacts that could be caused by preemptive kernel scheduling. Thisis likely because we ran only one process (grep) and there was noother process to preempt it.
It was previously known that Reiserfs spends a lot of time wait-ing on locks [5], but FSprof provided us information about the par-ticular modes of operation and the corresponding conditions thatcause problems. This information can be directly used to optimizethe code and determine the most harmful operation scenarios.
5.1.3 Influence of Stackable File SystemsWe used FSprof to evaluate the impact of file system stacking
on the captured profile. Figure 14 shows the latency distributionof Wrapfs, a thin passthrough stackable file system mounted overExt2, and a vanilla Ext2 file system, both evaluated with the grep-r workload.
The stacking interface has a relatively small CPU overhead, whichaffects only the fastest buckets. Unfortunately, the overheads aredifferent for different VFS operations. This can be explained bythe differences in the way these operations are handled in stackablefile systems. In particular, some operations are passed through withminimal changes, whereas others require allocation of VFS objectssuch as inodes, dentries (directory entries), or memory pages. Aswe can see in Figure 14, Wrapfs’s peaks are generally shifted tothe right of Ext2’s peaks, demonstrating an overall overhead. Theoverheads of open and lookup exceed 4K CPU cycles, whereasreaddir has an overhead below 1K CPU cycles.
VFS objects have different properties on the lower-level and thestackable file systems. For example, an encryption file systemmaintains cleartext names and data, but the lower file system main-tains encrypted names and data [33]. Therefore, stackable file sys-tems create copies of each lower-level object they encounter.
This behavior of the stackable file systems adds overheads as-sociated with data copying and causes distortions in the latenciesof their read and write operations. For example, read page isonly invoked by the read operation if the page is not found in the
8

1 10
100 1000
10000 write_super
5 10 15 20 25 30 35
Bucket (2n-1 <= x < 2n CPU Cycles)
Num
ber
of o
pera
tions
1 10
100 1000
10000 write_inode 1
10 100
1000 10000 sync_page
1 10
100 1000
10000 revalidate 1
10 100
1000 10000 readpage
1 10
100 1000
10000 readlink 1
10 100
1000 10000 read_inode
1 10
100 1000
10000 readdir 1
10 100
1000 10000 read
1 10
100 1000
10000 release 1
10 100
1000 10000 permission
1 10
100 1000
10000 open 1
10 100
1000 10000 lookup
1 10
100 1000
10000 follow_link 1
10 100
1000 10000 flush
Wrapfs (Unmodified)Ext2
Figure 14: Distribution of operation latencies for unmodifiedWrapfs mounted over Ext2, and for the Ext2 file system, undera grep -r workload.
cache. Therefore, only read page operations that require diskaccesses are captured and passed down. The sync page opera-tion is never invoked because pages associated with Wrapfs inodesare never marked dirty.
Most importantly, duplicate copies of data pages effectively re-duce the page cache size in half. This can result in serious perfor-mance overheads when a workload fits into the page cache but notinto less than 50% of the page cache. Unfortunately, in Linux, eachpage cache object is linked with the corresponding inode and there-fore double representation of inodes implies double caching of datapages.
We found a relatively simple solution to the problem. We usedata pages associated with the upper inode for both the lower andupper file system layers. In particular, the data pages belong to theupper inode but are assigned to lower-level inodes for the short du-ration of the lower-level page-based operations. Here is an exampleof the modified readpage operation:
page->mapping = lower_inode->i_mapping;err = lower_inode->i_mapping->a_ops->readpage(
lower_file, page);page->mapping = upper_inode->i_mapping;
The resulting code allows profiling of page-based operations,and also eliminates data copying and double caching. We analyzedthe Linux kernel functions that directly or indirectly use inode andcache page connectivity and found that in all these cases, the abovemodification works correctly. We tested the resulting stackable filesystem on a single-CPU and multi-CPU machines under the com-
1 10
100 1000
10000 write_super
5 10 15 20 25 30 35
Bucket (2n-1 <= x < 2n CPU Cycles)
Num
ber
of o
pera
tions
1 10
100 1000
10000 write_inode 1
10 100
1000 10000 sync_page
1 10
100 1000
10000 revalidate 1
10 100
1000 10000 release
1 10
100 1000
10000 readpage 1
10 100
1000 10000 readlink
1 10
100 1000
10000 read_inode 1
10 100
1000 10000 readdir
1 10
100 1000
10000 read 1
10 100
1000 10000 permission
1 10
100 1000
10000 open 1
10 100
1000 10000 lookup
1 10
100 1000
10000 follow_link 1
10 100
1000 10000 flush
Wrapfs (Without Double Caching)Ext2
Figure 15: Distribution of operation latencies for Wrapfs with-out double caching mounted over Ext2, and for the Ext2 filesystem, under a grep -r workload.
pile and Postmark workloads. No races or other problems wereobserved.
As can be seen in Figure 15, the no-double-caching patch de-scribed above decreases the system time compared to the originalWrapfs, has a cache size that is the same as Ext2, and also pre-vents double caching from influencing the cache page related oper-ations. In particular, the profile of the modified file system has vir-tually no difference from the plain Ext2 file system for the read,read page, and sync page operations.
Overall, a stackable file system does influence the profile of thelower-level file system, but it still can be used to profile a subsetof VFS operations when the source code is not available. Even foroperations whose latency values are affected by the stackable filesystem, the peaks and overall structure of the profile usually remainthe same. Therefore, key file system and workload characteristicscan be collected.
5.2 Workload CharacterizationCompile benchmarks are often used to evaluate file system be-
havior. We show that even seemingly similar mixes of source filesgenerate considerably different VFS operation mixes. Therefore,results obtained during different compile benchmarks can not befairly compared with each other.
We profiled the build process of three packages commonly usedas compile benchmarks: (1) SSH 2.1.0, (2) Am-utils 6.1b3, and(3) the Linux 2.4.20 kernel with the default configuration. Table2 shows the general characteristics of the packages. The buildprocess of these packages consists of a preparation and a com-
9

Am-utils SSH Linux KernelDirectories 25 54 608Files 430 637 11,352Lines of Code 61,513 170,239 4,490,349Code Size (Bytes) 1,691,153 5,313,257 126,735,431Total Size (Bytes) 8,441,856 9,068,544 174,755,840
Table 2: Compile benchmarks’ characteristics.
pilation phase. The preparation phase consists of running GNUconfigure scripts for SSH and Am-utils, and running “makedefconfig dep” for the Linux kernel. We analyzed the prepa-ration and compilation phases separately, as well as together (whichwe call a “whole build”). Before the preparation and compila-tion phases, we unmounted the file system in question, purged thecaches using our custom chill program, and finally remounted thetested file systems. For the full build, we performed this cache-purging sequence only before the preparation phase. This meansthat the number of invocations of every operation in the case of fullbuild is the sum of the invocations of the same operation during thepreparation and compilation stages. However, the full-build delaysare not the sum of the preparation and compilation delays, becausewe did not purge the caches between phases for the full build. Thisway it was possible to compare the compilation profiles separately.The delays of the compilation phase as a part of the build processcan be obtained by subtracting the preparation phase delays fromthe full build delays.
Figure 16 shows the distribution of the total number of invoca-tions and the total delay of all the Ext2 VFS operations used duringthe build process of SSH, Am-utils, and the Linux kernel. Notethat each of the three graphs uses different scales for the number ofoperations and the total delay.
Figures 16(a) and 16(b) show that even though the SSH and Am-utils build process sequence, source-file structure, and total sizesappear to be similar, their operation mixes are quite different; more-over, the fact that SSH has nearly three times the lines of code ofAm-utils is also not apparent from analyzing the figures. In par-ticular, the preparation phase dominates in the case of Am-utilswhereas the compilation phase dominates the SSH build. More im-portantly, an Am-utils build writes more than it reads, whereas theSSH build reads more than it writes: the ratio of the number ofreads to the number of writes is 26,458
35,060= 0.75 for Am-utils and
42,381
33,108= 1.28 for SSH. This can result in performance differences
for read-oriented or write-oriented file systems.Not surprisingly, the kernel build process’s profile differs from
both SSH and Am-utils. As can be seen in Figure 16(c), both of thekernel build phases are strongly read biased. Another interestingobservation is that the kernel build phase populates the cache withmost of the meta-data and data early on. Figures 1 and 2 on page 3show the profile of the lookup operation during the kernel buildprocess, where we see that the preparation phase causes the vastmajority of lookups that incur disk I/O.
Table 3 shows the lookup operation’s latency peaks for dif-ferent build processes. We can see that the Am-utils build pro-cess has the least cache misses. Therefore, it has the minimalaverage lookup operation delay (the only metric measurable bysome other kernel profilers such as kernprof [26]). SSH’s averagelookup delay is only slightly higher because the higher percent-age of misses is compensated by the high fraction of disk opera-tions that do not require long disk-head seeks. The Linux kernelbuild process incurs a higher proportion of buffer cache misses andat the same time has a high proportion of the long disk-head seeks.Therefore, its average lookup delay is the highest.
15 30 45 60
250 500 750 1000 1250
both
com
mit_
writ
e
crea
te
dele
te_i
node
follo
w_l
ink
ioct
l
link
llsee
k
look
up
mkd
ir
mm
ap
open
prep
are_
writ
e
put_
inod
e
read
read
dir
read
_ino
de
read
page
rele
ase
rena
me
rmdi
r
sym
link
sync
_pag
e
trun
cate
unlin
k
writ
e
writ
e_in
ode
Operation
Num
ber
of o
pera
tions
(x1
03 )
Tot
al d
elay
(10
6 CP
U c
ycle
s)
15 30 45 60
250 500 750 1000 1250
compilation
15 30 45 60
250 500 750 1000 1250
preparation
Number of operationsTotal delay (CPU cycles)
(a) SSH 2.1.0
15 30 45
100 200 300 400both
com
mit_
writ
e
crea
te
dele
te_i
node
follo
w_l
ink
ioct
l
llsee
k
look
up
mkd
ir
mm
ap
open
prep
are_
writ
e
put_
inod
e
read
read
dir
read
_ino
de
read
page
rele
ase
rena
me
rmdi
r
sym
link
sync
_pag
e
trun
cate
unlin
k
writ
e
writ
e_in
ode
Operation
Num
ber
of o
pera
tions
(x1
03 )
Tot
al d
elay
(10
6 CP
U c
ycle
s)
15 30 45
100 200 300 400compilation
15 30 45
100 200 300 400preparation
Number of operationsTotal delay (CPU cycles)
(b) Am-Utils 6.1b3
50 100 150 200
1000 2000 3000 4000 5000both
com
mit_
writ
e
crea
te
dele
te_i
node
follo
w_l
ink
ioct
l
llsee
k
look
up
mkd
ir
mm
ap
open
prep
are_
writ
e
put_
inod
e
read
read
dir
read
_ino
de
read
page
rele
ase
rena
me
sym
link
sync
_pag
e
trun
cate
unlin
k
writ
e
writ
e_in
ode
Operation
Num
ber
of o
pera
tions
(x1
03 )
Tot
al d
elay
(10
6 CP
U c
ycle
s)
50 100 150 200
1000 2000 3000 4000 5000compilation
50 100 150 200
1000 2000 3000 4000 5000preparation
Number of operationsTotal delay (CPU cycles)
(c) Kernel 2.4.20
Figure 16: Various compile profiles on Ext2. Note that each plotuses a different scale for both the operation count and delay.The count uses the left scale, and the delay uses the right scale.
Am-utils SSH Linux KernelFastest peak 1,817 2,848 10,423Middle peak 9 48 79Slowest peak 25 32 227Cache misses (%) 1.9 2.7 2.9Average delay 83,022 95,697 186,672
Table 3: Distribution of the Ext2 lookup operations amongthe three peaks representing a page cache hit, short disk seek,and long disk seek. The cache miss ratio is calculated as thesum of the operations in the middle and slowest peaks over thetotal number of operations.
We see that not only can we not directly compare different com-pile benchmarks, but we can also not extrapolate results based onsummary information about the source files such as the packagesize, number of lines of code, etc. The order and type of file-systemoperations can seriously change the delay of VFS operations, andhence the benchmark CPU and I/O times.
6. RELATED WORKThe simplest and oldest way to profile code is to measure the
total program execution time and its user level and in-kernel ex-
10

ecuted components in different conditions [29]. In the late 1970s,new code profiling techniques emerged. UNIX prof [3] instrumentssource code at function entry and exit points. An instrumented pro-gram’s program counter is sampled at fixed time intervals. Theresulting samples are used to construct histograms with the numberof individual functions invoked and their average execution times.Program counter sampling is a relatively inexpensive way to cap-ture how long a program fragment is executed in multi-tasking en-vironments where a task can be rescheduled at any time during anyfunction execution interval. Gprof [12] additionally records infor-mation about the callers of individual functions, which allows it toconstruct call graphs. Gprof was successfully used for kernel pro-filing in the early 1980s [16]. However, instrumented kernels hada 20% increase in code size and an execution time overhead up to25%. Kernprof [26] uses a combination of PC sampling and kernelhooks to build profiles and call graphs. Kernprof interfaces with theLinux scheduler to count time that a kernel function spent sleeping(e.g., to perform I/O) in the profile.
More detailed profiles with granularity as small as a single codeline can be collected using the tcov [27] profiler. Most modernCPUs contain special hardware counters for use by profilers. Thehardware counters allow correlation between profiled code execu-tion, CPU cache states, branch prediction functionality, and ordi-nary CPU clock counts [4]. Essentially, all modern CPU executionprofilers rely on some combination of program counter sampling,scheduler instrumentation, functions entry/exit point instrumenta-tion, and hardware counters. Finally, there are special tools to mon-itor particular problems such as lock contention [6, 19] or memoryleaks and cache purging [25].
In general, fewer and less developed tools are available to pro-file disk performance, which is highly dependent on the workload.Disk operations include mechanical latencies to position the head.The longest operation is seeking, or moving the head from one trackto another. Therefore, as much as possible, file systems designsavoid seeks [17, 23]. Unfortunately, modern hard drives exposevery little information about their internal data placement to theOS. The OS can only assume that blocks with close logical blocknumbers are also close to each other on the disk. Only the diskdrive itself can schedule the requests in an optimal way and onlythe disk drive has statistical information about its internal opera-tions. Some disk vendors make statistics, such as the number ofseek operations, available through the SMART [1] interface. TheLinux kernel optionally maintain statistics about block-device I/Ooperations and makes them available through the /proc file sys-tem, yet little information is reported about their timing.
Network packet sniffers [13] can be used to capture and analyzenetwork traffic of network-based file systems [9]. This techniqueis useful for analyzing a protocol, but both the client and serveroften do additional processing that is not captured in the trace:searching caches, allocating objects, reordering requests, and more.iSCSI can also be traced at the network layer, and Fiber Channelconnections can be traced at a hardware level [15]. These tech-niques share the fundamental disadvantage that they can only cap-ture block-level information. Additionally, Fiber Channel tracingrequires specialized hardware.
There are several methods for integrating profiling into code.The most popular one is direct source code modification becauseit imposes minimal overhead and is usually simple. For example,tracking of lock contention or I/O activity may require modificationof several fixed places in the kernel source code to profile a varietyof file systems. If, however, every function requires profiling mod-ifications, then the compiler may conduct such an instrumentation.For example, gcc -p automatically inserts calls to mcount at the
beginning and at the end of every function. The custom mcountfunction is then called on each function entry and exit point. Moresophisticated approaches include run-time kernel code instrumen-tation [28] and layered call interception. For example, the LinuxSecurity Modules [32] allow control interception for many OS op-erations. Similarly, stackable file systems allow one to insert a thinlayer between the VFS and other file systems [33].
Often, to profile a file system, various combinations of bench-marks and microbenchmarks are run on top of the file system [5,10, 21, 2], and conclusions are drawn from those results. Unfortu-nately, this is an inaccurate method of file system profiling, becausethese benchmarks operate in terms of system calls, which do notmap precisely to file system operations. Often, the only result froma benchmark is a single metric (e.g., elapsed time or transactionsper second). For complex benchmarks, these metrics can hide fun-damental or pathological system behavior that may become visibleunder different workloads.
7. CONCLUSIONSWe designed and developed FSprof, the first tool specifically
created to profile file systems. FSprof produces accurate profiles.FSprof’s profiles are generated based on VFS operations, not sys-tem calls, block-level I/O operations, or CPU utilization. FSprof’sprofiles capture operations as the file system implements them, whichis more useful for analysis. File systems perform both CPU andI/O-intensive tasks; FSprof accounts for both of these importantcomponents. FSprof is efficient: it has low per-operation overheadof less than 100 CPU cycles. When run with an I/O-intensive work-load, FSprof’s elapsed time overhead is less than 1%.
We used FSprof to collect and analyze profiles for several pop-ular file systems (Ext2, Ext3, Reiserfs, and Wrapfs), in only ashort period of time. To aid this analysis, we developed auto-matic processing and visualization scripts to present FSprof resultsclearly and concisely. We discovered, investigated, and explainedbi-modal and tri-model latency distributions within several com-mon VFS operations. We also identified pathological performanceproblems related to lock contention. We quantified the effects ofdouble caching, a technique used by many file system interceptionarchitectures, on stackable file systems. Finally, we profiled sev-eral large compile benchmarks, and found that they do not followa fixed pattern. For example, traditional metrics like, lines of codeand number of source files, do not sufficiently describe a compilebenchmark because different compilation patterns generate suffi-ciently different VFS operations mixes.
7.1 Future WorkWe plan to instrument the Linux dirty-buffer flushing daemon,
bdflush. Currently, asynchronous writes are not handled by theVFS, but rather by block device drivers. The bdflush daemondirectly invokes block device driver functions after the file systemmarks a buffer as dirty. We will modify bdflush such that thesebuffers can be tied to the correct FSprof file-system profile.
We plan to use FSprof to characterize more workloads, and howthey affect file system operations. We also plan to use FSprof toexamine how the OS’s state affects benchmark results. For exam-ple, many researchers unmount the tested file system between tests.However, this clears only part of the caches (this is why we also ranchill to purge the caches). The location of meta-data and data onthe disk changes over the time, which may result in significant per-formance changes. We plan to quantify the effects of file-systemaging using FSprof.
We plan to develop a stackable VFS interception mechanism thatdoes not require separate copies of objects (e.g., inodes, dentries, or
11
pages). It will replace operation vectors dynamically with FSprof-instrumented wrappers. This will reduce the stacking overhead, re-move influences on OS caches, and simplify stackable code paths.
FSprof adds a small overhead on each function call, yet this over-head can differ from machine to machine. FSprof can automaticallymeasure its self-delay on startup and subtract it from the profilingresults to increase the profiling resolution for very fast operations.
8. REFERENCES[1] AT Atachment with Packet Interface - 7: Volume 3 Serial
Transport Protocols and Physical Interconnect(ATA/ATAPI-7 V3). Technical Report T13/1532D, Revision4b, International Committee on Information TechnologyStandards (INCITS), April 2004.
[2] S. Aiken, D. Grunwald, A. R. Pleszkun, and J. Willeke. APerformance Analysis of the iSCSI Protocol. In Proceedingsof the 20th IEEE/11th NASA Goddard Conference on MassStorage Systems and Technologies (MSST’03), pages123–134. IEEE Computer Society, April 2003.
[3] Bell Laboratories. prof, January 1979. Unix Programmer’sManual, Section 1.
[4] S. Browne, J. Dongarra, N. Garner, K. London, and P. Mucci.A scalable cross-platform infrastructure for applicationperformance tuning using hardware counters. In Proceedingsof the 2000 ACM/IEEE conference on Supercomputing,page 42, 2000.
[5] R. Bryant, R. Forester, and J. Hawkes. FilesystemPerformance and Scalability in Linux 2.4.17. In Proceedingsof the Annual USENIX Technical Conference, FREENIXTrack, pages 259–274, Monterey, CA, June 2002.
[6] R. Bryant and J. Hawkes. Lockmeter: Highly-informativeinstrumentation for spin locks in the linux kernel. InProceedings of the 4th Annual Linux Showcase andConference, October 2000.
[7] B. Callaghan, B. Pawlowski, and P. Staubach. NFS Version 3Protocol Specification. Technical Report RFC 1813,Network Working Group, June 1995.
[8] R. Card, T. Ts’o, and S. Tweedie. Design andimplementation of the second extended filesystem. InProceedings to the First Dutch International Symposium onLinux, Seattle, WA, December 1994.
[9] D. Ellard and M. Seltzer. New NFS Tracing Tools andTechniques for System Analysis. In Proceedings of theAnnual USENIX Conference on Large Installation SystemsAdministration, San Diego, CA, October 2003.
[10] D. Ellard and M. Seltzer. NFS Tricks and BenchmarkingTraps. In Proceedings of the Annual USENIX TechnicalConference, FREENIX Track, pages 101–114, San Antonio,TX, June 2003.
[11] Gnuplot Central. www.gnuplot.info.[12] S. L. Graham, P. B. Kessler, and M. K. McKusick. Gprof: A
call graph execution profiler. In Proceedings of the 1982SIGPLAN symposium on Compiler construction, pages120–126, June 1982.
[13] L. N. R. Group. The TCPDump/Libpcap site.www.tcpdump.org, February 2003.
[14] J. Katcher. PostMark: A New Filesystem Benchmark.Technical Report TR3022, Network Appliance, 1997.www.netapp.com/tech_library/3022.html.
[15] LeCroy. FCTracer 4G.www.catc.com/products/FCTracer4G.html, 2004.
[16] M. K. McKusick. Using gprof to tune the 4.2BSD kernel.http://docs.freebsd.org/44doc/papers/kerntune.html,May 1984.
[17] M. K. McKusick, W. N. Joy, S. J. Leffler, and R. S. Fabry. Afast file system for UNIX. ACM Transactions on ComputerSystems, 2(3):181–97, August 1984.
[18] C. Minshall. fsx.http://cvsup.freebsd.org/cgi-bin/cvsweb/
cvsweb.cgi/src/tools/regression/fsx/, December2001.
[19] A. Morton. sleepometer. www.kernel.org/pub/linux/kernel/people/akpm/patches/2.5/2.5.74/2.5.74-mm1/broken-out/sleepometer.patch, July 2003.
[20] B. Pawlowski, C. Juszczak, P. Staubach, C. Smith, D. Lebel,and D. Hitz. NFS version 3 design and implementation. InProceedings of the Summer USENIX Technical Conference,pages 137–52, Boston, MA, June 1994.
[21] P. Radkov, L. Yin, P. Goyal, P. Sarkar, and P. Shenoy. APerformance Comparison of NFS and iSCSI forIP-Networked Storage. In Proceedings of the Third USENIXConference on File and Storage Technologies (FAST 2004),pages 101–114, San Francisco, CA, March/April 2004.
[22] H. Reiser. ReiserFS. www.namesys.com/v4/v4.html,October 2004.
[23] M. Rosenblum and J. K. Ousterhout. The design andimplementation of a log-structured file system. InProceedings of 13th ACM Symposium on Operating SystemsPrinciples, pages 1–15, Asilomar Conference Center, PacificGrove, CA, October 1991. Association for ComputingMachinery SIGOPS.
[24] M. Russinovich. Inside Win2K NTFS, Part 1.www.winnetmag.com/Articles/ArticleID/15719/pg/2/2.html, November 2000.
[25] J. Seward, N. Nethercote, and J. Fitzhardinge. Valgrind.http://valgrind.kde.org, August 2004.
[26] Silicon Graphics, Inc. Kernprof (Kernel Profiling).http://oss.sgi.com/projects/kernprof, 2003.
[27] Sun Microsystems. Analyzing Program Performance WithSun Workshop, February 1999.http://docs.sun.com/db/doc/805-4947.
[28] A. Tamches. Fine-Grained Dynamic Instrumentation ofCommodity Operating System Kernels. PhD thesis,University of Wisconsin-Madison, 2001.
[29] K. Thompson and D. M. Ritchie. tm. Bell Laboratories,November 1971. Unix Programmer’s Manual, Section 1.
[30] A. Veitch and K. Keeton. The Rubicon workloadcharacterization tool. Technical Report HPL-SSP-2003-13,Storage Systems Department, Hewlett Packard Laboratories,March 2003. www.hpl.hp.com/research/ssp/papers/rubicon-tr.pdf.
[31] P. F. Velleman and D. C. Hoaglin. Applications, Basics, andComputing of Explaratory Data Analysis. Duxbury Press,Boston, MA, USA, 1981.
[32] C. Wright, C. Cowan, J. Morris, S. Smalley, and G. K.Hartman. Linux Security Modules: General Security Supportfor the Linux Kernel. In Proceedings of the 11th USENIXSecurity Symposium, San Francisco, CA, August 2002.
[33] E. Zadok and J. Nieh. FiST: A Language for Stackable FileSystems. In Proceedings of the Annual USENIX TechnicalConference, pages 55–70, San Diego, CA, June 2000.
12