F:\share\ERPS\submit\GSP\winter climo\PTYPEGSP.wpd
20
EASTERN REGION TECHNICAL ATTACHMENT NO: 2001-01 JANUARY, 2001 A CLIMATOLOGICAL ANALYSIS OF WINTER PRECIPITATION EVENTS AT GREENVILLE-SPARTANBURG SC Benjamin W. Moyer NOAA/National Weather Service Greer, SC 1. INTRODUCTION Winter precipitation events are usually very complex in the foothills of the Carolinas. Winter storms are always a challenge for the operational forecaster, especially those new to the area and those with limited experience in forecasting in the lee of the Appalachians. Several studies (e.g. Keeter et al. 1995; Keeter and Cline 1991; Keeter, Cline, and Green 1989; and, Keeter and Green 1981) discussed valuable techniques for forecasting predominant precipitation type (p-type) in North Carolina. Many of those findings can also be applied to similar climatological regimes in South Carolina. This short paper is designed to address the characteristics of winter precipitation in the Upstate of South Carolina and to document what is climatologically normal for this region. 2. APPROACH The present study began with an analysis of all winter weather events that occurred in the Greenville-Spartanburg, SC area over a 40- year period (January 1960-December 1999). Precipitation type, predominant precipitation type, precipitation amount, and the duration of precipitation were logged for each event. A review of the synoptic scale weather patterns was also conducted to relate heavy frozen (sleet and/or snow) precipitation events to a particular pattern. The goal was to develop climatic frequencies of common and rare winter precipitation events. A winter precipitation event is defined by any occurrence of sleet, freezing rain, or measurable snowfall. Variable precipitation types did not necessarily have to fall at the same time. As long as a particular type was observed during the event, that type was counted as a part of the event. For the purposes of this paper, when discussing heavy snow and snow advisory events, 3.5 inches or more qualifies as heavy snow (rounded up to 4 inches) and 1.5 inches to 3.4 inches qualifies as the criteria for a snow advisory (National Weather Service 1996). 3. DATA Surface observations from Greenville Downtown Municipal Airport (GMU) were utilized for the period of January 1960 to September 1962, before the official record keeping station was moved approximately 8 miles east to the Greenville-Spartanburg International Airport (GSP). Surface observations from GSP were used from October 1962 to December 1999. The surface observations and daily summaries for GSP were found by using a combination of locally
Transcript of F:\share\ERPS\submit\GSP\winter climo\PTYPEGSP.wpd

EASTERN REGION TECHNICAL ATTACHMENTNO: 2001-01
JANUARY, 2001
A CLIMATOLOGICAL ANALYSIS OF WINTERPRECIPITATION EVENTS AT
GREENVILLE-SPARTANBURG SC
Benjamin W. MoyerNOAA/National Weather Service
Greer, SC
1. INTRODUCTION
Winter precipitation events are usually verycomplex in the foothills of the Carolinas.Winter storms are always a challenge for theoperational forecaster, especially those new tothe area and those with limited experience inforecasting in the lee of the Appalachians.Several studies (e.g. Keeter et al. 1995; Keeterand Cline 1991; Keeter, Cline, and Green1989; and, Keeter and Green 1981) discussedvaluable techniques for forecastingpredominant precipitation type (p-type) inNorth Carolina. Many of those findings canalso be applied to similar climatologicalregimes in South Carolina. This short paper isdesigned to address the characteristics ofwinter precipitation in the Upstate of SouthCarolina and to document what isclimatologically normal for this region.
2. APPROACH
The present study began with an analysis of allwinter weather events that occurred in theGreenville-Spartanburg, SC area over a 40-year period (January 1960-December 1999).Precipitation type, predominant precipitationtype, precipitation amount, and the duration ofprecipitation were logged for each event. Areview of the synoptic scale weather patternswas also conducted to relate heavy frozen
(sleet and/or snow) precipitation events to aparticular pattern. The goal was to developclimatic frequencies of common and rarewinter precipitation events.
A winter precipitation event is defined by anyoccurrence of sleet, freezing rain, ormeasurable snowfall. Variable precipitationtypes did not necessarily have to fall at thesame time. As long as a particular type wasobserved during the event, that type wascounted as a part of the event. For thepurposes of this paper, when discussing heavysnow and snow advisory events, 3.5 inches ormore qualifies as heavy snow (rounded up to4 inches) and 1.5 inches to 3.4 inches qualifiesas the criteria for a snow advisory (NationalWeather Service 1996).
3. DATA
Surface observations from GreenvilleDowntown Municipal Airport (GMU) wereutilized for the period of January 1960 toSeptember 1962, before the official recordkeeping station was moved approximately 8miles east to the Greenville-SpartanburgInternational Airport (GSP). Surfaceobservations from GSP were used fromOctober 1962 to December 1999. The surfaceobservations and daily summaries for GSPwere found by using a combination of locally

2
archived hourly Surface Airway Observations(SAO) and METARs, and LocalClimatological Data (LCDs) produced by theNational Climatic Data Center (NCDC).Hourly surface observations and dailysummaries for GMU were provided by NCDCas well. Gridded NMC Analyses (Jenne 1975)fields were extracted, plotted, and smoothed inorder to study synoptic scale patterns whichresulted in heavy snow events at GMU andGSP.
4. RESULTS
A total of 183 cases qualified as a winterprecipitation event, stretching from Novemberthrough April. As one might expect, Januaryhad the greatest number (70) (Fig. 1). Aforecaster can assume with a high degree ofcertainty that any given winter weather eventat GSP will consist of more than one p-type.Of the 183 cases, 158 (86%) were acombination of two or more p-types (Fig. 2).Only 25 cases (14%) consisted of entirely onetype. Eighteen of those 25 cases were allsnow. As would be expected near the latitudeof GSP, the most frequent wintry mix eventwas rain, freezing rain and sleet (Fig. 2) whichoccurred most often in the months ofDecember and January. The most frequentwintry mix in February was rain, sleet, andsnow. Thirty-three cases were all frozen(snow and/or sleet), with 23 of those (70%)occurring during January and February. Amix of rain and freezing rain occurred on themost days (36), followed by all snow (34)(Fig. 3).
a. November
It is rare to experience measurable winterprecipitation during the month of November.Freezing rain was never observed over theperiod of this analysis. This seems logicalsince seasonal patterns do not favor anextremely cold, shallow air mass as far south
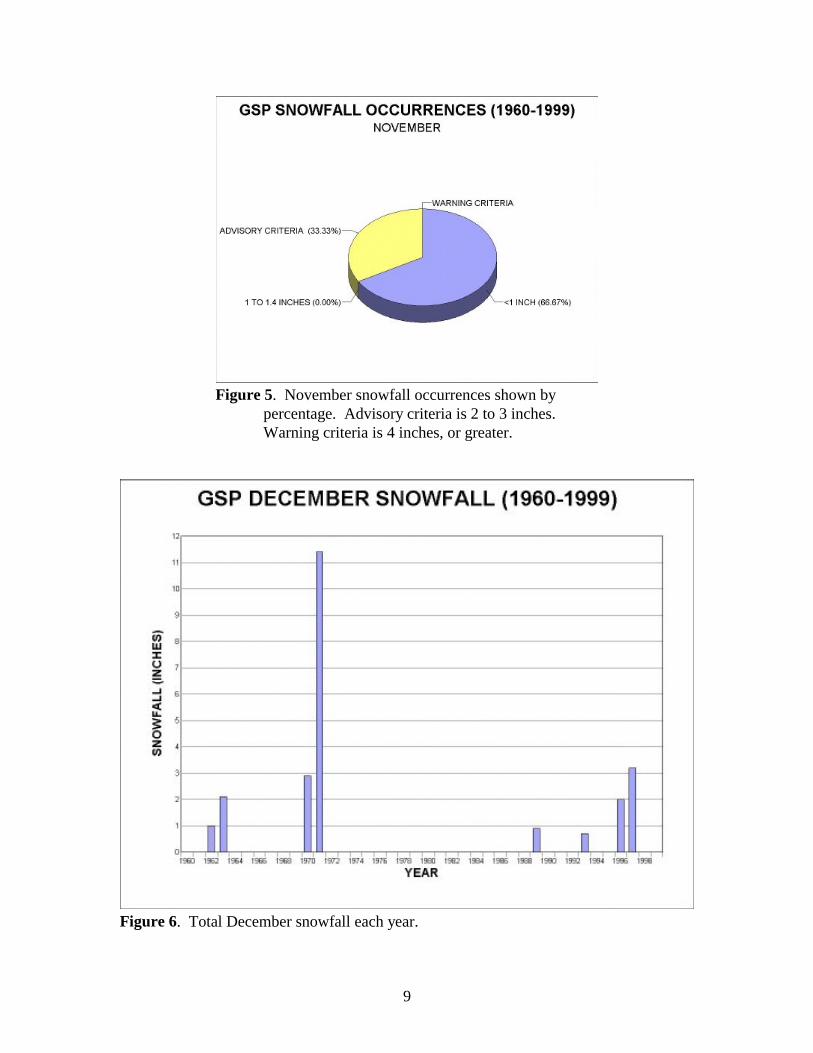
as South Carolina this time of year. Therewere a total of five winter p-type cases duringthis 40 year period. One was all sleet, twowere a rain/sleet mixture, one was a rain/snowmixture and one was a mixture of rain, sleet,and snow (Fig. 4). All accumulationsresulting from these events were one half inch,or less, except for 1.9 inches of snow whichfell on the 11th in 1968 (Fig. 5).
b. December
December is a rather interesting month, withmeasurable snowfall occurring in only 8 of the40 years of this study. There was an 18-yearperiod between 1971 and 1989 when snowwas not observed at the GSP Airport duringDecember (Fig. 6). There were a total of 35winter p-type cases from 1960 to 1999 ofwhich 30 (86 %) involved some sort of mix(Fig. 7). Five events were all frozen, withfour of those all snow. Events which werecomprised of a mixture of rain, freezing rain,and sleet occurred 10 times, the most of anymixture. Eleven cases resulted in measurablesnowfall. Heavy snow (4 or more inches)occurred only once; 11.4 inches on the 3rd in1971. Advisory criteria were reached onlythree times. Six of the 11 snowfall casesmeasured less then one inch (Fig. 8).
c. January
January ranks first in terms of number ofwinter p-type events (70) and number of allfrozen events (16). Sixty-one of the 70 events(87%) involved a mixture, of which rain andfreezing rain or rain, freezing rain, and sleetevents totaled 20 (Fig. 9). January was theonly month to have exclusively freezing rainevents (3).
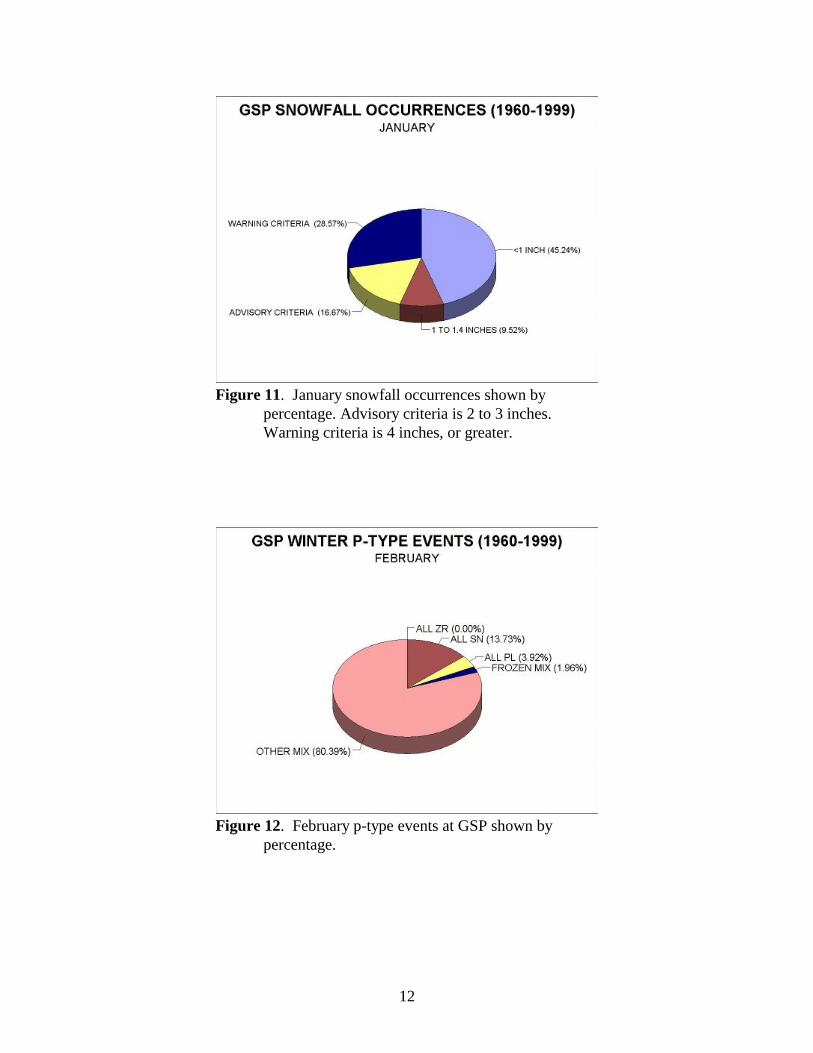
Measurable January snowfall cases totaled 42,the most of any month (Fig. 10). Twelve ofthese cases (29%) satisfied heavy snowcriteria and seven others reached advisory

3
criteria (Fig. 11). Four events resulted insnowfall totals greater than six inches with themaximum of 12 inches occurring on the 7th in1988. Only one event reaching heavy snowcriteria was an “all snow” event.
d. February
As one might expect, February had the secondhighest number of winter p-type events (51)(Fig. 1). Forty-two of 51 events (82%)involved a mixture, with a mixture of rain,sleet and snow being the most frequent. Tenevents were all frozen. Although Januaryexperienced the greatest number of wintryevents, February had the most “all snow”events (7) (Fig. 12). Additionally, Februaryhad the most years with measurable snowfallfor the month (26) (Fig. 13), followed byJanuary with 24 cases (Fig. 14).
February also ran a close second to Januaryregarding the total number of measurablesnowfall events (36) (Fig. 10). Six of theseevents qualified as heavy snow and eightsatisfied advisory criteria. Only one event wasgreater than six inches (8.2 inches on the 18th
in 1979) and only one heavy snow event wascharacterized as an “all snow” event (Fig.15).
e. March
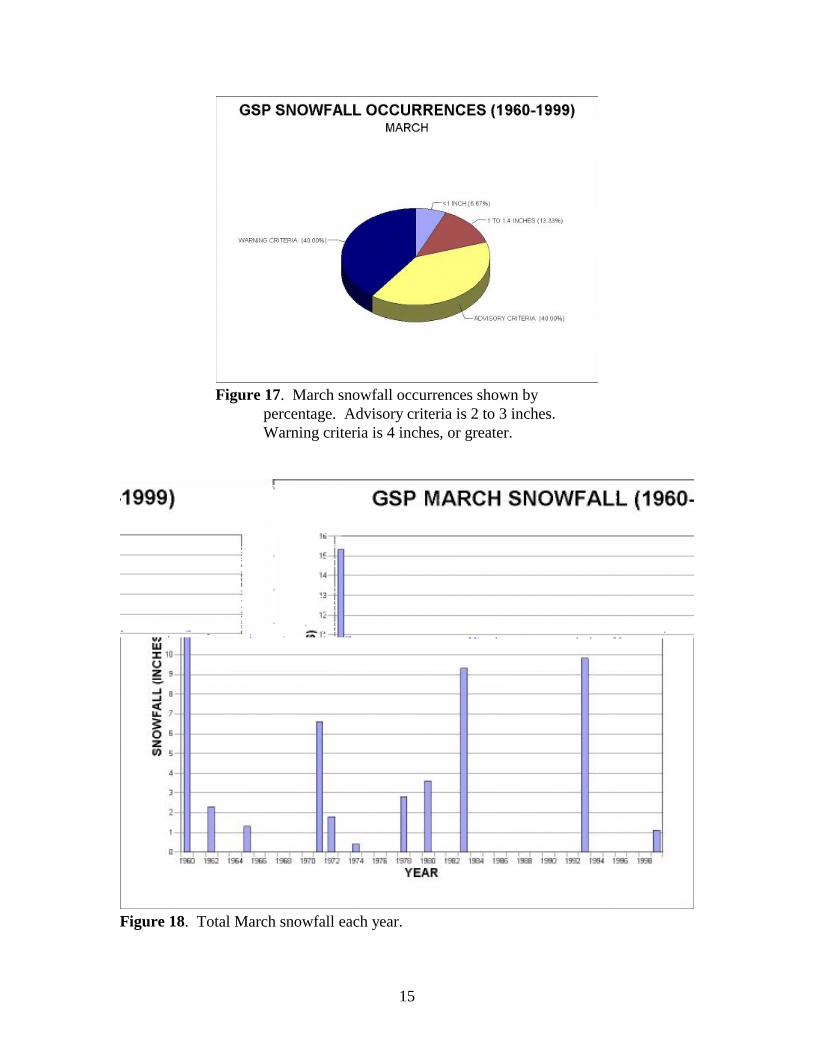
The month of March had a total of 20measurable winter p-type events during the40-year period, of which 19 involved a mix(Fig. 16). Three of these events were frozen(snow/sleet mixture). The most frequentmixtures however, were rain and sleet; rain,sleet and snow; and freezing rain, sleet, andsnow (four each). An interesting note aboutMarch involves the measurable snowfall cases(15). Twelve of the 15 cases satisfiedadvisory (6) or warning criteria (6) (Fig. 17).Four of the heavy snow events were greater
than or equal to 6 inches with the maximum(9.8 inches) occurring in 1993 during the“Storm of the Century” on the 12-13th.Heavy snowfalls in March appear to occurabout every 10 to 12 years (Fig. 18). The onlyall snow event occurred on the 11th in 1960and totaled 6.0 inches. March had the highestpercentage of heavy snowfall events permonth (40%) (Fig. 17).
f. April
It is very rare to have winter p-type events inApril. There were only two events (both rainand snow mixtures) that occurred during theperiod of this study. Both events resulted insnowfall amounts of less than one half inch.
g. Addtional Comments In order to illustrate the infrequency of winterprecipitation at GSP, we will examine thedaily numbers. There were 7250 days(November-April 1960-1999) on which winterp-type was considered. Of those 7250 days,snow was reported on 128 days (1.8% of thetime), sleet was reported on 152 days (2.1% ofthe time) and freezing rain was reported on128 days (1.8% of the time).
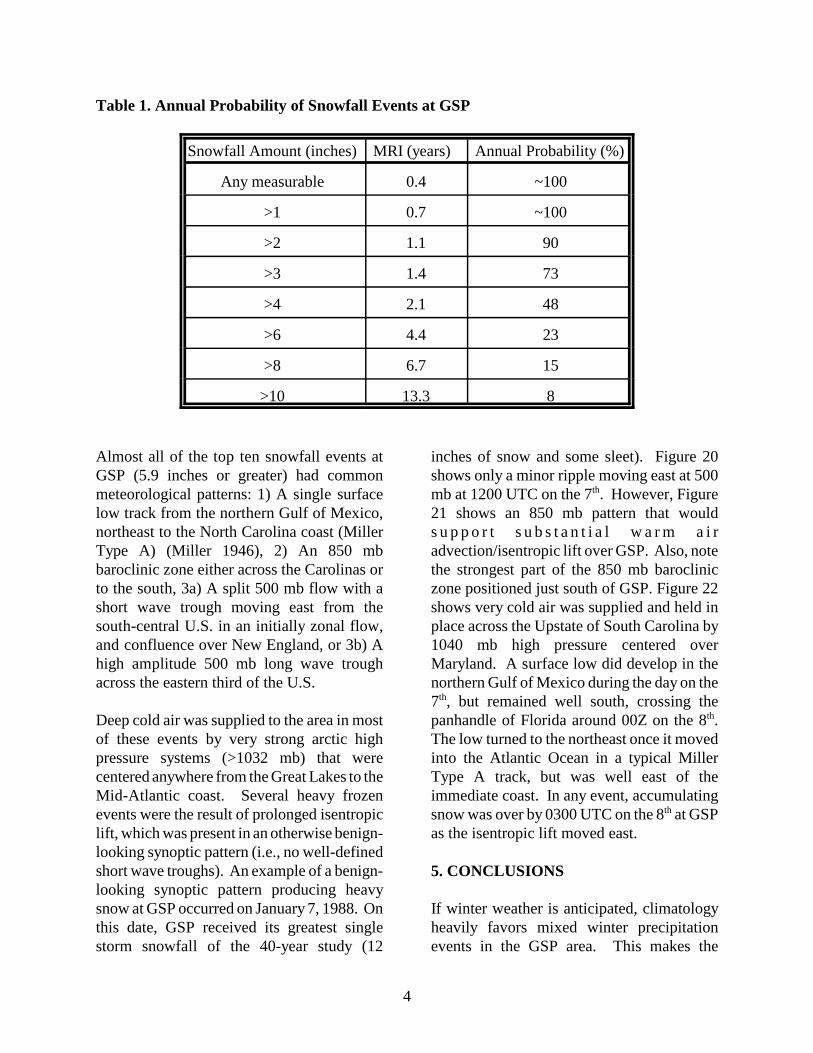
The mean recurrence interval (MRI) of aparticular amount of snowfall can becalculated by dividing the years of record bythe number of events. For example: the studyat GSP covers a 40-year period. Snowfallgreater than 4 inches occurred 19 times inthose 40 years (Fig. 19). Simple divisionyields a MRI of 2.1 years. Schaeffer (1984)states that the MRI is the reciprocal of theprobability that an event will occur in a giventime span. Therefore, the annual probabilitythat a greater than 4 inches snowfall event willoccur at GSP is 48% (see Table 1).
4
Table 1. Annual Probability of Snowfall Events at GSP
Snowfall Amount (inches) MRI (years) Annual Probability (%)
Any measurable 0.4 ~100
>1 0.7 ~100
>2 1.1 90
>3 1.4 73
>4 2.1 48
>6 4.4 23
>8 6.7 15
>10 13.3 8
Almost all of the top ten snowfall events atGSP (5.9 inches or greater) had commonmeteorological patterns: 1) A single surfacelow track from the northern Gulf of Mexico,northeast to the North Carolina coast (MillerType A) (Miller 1946), 2) An 850 mbbaroclinic zone either across the Carolinas orto the south, 3a) A split 500 mb flow with ashort wave trough moving east from thesouth-central U.S. in an initially zonal flow,and confluence over New England, or 3b) Ahigh amplitude 500 mb long wave troughacross the eastern third of the U.S.
Deep cold air was supplied to the area in mostof these events by very strong arctic highpressure systems (>1032 mb) that werecentered anywhere from the Great Lakes to theMid-Atlantic coast. Several heavy frozenevents were the result of prolonged isentropiclift, which was present in an otherwise benign-looking synoptic pattern (i.e., no well-definedshort wave troughs). An example of a benign-looking synoptic pattern producing heavysnow at GSP occurred on January 7, 1988. Onthis date, GSP received its greatest singlestorm snowfall of the 40-year study (12
inches of snow and some sleet). Figure 20shows only a minor ripple moving east at 500mb at 1200 UTC on the 7th. However, Figure21 shows an 850 mb pattern that woulds u p p o r t s u b s t a n t i a l w a r m a i radvection/isentropic lift over GSP. Also, notethe strongest part of the 850 mb barocliniczone positioned just south of GSP. Figure 22shows very cold air was supplied and held inplace across the Upstate of South Carolina by1040 mb high pressure centered overMaryland. A surface low did develop in thenorthern Gulf of Mexico during the day on the7th, but remained well south, crossing thepanhandle of Florida around 00Z on the 8th.The low turned to the northeast once it movedinto the Atlantic Ocean in a typical MillerType A track, but was well east of theimmediate coast. In any event, accumulatingsnow was over by 0300 UTC on the 8th at GSPas the isentropic lift moved east.
5. CONCLUSIONS
If winter weather is anticipated, climatologyheavily favors mixed winter precipitationevents in the GSP area. This makes the

5
performance of the forecaster all that moreimportant. Between 80 and 90% of all caseseach month result in mixed events (Fig. 23).Measurable snowfall events were most likelyin January and February. If measurablesnowfall is expected, climatology wouldsuggest that there is a high likelihood of thesnowfall reaching advisory or warning criteria.Overall, slightly less than one quarter of allsnowfall events satisfied warning criteria (25of 109; 23%), with 12 of those occurring inJanuary. However, February had the most“exclusively snow” events.
Annual probabilities of particular single stormsnowfall amounts occurring in a given yearcan be calculated from the mean recurrenceinterval. There is around a 100 percent chancethat the GSP area will have a winter stormproduce a snowfall of less than 1 inch in anygiven year. The annual probability drops tojust less than 50 percent (MRI of 2.1 years) fora snowfall of greater than 4 inches. Onaverage, a snowfall of greater than 10 inchescan be expected every 13.3 years, but with anannual probability of only 8%. In summation,for any given year, there is a very highlikelihood (90% chance) of receiving asnowfall of greater than 2 inches, but only a50/50 chance of receiving a snowfall ofgreater than 4 inches.
It is apparent, and perhaps inherently obvious,that in order for the GSP region to receiveheavy snow, a source of deep cold air and astrong or prolonged lifting mechanism mustbe present. The lifting mechanism can be inthe form of a short or long wave trough, orisentropic lift. Although rapid cyclogenesisspurred by approaching short wave energyoften gives birth to “mega” storms which stealmuch attention. Nontheless, the morepassively developing isentropic flow over adeep and cold air mass can also lead tosignificant snowfalls, as evidenced by the
largest single storm snowfall at GSP in this40-year study.
6. ACKNOWLEDGMENTS
The author would like to thank Laurence Lee,SOO, WFO GSP for his untiring and patientsupply of ideas, guidance and supportthroughout the evolution of this study. Dr.Joseph Pelissier, MIC, WFO GSP offeredhelpful insight into the calculation anddefinition of the mean recurrence interval.
REFERENCES
Jenne, R. L., 1975: Data sets formeteorological research. NCAR TechnicalNote NCAR-TN/IA-111. National Centerfor Atmospheric Research, 194 pp.http://dss.ucar.edu/datasets/ds195.5/version-II/general_info
Keeter, K.K., J.W. Cline, and R.P. Green,1989: Local objective guidance forpredicting precipitation type (LOG/PT) inNorth Carolina - An alternative to MOSguidance. NOAA Tech. Memo. NWS ER-82, NOAA/NWS, 125-135. [NTIS PB90-147414/AS.]
Keeter, K.K., and J.W. Cline, 1991: Theobjective use of observed and forecastthickness values to predict precipitationtype in North Carolina. Weather andForecasting, 6, 456-469.
Keeter, K.K., S. Businger., L.G. Lee, and J.S.Waldstreicher, 1995: Winter weatherforecasting throughout the eastern UnitedStates. Part III: The effects of topographyand the variability of winter weather in theCarolinas and Virginia. Weather andForecasting, 10, 42-60.
Keeter, K.K. and R.P. Green, 1981:Forecasting the predominance of frozen

6
precipiation: An alternative for theclassification of mixed precipitationevents and the verification of precipitationtype. National Weather Digest, 6, 17-20.
Miller, J.E., 1946: Cyclogenesis in theAtlantic coastal region of the UnitedStates. J. Meteor, 3, 31-44.
National Weather Service, 1996: WinterWeather Criteria and Coordination.Regional Operations Manual Letter E-8-96, National Oceanic and AtmosphericAdministration, U.S. Department ofCommerce, 4 pp.
Schaeffer, J.T., 1984: The mean recurrenceinterval (MRI). Central Region TechnicalAttachment 84-6, Kansas City, MO, 5 pp.

7
Figure 1. GSP total winter p-type events by month for the40-year period.
Figure 2. Number of events containing the specific combinations of p-type(s) for the 40-year period. See appendix A for acronym definitions.

8
Figure 3. Number of days containing the specific combinations of p-type(s) for the 40-year period. See appendix A for acronym definitions.
Figure 4. November p-type events at GSP shown bypercentage.
9
Figure 5. November snowfall occurrences shown bypercentage. Advisory criteria is 2 to 3 inches. Warning criteria is 4 inches, or greater.
Figure 6. Total December snowfall each year.

10
Figure 7. December p-type events at GSP shown bypercentage.
Figure 8. December snowfall occurrences shown bypercentage. Advisory criteria is 2 to 3 inches. Warning criteria is 4 inches, or greater.

11
Figure 9. January p-type events at GSP shown bypercentage.
Figure 10. Number of snowfall events by category at GSP. Warning events are those of4 inches, or greater, and advisory events are those of 2 to 3 inches.
12
Figure 11. January snowfall occurrences shown bypercentage. Advisory criteria is 2 to 3 inches.Warning criteria is 4 inches, or greater.
Figure 12. February p-type events at GSP shown bypercentage.

13
Figure 13. Total February snowfall each year.
Figure 14. Total January snowfall each year.

14
Figure 15. February snowfall occurrences shown bypercentage. Advisory criteria is 2 to 3 inches. Warning criteria is 4 inches, or greater.
Figure 16. March p-type events at GSP shown bypercentage.
15
Figure 17. March snowfall occurrences shown bypercentage. Advisory criteria is 2 to 3 inches.Warning criteria is 4 inches, or greater.
Figure 18. Total March snowfall each year.

16
Figure 19. GSP measurable snowfall events.
Figure 20. North American 500 mb heights 7 Jan 1988 at 1200 UTC.

17
Figure 21. North American 850 mb heights and temperature 7 Jan 1988 at 1200UTC.
Figure 22. North American mean sea level pressure 7 Jan 1988 at 1200 UTC.

18
Figure 23. P-type events shown by percentage for November through March. Eventscomposed of a mixture of precipitation were by far the most common at GSP.

19
Appendix A. P-Type Acronym Definitions
PL Sleet (or Ice Pellets)RA RainSN SnowZR Freezing RainPLSN Sleet and SnowRAPL Rain and SleetRASN Rain and SnowRAZR Rain and Freezing RainZRPL Freezing Rain and SleetZRSN Freezing Rain and SnowRAPLSN Rain, Sleet, and SnowRAZRPL Rain, Freezing Rain, and SleetRAZRSN Rain, Freezing Rain, and SnowZRPLSN Freezing Rain, Sleet, and SnowRAZRPLSN Rain, Freezing Rain, Sleet and Snow