Fs97-6-1927-eng.pdf - Publications du gouvernement du Canada
40
Scientific Excellence· Resource Protection & Conservation • Benefits for Canadians Excellence scientifique • Protection et conservation des ressources • Benefices aux Canadiens SAS Programs for Fitting a Seal Population Dynamics Model N. G. Cadigan, and P. A. Shelton Science Branch Department of Fisheries and Oceans P.O. Box 5667 St. John's, Newfoundland A1C 5X1 1993 Canadian Technical Report of Fisheries and Aquatic Sciences No. 1927 Fisheries Peches and Oceans et Oceans 1+1 Canada
Transcript of Fs97-6-1927-eng.pdf - Publications du gouvernement du Canada

Scientific Excellence· Resource Protection & Conservation • Benefits for Canadians Excellence scientifique • Protection et conservation des ressources • Benefices aux Canadiens
SAS Programs for Fitting a Seal Population Dynamics Model
N. G. Cadigan, and P. A. Shelton
Science Branch Department of Fisheries and Oceans P.O. Box 5667 St. John's, Newfoundland A1C 5X1
1993
Canadian Technical Report of Fisheries and Aquatic Sciences No. 1927
Fisheries Peches and Oceans et Oceans 1+1 Canada

Canadian Tech n ica l Report o f Fi .herie and Aquatic S cience
11.'.-110 ica I Il:p' 'I r-, ,11111.1111' "'111111' ,111 .1 I, ', IlIlIc;1I 111 1, II muuon 111.11 , 'POll 1hUll"' I"
l:!d'lllIJ; knowledge hili w hu h I Ih'l 1I111111;1I1~ , l p r , , ' p n ' l l , 1"1 I'llIn,lI~ lucr.u u« 11,cluucal 11:1'11I" .irc du cctvd pt un.mlv 1"\101'.1 a worklw rd, ,ludllllU; .uul 11.,\,..111
1n11'11I. llllIn,1I di-rnbuuon ' 0 I,' :11 '1IIll i I plal' l'd ,'11 uhrect m.u icr ,II1U rhc , 'II '
rellcct-, the brou I 111 1'1'" I .md r"h, II', III t h, I )"r.1I10ll:1l1 vi ~ I her I'" and 1I1'1:,11l"
Ilolllll'l~ , hvhc r u, .uid .14 11 .1111 dl'1I1'"
rechillcall 'p'll" 11l ;1 ~ h '1l1'11 .1 11111 f'lIhh, .llll.n I h, .. . 'lIn'l ,I1.1II"n ,JP p l' .I 1
,Ih,, " lit ah'llal'l or each 11:1'''11 Lllh I ,'f'1I1 1 I ' .rh II ,1..'1nlIII " /It," /o '.. " /I", ,1tI,/ / 1 h, II, ' 1/1\/1'1", ,IIIJ 111.1, ' J III 'I I, 1l, 'p,IIII1I 'II " ,111 11 11 ,11 IIld l.:\ l ' '1,'111111' .II1J
rccluucal pubhr.urun-, IIlJlIWI~ I -l"hln 1111 , 'II,' \\l'I , ' ' ' lI l1 l ,1 l rcluuc.rl Rc p.u r Illlh, 1'I,h,'II,'
Rc , ',II .h B,'alu " I ~a ll ad , 1 ' 1I11 1h ,' 1 ~ "l ' 1-1 w cr , I ued ,I' 1""1',111111<'111 ,j Ih,
111\ ""IlI11CIII , I-I,hl:ll"''' .1I1d tll,tlllH ......1\ 1'1 , I{C'L',lflh ,111.1 Ik\llllf'IIlCIII \)11",,1111,11,
l cc huu al R Cl' lI rt Nurube: -15 '/2-1 \\ ... 1, " ,,,cd ", Dep.u un III "I I I hUI" .iud the 1:11\11,111111,'111. c1I1' ,IIId 1.11111, " "I lill "hlll,'al RepII11 ,111111 1 , , 'II,l tvh I l hc
1I.ll11l \\;1' changed wuh I"pllil 111111111,'1 '1 2" 1...chmc al IL'p'lll .uc I'r"llllLl'd 1l"!:! I"II,t1h hlll .lIll111l11l1l'lnl 11.1111'11.111\ Ih'qll l"h
111 1 In JI\ ulual rcp.u t \\ til b, l rllvd 1'1\ lh, I' II III l..! ,"I "hl"hIllI:II I I, lL'J 'II t h.. I'''I1I,',,\,'1
.uul 11 11t 1'.lg" ( UI-tll -'ltll\.. f,'p'lIl \\111 h, uPI'II..d h ll ,I k, h\ U 'llll1l
...llI,11 ,1t:l'111
Rapport te chnique .a uad ien d e, ..cience.. hulieutiques et aquutique
II' 1,l!,pllll 1",11111'1"'" ulllllLI1I1,'1I1 dc' 1,'II',' lglI,'III,'1I1 ,I 'IIIIII'l"'" ct t ...cluu que-. '1"1 "'11'11111,'111 11111: "'llI llhlllltlll ;111\ ,(11111,11' all"l" .rr i ucllc III ,II , qlll II, "'Ill
pol' 11"1111.11,'1111'111 .lppl .. p"1: ptllll 1.1 1'111111,.11"'11 d.in 1111 nun u.i l 'I11"1I1 11I'1"L LI'
lal'l'''" 1,- -luuquc 11111 dc 1111" ," ' 11 11 11. 111 ' 11 1 ,1 1111 publ« 11111:111.111"11,11,'1 II ,tllIl
dr-u ibuc u cet cchclou 1111'\ ,' ,I IICIlI1,II"'llIlIlI'''qll,IIII,II'"I,1 d,l.1I1 1,1 " ltl: l d k l ,
1.1 v.r-tc g.1I1l1ll1: 13,', IIIICIl! ,' 1 .1,' 1'"llllqll' .Ill 1111111'1"'1, ilL' Pl'd" L'I .I" / k L'ali , , I' ! ", I- d il l.' It: , '1"'"1'1: h.ihcuuuu« ,' I .iqu.u rquc
I " r a p l' " r b t cc hmque pcuvvm ct i v nl,' ,-,111"11'" .I,' pllhIlL "II(I" ' " 111 1' 1. 1\" I, tu u l .1,'1 p.II,,1I .ui-dc, U du II: 1I11I "1L' h,lqlll'I.I[11'1111 Le 1.ll'r"f1 1, ',h1114111: (1111
It"IIIlIL' d.ur-, 1.1 Il'\ III U"'/lII I" .1," " /," /, , 11'1/1</111//1' , / 1/tIIi. trt iqt« : d Ii "111
,'la",' .1,111 l'uu!e "111111 .11 d,' pllhllL,lll(ln ,I ...nuuqu... ci tv. lunqur JII rt.1"1I,1 , 'Il'
1<: 1111111':111 1.1-151> de ," II' (f II 01111,'1,' public :1 1111l d, 1' ,11'1'''' I I L1l1l1qUL ' dl
1'( JIl l"" Jt '\"l'It"1 dlL' , 'III k p.:-dl'll dill ;lIlat.l,1 L ' IlUIllI'I,' -t ., ,1 7 1.' '''"l pal II I
1II Il' tI, 1.1('1'"1 r-, !,' hili IU" .I, 1.1 [III ,:"'11<10 g"OI"I .I'" de 1.1 Il:l " ' I lI1L , I J II .II' \ "1,,1'1' ''m ciu "llll.l:JI" pcche '\ I 1,11Ill'1 1l11l11"L'fl'J"ITII " " " Il- Ill , 1I1 l c 1I111ll """ 1' :1
4~-l ,1111 ct pubhe .r uu , d 1,lpl'"lh 1I,.. hIlILjUI: du cr v rcc d,' ,, -·.h, ' I dc l.. Illl"l
lilt III tcrc dl' Pl.'l hl" 1.: 1 tI, t' Lnvn onucmeut I I 1I(11l101l'11lL'l .111,1 t il e .1 ,'1, 'I.I~IIIIII'
de 1.1 p.u u i ron du IIUIII,'" '12" I " 1,ll'pll" rcch mquc "'111 pr oduu .I I\'dld,ln I ,'g III11;,1 '";11 1111111 ...1<11 ... a
1\, 1t,'I"o 11,IIillllai L... J 'I\l.11I " d, /.11'1',"1 ""(11 11',111 lall ,' p.1I r ct a h l l , '1ll,1I 1
. I u tl ll i c11l11\ k IIPIIl 11b'lIl l III 1,1 \l11I\L'IIIII, , 'I I:i r,lgl till 1111 , I", loIl'p\llt " 1''' 1'1- ' ' 1" 11 1 1"111111 l " " l l l r t'llIhllll"1I p .11 ,I , .I).(tlll L" ll l l ll"' l lI .l 1l

Canadian Technical Report of Fisheries and Aquatic Sciences 1927
July 1993
SAS PROGRAMS FOR FITTING A SEAL POPULATION DYNAMICS MODEL
by
Noel G. Cadigan and Peter A. Shelton
Science Branch Department of Fisheries and Oceans
P.O Box 5667 St John's, Newfoundland Al C 5Xl
Canada

@Minister of Supply and Services Canada 1993 Cat. No. Fs 97.6/1927E ISSN 0706-6457
Correct citation for this publication:
Cadigan, N. G., and P. A. Shelton. 1993. SAS programs for fitting a seal population dynamics model. Can. Tech. Rep. Fish. Aquat. Sci. 1927: iii + 34 p.
II
ABSTRACT
Cadigan, N. G. and P. A. Shelton. 1993. SAS programs for fitting a seal population dynamics model. Can. Tech. Rep. Fish. Aquat. Sci. 1927: iii + 34 p.
This technical report presents a description of two SAS programs (MAKED.SAS and SEAL.SAS) that fit a population dynamics model to seal data. The programs have been constructed in such a manner that special knowledge of SAS is not required to run them. The population dynamics model is transformed to a standard nonlinear regression model and parameters are estimated using SAS's PROC NLIN. Output from the programs includes estimates of intrinsic mortality, pup numbers over time and total population numbers over time. The code for the programs is presented along with two examples.
RESUME
Cadigan, N. G. et P. A. Shelton. 1993. SAS programs for fitting a seal population dynamics model. Can. Tech. Rep . Fish. Aquat. Sci. 1927: iii + 34 p.
Ce rapport technique presente une description de deux programmes SAS (MAKED.SAS et SEAL.SAS) qui adaptent un modele de dynamique des populations aux donnees sur les phoques. Ces programmes ont ete concus pour qu'on puisse les utiliser sans connaissance prealable speciale du SAS. Le modele de dynamique des populations est transpose en modele de regression non lineaire standard et les parametres sont estirnes avec la fonction PROC NLIN du SAS. Ces programmes peuvent fournir des estimations du taux de mortalite intrinseque, de la population de nouveaux-nes sur une periode des temps donnee. Le codes relies a ces programmes sont presentes, en compagnie de deux exemples .
•
III

•

INTRODUCTION
The programs presented in this paper are appropriate for the analysis of the population dynamics of numbers-at-age for a population in which catch-at-age (harvest), pregnancy rate-at-age and survey data for some ages exist. The analysis involves estimating the parameters of a population dynamics model (PDM) using survey data. The PDM is written in terms of two unknown parameters and known catch and pregnancy rates. A similar model was presented by Roff and Bowen (1983) however these authors did not use an efficient algorithm to obtain parameter estimates and their computer program for fitting the model is not widely available. A more efficient algorithm is presented in this report along with computer programs and instructions to implement the algorithm.
The PDM is presented in a scalar and matrix form. The PDM is then transformed to a standard nonlinear form that relates numbers-at-age in terms of 2 unknown parameters and data derived from catches and pregnancy rates. The SAS program MAKED.SAS constructs the derived data. Parameters are estimated from survey data using weighted least squares where the weights are the estimated variances of the survey estimates. The estimated parameters are then used in the transformed model to produce estimates of numbers-at-age. The SAS program SEAL.SAS produces the parameter estimates and the estimates of numbers-at-age. The programs have been constructed so that one does not need to know SAS to run them.
A note of caution: PROC NUN in SEAL.SAS automatically produces confidence intervals for parameter estimates and can produce confidence intervals for model output and derived parameters. For the model in this paper the assumptions underlying the construction of the above confidence intervals are unrealistic.
PROGRAM SUMMARY
POPULATION DYNAMICS MODEL
The PDM is:
(na-l,t-le-!f- - Ca-l,t-t)e-!f- 0 < a < A, (1){ l:i ni ,tfi,t a = 0,
where n a ,t the population number at age a in year t,
Ca,t the number caught at age a in year t,
t., the per capita pregnancy (fecundity) rate of age a
parents in year t assuming a 1:1 sex ratio,
m instantaneous natural mortality rate.
1

A plus age class A, i.e. ages A and greater, is included in the model so that
A-I is taken as ages A-I and greater. It is necessary to construct a different model for numbers-at-age in the year prior
to the first year for which reliable pregnancy rate data exists. The year for which reliable pregnancy rate data exists is designated the initial year, to, in the model. The model is modified by removing the plus age class and by assuming seals do not live longer than A years. This procedure is similar to that used by Cooke et al (1985). Assuming that pup production prior to to is equal to a hunting selection parameter (s) times the pup catch and using (1) recursively, it follows that
n a,to-1 -rnase Co,to-a-l
a "" -rn(i- 1 ) . 1 A
- ~ e 2 Ca- i,to-i-l , a = ,... . (2) i=l
If, in the above equation, catches are required for which no data exist it can be assumed that those catches are equal to the earliest catch available, although alternative assumptions can be made (the average of the first 5 catches available etc.) .
To summarize, population numbers-at-age are obtained from- (1) in the initial year and onwards because of the availability of Ii/S. For the years prior to the initial year, ie to - 1 and earlier, (2) is used because it requires only catch numbers. Note that the POM makes several simplifying assumptions. For example, sand m are assumed to be constant , independent ot t , etc. Changes to the assumptions in the model will have an impact on the estimates.
MATRIX FORMULATION
In matrix notation the model is:
nt e-rn Pnt-l - e-~ PCt-1 + Ftnt,
where n~ (nO,t, nl ,t , nA ,t),
c~ = (Co,t,Cl,t, CA ,t),
P [~ n, [~ ],
2

The model may equivalently be written as:
m e - Atnt-I - e-Y Atet-I, o::; m < 00,
(I - Fd- I p ,
(I +Fd P , when fO,t = 0, t = 1,2, ....
The population vector in the year prior to the initial year of the model is constructed as follows. Denote the vector of numbers-at-age in year t without the plus age class as n;. n; is an Ax 1 vector. Let
D o 0
AxA
and
[10']D 0 0
lAxA o 0 .
mThen n;o-I = e- Dn;o_2 - e- T DC;o_2 + sD, C;o-I' Using this formula recursively A times yields:
, 0 A A
-AmDA • ""' -m(i-!.)Di • + ""' -m(i-I)Di-ID •e n ' - L.Je 2 Cto-i- I sL.Je 'Cto-i' to-I-A i=1 i=1
where DO I.
Note that D A = 0 so that
A A ""' -m(i-I)Di-ID· ""' -m(i-!.)Di •S L.J e 1 Cto-i - L.J e 2 C to- i - I' o::; s < 00.
i=1 i=1
Let
o 0 ]B IAxA AX(A-A) .0
(A+I)xA [ 0' I'
3

TRANSFORMED MODEL
It is useful to rewrite the model in the following form. Standardize time so that to = O. At time t, using the model recursively, it follows that
A tL [se- m(t+i-1)w; - e-m(t+i-~)u;] - L e-m(t-i+~)v;, t 2 0, i=1 i=O
where u~ [IT At-k] BDic;o_i_I' k=O
i-1w't [IT At-k] BD D 1 C;o-i, k=O
and v; [tr At-i+i] Ci-1· J='
For pups
. A t
nO,t L [se- m(t+i-l)w;(1) - em ( t+ i - ~ ) u ; (1 ) ] - L e-m(t-i+~)v;(1), i=1 i=O
and for total population numbers
. A t
n.,t L [se-m(t+i-1)w~(.) - em(t+i-~)u~(.)] - L e-m(t-i+~)v;(.), i=1 i=o
where w;(1) is th e first element in the vector wL etc. The notation (.) denotes summation over all ages.
The model for pup numbers, total population numbers, or numbers at any specific age is now in a standard nonlinear from. It relates numbers in terms of unknown parameters and known data.
A statistical model is assumed that describes the distribution of survey estimates of na,t'S in terms of the dynamic models na,t's. Let nO,t denote a survey estimate of nO,t and 0-; denote the estimated variance of nO,t. The statistical model is:
i=l , ..., l.
Maximum likelihood (or equivalently least-squares) parameter estimates are obtained using PROC NLIN of SAS (1989).
4
IMPLEMENTATION
Two SAS programs were written to estimate the parameters of th e model. The programs are separate because the transformation of the data need only be performed once although model parameters may be estimated many times based on different survey data. MAKED.SAS is the program that computes the transformed data from the catch and pregnancy rate data. This program requires BASE SAS (1988), SASjIML (1989) and SASjMACRO (1987) software. SEAL.SAS reads the output from MAKED.SAS as well as an ascii file that contains the survey data and computes the parameter estimates as well as the number-at-age for pups and total population size. This program requires BASE SAS (1988), SASjIML (1989), SASjSTAT (1989) and SASjMACRO (1987) software.
The programs were developed on a SUN UNIX workstation running SAS V6.07.02 and tested successfully (see Example 1). The SAS programs were used in extensive simulations. SEAL.SAS would not converge in at most .5% of the simulations. The solutions have always converged when applied to real data.
INSTRUCTIONS FOR RUNNING MAKED.SAS
Copy MAKED.SAS to'a working directory. Ensure the following files are in the working directory,
• catch.dat. This ascii file contains a column of years for which catch data exists as well as columns of catches for each age up to the maximum age for which cat ch data exists.
• preg.dat. This ascii file contains a column of years for which pregnancy rate data exists as well as columns of pregnancy rates for each age up to the plus age class. The program infers the initial year the model starts in from this file.
• info.dat. This ascii file contains 1 record with three columns. The first column contains the working directory name in parentheses, the second contains the maximum age (numeric) and the third contains the plus age class (numeric).
All columns should be separated by blank spaces. Examples of these files are given in Appendix 3 and 4. To run the program type sas maked. After the program completes two new files should exist whose first name extensions are pupData and popData. Second extensions depend on the operating system, for example in SAS V6.07.02 running on a UNIX computer the extensions are .ssdtll for both files. These files are required by SEAL.SAS
5
INSTRUCTIONS FOR RUNNING SEAL.SAS
Copy SEAL.SAS to a working directory. Ensure the following files are in the working directory,
• survey.dat. This ascii file contains a column of years for which survey data exists as well as columns of survey numbers and standard errors .
• info.dat. same as above.
Again all columns should be separated by blank spaces. Examples of these files are given in Appendix 3 and 4. To run the program type sas seal. As a result of exe cuting the code two new files should be created by the program. pup.dat is an ascii file containing years and pup estimates. pop.dat is an ascii file containing years and total population estimates. Parameter estimates and other information are obtained from the SEAL list file. PROC NUN in SEAL.SAS automatically produces confidence intervals for parameter estimates however the assumptions underlying the construction of these confidence intervals are unrealistic for the model considered here. One should have to modify this program only if the range of starting values in PROC NLIN is too far away from the ·parameter estimates. The range (found in the section of code marked by %'s) has been deliberately made wide and should work for many types of data although it is conceivable that they will not work for some data.
Acknowledgements
We thank Don Bowen for information on the model, Garry Stenson for assistance in understanding the data sets and harp seal biology and Beth Perry for compiling catch-at-age and pregnancy data.
6

REFERENCES
Bowen , W. D. 1982. Age structure of Northwest Atlantic Harp Seal catches, 19521980. NAFO Sci. Coun. Stud. No.3: 53-65.
Cooke, J. A., A. W. Trites and P. A. Larkin (1985). A view of the population dynamics of the Northwest Atlantic Harp al (Phoca groenlandica) . Final report submitted to the Royal Commission on Seals and ng Industry in Canada, June 30, 1985, 139p.
Roff, D. A., W. D. Bowen. 1983. Population dynamics and management of the Northwest Atlantic Harp Seal (Phoca groenlandica). Can. J. Fish. Aquat. Sci. 40: 919-932.
SAS Institute Inc., 1987. SAS Guide to Macro Processing, Version 6, First Edition, Cary, NC. 233p.
SAS Institute Inc., 1989. SAS/IML Software: Usage and Reference, Version 6, First Edition, Cary, NC. 501p.
SAS Institute Inc., 1988. SAS Language Guide, Release 6.03 Edition. Cary, NC. 530p.
SAS Institute Inc., 1989. SAS/STAT User 's Guide, Version 6, Fourth Edition, Volume2, Cary, NC. 846p.
Shelton, P. A., N. G. Cadigan and G. B. Shelton. 1992. Model estimates of harp seal population trajectories in the Northwest Atlantic. CAFSAC Res. Doc 92/ , 15p.
7
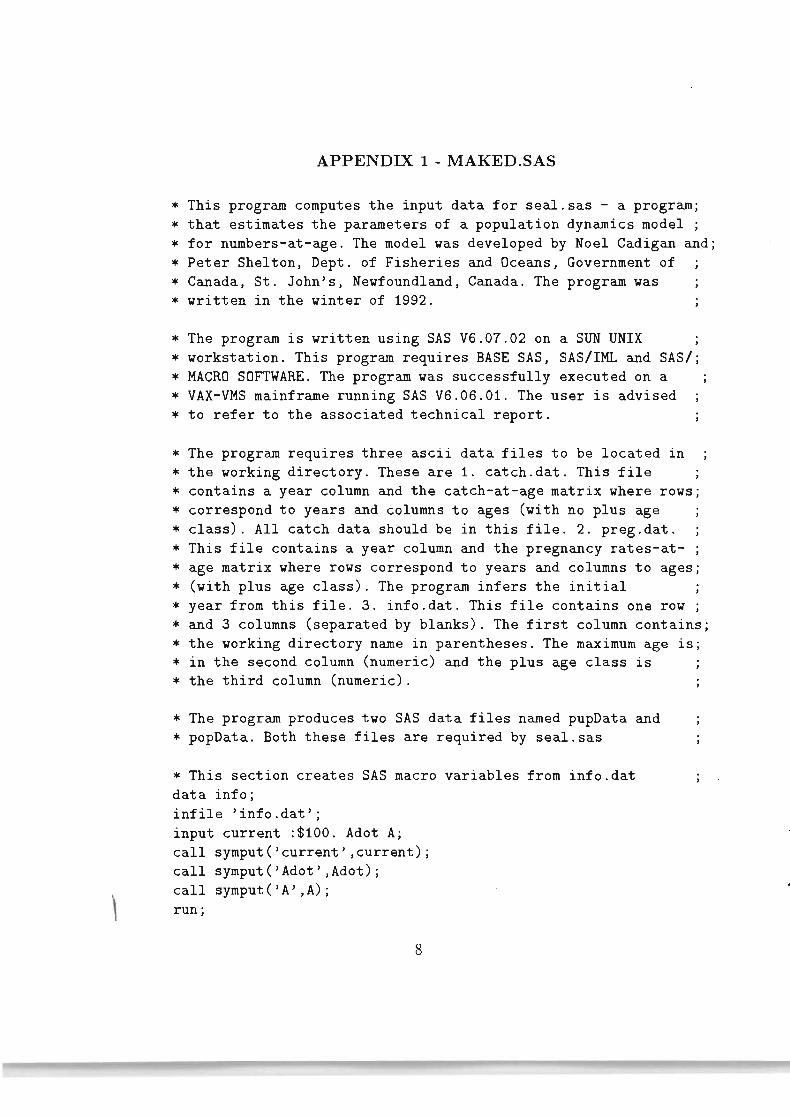
APPENDIX 1 - MAKED.SAS
* This program computes the input data for seal.sas - a program;* that estimates the parameters of a population dynamics model ; * for numbers-at-age . The model was developed by Noel Cadigan and; * Peter Shelton, Dept. of Fisheries and Oceans, Government of * Canada, St. John's, Newfoundland, Canada. The program was * written in the winter of 1992.
* The program is written using SAS V6.07.02 on a SUN UNIX * workstation. This program requires BASE SAS, SAS/IML and SAS/; * MACRO SOFTWARE. The program was successfully executed on a * VAX-VMS mainframe running SAS V6 .06.01. The user is advised * to refer to the associated technical report.
* The program requires three ascii data files to be located in * the working directory. These are 1. catch.dat. This file * contains a year column and the catch-at-age matrix where rows; * correspond to years and columns to ages (with no plus age* class). All catch data should be in this file. 2 . preg.dat. * This file contains a year column and the pregnancy rates-at* age matrix where rows correspond to years and columns to ages; * (with plus age class). The program infers the initial * year from this file. 3. info.dat. This file contains one row; * and 3 columns (separated by blanks). The first column contains; * the working directory name in parentheses. The maximum age lSi
* in the second column (numeric) and the plus age class is * the third column (numeric).
* The program produces two SAS data files named pupData and * popData. Both these files are required by seal.sas
,
* This section creates SAS macro variables from info .dat data info; infile 'info.dat'; input current :$100. Adot A; call symput('current' ,current); call symput('Adot' ,Adot); call symput('A' ,A); run;
8

libname current ¤t;
Y.let Adot=&Adot ; Y.let A=&A;
* This section creates a SAS data set for catch data data catch; infile 'catch .dat J
;
input year cO-c&Adot; run;
* This section creates a SAS data set for pregnancy data data preg; infile 'preg .dat'; input year pO-p&A; run;
options Is=75 ps=64;
proc iml;
* SAS/IML interactive matrix language is used to modify the * catch and pregnancy data for the nonlinear model (see Tech * Rep)
* create a temporary vector to read catch file into use catch; read all into temp;
yearc = tempC,1]; catch = tempC,2:ncol(temp)];
* create a temporary vector to read pregnancy file into use preg; read all into temp;
yearp = tempC,1]; preg = tempC,2 :ncol(temp)];
9

* a is the plus age class plus 1 a = ncol(preg);
* compute catch matrix (C) with year as columns and with * plus age class. Put maximum age + 1 of catch in Adot C = t(catch[,1:a]); Adot = ncol(catch); C[a,] = C[a,] + t Cca't ch] , (a+1) :Adot] [,+]);
* create catch matrix (CI) for generating initial numbers-at-age; ta = yearp[1]-yearc[1]; CI = repeat(t(catch[1,]),1,Adot-ta-1); if ta > ° then CI = Clllt(catch[1:ta,]);
* create matrices involved in generating initial numbers-at-age; D = repeat(O,Adot,Adot); D[2:Adot,1:(Adot-1)] = diag(repeat(1,Adot-1,1)); D1 = repeat(O,Adot,Adot);D1[1,1]=1; Am = repeat(O,a,Adot); Am[1:a,1:a] = Diag(repeat(1 ,a,1)); Am[a,(a+1):Adot] = repeat(1,1,Adot-a);
U = repeat(O,a,Adot-1); W=U; Di = D;
Adot = Adot - 1; W[,1] = Am*D1*CI[,Adot]; do i = 1 to Adot-1;
U[,i] = Am*Di*CI[,Adot-i]; W[,i+1] = Am*Di*D1*CI[,Adot-i]; Di = D*Di;
end; U[,Adot] = Am*Di*CI[,1];
* create matrices of modified data for nonlinear model. These; * are Datapup for pup numbers and Datapop for total population; * numbers. T is the numbers of years used in fitting the model; T=nrow(yearp);
10

D = repeat(O,a ,a); D[2 :a,1:(a-l)] = diag(repeat(l,a-l,l»; D[a,a] = 1; Ft = repeat(O,a,a);
Datapup = repeat(O,t,t+2*Adot+1); Datapop = repeat(O,t,t+2*Adot+1);
Datapup[,1] = yearp; Datapop [, tJ = yearp; one = repeat(1,a,1); ID = diag(repeat(l,a,l»;
do it = 1 to t; Gu = ID; do i = 1 to it;
Ft[1,] = O.5*preg[it-i+1,]; Gt = (ID + Ft)*D; Gu = Gu*Gt;
end; do i = 1 to Adot;
tu = Gu*U[,i]; tw = Gu*W [, i] ; Datapup[it,i+l] = tu[1]; Datapop[it,i+l] = sum(tu); Datapup[it,i+Adot+l] = tw[1]; Datapop[it,i+Adot+1] = sum(tw);
end; end;
do it = 1 to t; do i = 1 to it;
Gv = diag(repeat(1,a,1»; do j = i to it;
Ft[1,] = O.5*preg[it+i-j,]; Gt = (ID + Ft)*D; Gv = Gv*Gt;
end; if (ta=O&i=1) then v = Gv*C[,1]; else v = Gv*C[,ta+i-1];
11
Datapup[it,i+2*Adot+1] = v[1]; Datapop[it,i+2*Adot+1] = sum(v); end;
. end;
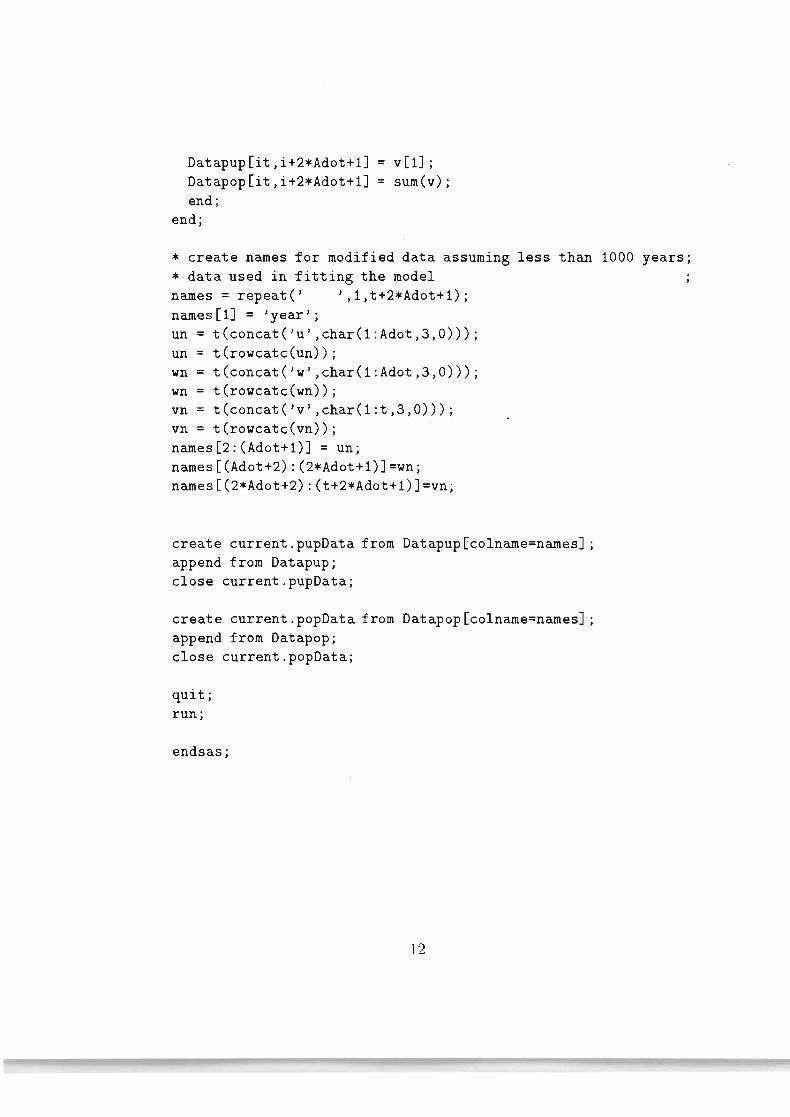
* create names for modified data assuming less than 1000 years; * data used in fitting the model names = repeat(' ',1,t+2*Adot+1); names[1] = 'year'; un = t(concat('u' ,char(1 :Adot,3,0))); un = t(rowcatc(un)); wn = t(concat('w' ,char(1:Adot,3,0))); wn = t(rowcatc(wn)); vn = t(concat('v' ,char(1:t,3,0))); vn = t(rowcatc(vn)); names[2:(Adot+1)] = un; names[(Adot+2):(2*Adot+1)]=wn; names[(2*Adot+2) :(t+2*Adot+1)]=vn;
create current.pupData from Datapup[colname=names]; append from Datapup; close current.pupData;
create current.popData from Datapop[colname=names]; append from Datapop; close current.popData;
quit; run;
endsas;
12

APPENDIX 2 - SEAL.SAS
* This program computes the estimates of the parameters of a * population dynamics model for numbers-at-age. The mo~el was * developed by Noel Cadigan and Peter Shelton, Dept . of * Fisheries and Oceans, Government of Canada, St . John's, * Newfoundland, Canada. It is based in part by work by Roff and; * Bowen (1983) and Cooke et al (1985) . The program was written * in the winter of 1992.
* The program is written using SAS V6.07.02 on a SUN UNIX * workstation. This program requires BASE SAS, SAS/IML, SAS/ * MACRO and SAS/STAT SOFTWARE. The program was successfully * executed on a VAX-VMS mainframe running SAS V6.06.01. The * user is advised to refer to the associated Technical report.
* The program requires an ascii data file (survey.dat) to be * located in the working directory. This file contains a year* column, a survey column and a standard error column. The * program also requires the ascii file info .dat (located in * the working directory). This file contains one row and 3 * columns (separated by blanks). The first column contains the * working directory name in parentheses. The maximum age is in * the second column (numeric) and the plus age class is the; * third column (numeric). The program uses the SAS data files * pupdata and popdata as inputs in the estimation procedure.
* The program computes two ascii data files named pup.dat and * pop.dat . These files contain time series of pup and total * population numbers. Parameter est imates and other information; * are contained in the list file produced by seal.sas.
options Is=64 ps=75;
* This section creates SAS macro variables from info.dat data info; infile 'info.dat'; input current :$100. Adot A; call symput('current' ,current) ; call symput('Adot' ,Adot);
13

call symput('A' ,A); run;
libname current ¤t;
'l.let Adot=&Adot; 'l.let A=&A;
* This section creates a SAS data set from survey.dat. t is years; * n is surveys and w is survey standard errors data surveys;
infile'survey.dat'; input t n w; year=t;
* This section creates a SAS macro variable for the number of * years of catch data
data _nuII_; set current.pupdata; call symput('n_obs' ,_n_); run;
'l.let n_obs=&n_obs;
* This section creates a SAS data set for parameter estimation
"data min; merge current.pupdata surveys; by year; tt = tit = _N_; if year eq tt; drop year tt;
* This section computes the parameter estimates
proc nlin method=newton data=min best=10 save;
*'l.'l.'l.'l.'l.'l.'l.'l.'l.'l.'l.'l.'l.'l.'l.'l.'l.'l.'l.'l.'l.'l.'l.'l.'l.'l.'l.'l.'l.'l.'l.'l.'l.'l.'l.'l.'l.'l.'l.'l.'l.'l.'l.'l.'l.'l.'l.'l.'l.'l.'l.'l.'l.'l.'l.'l.'l.'l.'l.'l.'l.'l.'l.; * initial values;
14

parms m = 0 to 1 by 0 .02 s = 0 to 20 by 1;
*.,.,.,.,./~./~.,.,.,.,.,.,.,./~~~~~~.,.,.,./~~~.,.,.,.,.,./~~~.,./~~.,.,./~~~.,.,.,./~~~~./~~~~~.
1.1.1.1.1,1.1.1.1.1.1.1.1.1,1.1.1.1.1.1.1.1.1.1.1.1.1.I, 1.1.1.1.1.1.1.1.1.1.1.1.1.1.1.1.1.1.1.1.1.1.1.1.1.1.1.1.1.1.1.1.1.1. ,
* weights;
* arrays for nonlinear model;
array um{&Adot} u1-u&Adot; array wm{&Adot} w1-w&Adot ; array. vm{&n_obs} vl-v&n_obs;
* temporary computations;
tu = O·, tv = O·, tw = O·, do i = 1 to t·,
tv = tv + exp(-m*(t-i+0 .5))*vm{i}; end; do 1 = 1 to &Adot;
tu = tu + exp(-m*(t+i-0 .5))*um{i}; tw = tw + exp(-m*(t+i-l))*wm{i};
end;
* nonlinear model;
model n = s*tw - tu - tv;
* derivatives;
der .s = tw; der .s .s = 0; dmu = 0; dmv = 0; dmw = 0; do i = 1 to t;
15

dmv = dmv - (t-i+O,5)*exp(-m*(t-i+O.5))*vm{i}; end; do i = 1 to &Adot;
dmu = dmu - (t+i-O.5)*exp(-m*(t+i-O.5))*um{i}; dmw = dmw - (t+i-1)*exp(-m*(t+i-1))*wm{i};
end; d2mu = O', d2mv = O', d2mw = O', do i = 1 to t;
d2mv +d2mv = end; do i = 1 to &Adot;
d2mu = d2mu + ((t+i-O .5)**2)*exp(-m*(t+i-O.5))*um{i}; d2mw = d2mw + ((t+i-1)**2)*exp(-m*(t+i-1))*wm{i};
end; der.m = s*dmw - dmu - dmv; der.m.m = s*d2mw - d2mu - d2mv; der.m.s = dmw;
output out=out p=pred parms=m s sse=sse; run;
* print some output from NLIN;
data out1; merge out surveys; rename t=year n=survey w=std; keep t n w pred m s sse; proc print data=out1 round;
* SAS data set of parameter estimates;
data params; set out; if _N_ = 1; keep m s;
* produce estimates of numbers-at-age for both pups and total * population
16

proc iml;
* numb is an IML function that computes the nonlinear model for ; * numbers at age. b is a 2x1 vector of parameters, u v and ware; * data derived from catch and pregnancy rates for a particular * age i.e. pups, total numbers etc. tti is a vector of julian * years and to is the initial julian year for the model.
start numb(b,u,v,w,tti,to); m = bel]; s = b [2] ; t = nrow(tti); ti = tti - to + 1; ret = repeat(O,t,l); do it = 1 to t;
tt=ti[it] ; td = t((l:&Adot)+tt); tu = u[it,]; tw = w[it,]; ret[it] = s*tw*exp(-m*(td-1))-tu*exp(-m*(td-O.5)); td = tt-t(l:tt); tv = v[it,] ;tv=t(tv[l:tt]); ret[it] = ret[it] - tv*exp(-m*(td+O.5));
end; return(ret); finish;
* input parameter estimates;
use params; read all var{m s}; close params;
* input pup and total population data and create u,w and v * matrices
use current.pupData; read all into temp; close current .pupData;
17
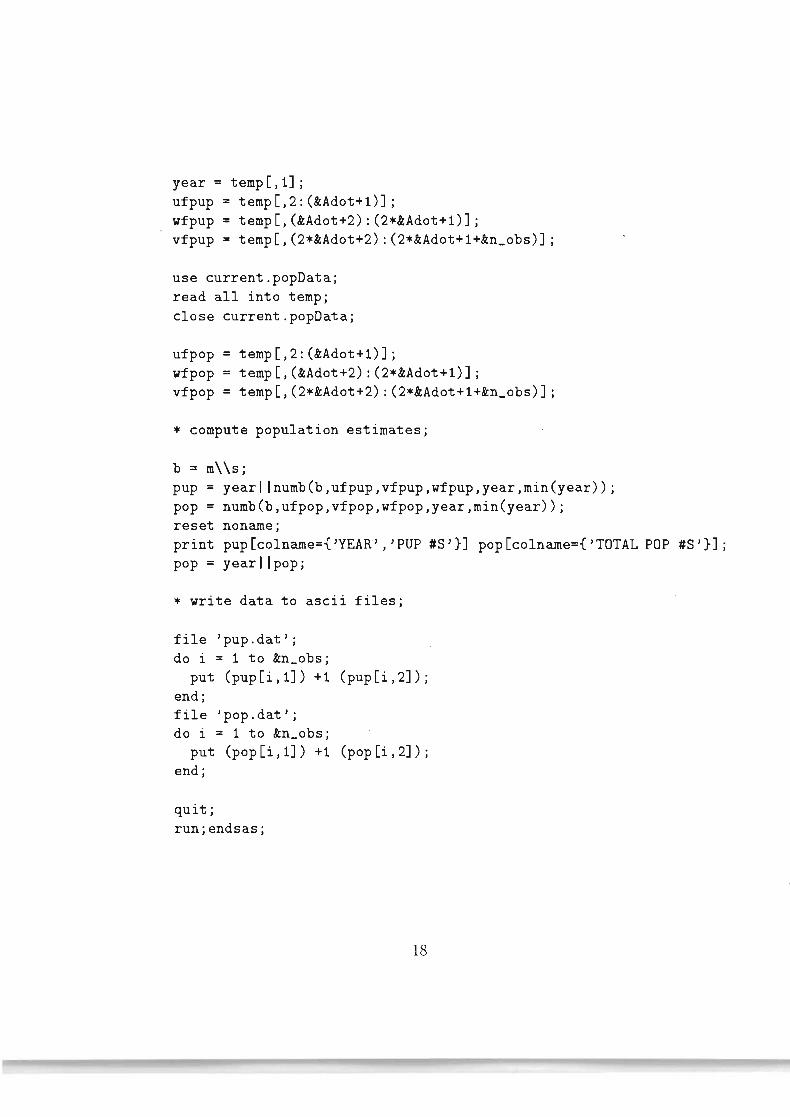
year = temp [,1] ; ufpup = temp[,2:(&Adot+l)]; wfpup = temp[,(&Adot+2):(2*&Adot+l)]; vfpup = temp[,(2*&Adot+2):(2*&Adot+l+&n_obs)];
use current.popData; read all into temp; close current.popData;
ufpop = temp[,2:(&Adot+1)]; wfpop = temp[,(&Adot+2):(2*&Adot+1)]; vfpop = temp[,(2*&Adot+2):(2*&Adot+1+&n_obs)];
* compute population estimates;
b = m\\s; pup = yearl Inumb(b,ufpup,vfpup,wfpup,year,min(year)); pop = numb(b,ufpop,vfpop,wfpop,year,min(year)); reset noname; print pup [colname={ 'YEAR' , 'PUP #8'}] pop [colname={ 'TOTAL POP #8'}]; pop = yearllpop;
* write data to asc~~ files;
file 'pup.dat'; do i = 1 to &n_obs;
put (pup[i,1]) +1 (pup[i,2]); end; file 'pop.dat'; do i = 1 to &n_obs;
put (pop[i,l]) +1 (pop[i,2]); end;
quit; run;endsas;
18

APPENDIX 3 - EXAMPLE 1
The following example has been artificially constructed and should be easy to implement. The survey data was generated by fixing m = 0.1 and s = 5 in the model. Note in the list file that is created after executing SEAL.SAS that the parameters are reproduced exactly. Info.dat is constructed for a UNIX machine. In this example the initial year, to, is 1969. The program infers this from preg.dat. 1969 is also the first year for which catch data exists so the program uses the 1969 catch as the catch for all years prior to 1969 that is required by the PDM. The plus age class (A) is 5, remember pups have age 0, and the maximum age class (A) is 19. Survey data exists for 4 years (1973-1976); the standard errors were arbitrarily chosen as 1's - this has no influence on the estimates because an exact solution exists for all years.
Data
catch.dat
1969 90 30 20 10 10 10 10 9 7 5 3 1 1 0 1 0 0 1 0 1 1970 90 30 20 10 10 10 10 9 7 5 3 1 1 0 1 0 0 1 0 1 1971 90 30 20 10 10 10 10 9 7 5 3 1 1 0 1 0 0 1 0 1 1972 90 30 20 10 10 10 10 9 7 5 3 1 1 0 1 0 0 1 0 1 1973 90 30 20 10 10 10 10 9 7 5 3 1 1 0 1 0 0 1 0 1 1974 90 30 20 10 10 10 10 9 7 5 3 1 1 0 1 0 0 1 0 1 1975 90 30 20 10 10 10 10 9 7 5 3 1 1 0 1 0 0 1 0 1 1976 90 30 20 10 10 10 10 9 7 5 3 1 1 0 1 0 0 1 0 1 1977 90 30 20 10 10 10 10 9 7 5 3 1 1 0 1 0 0 1 0 1 1978 90 30 20 10 10 10 10 9 7 5 3 1 1 0 1 0 0 1 0 1 1979 90 30 20 10 10 10 10 9 7 5 3 1 1 0 1 0 0 1 0 1 1980 90 30 20 10 10 10 10 9 7 5 3 1 1 0 1 0 0 1 0 1
19

preg.dat
1969 0.0 0.0 0.0 0.0 0.4 0.8 1970 0.0 0.0 0.0 0.0 0.4 0.8 1971 0.0 0.0 0.0 0.0 0.4 0.8 1972 0.0 0.0 0.0 0.0 0.4 0.8 1973 0.0 0.0 0.0 0.0 0.4 0.8 1974 0.0 0.0 0.0 0.0 0.4 0.8 1975 0.0 0.0 0.0 0.0 0.4 0.8 1976 0.0 0.0 0.0 0.0 0.4 0.8 1977 0.0 0.0 0.0 0.0 0.4 0.8 1978 0.0 0.0 0.0 0.0 0.4 0.8 1979 0.0 0.0 0.0 0.0 0.4 0.8 . 1980 0.0 0.0 0.0 0.0 0.4 0.8
info.dat
'/home/cadigan/shelton/seal/models/randb/newmodel/techm' 19 5
survey.dat
1973 445.45270 1 1974 445.08454 1 1975 447.07098 1 1976 450.96723 1
20

List File for Example 1
The SAS System 1 11:38 Thursday, November 26, 1992
Non-Linear Least Squares Grid Search Dependent Variable N M S Weighted SS
0.100000 5.000000 4.4867293E-ll 0.160000 8.000000 7708.123699 0.180000 9.000000 7842.628919 0.120000 6.000000 10118.478139 0.140000 7.000000 12607.949610 0.200000 11.000000 15970.630796 0.060000 4.000000 17100.380965 0.220000 12.000000 20203.693349 0.200000 10.000000 20559 .705815 0.220000 13.000000 22970.260413
Non-Linear Least Squares Iterative Phase Dependent Variable N Method: Newton
Iter M S Weighted SS o 0.100000 5.000000 4 .4867293E-ll 1 0.100000 5.000000 1 .4762294E-ll 2 0 .100000 5 .000000 1.4762292E-ll
NOTE : Convergence criterion met .
21
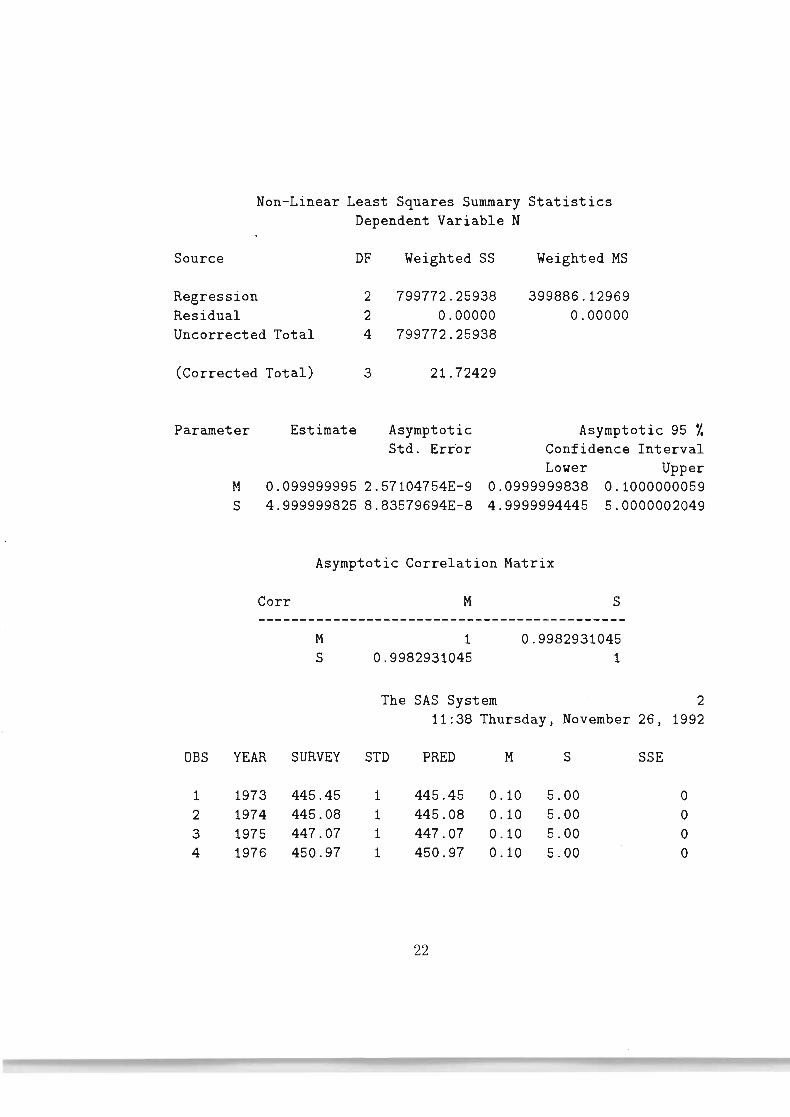
Non-Linear Least Squares Summary Statistics Dependent Variable N
Source DF Weighted SS Weighted MS
Regression 2 799772 .25938 399886.12969 Residual 2 0.00000 0.00000 Uncorrected Total 4 799772.25938
(Corrected Total) 3 21. 72429
Parameter Estimate Asymptotic Asymptotic 95 'l. Std. Err~r Confidence Interval
Lower Upper M 0.0999999952.57104754E-9 0.0999999838 0.1000000059 S 4 .9999998258 .83579694E-8 4 .9999994445 5.0000002049
Asymptotic Correlation Matrix
Corr M S
M 1 0.9982931045 S 0.9982931045 1
The SAS System 2 11 :38 Thursday , November 26, 1992
DBS YEAR SURVEY STD PRED M S SSE
1 1973 445.45 1 445.45 0 .10 5 .00 0 2 1974 445.08 1 445.08 0.10 5.00 0 3 1975 447.07 1 447.07 0 .10 5.00 0 4 1976 450 .97 1 450.97 0.10 5 .00 0
22

The SAS System 3 11:38 Thursday, November 26, 1992
YEAR PUP #8 TOTAL PDP #S
1969 416.78345 2355.2326 1970 426.34428 2358.6399
• 1971 434.99527 2370.374 1972 442.82301 2388.8191 1973 445.4527 2408.1387 1974 445.08454 2425.2516 1975 447 .07098 2442.7224 1976 450.96723 2462.427 1977 455 .7948 2485.0839 1978 460 .4326 2510.2226 1979 464 .85072 2537.3871 1980 469 .6117 2566.7275
The following ascii output files are produced for Example 1. These file are made available for plotting etc.
pup.dat
1969 416.78345 1970 426.34428 1971 434.99527 1972 442.82301 1973 445.45270 1974 445.08454 1975 447.07098 1976 450.96723 1977 455.79480 1978 460.43260 1979 464.85072 1980469.61170
•
23

pop.dat
1969 2355.2326 1970 2358.6399 1971 2370.3740 1972 2388.8191 1973 2408.1387 1974 2425.2516 1975 2442.7224 1976 2462.4270 1977 2485.0839 1978 2510.2226 1979 2537.3871 1980 2566.7275
•
24

APPENDIX 4 - EXAMPLE 2
The following example is based on data for the Northwest Atlantic harp seal (Phoca groenlandica). Unpublished catch and pregnancy rate data have been made available by Dr . G. Stenson of the Department of Fisheries and Oceans, Northwest Atlantic Fisheries Centre, St. John 's, Newfoundland, Canada. Catch-at-age data for the period prior to 1980 appear in Bowen (1980) and for
• the period 1965-1990 in Shelton et al (1992). Note that the number of columns in the catch file is too large to fit on one line so the columns are broken over three lines. In the ascii file the data for a year should be on a single line with no carriage returns. Info.dat is constructed for a VAX/VMS machine. In this example the initial year, to, is 1965. Again the program infers this from preg.dat. The plus age class (A) is 7 and the maximum age class (A) is 25. 1952 is the first year for which catch data exists so the program uses the 1952 catch as the catch for all years prior to 1952 (1939-1951) that is required by the PDM. Survey data exists for 6 years - standard errors are important because an exact fit to all data is not produced.
Data
catch.dat
1952 207800 7939 12105 8279 6321 7143 12212 8400 8177 5910 6770 6457 1743 1638 2411 4205 1544 2349 1892 988 5363 992 74 487 1336 1873 1953 207712 23415 7530 6418 4396 3960 3235 2855 2915 2766 2358 3539 1617 1211 972 1901 1899 1380 880 656 2789 1627 915 642 467 374 1954 186253 35151 14146 5539 6033 3529 4080 3440 3377 2125 3121 2211 2619 2479 1300 1736 2245 1019 340 1124 626 323 309 707 152 1102 1955 261471 23964 9134 6327 4948 4070 3956 3377 3510 3020 3292 3503 2206 1707 1378 2357 2278 1491 910 932 2570 1317 808 669 589 857 1956 347879 13991 5305 3777 3024 2393 2303 2020 2027 1736 1928 2246 1284 1057 855 1407 1307
864 497 518 1420 753 475 357 323 524
•
25

1957 173121 23875 8853 6680 5888 4793 4679 3658 3737 3109 3468 3620 2276 1871 1391 2377 2180 1471 804 838 2475 1306 796 671 582 1033 1958 150916 27050 10962 11685 11365 9828 6378 6086 4999 4887 9733 6376 6958 4001 3104 8904 5905 2998 545 1530 5377 2921 2430 994 1940 3420 1959 244112 23615 9549 7664 5052 4176 4223 3439 3256 2781 3198 3167 2124 1670 1273 2339 2209 1429 769 803 2467 1321 801 634 544 813 1960 165659 35044 13243 9350 7714 5882 5860 4887 4801 4191 4693 4763 3133 2522 1801 3486 3220 2082 1101 1175 3640 1946 1163 951 806 1250 1961 175893 7092 · 2641 2370 2632 1622 1137 1252
971 789 1127 1224 323 355 433 435 381 294 218 201 243 44 179 85 40 195
1962 212095 31029 34823 10145 8941 6208 3092 2461 2565 2554 1233 1762 1959 958 1418 1856 734 1747 757 651 1338 223 617 98 195 714 1963 276283 10361 8751 7326 4274 3489 3869 3873 3590 3277 3769 4191 2615 2855 2802 2103 2635 1807 1179 961 930 850 606 463 397 589 1964 271745 6500 5836 6067 7317 4912 6995 3765 3075 2742 4172 2770 2174 1710 1639 2658 2092 2520 3892 2035 88 1979 989 983 1471 2477 1965 188184 12952 6501 5317 5139 6248 5921 2471
984 867 1435 1131 1612 193 1208 1046 622 336 658 699 287 455 259 33 18 728
1966 255874 14385 11278 5189 4849 5206 5133 4934 3384 1783 1987 2793 1745 1505 1745 1484 1382 1021 1613 996 1088 787 317 638 402 1050 1967 280257 14683 6826 2992 2452 2931 3784 3232 2438 1553 1465 2108 1334 1002 1438 1541 1064 1307 1362 1405 906 585 462 504 283 943 1968 160595 7530 4865 3590 2371 2225 1766 2576 2566 1818 1874 1898 1025 1001 1201 1092 980
818 1151 982 738 464 567 316 245 567 1969 237103 21346 3905 3422 2722 3099 2200 2241 2980 2397 2117 2107 1181 1286 1300 1419 944 1402 911 1055 958 605 394 475 243 829
26

1970 221075 9399 7603 2865 2345 2204 1352 1394 1309 1074 1566 1392 994 716 630 721 810
399 453 444 383 305 231 172 111 203 1971 212854 8281 3098 2068 1328 1011 745 608 485 648 648 897 521 315 268 281 218 184 225 172 231 152 131 90 51 305
1972 120263 4862 2798 1745 1475 746 657 664 417 364 402 814 457 329 313 352 276 190 165 103 151 63 176 16 18 44
1973 103435 7060 4875 3264 2575 3583 1845 1129 1460 782 819 1306 574 570 400 481 452
285 179 222 225 103 85 71 54 271 1974 119413 13192 7783 3370 2556 2407 2771 1358 1051 1002 755 881 680 700 524 421 382
316 307 193 116 85 94 79 130 432 1975 144449 14183 6247 3276 1886 1371 1282 1104
674 580 925 558 456 375 265 389 301 259 161 218 158 114 92 94 96 87
1976 136974 15565 7691 4166 2563 743 395 410 419 182 159 400 232 124 172 144 118
79 75 49 78 34 47 48 33 35 1977 134893 9222 6831 6580 5066 3075 1702 1081
681 407 507 537 291 233 448 463 271 120 81 83 84 45 36 41 38 98
1978 121058 18409 11010 5958 3938 2532 1846 663 823 290 815 224 243 279 122 286 107 143 182 98 152 123 118 47 41 93
1979 139200 16161 7580 4345 2691 2009 1459 1058 729 515 796 268 260 179 294 391 208 195 72 84 200 120 110 44 47 625
1980 136182 18205 9770 6269 4249 3305 2243 1690 1117 756 1053 595 634 433 534 586 357
342 153 222 248 109 85 79 81 104 1981 184593 9164 5038 3830 2409 1887 1748 1027 845 482 1071 505 332 231 239 311 267 335 234 211 159 211 198 92 68 200
27

1982 153096 14996 7195 3444 1727 1307 715 733 425 351 886 244 172 135 138 278 124 174 89 154 194 102 68 90 55 152
1983 58544 7608 4576 2714 1416 1150 943 679 535 350 1050 220 230 127 174 306 '146 146 146 123 165 85 53 80 72 121
1984 31850 5906 5315 2806 1729 921 722 582 420 336 955 203 198 112 118 213 98 112 86 95 139 61 80 45 51 62
1985 21690 6725 4913 2517 1222 747 591 536 388 281 935 149 155 113 187 295 132 105 115 121 146 61 50 63 50 74
1986 28240 4747 3366 2412 1210 662 562 419 328 263 759 178 184 110 139 215 106 111 99 99 149 86 62 60 66 115
1987 40951 5686 4139 3369 2234 1171 1012 806 591 536 985 369 254 215 220 353 215 226 154 150 259 138 72 132 138 594
1988 75108 11191 9867 5613 3553 1970 1716 819 790 546 968 236 288 357 286 419 357 281 340 433 - 477 148 93 131 270 670
1989 62037 7228 5394 3501 2220 1547 1095 495 366 298 967 235 241 180 139 285 180 134 222 112 213 119 252 130 136 229
1990 41346 9374 6217 5265 4181 3548 1876 1074 446 656 1159 772 641 650 318 615 232 383 285 83 475 61 188 252 50 956
•
28

i )
preg.dat
1965 0.000 0.000 0.000 0.000 0.033 0.114 0.541 0.837 1966 0.000 0.000 0.000 0.000 0.000 0.111 0.353 0.850 1967 0.000 0.000 0.000 0.000 0.000 0.211 0.606 0.901 1968 0.000 0.000 0.000 0.000 0.000 0.316 0.700 0.881 1969 0.000 0.000 0.000 0.000 0.004 0.160 00438 0.880 1970 0.000 0.000 0.000 0.000 0.000 0.231 0.506 0.863 1971 0.000 0.000 0.000 0.000 0.000 0.269 0.573 0.858 1972 0.000 0.000 0.000 0.000 0.000 0.311 0.638 0.853 1973 0.000 0.000 0.000 0.000 0.000 0.356 0.698 0.848 1974 0.000 0.000 0.000 0.000 0.002 00404 0.752 0.843 1975 0.000 0.000 0.000 0.000 0.003 00454 0.799 0.837 1976 0.000 0.000 0.000 0.000 0.006 0.505 0.839 0.832 1977 0.000 0.000 0.000 0.000 0.013 0.555 0.873 0.826 1978 0.000 0.000 0.000 0.000 0.025 0.605 0.900 0.820 1979 0.000 0.000 0.000 0.000 0.071 0.661 0.896 0.827 1980 0.000 0.000 0.000 0.000 0.184 0.712 0.893 0.833 1981 0.000 0.000 0.000 0.001 00400 0.759 0.889 0.737 1982 0.000 0.000 0.000 0.003 0.200 0.800 1.000 0.923 1983 0.000 0.000 0.000 0.008 0.166 0.620 1.000 0.904 1984 0.000 0.000 0.000 0.019 0.137 00400 1.000 0.880 1985 0.000 0.000 0.000 0.044 0.112 0.536 1.000 0.852 1986 0.000 0.000 0.000 0.100 0.091 0.667 1.000 0.818 1987 0.000 0.000 0.000 0.167 0.375 0.551 1.000 0.787 1988 0.000 0.000 0.000 0.000 0.000 00429 1.000 0.955 1989 0.000 0.000 0.000 0.000 0.000 0.534 1.000 0.714 1990 0.000 0.000 0.000 0.077 0.250 0.636 0.667 0.878
info.dat
' [cadigan.shelton]' 25 7
29

survey.dat
1977 318000 48000 1978 497000 34000 1979 478000 35000 1980 475000 47000 1983 534000 33000 1990 577900 38800
List File for Example 2
The SAS System 1 15:16 Thursday, November 26, 1992
Non-Linear Least Squares Grid Search Dependent Variable N M S Weighted SS
0.120000 3.000000 31.316913 0.180000 6.000000 58.351430 0.200000 8.000000 95.855267 0.160000 5.000000 116.772752 0.200000 7.000000 137.871088 0.220000 10.000000 138.530395 0.220000 11.000000 143.219833 0.160000 4.000000 173.136062 0.240000 14.000000 174 .866874 0.240000 15.000000 186.987171
Non-Linear Least Squares Iterative Phase Dependent Variable N Method: Newton
Iter M S Weighted SS o 0.120000 3.000000 31.316913 1 0.122259 3.000000 10.438637 2 0.129866 3.223491 9.848276 3 0.128051 3.168963 9.673490 4 0 .127466 3 .150434 9.666161 5 0.127448 3 .149961 9.666136 6 0.127448 3 .149958 9.666136
NOTE: Convergence criterion met.
30

--------------------------------------------
Non-Linear Least Squares Summary Statistics Dependent Variable N
Source DF Weighted SS Weighted MS
Regression 2 1020.2489250 510.1244625 Residual 4 9.6661363 2.4165341 Uncorrected Total 6 1029.9150612•
(Corrected Total) 5 19.9675590
Parameter Estimate Asymptotic Asymptotic 95 'l. Std . Error Confidence Interval
Lower Upper M 0.127448125 0.01125965083 0.0961867452 0.1587095041 S 3.149958419 0.36210653207 2.1446031139 4.1553137246
Asymptotic Correlation Matrix
Corr M S
M 1 0.9963459775 S 0.9963459775 1
The SAS System 2 15:16 Thursday, November 26, 1992
OBS YEAR SURVEY STD PRED M S SSE
1 1977 318000 48000 447435.34 0.13 3.15 9.67 2 1978 497000 34000 459317.34 0.13 3.15 9.67 3 1979 478000 35000 470075.55 0.13 3.15 9.67 4 1980 475000 47000 477890.63 0.13 3.15 9.67 5 1983 534000 33000 502988.66 0.13 3.15 9.67 6 1990 577900 38800 596432.35 0.13 3.15 9.67
"
31

3 The SAS System 15:16 Thursday, November 26, 1992
YEAR PUP #S
1965 438603.83 1966 429795 .99 1967 468118.18 1968 499283.05 1969 481661. 5 1970 507100 .15 1971 499959.75 1972 468589.32 1973 453099.57 1974 443923.09 1975 436397.04 1976 436078 .68 1977 447435 .34 1978 459317 .34 1979 470075.55 1980 477890.63 1981 448929.82 1982 521463.82 1983 502988 .66 1984 481105.57 1985 485312.55 1986 486356.2 1987 518806.59 1988 534798.38 1989 471472.73 1990 596432.35
32
TOTAL POP #S
3081778.3 2912646
2720197.7 2576042.2 2557275.9 2478166.1 2437496.8 2393156.4 2430539.6 2455919.7 2447380.5 2422091.2 2419314.7 2426895.7 2447437.1 2463915.5 2440302.8 2467386.4 2499628.7 2604914.9 2728591.2 2848695.9 2984640.4 3101335.9 3091991.6 3235908.4

Output files for Example 2
•
•
pup.dat
1965 438603.83 1966 429795.99 1967 468118.18 1968 499283.05 1969 481661.50 1970 507100.15 1971 499959.75 1972 468589.32 1973 453099.57 1974 443923.09 1975 436397.04 1976 436078.68 1977 447435.34 1978 459317.34 1979 470075.55 1980 477890.63 1981 448929.82 1982 521463.82 1983 502988.66 1984 481105.57 1985 485312.55 1986 486356.20 1987 518806.59 1988 534798.38 1989471472.73 1990 596432.35
33
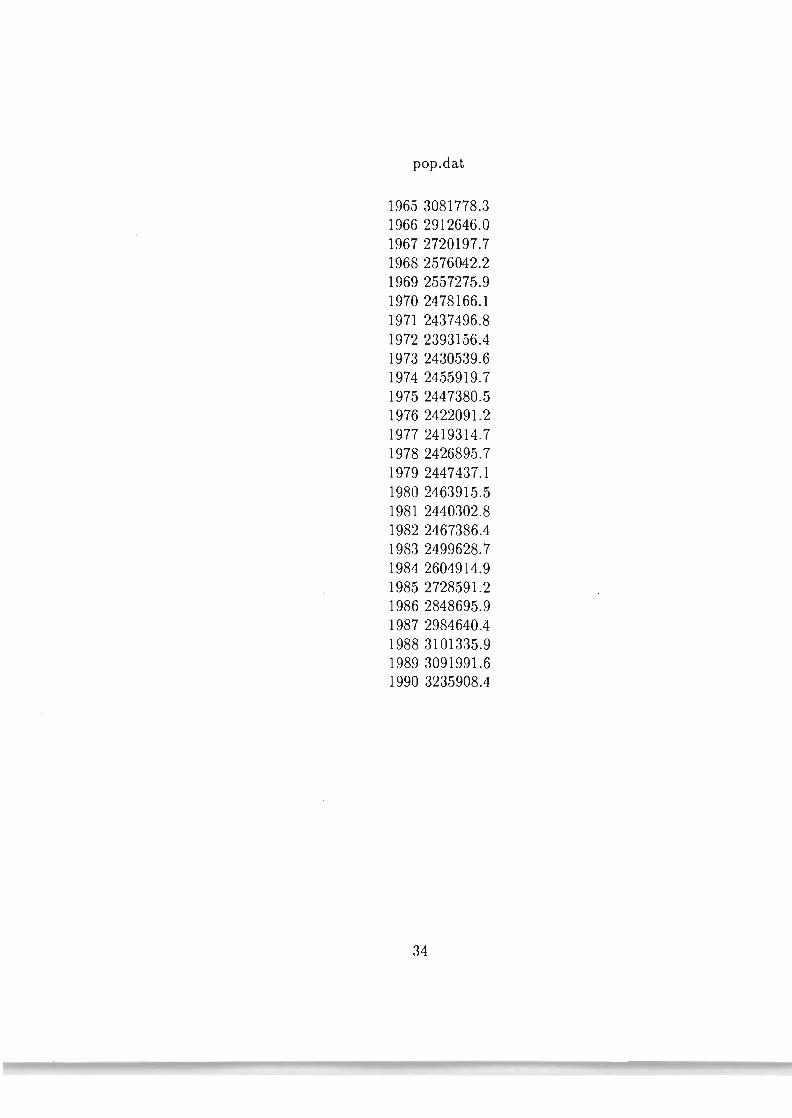
pop.dat
1965 3081778.3 1966 2912646.0 1967 2720197.7 1968 2576042.2 1969 2557275.9 1970 2478166.1 1971 2437496.8 1972 2393156.4 1973 2430539.6 19742455919.7 1975 2447380.5 1976 2422091.2 1977 2419314.7 1978 2426895.7 1979 2447437.1 1980 2463915.5 1981 2440302.8 1982 2467386.4 1983 2499628.7 1984 2604914.9 1985 2728591.2 1986 2848695.9 1987 2984640.4 19883101335.9 1989 3091991.6 1990 3235908.4
34