![Untitled-2 [] · FS 78 FS 68 , FOCUS ÉkJ ËFOCUS FS 78 FS 68 FS 68 , , , FS 68 Foundation FS 68 , FS 68 68 fi , FOCUS F-s 688 , , 68 , 688 FOCUS FS , FS 68 , , , 688 ,](https://static.fdocuments.in/doc/165x107/5b75f9b67f8b9a3b7e8b5e04/untitled-2-fs-78-fs-68-focus-ekj-efocus-fs-78-fs-68-fs-68-fs-68.jpg)
FS Q1 2019s1.q4cdn.com/789791377/files/doc_financials/2019/q1/FS-Q... · 2019-05-01 · Title: FS...
19
Condensed Interim Consolidated Financial Statements For the Three Months Ended March 31, 2019 and March 31, 2018
Transcript of FS Q1 2019s1.q4cdn.com/789791377/files/doc_financials/2019/q1/FS-Q... · 2019-05-01 · Title: FS...

Condensed Interim Consolidated Financial Statements
For the Three Months Ended March 31, 2019 and March 31, 2018

TABLE OF CONTENTS
FINANCIAL STATEMENTS
CONDENSED INTERIM CONSOLIDATED STATEMENTS OF OPERATIONS AND COMPREHENSIVE (LOSS)/INCOMECONDENSED INTERIM CONSOLIDATED BALANCE SHEETSCONDENSED INTERIM CONSOLIDATED STATEMENTS OF CASH FLOWSCONDENSED INTERIM CONSOLIDATED STATEMENTS OF CHANGES IN SHAREHOLDERS' EQUITY
NOTES TO THE FINANCIAL STATEMENTS
1. NATURE OF OPERATIONS2. BASIS OF PRESENTATION3. CHANGES IN ACCOUNTING POLICIES4. FINANCIAL INSTRUMENTS5. INVENTORIES6. MINING INTERESTS
7. ACCOUNTS PAYABLE AND ACCRUED LIABILITIES8. REHABILITATION PROVISIONS9. DEFERRED REVENUE10. DEBT11. COMMITMENTS AND CONTINGENCIES12. REVENUE13. COST OF SALES EXCLUDING DEPRECIATION AND AMORTIZATION
14. SHARE-BASED COMPENSATION15. FINANCE EXPENSE, NET16. INCOME TAXES17. (LOSS)/INCOME PER COMMON SHARE18. RELATED PARTY TRANSACTIONS19. SEGMENTED INFORMATION20. SUPPLEMENTAL CASH FLOW INFORMATION
3
456
77789101011111213131414161617171819

3
GOLDEN STAR RESOURCES LTD.CONDENSED INTERIM CONSOLIDATED STATEMENTS OF OPERATIONS
AND COMPREHENSIVE (LOSS)/INCOME (Stated in thousands of U.S. dollars except shares and per share data)
(unaudited)
NotesThree Months Ended
March 31, 2019 2018
Revenue 12 $ 67,257 $ 70,819Cost of sales excluding depreciation and amortization 13 43,804 59,574Depreciation and amortization 6,862 8,221
Mine operating margin 16,591 3,024
Other expenses/(income)Exploration expense 844 706General and administrative 4,105 1,109Finance expense, net 15 3,547 4,783Other income (321) (628)Loss/(gain) on fair value of financial instruments, net 4 3,873 (5,442)
Income before tax 4,543 2,496Income tax expense 16 7,202 2,891
Net loss and comprehensive loss $ (2,659) $ (395)Net loss attributable to non-controlling interest (735) (1,410)Net (loss)/income attributable to Golden Star shareholders $ (1,924) $ 1,015
Net (loss)/income per share attributable to Golden Star shareholdersBasic 17 $ (0.02) $ 0.01Diluted 17 $ (0.02) $ (0.03)Weighted average shares outstanding-basic (millions) 108.8 76.2Weighted average shares outstanding-diluted (millions) 108.8 87.6
The accompanying notes are an integral part of the condensed interim consolidated financial statements.

4
GOLDEN STAR RESOURCES LTD.
CONDENSED INTERIM CONSOLIDATED BALANCE SHEETS (Stated in thousands of U.S. dollars)
(unaudited)
As of As of
NotesMarch 31,
2019December 31,
2018
ASSETSCURRENT ASSETS
Cash and cash equivalents $ 81,868 $ 96,507Accounts receivable 5,257 3,213Inventories 5 37,808 35,196Prepaids and other 5,404 5,291
Total Current Assets 130,337 140,207RESTRICTED CASH 6,545 6,545MINING INTERESTS 6 277,198 270,640DEFERRED TAX ASSETS — 595
Total Assets $ 414,080 $ 417,987
LIABILITIESCURRENT LIABILITIES
Accounts payable and accrued liabilities 7 $ 71,719 $ 78,484Current portion of rehabilitation provisions 8 8,885 7,665Current portion of deferred revenue 9 14,506 14,316Current portion of long term debt 10 27,858 27,482Other liability 14 6,410 6,410
Total Current Liabilities 129,378 134,357REHABILITATION PROVISIONS 8 56,262 58,560DEFERRED REVENUE 9 103,048 105,632LONG TERM DEBT 10 71,347 73,224DERIVATIVE LIABILITY 4 8,050 4,177DEFERRED TAX LIABILITY 16 5,681 —
Total Liabilities 373,766 375,950
SHAREHOLDERS' EQUITYSHARE CAPITAL
First preferred shares, without par value, unlimited shares authorized. No shares issuedand outstanding — —Common shares, without par value, unlimited shares authorized 908,065 908,035
CONTRIBUTED SURPLUS 38,226 37,258DEFICIT (833,269) (831,283)
Shareholders' equity attributable to Golden Star shareholders 113,022 114,010NON-CONTROLLING INTEREST (72,708) (71,973)
Total Equity 40,314 42,037Total Liabilities and Shareholders' Equity $ 414,080 $ 417,987
The accompanying notes are an integral part of the condensed interim consolidated financial statements.
Signed on behalf of the Board,
"Timothy C. Baker" "Robert E. Doyle"Timothy C. Baker, Director Robert E. Doyle, Director
5
GOLDEN STAR RESOURCES LTD.
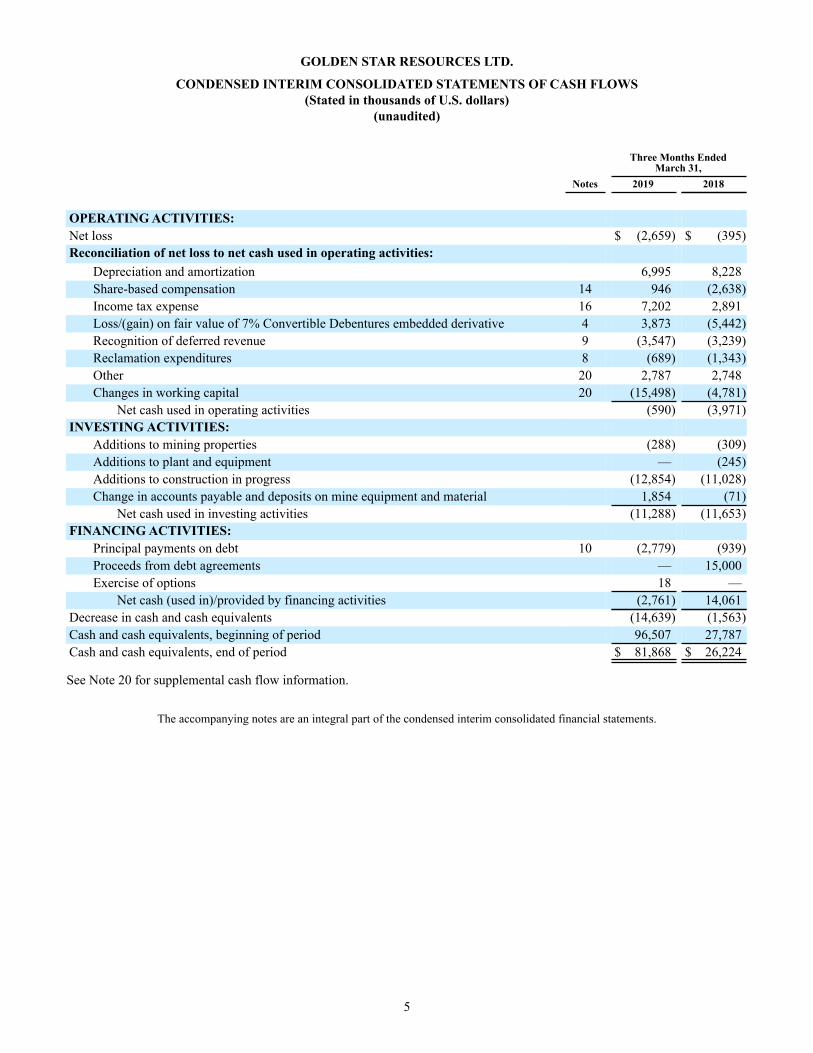
CONDENSED INTERIM CONSOLIDATED STATEMENTS OF CASH FLOWS (Stated in thousands of U.S. dollars)
(unaudited)
Three Months EndedMarch 31,
Notes 2019 2018
OPERATING ACTIVITIES:Net loss $ (2,659) $ (395)Reconciliation of net loss to net cash used in operating activities:
Depreciation and amortization 6,995 8,228Share-based compensation 14 946 (2,638)Income tax expense 16 7,202 2,891Loss/(gain) on fair value of 7% Convertible Debentures embedded derivative 4 3,873 (5,442)Recognition of deferred revenue 9 (3,547) (3,239)Reclamation expenditures 8 (689) (1,343)Other 20 2,787 2,748Changes in working capital 20 (15,498) (4,781)
Net cash used in operating activities (590) (3,971)INVESTING ACTIVITIES:
Additions to mining properties (288) (309)Additions to plant and equipment — (245)Additions to construction in progress (12,854) (11,028)Change in accounts payable and deposits on mine equipment and material 1,854 (71)
Net cash used in investing activities (11,288) (11,653)FINANCING ACTIVITIES:
Principal payments on debt 10 (2,779) (939)Proceeds from debt agreements — 15,000Exercise of options 18 —
Net cash (used in)/provided by financing activities (2,761) 14,061Decrease in cash and cash equivalents (14,639) (1,563)Cash and cash equivalents, beginning of period 96,507 27,787Cash and cash equivalents, end of period $ 81,868 $ 26,224
See Note 20 for supplemental cash flow information.
The accompanying notes are an integral part of the condensed interim consolidated financial statements.
6
GOLDEN STAR RESOURCES LTD.
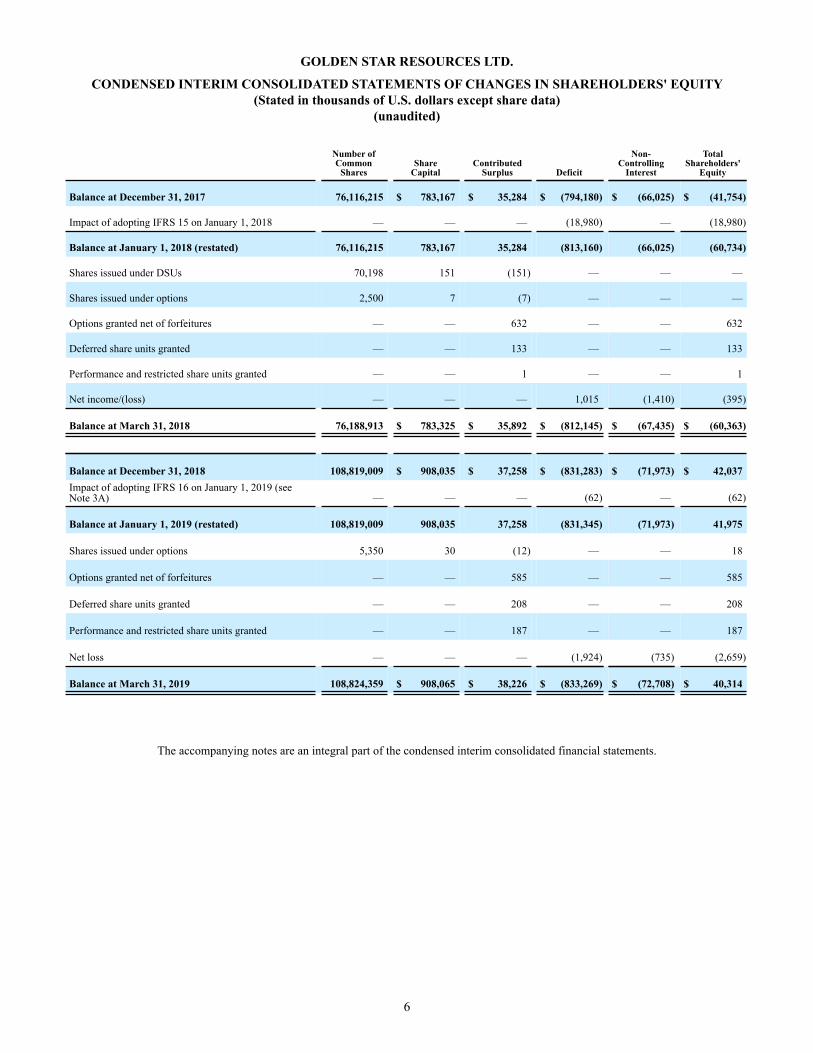
CONDENSED INTERIM CONSOLIDATED STATEMENTS OF CHANGES IN SHAREHOLDERS' EQUITY (Stated in thousands of U.S. dollars except share data)
(unaudited)
Number ofCommon
SharesShare
Capital Contributed
Surplus Deficit
Non-Controlling
Interest
TotalShareholders'
Equity
Balance at December 31, 2017 76,116,215 $ 783,167 $ 35,284 $ (794,180) $ (66,025) $ (41,754)
Impact of adopting IFRS 15 on January 1, 2018 — — — (18,980) — (18,980)
Balance at January 1, 2018 (restated) 76,116,215 783,167 35,284 (813,160) (66,025) (60,734)
Shares issued under DSUs 70,198 151 (151) — — —
Shares issued under options 2,500 7 (7) — — —
Options granted net of forfeitures — — 632 — — 632
Deferred share units granted — — 133 — — 133
Performance and restricted share units granted — — 1 — — 1
Net income/(loss) — — — 1,015 (1,410) (395)
Balance at March 31, 2018 76,188,913 $ 783,325 $ 35,892 $ (812,145) $ (67,435) $ (60,363)
Balance at December 31, 2018 108,819,009 $ 908,035 $ 37,258 $ (831,283) $ (71,973) $ 42,037Impact of adopting IFRS 16 on January 1, 2019 (seeNote 3A) — — — (62) — (62)
Balance at January 1, 2019 (restated) 108,819,009 908,035 37,258 (831,345) (71,973) 41,975
Shares issued under options 5,350 30 (12) — — 18
Options granted net of forfeitures — — 585 — — 585
Deferred share units granted — — 208 — — 208
Performance and restricted share units granted — — 187 — — 187
Net loss — — — (1,924) (735) (2,659)
Balance at March 31, 2019 108,824,359 $ 908,065 $ 38,226 $ (833,269) $ (72,708) $ 40,314
The accompanying notes are an integral part of the condensed interim consolidated financial statements.
7
GOLDEN STAR RESOURCES LTD.
NOTES TO THE CONDENSED INTERIM CONSOLIDATED FINANCIAL STATEMENTSFOR THE THREE MONTHS ENDED MARCH 31, 2019 AND 2018
(All currency amounts in tables are in thousands of U.S. dollars unless noted otherwise)(unaudited)
1. NATURE OF OPERATIONS Golden Star Resources Ltd. ("Golden Star" or "the Company" or "we" or "our") is a Canadian federally-incorporated, international gold mining and exploration company headquartered in Toronto, Canada. The Company's shares are listed on the Toronto Stock Exchange (the "TSX") under the symbol GSC, the NYSE American (formerly NYSE MKT) under the symbol GSS and the Ghana Stock Exchange under the symbol GSR. The Company's registered office is located at 150 King Street West, Suite 1200, Toronto, Ontario, M5H 1J9, Canada.
Through our 90% owned subsidiary, Golden Star (Wassa) Limited, we own and operate the Wassa open-pit gold mine, the Wassa underground mine and a carbon-in-leach ("CIL") processing plant (collectively, "Wassa"), located northeast of the town of Tarkwa, Ghana. Through our 90% owned subsidiary Golden Star (Bogoso/Prestea) Limited, we own and operate the Bogoso gold mining and processing operations, the Prestea open-pit mining operations and the Prestea underground mine ("Prestea") located near the town of Prestea, Ghana. We hold and manage interests in several gold exploration projects in Ghana and in Brazil.
2. BASIS OF PRESENTATION Statement of compliance
These unaudited condensed interim consolidated financial statements have been prepared in accordance with International Financial Reporting Standards ("IFRS"), as issued by the International Accounting Standards Board ("IASB") including International Accounting Standards ("IAS") 34 Interim financial reporting. These condensed interim consolidated financial statements should be read in conjunction with the Company's annual consolidated financial statements for the year ended December 31, 2018, which have been prepared in accordance with IFRS as issued by the IASB. The accounting policies and methods of application adopted are consistent with those disclosed in Note 3 of the Company's consolidated financial statements for the year ended December 31, 2018, except for the changes in accounting policies described below.
These condensed interim consolidated financial statements were approved by the Audit Committee of the Company on April 30, 2019.
Basis of presentation
These condensed interim consolidated financial statements include the accounts of the Company and its subsidiaries, whether owned directly or indirectly. The financial statements of the subsidiaries are prepared for the same period as the Company using consistent accounting policies for all periods presented, except for the changes in accounting policies described in Note 3 below. All inter-company balances and transactions have been eliminated. Subsidiaries are entities controlled by the Company. Non-controlling interests in the net assets of consolidated subsidiaries are a separate component of the Company's equity.
These condensed interim consolidated financial statements have been prepared on a going concern basis, which contemplates the realization of assets and discharge of all liabilities in the normal course of business.
The condensed interim consolidated financial statements have been prepared on a historical cost basis, except for derivative financial instruments which are measured at fair value through profit or loss.
3. CHANGES IN ACCOUNTING POLICIES
A) New Accounting Standards Effective 2019
The Company has adopted the following new and revised standards, effective January 1, 2019. These changes were made in accordance with the applicable transitional provisions.
IFRS 16 Leases specifies how an IFRS reporter will recognize, measure, present and disclose leases. The standard provides a single lessee accounting model, requiring lessees to recognize assets and liabilities for all leases unless the lease term is 12 months or less or the underlying asset has a low value. Lessors continue to classify leases as operating or finance, with IFRS 16's approach to lessor accounting substantially unchanged from its predecessor, IAS 17. IFRS 16 was issued in January 2016 and applies to annual reporting periods beginning on or after January 1, 2019.

8
On January 1, 2019, the Company adopted the requirements of IFRS 16 Leases. As a result, the Company updated its accounting policy for leases to align with the requirements of IFRS 16. The Company elected to use the modified retrospective approach to initially adopt IFRS 16 which resulted in recognizing the cumulative effect of prior period amounts as an adjustment to the opening balance sheet through opening deficit on January 1, 2019.
Under IFRS 16, the Company recognized lease liabilities in relation to leases which had previously been classified as ‘operating leases’ under the principles of IAS 17 Leases. These liabilities were measured at the present value of the remaining lease payments, discounted using the lessee’s incremental borrowing rate as of January 1, 2019. The weighted average lessee’s incremental borrowing rate applied to the lease liabilities on January 1, 2019 was 7.5%.
The associated right-of-use assets for property leases were measured on a retrospective basis as if the new rules had always been applied. The change in accounting policy affected the following items in the balance sheet on January 1, 2019:
• Mining interests (plant and equipment) - increase of $0.7 million
• Long term debt (finance leases) - increase of $0.5 million
The net impact on retained earnings on January 1, 2019 was a decrease of $0.1 million
IFRIC 23 Uncertainty over income tax treatments clarifies how the recognition and measurement requirements of IAS 12, Income Taxes, are applied where there is uncertainty over income tax treatments effective for years beginning on or after January 1, 2019. There was no accounting impact to the financial statements on adoption of this standard.
4. FINANCIAL INSTRUMENTS The following tables illustrate the classification of the Company's recurring fair value measurements for financial instruments within the fair value hierarchy and their carrying values and fair values as at March 31, 2019 and December 31, 2018:
March 31, 2019 December 31, 2018
LevelCarrying
value Fair valueCarrying
value Fair value
Financial LiabilitiesFair value through profit or loss
7% Convertible Debentures embedded derivative 3 8,050 8,050 4,177 4,177
There were no non-recurring fair value measurements of financial instruments as at March 31, 2019.
The three levels of the fair value hierarchy are: Level 1 - Unadjusted quoted prices in active markets for identical assets or liabilities; Level 2 - Inputs other than quoted prices that are observable for the asset or liability either directly or indirectly; and Level 3 - Inputs that are not based on observable market data.
The Company's policy is to recognize transfers into and transfers out of the fair value hierarchy levels as of the date of the event or change in circumstances that caused the transfer. During the three months ended March 31, 2019, there were no transfers between the levels of the fair value hierarchy.
Loss/(gain) on fair value of financial instruments in the Statements of Operations and Comprehensive (Loss)/Income consists of the following:
Three Months Ended March31,
2019 2018
Loss/(gain) on fair value of 7% Convertible Debentures embedded derivative 3,873 (5,442)$ 3,873 $ (5,442)

9
The valuation technique that is used to measure fair value is as follows:
7% Convertible Debentures embedded derivative
The debt component of the 7% Convertible Debentures is recorded at amortized cost using the effective interest rate method, and the conversion feature is classified as an embedded derivative measured at fair value through profit or loss.
The embedded derivative was valued at March 31, 2019 and December 31, 2018 using a convertible note valuation model. The significant inputs used in the convertible note valuation are as follows:
March 31, 2019 December 31, 2018
Embedded derivativeRisk premium 6.2% 5.0%Borrowing costs 7.5% 10.0%Expected volatility 45.0% 45.0%Remaining life (years) 2.4 2.6
The following table presents the changes in the 7% Convertible Debentures embedded derivative for the three months ended March 31, 2019:
Fair value
Balance at December 31, 2018 $ 4,177Loss on fair value of 7% Convertible Debentures embedded derivative 3,873Balance at March 31, 2019 $ 8,050
If the risk premium increases by 10%, the fair value of the 7% Convertible Debentures embedded derivative would decrease and the related loss in the Statement of Operations would decrease by $0.2 million at March 31, 2019.
If the borrowing costs increases by 10%, the fair value of the 7% Convertible Debentures embedded derivative would decreaseand the related loss in the Statement of Operations would decrease by $0.3 million at March 31, 2019.
If the expected volatility increases by 10%, the fair value of the 7% Convertible Debentures embedded derivative would increaseand the related loss in the Statement of Operations would increase by $1.0 million at March 31, 2019.
5. INVENTORIES Inventories include the following components:
As of As ofMarch 31,
2019December 31,
2018
Stockpiled ore $ 7,328 $ 6,613In-process ore 3,637 4,188Materials and supplies 26,373 23,659Finished goods 470 736Total $ 37,808 $ 35,196
The cost of inventories expensed for the three months ended March 31, 2019 and 2018 was $43.8 million and $55.7 million, respectively.
Net realizable value adjustments of $0.9 million was recorded for stockpiled ore during the three months ended March 31, 2019(three months ended March 31, 2018 - $1.2 million).

10
6. MINING INTERESTS The following table shows the breakdown of the cost, accumulated depreciation and net book value of plant and equipment, mining properties and construction in progress:
Plant andequipment
Miningproperties
Constructionin progress Total
CostBalance at December 31, 2018 $ 478,760 $ 930,230 $ 28,569 $ 1,437,559
Additions 761 288 12,275 13,324Transfers (1,467) 13,311 (11,844) —Capitalized interest — — 579 579Change in rehabilitation provision estimate — (313) — (313)Disposals and other (467) — — (467)
Balance at March 31, 2019 $ 477,587 $ 943,516 $ 29,579 $ 1,450,682
Accumulated depreciationBalance at December 31, 2018 $ 432,799 $ 734,120 $ — $ 1,166,919
Depreciation and amortization 2,496 4,536 — 7,032Disposals and other (467) — — (467)
Balance at March 31, 2019 $ 434,828 $ 738,656 $ — $ 1,173,484
Carrying amountBalance at December 31, 2018 $ 45,961 $ 196,110 $ 28,569 $ 270,640Balance at March 31, 2019 $ 42,759 $ 204,860 $ 29,579 $ 277,198
As at March 31, 2019, equipment under finance leases had net carrying amounts of $3.2 million (December 31, 2018 - $3.0 million). The total minimum lease payments are disclosed in Note 10 - Debt.
7. ACCOUNTS PAYABLE AND ACCRUED LIABILITIES Accounts payable and accrued liabilities include the following components:
As of As ofMarch 31,
2019December 31,
2018
Trade and other payables $ 41,584 $ 42,947Accrued liabilities 26,524 25,522Payroll related liabilities 3,611 10,015Total $ 71,719 $ 78,484
11
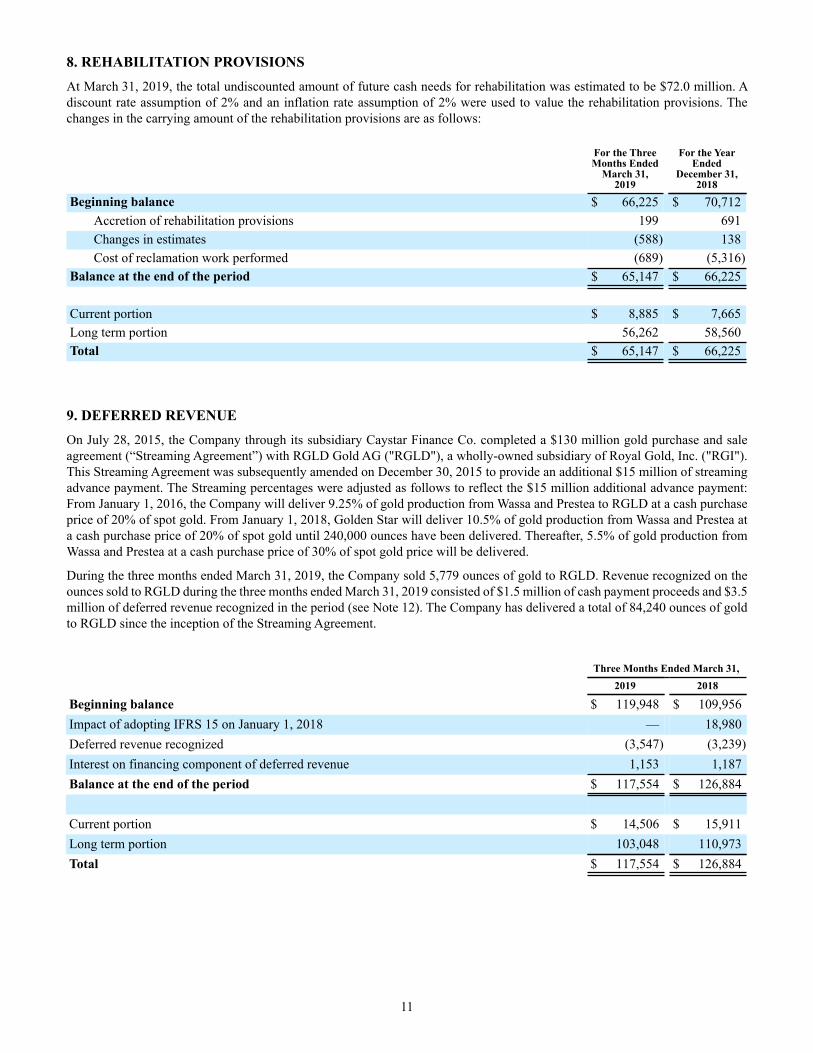
8. REHABILITATION PROVISIONS At March 31, 2019, the total undiscounted amount of future cash needs for rehabilitation was estimated to be $72.0 million. A discount rate assumption of 2% and an inflation rate assumption of 2% were used to value the rehabilitation provisions. The changes in the carrying amount of the rehabilitation provisions are as follows:
For the ThreeMonths Ended
March 31,2019
For the YearEnded
December 31,2018
Beginning balance $ 66,225 $ 70,712Accretion of rehabilitation provisions 199 691Changes in estimates (588) 138Cost of reclamation work performed (689) (5,316)
Balance at the end of the period $ 65,147 $ 66,225
Current portion $ 8,885 $ 7,665Long term portion 56,262 58,560Total $ 65,147 $ 66,225
9. DEFERRED REVENUE On July 28, 2015, the Company through its subsidiary Caystar Finance Co. completed a $130 million gold purchase and sale agreement (“Streaming Agreement”) with RGLD Gold AG ("RGLD"), a wholly-owned subsidiary of Royal Gold, Inc. ("RGI"). This Streaming Agreement was subsequently amended on December 30, 2015 to provide an additional $15 million of streaming advance payment. The Streaming percentages were adjusted as follows to reflect the $15 million additional advance payment: From January 1, 2016, the Company will deliver 9.25% of gold production from Wassa and Prestea to RGLD at a cash purchase price of 20% of spot gold. From January 1, 2018, Golden Star will deliver 10.5% of gold production from Wassa and Prestea at a cash purchase price of 20% of spot gold until 240,000 ounces have been delivered. Thereafter, 5.5% of gold production from Wassa and Prestea at a cash purchase price of 30% of spot gold price will be delivered.
During the three months ended March 31, 2019, the Company sold 5,779 ounces of gold to RGLD. Revenue recognized on the ounces sold to RGLD during the three months ended March 31, 2019 consisted of $1.5 million of cash payment proceeds and $3.5 million of deferred revenue recognized in the period (see Note 12). The Company has delivered a total of 84,240 ounces of gold to RGLD since the inception of the Streaming Agreement.
Three Months Ended March 31,2019 2018
Beginning balance $ 119,948 $ 109,956Impact of adopting IFRS 15 on January 1, 2018 — 18,980Deferred revenue recognized (3,547) (3,239)Interest on financing component of deferred revenue 1,153 1,187Balance at the end of the period $ 117,554 $ 126,884
Current portion $ 14,506 $ 15,911Long term portion 103,048 110,973Total $ 117,554 $ 126,884
12
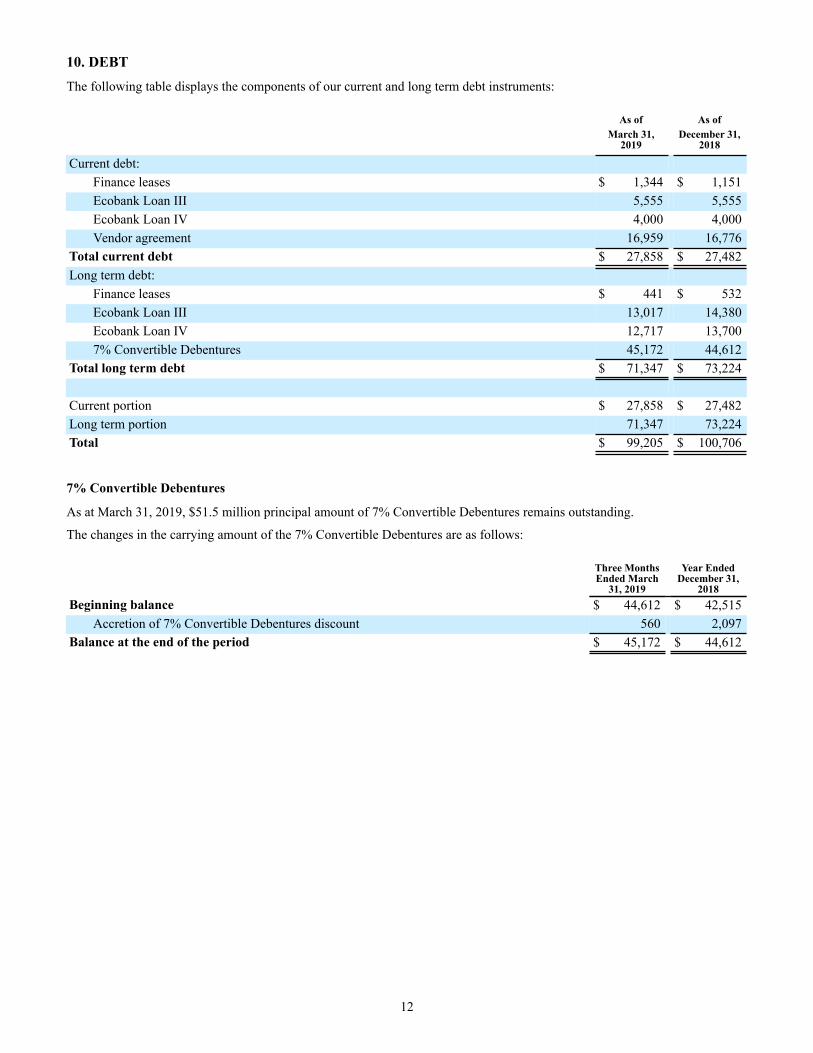
10. DEBT The following table displays the components of our current and long term debt instruments:
As of As ofMarch 31,
2019December 31,
2018
Current debt:Finance leases $ 1,344 $ 1,151Ecobank Loan III 5,555 5,555Ecobank Loan IV 4,000 4,000Vendor agreement 16,959 16,776
Total current debt $ 27,858 $ 27,482Long term debt:
Finance leases $ 441 $ 532Ecobank Loan III 13,017 14,380Ecobank Loan IV 12,717 13,7007% Convertible Debentures 45,172 44,612
Total long term debt $ 71,347 $ 73,224
Current portion $ 27,858 $ 27,482Long term portion 71,347 73,224Total $ 99,205 $ 100,706
7% Convertible Debentures
As at March 31, 2019, $51.5 million principal amount of 7% Convertible Debentures remains outstanding.
The changes in the carrying amount of the 7% Convertible Debentures are as follows:
Three MonthsEnded March
31, 2019
Year EndedDecember 31,
2018Beginning balance $ 44,612 $ 42,515
Accretion of 7% Convertible Debentures discount 560 2,097Balance at the end of the period $ 45,172 $ 44,612

13
Schedule of payments on outstanding debt as of March 31, 2019:
Nine monthsending
December 31,2019
Year endingDecember 31,
2020
Year endingDecember 31,
2021
Year endingDecember 31,
2022
Year endingDecember 31,
2023 Maturity
Finance leasesPrincipal $ 1,087 $ 698 $ — $ — $ — 2020Interest 72 12 — — —
Ecobank Loan IIIPrincipal 4,167 5,555 5,555 3,611 — 2022Interest 1,258 1,189 632 101 —
Ecobank Loan IVPrincipal 3,000 4,000 4,000 4,000 2,000 2023Interest 1,203 1,250 847 448 74
7% Convertible DebenturesPrincipal — — 51,498 — — 2021Interest 1,803 3,605 3,605 — —
Vendor agreementPrincipal 17,510 — — — — 2019Interest 1,946 — — — —
Total principal $ 25,764 $ 10,253 $ 61,053 $ 7,611 $ 2,000Total interest 6,282 6,056 5,084 549 74
$ 32,046 $ 16,309 $ 66,137 $ 8,160 $ 2,074
11. COMMITMENTS AND CONTINGENCIES The Company has capital commitments of $16.9 million, all of which are expected to be incurred within the next year.
Due to the nature of the Company’s operations, various legal matters from time to time arise in the ordinary course of business. The Company accrues for such items when a liability is both probable and the amount can be reasonably estimated. In the opinion of management, these matters will not have a material effect on the condensed interim consolidated financial statements of the Company.
12. REVENUE Revenue includes the following components:
Three Months Ended March31,
2019 2018
Revenue - Streaming AgreementCash payment proceeds $ 1,506 $ 1,803Deferred revenue recognized 3,547 3,239
5,053 5,042Revenue - Spot sales 62,204 65,777Total revenue $ 67,257 $ 70,819

14
13. COST OF SALES EXCLUDING DEPRECIATION AND AMORTIZATION Cost of sales excluding depreciation and amortization include the following components:
Three Months Ended March31,
2019 2018
Mine operating expenses $ 39,896 $ 44,146Severance charges 294 3,394Operating costs (to)/from metal inventory (780) 7,041Inventory net realizable value adjustment and write-off 920 1,163Royalties 3,474 3,830
$ 43,804 $ 59,574
14. SHARE-BASED COMPENSATION Share-based compensation expenses recognized in general and administrative expense in the Statements of Operations and Comprehensive Income/(Loss), are as follows:
Three Months EndedMarch 31,
2019 2018
Share options $ 585 $ 632Deferred share units 208 133Share appreciation rights (34) (555)Performance share units 187 (2,848)
$ 946 $ (2,638)
Share options
The fair value of option grants is estimated at the grant dates using the Black-Scholes option-pricing model. Fair values of options granted during the three months ended March 31, 2019 and 2018 were based on the weighted average assumptions noted in the following table:
Three Months Ended March31,
2019 2018
Expected volatility 50.53% 72.16%Risk-free interest rate 1.80% 2.38%Expected lives 5.8 years 5.7 years
The weighted average fair value per option granted during the three months ended March 31, 2019 was $2.50 CAD (three months ended March 31, 2018 - $2.89 CAD). As at March 31, 2019, there was $1.1 million of share-based compensation expense (March 31, 2018 - $1.2 million) relating to the Company's share options to be recorded in future periods. For the three months ended March 31, 2019, the Company recognized an expense of $0.6 million (three months ended March 31, 2018 - $0.6 million).

15
A summary of option activity under the Company's Stock Option Plan during the three months ended March 31, 2019 and 2018is as follows:
Options('000)
Weighted–AverageExercise
price ($CAD)
Weighted–Average
RemainingContractualTerm (Years)
Outstanding as of December 31, 2018 3,498 5.28 6.3Granted 584 5.17 9.9Exercised (5) 4.60 8.9Forfeited (32) 5.48 8.5Expired (55) 8.50 —
Outstanding as of March 31, 2019 3,990 5.22 6.6
Exercisable as of December 31, 2018 2,664 5.42 5.5Exercisable as of March 31, 2019 3,172 5.25 6.0
As of March 31, 2019, there were 1,420,849 common shares available for grant under the Stock Option Plan (December 31, 2018 - 1,917,767).
Deferred share units ("DSUs")
For the three months ended March 31, 2019 , the DSUs that were granted vested immediately and a compensation expense of $0.2 million was recognized for these grants (three months ended March 31, 2018 - $0.1 million). As of March 31, 2019, there was no unrecognized compensation expense related to DSUs granted under the Company's DSU Plan.
A summary of DSU activity during the three months ended March 31, 2019 and 2018:
Three Months Ended March31,
2019 2018
Number of DSUs, beginning of period ('000) 1,086 1,018Granted 63 32Exercised — (82)
Number of DSUs, end of period ('000) 1,149 968
Share appreciation rights ("SARs")
As of March 31, 2019, there was approximately $0.4 million of total unrecognized compensation cost related to unvested SARs (March 31, 2018 - $0.8 million). For the three months ended March 31, 2019, the Company recognized a recovery of $0.03 millionrelated to these cash settled awards (three months ended March 31, 2018 - $0.6 million recovery).
A summary of the SARs activity during the three months ended March 31, 2019 and 2018:
Three Months Ended March31,
2019 2018
Number of SARs, beginning of period ('000) 674 533Granted 270 304Exercised (114) (14)Forfeited (93) (10)Expired (3) —
Number of SARs, end of period ('000) 734 813
Performance share units ("PSUs")
The final PSU grant vested on December 31, 2018 and, as a result, the Company did not recognize a PSU expense in 2019. For the three months ended March 31, 2018 the Company recognized a recovery of $2.8 million. As at March 31, 2019, the PSU liability of $6.4 million is recognized on the Balance Sheet as other liability.

16
A summary of the PSU activity during the three months ended March 31, 2019 and 2018:
Three Months Ended March31,
2019 2018
Number of PSUs, beginning of period ('000) 1,172 2,720Settled — (1,548)
Number of PSUs, end of period ('000) 1,172 1,172
2017 Performance and restricted share units ("PRSUs")
PRSUs are accounted for as equity awards with a corresponding compensation expense recognized. For the three months ended March 31, 2019, the Company recognized $0.2 million expense (three months ended March 31, 2018 - $nil).
A summary of the PRSU activity during the three months ended March 31, 2019 and 2018:
Three Months Ended March31,
2019 2018
Number of PRSUs, beginning of period ('000) 791 338Granted 432 479
Number of PRSUs, end of period ('000) 1,223 817
15. FINANCE EXPENSE, NET Finance income and expense includes the following components:
Three Months Ended March31,
2019 2018
Interest income $ (534) $ (4)Interest expense, net of capitalized interest (see Note 6) 3,042 2,735Interest on financing component of deferred revenue (see Note 9) 1,153 1,187Net foreign exchange (gain)/loss (313) 651Accretion of rehabilitation provision 199 214
$ 3,547 $ 4,783
On February 1, 2018, Prestea Underground mine achieved commercial production, therefore no capitalized interest was recorded since.
16. INCOME TAXES Income tax expense is recognized based on management's estimate of the weighted average annual income tax rate expected for the full financial year. The provision for income taxes includes the following components:
Three Months Ended March31,
2019 2018
Current expense:Canada $ — $ —Foreign 926 —
Deferred tax expense:Canada — —Foreign 6,276 2,891
Tax expense $ 7,202 $ 2,891
The deferred tax expense results from the expected utilization of tax losses at Wassa.

17
17. (LOSS)/INCOME PER COMMON SHARE The following table provides a reconciliation between basic and diluted (loss)/income per common share:
Three Months Ended March31,
2019 2018
Net (loss)/income attributable to Golden Star shareholders $ (1,924) $ 1,015Adjustments:Interest expense on 7% Convertible Debentures — 889Accretion of 7% Convertible Debentures discount — 492Loss/(gain) on fair value of 7% Convertible Debentures embedded derivative — (5,442)
Diluted loss $ (1,924) $ (3,046)
Weighted average number of basic shares (millions) 108.8 76.2Dilutive securities:7% Convertible Debentures — 11.4
Weighted average number of diluted shares (millions) 108.8 87.6
(Loss)/income per share attributable to Golden Star shareholders:Basic $ (0.02) $ 0.01Diluted $ (0.02) $ (0.03)
18. RELATED PARTY TRANSACTIONS There were no material related party transactions for the three months ended March 31, 2019 and 2018 other than the items disclosed below.
Key management personnel
Key management personnel is defined as members of the Board of Directors and certain senior officers. Compensation of key management personnel are as follows, with such compensation made on terms equivalent to those prevailing in an arm's length transaction:
Three Months Ended March31,
2019 2018
Salaries, wages, and other benefits $ 701 $ 792Bonuses 328 333Share-based compensation 732 (1,738)
$ 1,761 $ (613)

18
19. SEGMENTED INFORMATION Segmented revenue and results
The Company has reportable segments as identified by the individual mining operations. Segments are operations reviewed by the executive management. Each segment is identified based on quantitative and qualitative factors.
Three Months Ended March 31, Wassa Prestea Other Corporate Total
2019Revenue 53,992 13,265 — — 67,257Mine operating expenses 23,433 16,463 — — 39,896Severance charges 225 69 — — 294Operating costs from metal inventory 323 (1,103) — — (780)Inventory net realizable value adjustment and write-off — 920 — — 920Royalties 2,799 675 — — 3,474Cost of sales excluding depreciation and amortization 26,780 17,024 — — 43,804Depreciation and amortization 4,372 2,490 — — 6,862Mine operating margin/(loss) 22,840 (6,249) — — 16,591Income tax expense 7,202 — — — 7,202Net income/(loss) attributable to non-controlling interest 1,438 (2,173) — — (735)Net income/(loss) attributable to Golden Star 12,410 (4,520) (1,493) (8,321) (1,924)
Capital expenditures 11,066 2,076 — — 13,142
2018Revenue $ 45,352 $ 25,467 $ — $ — $ 70,819Mine operating expenses 21,226 22,920 — — 44,146Severance charges 3,394 — — — 3,394Operating costs from metal inventory 3,251 3,790 — — 7,041Inventory net realizable value adjustment and write-off — 1,163 — — 1,163Royalties 2,366 1,464 — — 3,830Cost of sales excluding depreciation and amortization 30,237 29,337 — — 59,574Depreciation and amortization 5,608 2,613 — — 8,221Mine operating margin/(loss) 9,507 (6,483) — — 3,024Income tax expense 2,891 — — — 2,891Net income/(loss) attributable to non-controlling interest 537 (1,947) — — (1,410)Net income/(loss) attributable to Golden Star $ 4,667 $ (5,286) $ (2,083) $ 3,717 $ 1,015
Capital expenditures $ 6,606 $ 4,976 $ — $ — $ 11,582
Segmented Assets
The following table presents the segmented assets:
Wassa Prestea Other Corporate Total
March 31, 2019
Total assets $ 191,821 $ 148,496 $ 1,458 $ 72,305 $ 414,080
December 31, 2018
Total assets $ 181,446 $ 147,815 $ 898 $ 87,828 $ 417,987

19
Information about major customers
Currently, approximately 90% of our gold production is sold through a South African gold refinery. Except for the sales to RGLD as part of the Streaming Agreement, the refinery arranges for the sale of gold on the day it is shipped from the mine sites and we receive payment for gold sold two working days after the gold leaves the mine site. The global gold market is competitive with numerous banks and refineries willing to buy gold on short notice. Therefore, we believe that the loss of our current customer would not materially delay or disrupt revenue.
20. SUPPLEMENTAL CASH FLOW INFORMATION During the three months ended March 31, 2019 and 2018, there was no payment of income taxes. The Company paid $2.8 millionof interest during the three months ended March 31, 2019 (three months ended March 31, 2018 - $2.8 million).
Changes in working capital for the three months ended March 31, 2019 and 2018 are as follows:
Three Months EndedMarch 31,
2019 2018
(Increase)/decrease in accounts receivable $ (2,044) $ 1,008(Increase)/decrease in inventories (3,493) 4,953Decrease in prepaids and other 51 693Decrease in accounts payable and accrued liabilities (10,012) (11,435)Total changes in working capital $ (15,498) $ (4,781)
Other includes the following components:
Three Months EndedMarch 31,
2019 2018
Loss on disposal of assets $ — $ 67Inventory net realizable value adjustment and write-off 920 1,163(Gain)/loss on fair value of marketable securities (3) 132Accretion of vendor agreement 183 183Accretion of rehabilitation provisions (see Note 8) 199 214Amortization of financing fees 42 104Accretion of 7% Convertible Debentures discount 560 492Interest on lease obligation (see Note 3A) 8 —Gain on reduction of rehabilitation provisions (275) (794)Interest on financing component of deferred revenue (see Note 9) 1,153 1,187
$ 2,787 $ 2,748
Non-cash changes of liabilities arising from financing activities
During the three months ended March 31, 2019 and 2018, the non-cash change related to the changes in liabilities arising from financing activities is as follows:
Three Months EndedMarch 31,
2019 2018
Accretion of debt $ 785 $ 778