FS 2021-3054: The HayWired Earthquake Scenario—Societal ...
6
580 80 101 101 280 680 NOVATO VALLEJO ALAMEDA SOLANO MARIN CONTRA COSTA SAN MATEO SANTA CLARA SAN FRANCISCO CENTRAL ALAMEDA COUNTY NORTHERN ALAMEDA COUNTY SOUTHERN ALAMEDA COUNTY San Pablo Bay San Francisco Bay PACIFIC OCEAN Dublin-Pleasanton Epicenter T h e H a y W i r e d E a r t h q u a k e S c e n a r i o Societal Consequences WESTERN CONTRA COSTA COUNTY The HayWired earthquake scenario, led by the U.S. Geological Survey (USGS), anticipates the impacts of a hypothetical moment magnitude 7.0 earthquake on the Hayward Fault. The fault runs along the east side of California’s San Francisco Bay and is among the most active and dangerous in the United States, passing through a densely urbanized and interconnected region. A scientifically realistic scenario is one way to learn from a large earthquake before one occurs in the bay region. The USGS and its partners in the HayWired Coalition are working to energize residents and businesses to engage in new and ongoing efforts to prepare the region for such a future earthquake. 234,202 Population affected at home only 181,856 Population affected at work place only 96,292 Population affected at home and work 2.6 million Population little affected at home and work Concentrated building damage from earthquake and fire hazards found in the yellow and orange tracts in the above map. Numbers are origin-destination data from the Longitudinal Employer-Household Dynamics database (2015 version) The U.S. Geological Survey (USGS) led the HayWired earthquake scenario, which examines the likely effects of a large earthquake in California’s San Francisco Bay region. This hypothetical earthquake is one of many plausible seismic events that could be the region’s next big earthquake. The name HayWired alludes to the threat of earthquakes on the Hayward Fault and the vulnerabilities and strengths posed by the interconnectedness of the region’s inhabitants, utilities, telecommunications, roads, and economy—including the digital economy. The HayWired scenario anticipates the effects of a hypothetical magnitude (M) 7.0 earthquake (mainshock) on the Hayward Fault and its aftershocks that occur over 2 years. The Hayward Fault runs along the east side of San Francisco Bay and is among the most active and dangerous in the United States, passing through a densely urbanized and interconnected region with a population of more than 7 million people. The fault rupture moves opposite sides of the fault as much as 2.1 meters (about 6 feet) relative to each other. Additional slip of up to 0.5–1.5 meters accumulates with a declining rate over the days, weeks, months, and years following the earthquake in places with less initial slip. Damaging shaking (Modified Mercalli Intensity VI or higher) occurs throughout the region including the urbanized area of the nine counties bordering San Francisco Bay, as well as Santa Cruz County to the south. Shaking causes liquefaction (soils behaving like liquid) in sandy, water- saturated soils along the margin of San Francisco Bay and local streams, and it also causes landslides in the hills and mountains surrounding the bay, especially in the hills of the east bay. The earthquake hazards and resulting fires damage buildings; concentrations of building damages have the potential to disrupt neighborhoods and business districts. The HayWired scenario was developed to inform residents of the bay region and policymakers of their possible earthquake risk reduction and resilience-building opportunities. Such actions taken now, before an earthquake, will help to: · save lives and preserve well-being, · maintain functional buildings and infrastructure, · keep people in their homes, · keep businesses open, and · shorten the region’s recovery time when the next earthquake occurs. Top left map of the San Francisco Bay Area, California, showing census tracts with concentrated damage as a result of hazards caused by the HayWired scenario mainshock on the Hayward Fault. Census tracts with concentrated damage are defined as tracts with 20 percent or more of their total building square footage sustaining extensive or complete damage. The yellow tracts are concentrated building damage from earthquake hazards. The orange tracts are additional tracts recognized as having concentrated damage once fire is included in the analysis. The green is preserved land. The brown is economic subareas. U.S. Department of the Interior U.S. Geological Survey Fact Sheet 2021–3054 October 2021
Transcript of FS 2021-3054: The HayWired Earthquake Scenario—Societal ...
HayWired_FS2021_fig01
580
80
101
101
280
680
NOVATO
VALLEJO
ALAMEDA
SOLANO
MARINCONTRA COSTA
SAN MATEO
SANTA CLARA
SAN FRANCISCO
CENTRAL ALAMEDA COUNTY
NORTHERNALAMEDA COUNTY
SOUTHERN ALAMEDA COUNTY
San Pablo Bay
San Francisco Bay
PACIFIC OCEAN Dublin-Pleasanton
Epicenter
Th
e HayWired Earthquake Scen
ario
Societal Consequences
WESTERNCONTRA COSTA
COUNTY
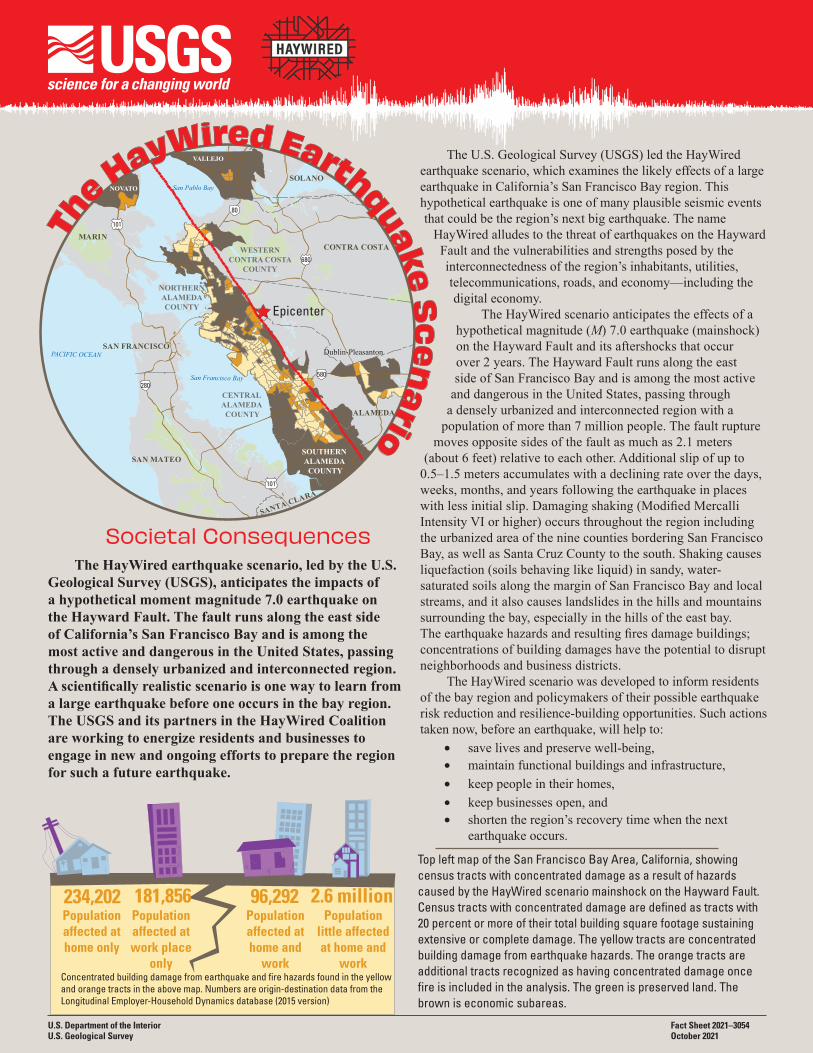
The HayWired earthquake scenario, led by the U.S. Geological Survey (USGS), anticipates the impacts of a hypothetical moment magnitude 7.0 earthquake on the Hayward Fault. The fault runs along the east side of California’s San Francisco Bay and is among the most active and dangerous in the United States, passing through a densely urbanized and interconnected region. A scientifically realistic scenario is one way to learn from a large earthquake before one occurs in the bay region. The USGS and its partners in the HayWired Coalition are working to energize residents and businesses to engage in new and ongoing efforts to prepare the region for such a future earthquake.
AAXXXX_fig 01
234,202Population affected at home only
181,856Population affected at work place
only
96,292Population affected at home and
work
2.6 millionPopulation
little affected at home and
workConcentrated building damage from earthquake and fire hazards found in the yellow and orange tracts in the above map. Numbers are origin-destination data from the Longitudinal Employer-Household Dynamics database (2015 version)
The U.S. Geological Survey (USGS) led the HayWired earthquake scenario, which examines the likely effects of a large earthquake in California’s San Francisco Bay region. This hypothetical earthquake is one of many plausible seismic events that could be the region’s next big earthquake. The name
HayWired alludes to the threat of earthquakes on the Hayward Fault and the vulnerabilities and strengths posed by the interconnectedness of the region’s inhabitants, utilities, telecommunications, roads, and economy—including the digital economy.
The HayWired scenario anticipates the effects of a hypothetical magnitude (M) 7.0 earthquake (mainshock) on the Hayward Fault and its aftershocks that occur over 2 years. The Hayward Fault runs along the east side of San Francisco Bay and is among the most active
and dangerous in the United States, passing through a densely urbanized and interconnected region with a
population of more than 7 million people. The fault rupture moves opposite sides of the fault as much as 2.1 meters
(about 6 feet) relative to each other. Additional slip of up to 0.5–1.5 meters accumulates with a declining rate over the days, weeks, months, and years following the earthquake in places with less initial slip. Damaging shaking (Modified Mercalli Intensity VI or higher) occurs throughout the region including the urbanized area of the nine counties bordering San Francisco Bay, as well as Santa Cruz County to the south. Shaking causes liquefaction (soils behaving like liquid) in sandy, water-saturated soils along the margin of San Francisco Bay and local streams, and it also causes landslides in the hills and mountains surrounding the bay, especially in the hills of the east bay. The earthquake hazards and resulting fires damage buildings; concentrations of building damages have the potential to disrupt neighborhoods and business districts.
The HayWired scenario was developed to inform residents of the bay region and policymakers of their possible earthquake risk reduction and resilience-building opportunities. Such actions taken now, before an earthquake, will help to:
· save lives and preserve well-being, · maintain functional buildings and infrastructure, · keep people in their homes, · keep businesses open, and · shorten the region’s recovery time when the next
earthquake occurs.
Top left map of the San Francisco Bay Area, California, showing census tracts with concentrated damage as a result of hazards caused by the HayWired scenario mainshock on the Hayward Fault. Census tracts with concentrated damage are defined as tracts with 20 percent or more of their total building square footage sustaining extensive or complete damage. The yellow tracts are concentrated building damage from earthquake hazards. The orange tracts are additional tracts recognized as having concentrated damage once fire is included in the analysis. The green is preserved land. The brown is economic subareas.
U.S. Department of the InteriorU.S. Geological Survey
Fact Sheet 2021–3054October 2021
911
AmericanRed Cross+
Safe at friendssafeperson1
friend1
family12
Stay safe
Have you heard, from Dad? Stay safe
Voicemail recording
person1
helper1
Help. I’m Stuck
...
911Friend5(123) 555-4454
911
911Albums
Videos
HayWired is Connected The HayWired scenario has connected people in the
physical science, engineering, and social science disciplines, in public and private sectors, and in emergency management and urban planning practices. Participants have endorsed the importance of coordinated resilience and recovery planning. They have emphasized the need for:1. Cities to coordinate response planning with each other
and with power companies, telecommunications carriers, emergency managers, and amateur radio operators.
2. The region to convene a lifeline council of providers and emergency managers to enhance coordinated planning for collocated infrastructure and service restoration dependencies.
3. Investing in physical infrastructure with businesses participation in mitigation planning.
4. Planning and exercising for community recovery, in addition to response,• with community and economic development
organizations, underrepresented community groups, and emergency managers,
• concerning policies to address properties in hazardous and uneconomical places, planning for potential population displacement, space for temporary housing, and timely rebuilding of stronger affordable housing, streamlining permitting for repairs and rebuilding (for example, one-stops and waivers), streamlining funding streams across levels of government and from private entities, and policies for accommodating new ideas and innovations that emerge after disasters.
5. Integrating lessons learned from the COVID-19 pandemic and wildland fires into earthquake disaster planning to achieve equitable outcomes for lives and livelihoods.
Telecommunications—Wired and WirelessTelecommunications equipment and lines suffer damage
from HayWired earthquake and fire hazards:• Hundreds of fiber optic cables cross the Hayward Fault.
• Strong shaking, liquefaction, and fire affect cellular sites on buildings, monopoles, central offices, and public safety answering points.
• Data centers in liquefaction hazard prone areas are exposed to cumulative impacts of the HayWired aftershock sequence.
However, power outages cause more of the equipment failures than equipment damage. Where available, backup power keeps provider and subscriber equipment running for hours or a few days. Deployment of portable equipment and fuel deliveries face logistical challenges of limited fuel supply, labor shortages, and inaccessible sites that may delay service restoration for days to weeks. Backup batteries degrade with use during an aftershock sequence if not regularly maintained.
Increased demand for voice and data services after the earthquake congests telecommunications networks, reducing the chance of calls getting through and slowing data transmission speeds. Lost calls after the earthquake compromise 9–1–1
services including the reporting of fires. Meanwhile, critical populations that have communication and information
needs, social vulnerabilities, and (or) access and functional needs are evacuating from unsafe areas.
Resilience opportunities involve mitigation of equipment damage and failure, response
planning, coordination with electric power restoration, subscriber preparedness,
and local government response and regulations.
Interactions among Utilities, Telecommunications, and Transportation Systems
Various types of lifeline infrastructure systems—transportation, energy, telecommunications, and water—are affected by the multiple
hazards of widespread shaking including liquefaction, landslides, and
fire ignition. Long-haul fiber optic cables are relatively more exposed to multi-
hazards than roads, water conveyances, and pipelines. Collocated lifeline infrastructures
are prone to collateral damage and repair interdependencies. Local roads and interoffice
fiber optic cables are commonly collocated, but collocated highways, railways, natural gas and petroleum
AAXXXX_fig 01
"
"
"
"
"
"
""
"
"
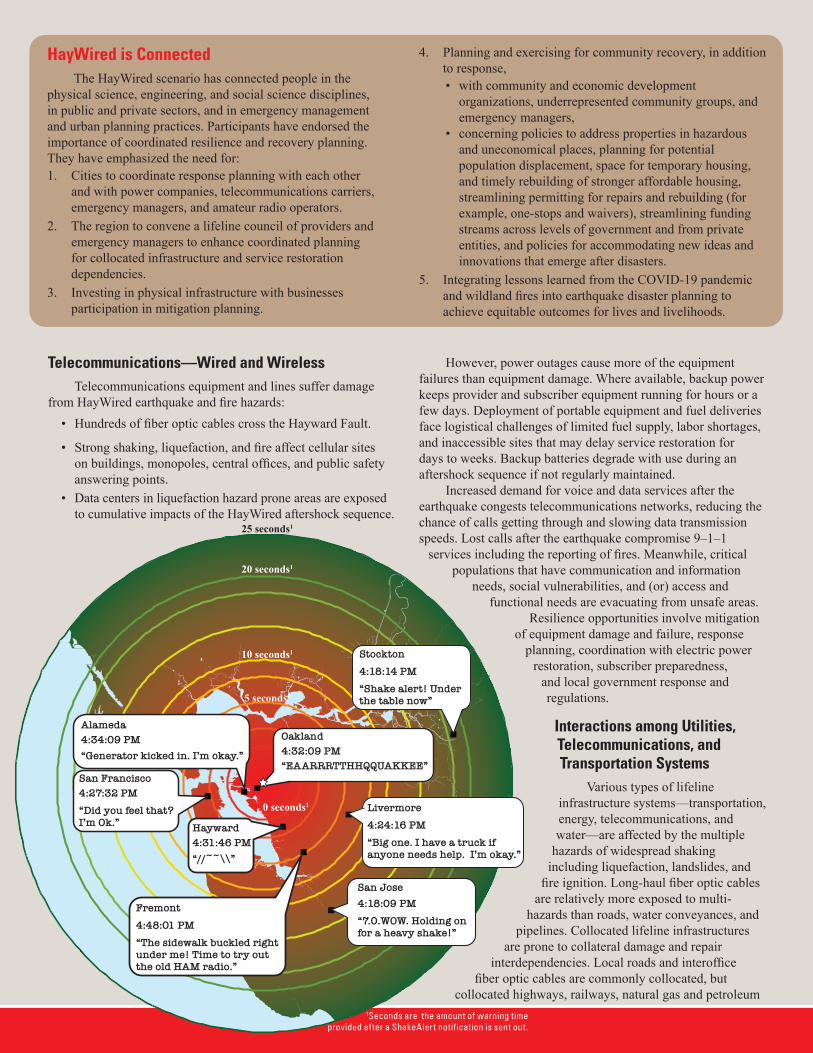
Fremont4:48:01 PM“The sidewalk buckled right under me! Time to try out the old HAM radio.”
San Jose4:18:09 PM“7.0.WOW. Holding on for a heavy shake!”
Livermore4:24:16 PM“Big one. I have a truck if anyone needs help. I’m okay.”
Stockton4:18:14 PM“Shake alert! Under the table now”
20 seconds1
5 seconds1
Oakland4:32:09 PM“EAARRRTTHHQQUAKKEE”
Alameda4:34:09 PM“Generator kicked in. I’m okay.”
San Francisco4:27:32 PM“Did you feel that? I’m Ok.” Hayward
4:31:46 PM“//~~\\”
1Seconds are the amount of warning time provided after a ShakeAlert notification is sent out.
0 seconds1
10 seconds1
25 seconds1

911
AmericanRed Cross+
Safe at friendssafeperson1
friend1
family12
Stay safe
Have you heard, from Dad? Stay safe
Voicemail recording
person1
helper1
Help. I’m Stuck
...
911Friend5(123) 555-4454
911
911Albums
Videos
Conserving Use of theTelecommunications Network
after an EARTHQUAKE
Do
Call 9-1-1 only for emergencies.Post your status to the American Red Cross online “Safe and Well” system.Text. Post your safety status on social media via wired broadband or wifi.Change your voicemail messages to provide updates on your statusTune into radio broadcasts for news updates and information.
Don’t
Don’t post calls for help on social media.
Don’t talk. Do not make voice phone calls unless absolutely needed.Avoid the temptation to use social media for other activities or any other use of cellular data.Don’t post photographs or videos to social media right away.
pipelines, and high-voltage electric power lines may be of higher priority to protect or harden in advance of, and restore after, an earthquake. Societally critical infrastructure, defined as high capacity or threatening to populated areas (for example, infrastructure that serves a lot of people or gas pipelines near residential areas), are collocated and exposed to hazards near the Port of Oakland, San Francisco International Airport, and in densely populated areas. Highlighting areas of collocated infrastructure in multi-hazard areas could support dialogue and coordination among critical infrastructure providers in exercises and future events.
Although telecommunications services are initially the most degraded of all the infrastructure systems, their restoration is the quickest (on the order of days to weeks). Restoration of service takes at least 10 days for fuel, weeks for electric power, months for gas, water, and highway bridges, and years for some Bay Area Rapid Transit (BART) stations in the east bay.
Communities at RiskIn the HayWired scenario, hundreds of thousands of people
could be displaced by uninhabitable homes or neighborhoods, or by lack of convenient community services. Communities at risk of population displacement and long-term recovery challenges are identified as neighborhoods with concentrated building damage and high levels of social and economic vulnerabilities. The threshold for concentrated damage, based on observations from prior earthquakes, is defined as at least 20 percent of the building square footage in a census tract sustaining extensive or complete damage, which is likely to render these buildings uninhabitable. Disproportionate numbers of racially and culturally diverse and (or) socially vulnerable populations are affected in the HayWired scenario. Among the socially vulnerable, people face housing- and income-related hardships (for example, lack of home ownership, high housing-cost burdens, low house-hold incomes) and literacy hardships (for example, low levels of education and few English speakers) that increase their risk of displacement and add to recovery challenges.
AAXXXX_fig 01
Landslides Liquefaction
Trans-portation
Surface offset
Fire following earthquake
Ground shaking
Petroleum and
natural gas
Water supply and
wastewaterElectric power
Tele-commun-ications
Multi-hazard intensity
Very low
Very high
Low
Moderate
High
North Richmond areaPort of Oakland area
Hayward area
North Richmond area
Port of Oakland area
Hayward area
Lifeline infrastructure
Earthquake hazards
0
0
5 MILES
5 KILOMETERS
122°20'
38°
37° 40'
122°
North Richmond area
Port of Oakland area
Hayward area
HayWired scenario hazards affecting major collocated lifeline infrastructure systems
Icons from United Nations Office for the Coordination of Humanitarian AffairsCreative Commons Attribution 4.0 International License, https://brand.unocha.org/d/xEPytAUjC3sH/iconsLiquefaction and surface offset icons made by authors by adapting existing icons.
Areas affected by delays in utility and transportation service restoration or ground failure in the forms of liquefaction, landslide, and surface fault rupture (and further slip of the fault after an earthquake) will face long-term community recovery challenges. The San Francisco Bay region currently faces housing shortages and many buildings have not been seismically retrofitted. Key planning issues that local governments will need to address include housing displaced populations and financing the repair and rebuilding of 1.37 million housing units.
911
AmericanRed Cross+
Safe at friendssafeperson1
friend1
family12
Stay safe
Have you heard, from Dad? Stay safe
Voicemail recording
person1
helper1
Help. I’m Stuck
...
911Friend5(123) 555-4454
911
911Albums
Videos
Business Interruption and Economic Resilience In the first 6 months, property damages, utility outages, and
ripple effects through supply chains result in $44 billion of gross state product (GSP) losses, or 4 percent of California’s economy. Business continuity practices and economic resilience measures can reduce business interruption by 40 percent, to $25 billion GSP losses. They include expediting the restoration of services (for example, using a portable cellular site), working around supply disruptions (for example, changing suppliers), and using remaining resources efficiently or alternatively (for example, conserving water or implementing overtime to catch up on lost production). For businesses on the San Francisco Peninsula and in the south bay, commute flow interruptions cause more employment losses than those from building damages. However, the analysis assumes teleworking levels below those seen during the COVID-19 pandemic.
Recovery from an economic recession when almost half a million jobs are lost takes a few years, but a full return to the previous forecast trajectory could take more than 5 years for the region and closer to a decade for the most severely affected areas, such as Alameda County. Economic recovery is boosted by reconstruction but would be slowed by construction worker shortages, cost surges, and large business relocations.
Business interruption from damaged buildings affects about 8 percent of San Francisco Bay region establishments and employees but varies by location—peaking with 40 percent affected in central Alameda County. Across sectors, industrial and warehouse establishments are disproportionately damaged.
More than half a million employees (14 percent) in the nine-county region are affected by lack of access or damages to workplaces, damages to their homes, or loss of neighborhood services. Concentrations of building damages highlight resilience planning opportunities at neighborhood- and business district-levels and for safety cordon management, minimizing the spread of impacts between employee work places and homes, sector-wide resilience, protection of middle-income jobs, and potential industrial and geographical shifts in economic activity.
Benefits of Earthquake Early WarningEarthquake preparedness is largely accomplished in advance
through building codes and response and recovery plans. The final opportunity to protect people and assets uses automated or self-protective actions that can be taken if given seconds of warning before the strongest shaking arrives. These actions can reduce injuries, loads on the telecommunications network, and demands on urban search and rescue. For the West Coast of the United States, earthquake early warning implemented via ShakeAlert® was introduced publicly during the development of the HayWired scenario to notify people and businesses that an earthquake has begun and shaking will occur in their area. Considering the new capabilities that warnings provide during a plausible earthquake scenario like the HayWired scenario allows us to imagine their usefulness throughout an aftershock sequence, outline how warning times range based on earthquake location and station density, and consider use for various conditions of the built environment and stages of emergency response and recovery.
Investing in Earthquake ResistanceIn the 30 years since the Loma Prieta earthquake, the bay
region has invested about $80 billion (in 2016 U.S. dollars) in seismic strengthening of transportation, water, and other critical infrastructure; hospitals, schools, and government facilities; and unreinforced masonry, soft story, and other types of buildings. This money spent on upgrades, retrofits, and replacements has likely reduced future economic impacts because HayWired scenario economic analyses show that business interruptions are primarily caused by building damage and transportation disruption. The investments in reducing earthquake risk relative to population are the largest in the City and County of San Francisco, more than four times larger than in the harder hit Alameda, Contra Costa, and Santa Clara Counties. The HayWired earthquake scenario shows that there is more to be done about vulnerable buildings, water distribution systems, BART stations, fuel supplies, and other infrastructure.
men19-7347_fig11
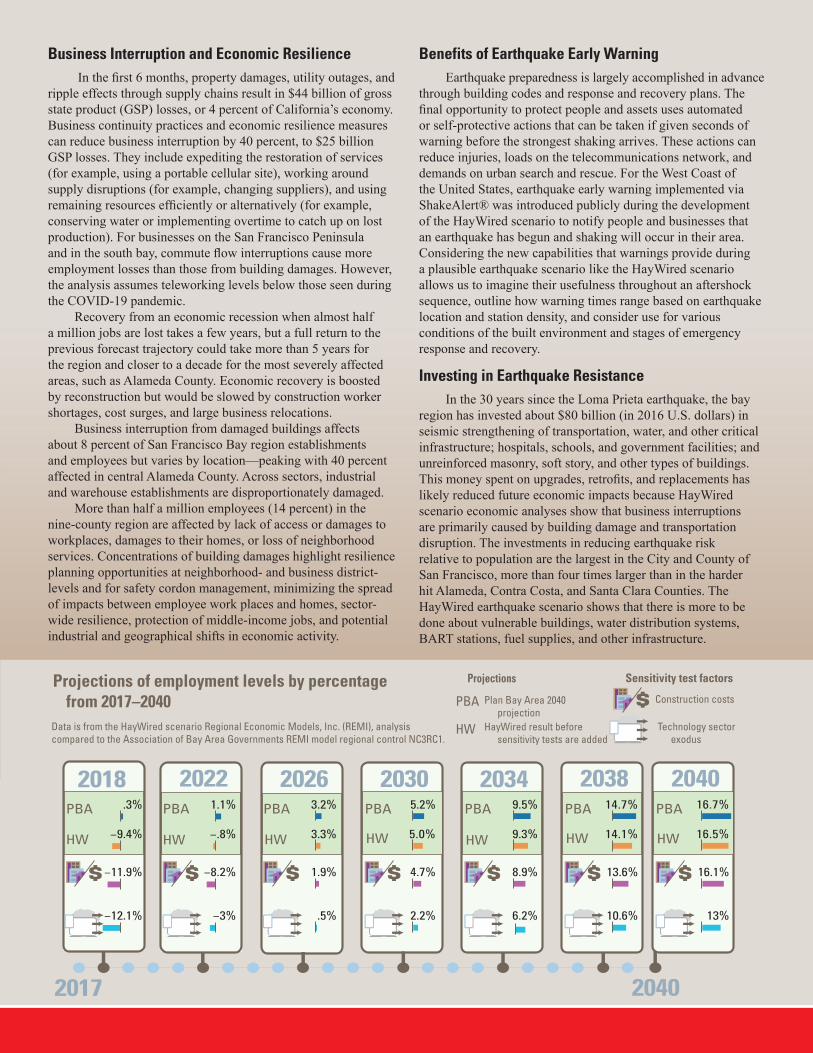
Projections of employment levels by percentage from 2017–2040
Data is from the HayWired scenario Regional Economic Models, Inc. (REMI), analysis compared to the Association of Bay Area Governments REMI model regional control NC3RC1.
Projections
PBA Plan Bay Area 2040 projection
HayWired result before sensitivity tests are added
HW
Sensitivity test factors
Construction costs
Technology sector exodus
2040
$ 16.1%
13%
16.7%
16.5%
PBA
HW
2038
$
PBA
13.6%
10.6%
HW
14.7%
14.1%
2034
$
PBA 9.5%
9.3%
8.9%
6.2%
HW
2030
$
HW
PBA 5.2%
5.0%
4.7%
2.2%
2026
$
PBA 3.2%
3.3%
1.9%
.5%
HW
2022
$
1.1%
−.8%
−8.2%
−3%
HW
PBA
$
2018
HW
PBA .3%
−9.4%
−11.9%
−12.1%
$
2017 2040

AAXXXX_fig 01
Population Household
Uses 2000 U.S. Census data.
Displacement in concentrated building damage1
NorthernCentral
Southern
Alameda County402,147
212,988
658,682271,922
Contra Costa County
Other subareas2
278,539
1Values represent a degree of vulnerability for populations with listed characteristics and who are within areas of concentrated building damage.2 Values are given in percent of total population as taken from a.Data from 2000 U.S. Census data. b. 2010–2014 American Community Survey data from the U.S. Census. c. 2012-2016 American Community Survey data. d.2005-2006 custom Hazus building inventory.3Other subareas are Dublin-Pleasanton, Novato and Vallejo4Values are based on households
HOME DAMAGE2a
HOME AND UTILITY DAMAGE2a
CONCENTRATED BUILDING DAMAGE2c,d
CONCENTRATED MULTI-FAMILY BUILDING DAMAGE2c,d
6%of the
households affected
7%of the
households affected
9%of the
householdsaffected
8.5%of the
households affected
17%of the
households affected
NorthernCentral
Southern
16% 10%21%18%
4%
YOUNG ADULTS WITH LIMITED TIES TO REGION2c
Alameda County Western Contra Costa County
Other subareas3
Northern
Central
Southern
6%
34%
39%
8% 4%
Alameda County Western Contra Costa County
Other subareas3
PERSONS WITH DISABILITY 2c,4
K–122c
Alameda County Contra Costa County
Nor
ther
n
Sout
hern
Cent
ral
Wes
tern
12%5% 38% 6% 30%
Other subareas3
HOME, UTILITY, AND FIRE DAMAGE2c,d
COMMUNITY2b
4%40%
Western 26%
0%
4%
The HayWired CoalitionSince 2014, USGS has worked on the HayWired
scenario with representatives of organizations in the San Francisco Bay region. These have included 80 fire department chiefs, 25 emergency managers, and many representatives from utilities (water, gas, and electric), transportation agencies, and the information technology industry.
Starting in 2016, these and new partnerships were formalized under the banner of the HayWired Coalition. The coalition is an alliance of more than 50 agencies and businesses that aim to communicate the scenario to their constituents and align the scenario with their community concerns by:
• helping to build community capacity to respond to and recover from earthquakes,
• advancing basic knowledge of earthquake risks,• informing actions to reduce earthquake risks, and• improving the communication and use of
earthquake-hazard science in decision making.Since the 2018 rollout of HayWired scenario
volume 2, the scenario has been used in:• the foundation of the State’s Outsmart Disaster
Campaign for businesses that expanded from northern California and to encompass all disasters (https://outsmartdisaster.com),
• regional futures planning (for example, Metropolitan Transportation Commission),
• earthquake response exercises (for example, University of California, San Francisco),
HayWired is Integrated
The HayWired scenario uses integrative approaches to better understand spatial, temporal, and scale interactions of a large earthquake and interrelated benefits of risk reduction actions. The HayWired scenario analyses help to:
Understand spatial relations• A detailed liquefaction probability map and a multi-hazard
intensity map underpin analyses of lifeline infrastructure exposure to hazards and collocated infrastructure.
• Building damage from all hazards is integrated and concentrated damage in neighborhoods are mapped to:• estimate populations at risk of displacement, including
socially vulnerable and mobile populations,• estimate employment by industrial sector at risk of relocation
or job loss,• relate the spread of impacts between employees residential
neighborhoods and employment districts, and• identify community recovery challenges in areas affected by
severe ground failure, concentrated building damage, and slow restoration of community services.
Understand temporal relations• Restoration times of telecommunications services are estimated
for dependence on electric power service restoration, spikes in demand for information and communication after a large earthquake, and industry response.
• Property damage, transportation, telecommunications, electric power, and (or) water service restoration times are used in analyses of economic losses during the first 6 months after the earthquake and economic recovery compared to the baseline 20-year regional projection.
• The causes and timing of population displacements and returns and how those affect community recovery timelines are discussed.
• A two-year aftershock sequence affects estimates of water sup-ply restoration, building damages and shelter needs, and eco-nomic losses. The aftershocks can be used to imagine different situations for uses of ShakeAlert during response and recovery. Understand scale relations
• Building damages are aggregated into areas of concentrated damage that can affect the function of a neighborhood or business district.
• Micro and macroeconomics perspectives span characteristics of businesses (for example, small size or minority owned) disrupted by building damage, impacts on industrial sectors, and gross state product losses.
• Business continuity practices including telework are incorporated into macroeconomic resilience analyses to estimate potential reductions in economic losses caused by property damages and commute disruptions.
• Disruption to lives and livelihoods owing to population displacement and employment relocation affects more people than the magnitude of the gross regional product loss in a large diverse economy may indicate.
• business continuity exercises (for example, Global Business Continuity Program),
• earthquake awareness and preparedness campaigns (for example, ShakeOut organized by the Earthquake Country Alliance),
• community engagement processes (for example, San Jose State University Anthropology Department),
• development of a business earthquake exercise toolkit (USGS, Earthquake Country Alliance, California Resilience Alliance, California Office of Emergency Services, and Federal Emergency Management Agency),
• an examination of the pros and cons of electrification during and after an earthquake (City of Palo Alto),
• an investigation of the sensitivity of the liquefaction hazard to sea-level rise (USGS), and
• discussions of recovery planning (HayWired Connection webinars)
Reflection on the COVID-19 PandemicSimilar to the COVID-19 pandemic experience that began
in 2020, the effects of the HayWired earthquake scenario are sudden, and a quick response with emergency supplies will save lives. There will be issues with supply chains, and employers’ use of the physical environment will change dramatically. Yet in the HayWired scenario, only the San Francisco Bay region is directly affected by the earthquake. Even so, some resilience measures of sheltering and working in place that have worked well during the pandemic may be much more difficult to implement when faced with extensive physical damage and utility and telecommunications outages. The pandemic highlighted how the digital divide would also create inequities in earthquake response and recovery. Respecting the lessons learned from the pandemic and planning ahead for a large earthquake through mitigation measures, stockpiling critical supplies, and laying the groundwork for equitable recovery actions could help reduce suffering and improve recovery outcomes. How we recover from the pandemic could also help to prepare for an earthquake; stimulus funds could include support for infrastructure investments that also increase earthquake or fire resistance.
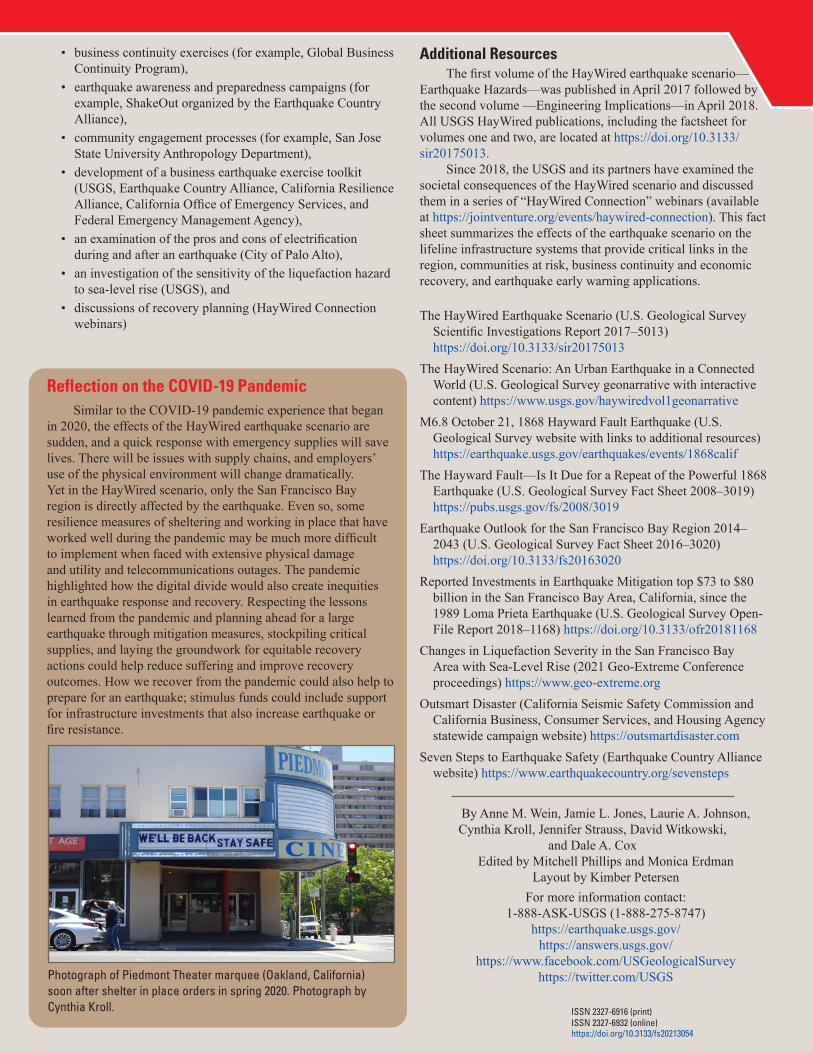
Photograph of Piedmont Theater marquee (Oakland, California) soon after shelter in place orders in spring 2020. Photograph by Cynthia Kroll.
Additional ResourcesThe first volume of the HayWired earthquake scenario—
Earthquake Hazards—was published in April 2017 followed by the second volume —Engineering Implications—in April 2018. All USGS HayWired publications, including the factsheet for volumes one and two, are located at https://doi.org/10.3133/sir20175013.
Since 2018, the USGS and its partners have examined the societal consequences of the HayWired scenario and discussed them in a series of “HayWired Connection” webinars (available at https://jointventure.org/events/haywired-connection). This fact sheet summarizes the effects of the earthquake scenario on the lifeline infrastructure systems that provide critical links in the region, communities at risk, business continuity and economic recovery, and earthquake early warning applications.
The HayWired Earthquake Scenario (U.S. Geological Survey Scientific Investigations Report 2017–5013) https://doi.org/10.3133/sir20175013
The HayWired Scenario: An Urban Earthquake in a Connected World (U.S. Geological Survey geonarrative with interactive content) https://www.usgs.gov/haywiredvol1geonarrative
M6.8 October 21, 1868 Hayward Fault Earthquake (U.S. Geological Survey website with links to additional resources) https://earthquake.usgs.gov/earthquakes/events/1868calif
The Hayward Fault—Is It Due for a Repeat of the Powerful 1868 Earthquake (U.S. Geological Survey Fact Sheet 2008–3019) https://pubs.usgs.gov/fs/2008/3019
Earthquake Outlook for the San Francisco Bay Region 2014–2043 (U.S. Geological Survey Fact Sheet 2016–3020) https://doi.org/10.3133/fs20163020
Reported Investments in Earthquake Mitigation top $73 to $80 billion in the San Francisco Bay Area, California, since the 1989 Loma Prieta Earthquake (U.S. Geological Survey Open-File Report 2018–1168) https://doi.org/10.3133/ofr20181168
Changes in Liquefaction Severity in the San Francisco Bay Area with Sea-Level Rise (2021 Geo-Extreme Conference proceedings) https://www.geo-extreme.org
Outsmart Disaster (California Seismic Safety Commission and California Business, Consumer Services, and Housing Agency statewide campaign website) https://outsmartdisaster.com
Seven Steps to Earthquake Safety (Earthquake Country Alliance website) https://www.earthquakecountry.org/sevensteps
By Anne M. Wein, Jamie L. Jones, Laurie A. Johnson, Cynthia Kroll, Jennifer Strauss, David Witkowski,
and Dale A. CoxEdited by Mitchell Phillips and Monica Erdman
Layout by Kimber PetersenFor more information contact:
1-888-ASK-USGS (1-888-275-8747)https://earthquake.usgs.gov/
https://answers.usgs.gov/https://www.facebook.com/USGeologicalSurvey
https://twitter.com/USGS
ISSN 2327-6916 (print)ISSN 2327-6932 (online)https://doi.org/10.3133/fs20213054