Fruit and Vegetable Situation and Outlook Atlanta, Georgia, September 22-24 Deacue Fields Associate...
29
Fruit and Vegetable Fruit and Vegetable Situation and Outlook Situation and Outlook Atlanta, Georgia, September 22-24 Atlanta, Georgia, September 22-24 Deacue Fields Deacue Fields Associate Professor/Extension Economist Associate Professor/Extension Economist Department of Ag Economics and Rural Soc. Department of Ag Economics and Rural Soc. Auburn University Auburn University [email protected] [email protected] 2008 2008 Southern Southern Outlook Outlook Conferen Conferen ce ce
-
Upload
meghan-hunt -
Category
Documents
-
view
214 -
download
0
Transcript of Fruit and Vegetable Situation and Outlook Atlanta, Georgia, September 22-24 Deacue Fields Associate...

Fruit and Vegetable Fruit and Vegetable Situation and OutlookSituation and Outlook
Atlanta, Georgia, September 22-24Atlanta, Georgia, September 22-24
Deacue FieldsDeacue FieldsAssociate Professor/Extension EconomistAssociate Professor/Extension EconomistDepartment of Ag Economics and Rural Soc.Department of Ag Economics and Rural Soc.Auburn UniversityAuburn [email protected]@auburn.edu
2008 2008 Southern Southern Outlook Outlook ConferenceConference

Top U.S. Horticultural ProducersTop U.S. Horticultural Producers
1. California2. Florida3. Texas4. Arizona5. Michigan6. New York7. Washington8. Oregon

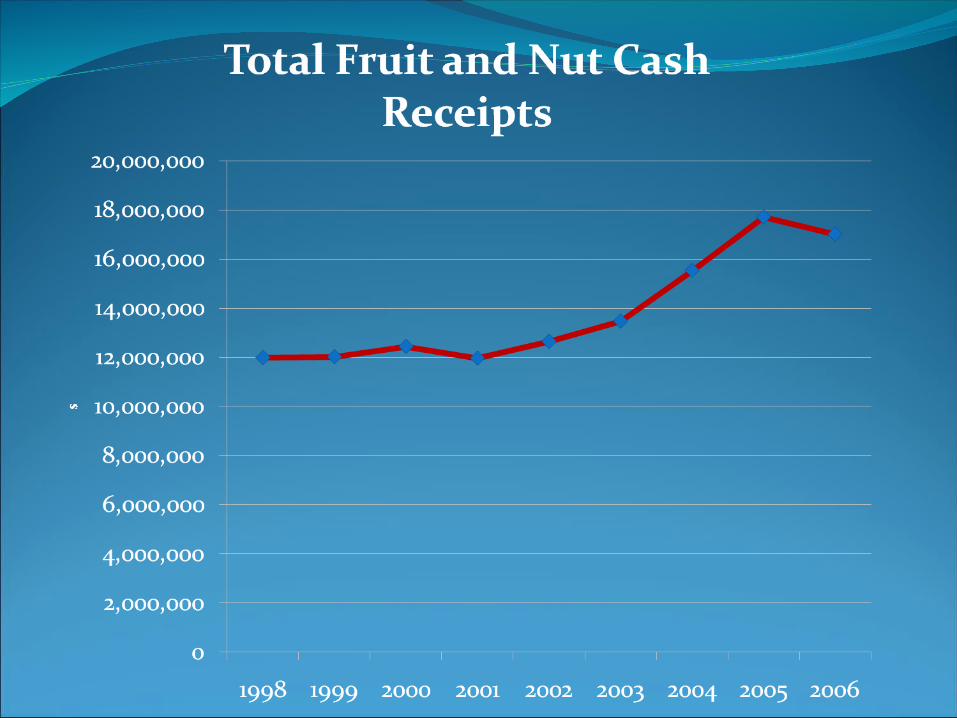
US Farm Cash Receipts for Crops, 2006

Fruit and NutIndex of prices received by fruit and tree nut growers in
April fell 10% from April 2007. Sharply lower orange prices relative to 07 contributed Fresh-market orange prices were down 67 % in April from a
year ago.April prices for strawberries, lemons, apples, and
grapefruit fell.California is forecast to increase its strawberry production
by 2% to 2.2 billion pounds, a new record Florida’s winter crop was affected by a freeze and is
estimated to be down 22%Banana prices are strong due a number of banana-
producing countries experiencing unfavorable weather and high shipping costLower U.S. imports during the 1st quarter, along with high
fuel
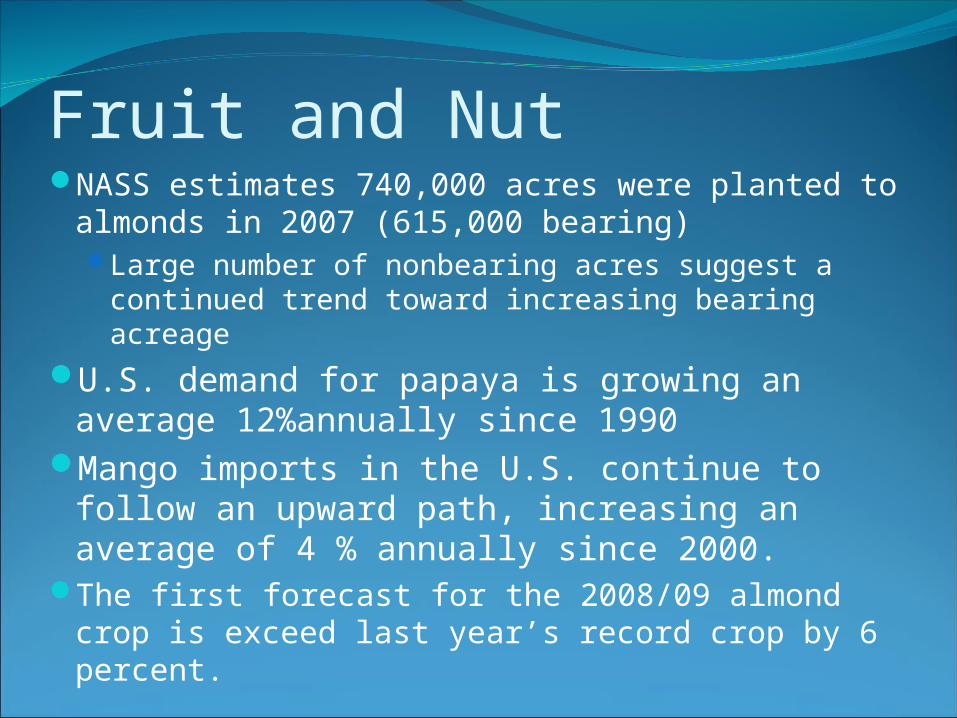
Fruit and NutNASS estimates 740,000 acres were planted to
almonds in 2007 (615,000 bearing)Large number of nonbearing acres suggest a
continued trend toward increasing bearing acreage
U.S. demand for papaya is growing an average 12%annually since 1990
Mango imports in the U.S. continue to follow an upward path, increasing an average of 4 % annually since 2000.
The first forecast for the 2008/09 almond crop is exceed last year’s record crop by 6 percent.

Fruit and NutU.S. fresh orange and strawberry exports are
significantly higher than last season with volumes through March up 54 % and 26 %, respectively.
July forecast for U.S. peach production in 2008 was set at 2.19 billion pounds, down 3 % from a year ago. Production decline is attributed mainly to a smaller
crop in CaliforniaSouth Carolina and Georgia crop is expected to
almost double with 110 and 70 million pounds Grower prices for fresh peaches averaged 47.4
cents per pound in May and 27.3 cents in June, 16 % and 4 % higher than in May and June last year

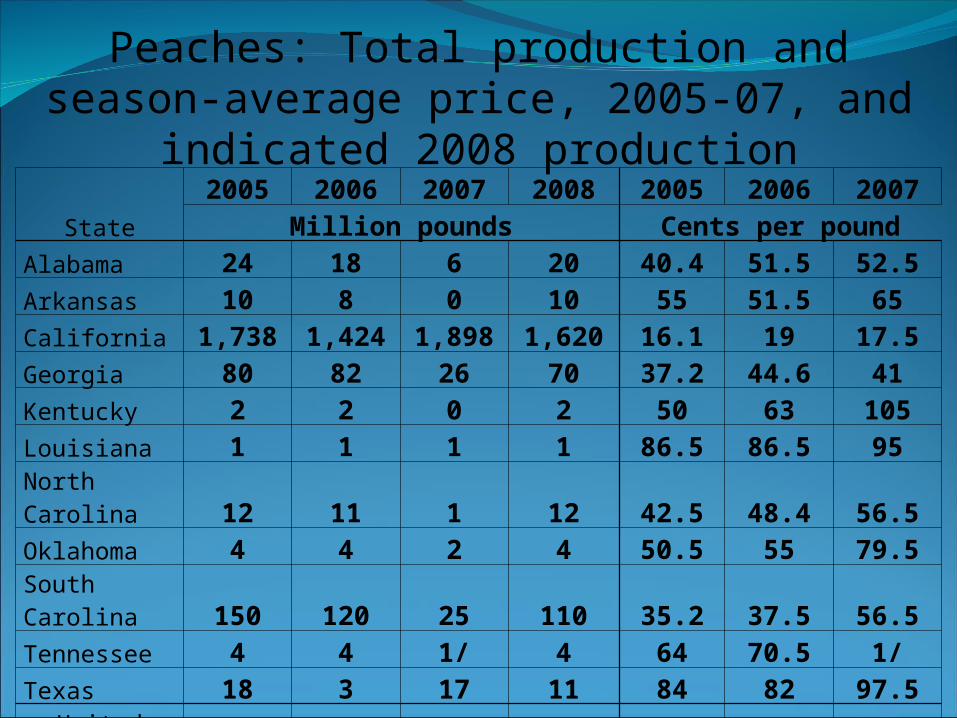
State
2005 2006 2007 2008 2005 2006 2007Million pounds Cents per pound
Alabama 24 18 6 20 40.4 51.5 52.5
Arkansas 10 8 0 10 55 51.5 65
California 1,738 1,424 1,898 1,620 16.1 19 17.5
Georgia 80 82 26 70 37.2 44.6 41
Kentucky 2 2 0 2 50 63 105
Louisiana 1 1 1 1 86.5 86.5 95
North Carolina 12 11 1 12 42.5 48.4 56.5
Oklahoma 4 4 2 4 50.5 55 79.5
South Carolina 150 120 25 110 35.2 37.5 56.5
Tennessee 4 4 1/ 4 64 70.5 1/
Texas 18 3 17 11 84 82 97.5
United States 2,369 2,020 2,257 2,194 22.4 26 22.6
Source: USDA, National Agricultural Statistics Service
Peaches: Total production and season-average price, 2005-07, and indicated 2008 production

U.S. vegetables and melon productionabout 2 % of all harvestedcropland, but generates 16 % of all farm cash receipts and 8% of U.S. farm export value during 2004-06

Specialized Vegetable and Melon Farms: Regional distribution,2006
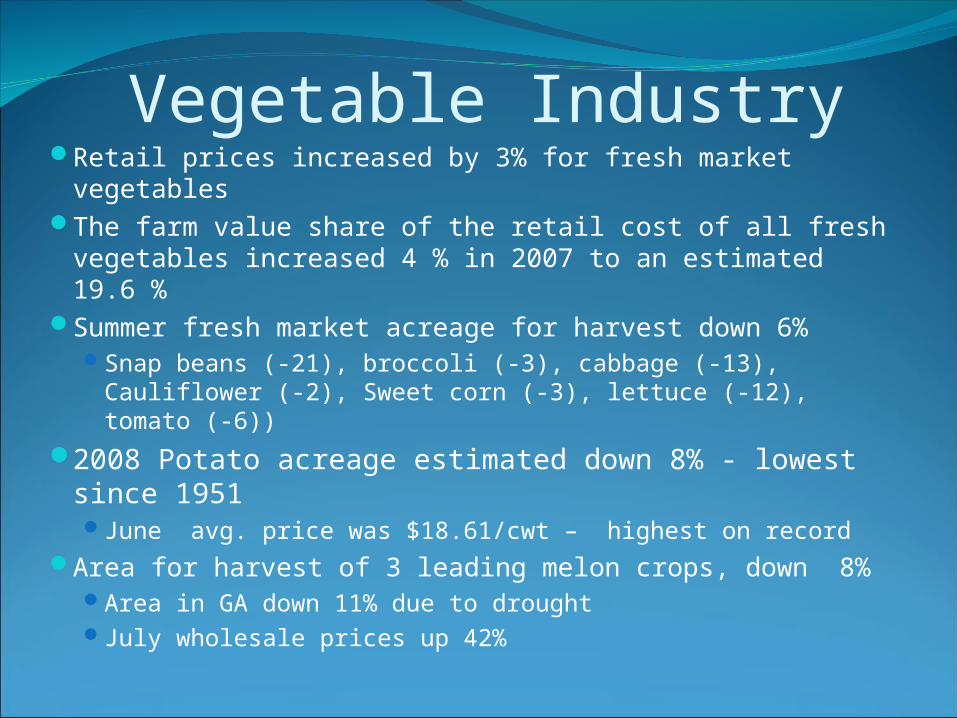
Vegetable IndustryRetail prices increased by 3% for fresh market vegetablesThe farm value share of the retail cost of all fresh vegetables
increased 4 % in 2007 to an estimated 19.6 %Summer fresh market acreage for harvest down 6%
Snap beans (-21), broccoli (-3), cabbage (-13), Cauliflower (-2), Sweet corn (-3), lettuce (-12), tomato (-6))
2008 Potato acreage estimated down 8% - lowest since 1951June avg. price was $18.61/cwt – highest on record
Area for harvest of 3 leading melon crops, down 8%Area in GA down 11% due to droughtJuly wholesale prices up 42%
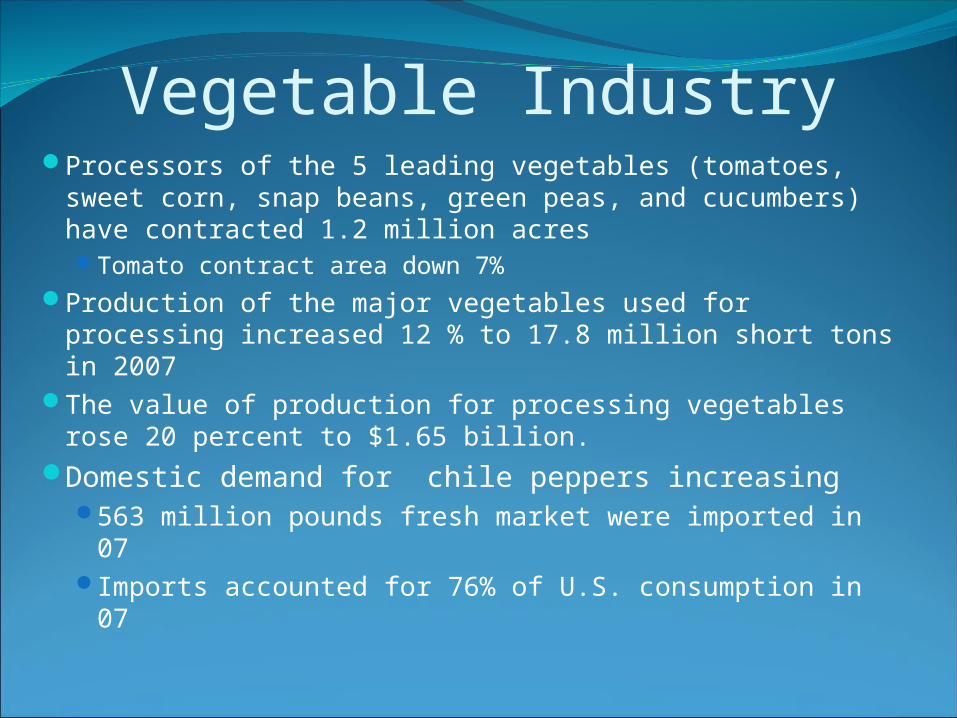
Vegetable IndustryProcessors of the 5 leading vegetables (tomatoes, sweet corn,
snap beans, green peas, and cucumbers) have contracted 1.2 million acresTomato contract area down 7%
Production of the major vegetables used for processing increased 12 % to 17.8 million short tons in 2007
The value of production for processing vegetables rose 20 percent to $1.65 billion.
Domestic demand for chile peppers increasing563 million pounds fresh market were imported in 07Imports accounted for 76% of U.S. consumption in 07
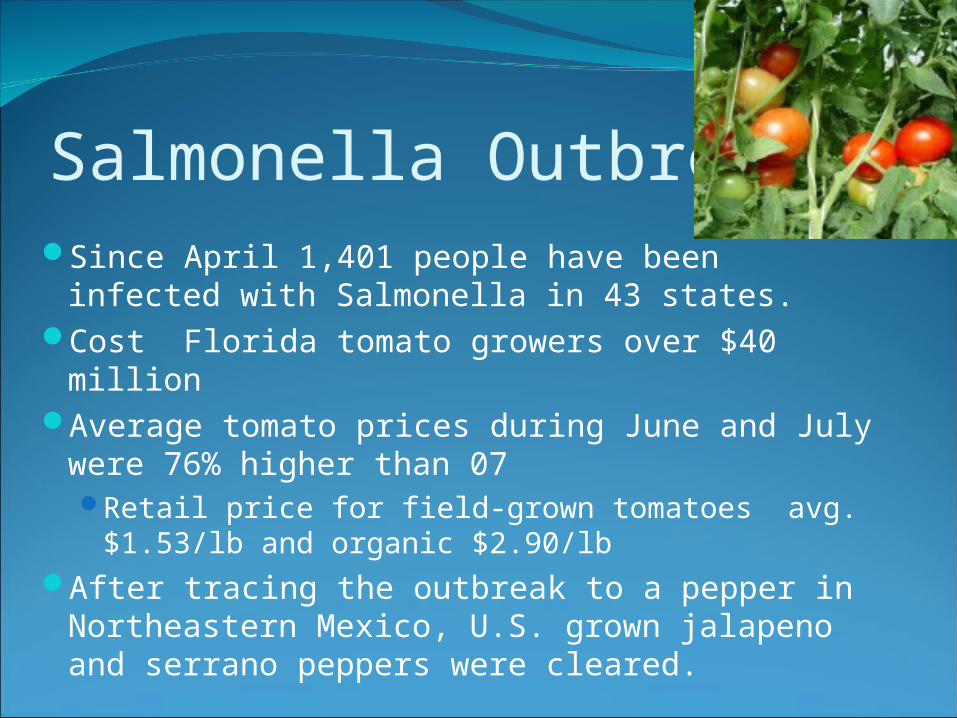
Salmonella OutbreakSince April 1,401 people have been infected
with Salmonella in 43 states.Cost Florida tomato growers over $40 million Average tomato prices during June and July
were 76% higher than 07 Retail price for field-grown tomatoes avg.
$1.53/lb and organic $2.90/lbAfter tracing the outbreak to a pepper in
Northeastern Mexico, U.S. grown jalapeno and serrano peppers were cleared.


Vegetable ExportsProcessed exports increase rapidly due to
weak dollar and strong wholesale price (Canada-32%, Japan -12%, Italy – 7%, Mexico - 7%, and Hong Kong – 5%)
Processed imports increased by 14%

2007 2008 2007-08 ChangeCommodity March April March April March April
----------------------Dollars per box----------------------- ----Percent------
Citrus Fruit
Grapefruit, all 2.91 2.1 3.14 2.89 7.9 37.6Grapefruit, fresh 7.78 8.07 9.4 8.73 20.8 8.2
Lemons, all 8.68 9.18 39.77 28.18 358.2 207
Lemons, fresh 37.71 36.71 45.9 43.2 21.7 17.7
Oranges, all 10.58 10.62 6.07 6.21 -42.6 -41.5
Oranges, fresh 21.22 21.23 7.62 7.04 -64.1 -66.8
Noncitrus fruit
Apples, fresh 0.292 0.281 0.344 0.335 17.8 19.2
Pears, fresh 0.272 0.299 0.256 0.246 -5.9 -17.7Strawberries, fresh 0.889 0.646 0.953 0.621 7.2 -3.9
Monthly fruit prices received by growers, United States

Production ExpensesThe largest vegetable and melon farms (those
with more than $1 million in sales) averaged $2.9 million in total cash expenses. Cash expenses for all farms and ranches with more than $1 million in sales averaged about 40 percent less
Average input prices increased 25 % between 1998-2000 and 2004-06, while average prices received by commercial vegetable growers increased by about 11 % during this period.

Production ExpensesAnnual variable expenses across all
specialized vegetable and melon farms averaged $240,510 per farm—79 percent of total cash and noncash expenses
Hired labor) was the single largest expense item
Agricultural chemicals (including fertilizers) were the second-largest expense - accounting for about 21 % of total variable expense

Top Five InputsIn Terms of Price Gains 1. Fuels (up 99 percent)2. Fertilizer (up 47 percent)3. Seeds and transplants (up 38 percent)4. Farm machinery (up 27 percent)5. Wage rates (up 23 percent)
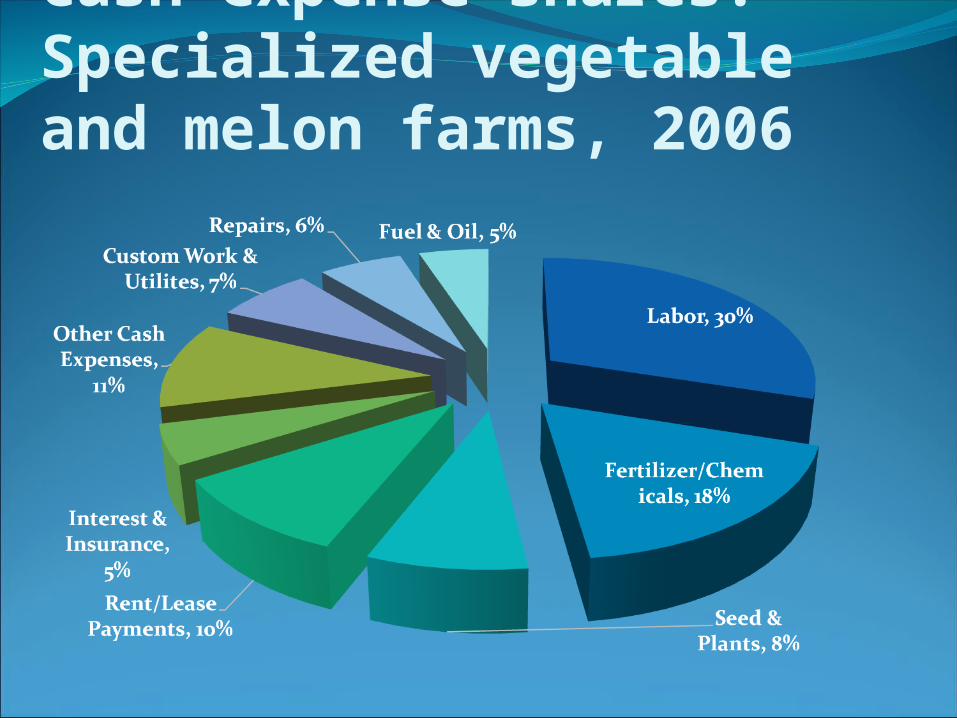
Cash expense shares: Specialized vegetable and melon farms, 2006
Organic SituationIn 2005 the US retailed $13.8 billion in organic food95% of world organic retail sales from the EU and
US.Organic share of retail sales increased from 0.8% in
1997 to 1.9% in 2003, and 2.5% in 2005. Organic standards were implemented by the US in
2002In the US demand trends suggest organic food sales
of $23.8 billion by 2010.In 2001 there were 2.3 million acres of certified
organic land in the USApproximately 46% of organic food is handled by
mass market channel

Natural vs OrganicNatural Production means producers claim to
produce with no man made chemicals.With natural production there is limited ability
to assure consumers that products were actually produced with no synthetic chemicals
Organic certification was developed to reduce fraud by those claiming “organic” production.
Do Consumer Care?Consumers are beginning to substitute fuel
for organics.

2008 Farm Bill The Food, Conservation, and Energy Act of
2008, includes a title that is specific to specialty crops and organics
First inclusion in Farm BillTitle focuses mostly on the health and well-
being of specialty crop production.The USDA allotted $28.4 million for research
and extension projects of specialty crops for the 2008 fiscal year.

2008 Farm BillAn additional $50 million in funding will be allotted
during the four other fiscal years, covering 2009-2012. The total funding will amount to $230 million.
Projects must pertain to 1 of 5 areas:1. Research in plant breeding, genetics and genomics to
improve crop characteristics.2. Threats from pests and diseases, including threats to
specialty crop pollinators3. Efforts to improve production efficiency, productivity,
and profitability over the long term (including specialty crop policy and marketing).
4. New innovations and technology, including improved mechanization and technologies that delay or inhibit ripening
5. Methods to prevent, detect, monitor, control, and respond to potential food safety hazards in the production and processing of specialty crops, including fresh produce.”

2008 Farm BillEach State is to receive $100,000 or 1/3 of 1% of total
funding for each fiscal year, whichever is higher. Includes specialty crops as part of each Census of
Agriculture.Expands market news activities to provide timely price
information on fruits and vegetables. Authorizes additional $9 million annually for FY 2008-12
Adds an agri-tourism promotion program to categories of farmer-to-consumer direct marketing activities eligible for funding. Provides mandatory CCC funding of: $3 million for FY 2008,
$5 million/year for FY 2009-10, $10 million/year for FY 2011-12
Authorizes grants to improve cost-effectiveness and address intermodal deficiencies of transporting specialty crops to local, regional, and international markets.
MALTAGRegional, Multi-state committee comprised
primarily of Ag Economist who work with Specialty Crops
Group has been working on specialty crop issues such as Organics, Production Costs, Financial Management, Budgeting and Planning, and Risk Management since 2002.
The group is poised to compete for specialty crop funding and expand on past efforts