Dvorak - Largo (Dalla New World Sinfonia) (Trasc. Olcott-Bickford)

FRONTIER STUDIO 2016:
BLOUSTEIN SCHOOL OF
PLANNING AND PUBLIC
POLICY
Prepared for the National Center for Frontier
Communities

Authors:
Frank Popper
Channing Bickford
Cameron Black
Dan Burton
Loan Dao
Sarah DeGiorgis
Steven Lubrano
Whitney Miller
Marlana Moore
Editors:
Dan Burton
Maryann Gulotta

TABLE OF CONTENTS
Drones, Drones on the Range: The Frontier’s Unmanned Aircraft System 1
DRONES, DRONES ON THE RANGE: THE
FRONTIER’S UNMANNED AIRCRAFT
SYSTEM CAMERON BLACK

Drones, Drones on the Range: The Frontier’s Unmanned Aircraft System 2
TABLE OF CONTENTS
Introduction .................................................................................................................................................................. 3
Image 1: Various Drone Applications ................................................................................................................. 3
Image 2: Price Chart on Drones .......................................................................................................................... 4
Goals of project ........................................................................................................................................................ 5
Literature Review ......................................................................................................................................................... 5
Agricultural applications .......................................................................................................................................... 5
Image 3: eBee Information ................................................................................................................................. 6
Image 4: How NDVI is Measured ........................................................................................................................ 6
Public Health applications ....................................................................................................................................... 7
Wildfire applications ................................................................................................................................................ 7
Image 5: NOAA Drones Unit Logo ....................................................................................................................... 8
Image 6: Nasa Predator b-Based Ikhana Drone ................................................................................................ 8
Limitations ................................................................................................................................................................... 9
Conclusion .................................................................................................................................................................... 9
References ................................................................................................................................................................. 11

Drones, Drones on the Range: The Frontier’s Unmanned Aircraft System 3
INTRODUCTION
An unmanned aircraft system (UAS) refers to the different components (support equipment, control station,
data links, etc.) required for the operation of a drone. An unmanned aircraft (UA) refers only to the aerial part of
the system, which is operated by a pilot using a remote ground control system. The Federal Aviation
Association (FAA) issues an airworthiness certificate for any UAS on the market. After a consumer purchases a
drone they must register the aircraft with the FAA if it weighs between 0.55 and 55 pounds. Subsequently, an
FAA issued pilot certificate is required to operate a civil UAS in the National Airspace System. Any aircraft
operating in the national airspace is required by law to be a certificated and registered aircraft, operators must
obtain a piloting license and receive operational consent. The FAA evaluates petitions on a case-by-case basis
for exemption under Section 333 to acquire the ability to use a drone commercially. Once a drone is registered
and the operator has a piloting certificate there are restrictions on where a drone can be flown. For instance, a
drone cannot be within 5 nautical miles of an airport with an operational control tower, 3 nautical miles of an
airport with a published instrument flight procedure, or 2 nautical miles from a heliport.1
Regulations have increased on drones recently because of their growing popularity (See Image 1). Drones have
increased in popularity because they are being used for natural disaster response, climate change reduction,
space research, extreme weather research, wildlife conservation, precision agriculture, reducing water
contamination, pest control, search and rescue, and law enforcement.2
IMAGE 1: VARIOUS DRONE APPLICATIONS
Image Source: NASA
When compared with other aerial photography equipment, it is easy to see why drones are so popular. For
example, before drones, people relied on the launch of a Landsat 8 imaging satellite for aerial photographs,
which cost approximately $855 million. A cheaper option would be a Cessna 172 airplane, but those cost
approximately $300,000. On the other hand, a professional automated mapping drone like senseFly’s eBee
RTK costs about $25,000, and cheaper still is DJI’s Phantom 3 quasi professional aerial imaging drone, which
1 (Federal Aviation Administration, 2016) 2 (Collings, 2015)

Drones, Drones on the Range: The Frontier’s Unmanned Aircraft System 4
costs around $1,000 (See Image 2).3 The falling prices, therefore, are one of the reasons drones have
increased in popularity.
IMAGE 2: PRICE CHART ON DRONES
Image Source: myfirstdrone.com
Drones also have the advantage of revisiting a site daily, whereas satellites in orbit can only revisit an area
every three days and airplanes must be manned by a pilot.4 Furthermore, the resolutions provided by satellites
are only good enough for large scale projects in agriculture or large scale land-use planning. However, for fine-
tuned surveying work or 3D mapping, the image resolution of satellites is low, and this is where drones have
found their niche.
Drones give accurate counts for corn fields and create high precision 3D models of infrastructure. This was
previously only possible with helicopters, but helicopters cost approximately $10,000 to rent, whereas a drone
can perform the same task for $1,000. Moreover, a UAS can be ready to fly much faster than helicopters or
airplanes, which makes it possible to react to sudden events. For example, for a farmer who wants to analyze
damage inflicted on their crops after a tornado can do so cheaply and quickly: when gathering information
quickly is a priority, drones surpass airplanes, helicopters, and satellites. Nevertheless, there are still
3 (Drone Apps., 2015) 4 (ibid.)

Drones, Drones on the Range: The Frontier’s Unmanned Aircraft System 5
applications for which satellites and airplanes are more useful than drones because battery constraints
prevent drones from covering large areas. In the meantime a drone is the most economical option for smaller
projects like acquiring 5 hectares of agricultural imagery.5
GOALS OF PROJECT
The objective of this report is to evaluate the applications of drones in frontier communities. Based on our
research, we theorize that drones will be helpful for people living in frontier communities; however, high
pricing, technological complexities, and reliance on broadband services may make drones impractical. We
have included information on pricing and regulations to give realistic expectations of drone applicability and
have included a limitations section to analyze obstructions to drone uses on the frontier. Lastly, we provide
final thoughts in the conclusion section to further summarize the research.
LITERATURE REVIEW
AGRICULTURAL APPLICATIONS
Drones can be useful for farmers on the frontier to scout crops, monitor crop health, survey soil health before
planting, analyze nitrogen, analyze plant stress, determine drought conditions, measure leaf area index,
determine plowing depth, study phenology, classify plants, and more.6 7 Livestock operations on the frontier
can benefit from drones as well because they can be used to monitor the location, and well-being of livestock
at a lower cost. Agricultural drones on the market range in price from $1,500 to $30,000. Fixed wing drones
such as the AgEagle RAPID, PrecisionHawk Lancaste, and SenseFly eBee are preferred by farmers because
they can view more area at a faster speed and spend more time in the air than a multi-rotor platforms drones
like the DJI Phantom 3. In approximately 30 minutes a fixed wing drone can map over 100 acres giving a
wealth of information about a crop. Any infestation of pests or disease can be spotted easily and rectified
without having to scout the field on foot, which could take hours or days.8 Farmers living in frontier
communities would benefit greatly from the analyses that drones can provide on their crops.
The faster analysis that fixed wing drones can achieve makes them more expensive. They range in price from
$5,000 to $30,000, and can cost even more after they are equipped with sensors.9 One of the most
commonly used fixed-wing drones for agricultural purposes is called the Sensefly eBee, which costs $25,000.
The eBee can fly for up to 45 minutes at a time, does not require significant training or technical knowledge,
and is equipped with a 16-megapixel camera to record aerial images and a GPS tracker (See Image 3).
Because the eBee offers better control over spatial resolution of images, a vantage point unimpeded by clouds,
instant viewing of produced images, and the ability to rapidly re-map areas, this type of drone is generally more
useful than traditional methods of agricultural aerial imaging.10
5 (Drone Apps., 2015) 6 (Nixon, 2016) 7 (Tripicchio et al., 2015) 8 (Roberson, 2013) 9 (Nixon, 2016) 10 (Fornace et al., 2014)

Drones, Drones on the Range: The Frontier’s Unmanned Aircraft System 6
IMAGE 3: EBEE INFORMATION
Image Source: lasergps.com
Agricultural drones can help frontier communities through their advanced imaging capabilities to assess the
health of crops. UASs equipped with multispectral imaging cameras can identify the normalized difference
vegetation index (NDVI) which can determine plant health by analyzing the plant’s reflection of different levels
of visible green and near-infrared light (NIR).11 This is accomplished through looking at the changes over a
period of time in the visible light and NIR reflected by crops to identify potential health issues. A plant that is
reflecting higher levels of green light and lower levels of red and blue light is healthy, whereas low levels of
reflected green light and higher levels of blue and red indicate a depletion in chlorophyll and poor health (See
image 4).
IMAGE 4: HOW NDVI IS MEASURED
Image Source: bestdroneforthejob.com
11 (Nixon, 2016)
Drones, Drones on the Range: The Frontier’s Unmanned Aircraft System 7
Private companies capitalize on the UAS’s potential to improve crop yields. For example, Vine Rangers in
Northern California provides specialized service for wine grape growers by using drones to find the plant
height, plant count, plant health, presence of nutrients, presence of disease, presence of weeds, relative
biomass estimates, and 3D / volumetric data (See Image 4).12 Private drone imaging companies assist
farmers on the frontier in getting a professional analysis of their crops without having to understand how to
operate a drone. Agricultural farming giant Monsanto is also focusing on using drones to collect farming data
to optimize crop yield. According to Monsanto, these methods increase yields by roughly 5% over two years.
Corn growers have confirmed that giving more crop data to the farmers will increase America’s average corn
yield from 160 bushels an acre to 200 bushels.13 For these reasons, drones will be useful for farmers on the
frontier.
PUBLIC HEALTH APPLICATIONS
Drones have many public health applications for frontier communities, such as search and rescue missions,
mapping to predict disease spread, delivery of medical supplies and tests, disaster relief, and more. The non-
profit organization Doctors Without Borders uses drones to rescue refugees in the Mediterranean Sea.14 The
drones assist the doctors aboard rescue ships by providing surveillance that can give the crew the location of
refugees. Frontier communities can use drones in a similar manner to locate people that have gone missing.
Furthermore, health workers are using drones to collect environmental data that can assist in determining the
spread of certain diseases. For instance, the high definition imaging capabilities of drones can give information
on the moisture of soil, levels of rainfall, and vegetation, which can be used to understand mosquito habitats
and the spread of diseases such as malaria, West Nile, and the Zika virus.15 Public health workers can
understand the spread of certain disease better and how they may threaten frontier communities and drones
can be used to combat disease once they have struck communities. For example, drones have been
successfully used in Africa to deliver AIDS tests and provide results to remote locations at a faster rate than
was previously accomplished.16 This application of drones has helped to save lives because people can get
results and medication faster.
The field of public health has also used drones for disaster relief. Following the typhoon that hit the Philippines
in 2014, disaster relief organizations used drones to plan relief measures and to survey damage. Drones are
even being used to deliver medical supplies after disasters in inaccessible areas and to transfer biological
samples from rural clinics to better-equipped laboratories.17 The application of drones for delivery of medical
supplies and to provide medical assistance would be an invaluable use for people in the frontier that do not
have easy access to healthcare facilities.18 Lastly, drones have been used to predict natural disaster before
they occur. Drone researchers have used advanced 3-D cameras to predict potentially dangerous areas where
landslides may occur. The drone software helped researchers predict a landslide; consequently, they were able
to evacuate people and reduce harm to infrastructure. The key advantage of using a drone to assess these
risks is the reduction in cost.19 Frontier communities that are near fracking sites or gas pipelines would benefit
from an analysis like this because it could prevent harm to nearby communities.
WILDFIRE APPLICATIONS
12 (Nixon, 2016) 13 (Economist, 2014) 14 (Doctors Without Borders, 2015) 15 (Turk, 2014) 16 (McNeish, 2016) 17 (Fornace et al., 2014) 18 (Fornace et al., 2014) 19 (WPXI, 2016)

Drones, Drones on the Range: The Frontier’s Unmanned Aircraft System 8
Drones can be used in frontier communities to combat wildfires by being the firefighters’ eyes in the sky. An
aerial view of a wildfire provides an understanding of how the fire is structured and how the fire is changing,
and is an invaluable asset to firefighters. Drones can provide an understanding of where the fire is moving, the
hotspots behind the fire front, and potentially endangered structures nearby. A UAS can also function as a
communications relay for the field command hub, so that firefighters on foot will have a better understanding
of the fire’s movements, reducing the risk of death or harm to property. Moreover, smoke screens are a
common problem for firefighters because they impair their view, but drones equipped with infrared thermal
imaging allow the firefighters to see what lies ahead, improving awareness and enhancing the ability to make
informed decision. For example, the National Oceanic Atmospheric Association has become a certified drone
operating organization and are using drones to track wildfires.20
IMAGE 5: NOAA DRONES UNIT LOGO
Image Source: NOAA
The U.S. Forest Service uses NASA’s Predator B-based Ikhana research drone over Southern California
wildfires. The Predator B-based Ikhana has a 16-channel multispectral camera, image processor and a satellite
data link to send maps of the fire area to incident command centers on the ground immediately.21 This data is
vital to any firefighting operation.
IMAGE 6: NASA PREDATOR B-BASED IKHANA DRONE
Image Source: NASA
The fire-fighting industry can benefit greatly from the capabilities of drones through fire-monitoring support and
coordination, damage assessment, hotspot detection, wildfire mapping, emergency response, and hazardous
material investigation. Furthermore, drones can provide firefighters with valuable forestry information to
20 (AV Environment, 2016) 21 (Werner, 2015)

Drones, Drones on the Range: The Frontier’s Unmanned Aircraft System 9
inventory and classify trees that are more susceptible to forest fires. The data acquired by drones to combat
wildfires is key information that can help frontier communities that are at risk of or battling wildfires.22
LIMITATIONS
Firstly, drones can be difficult to use in inclement weather. When temperatures are high it causes the drone to
overheat, and when temperatures are too low the battery will overconsume, limiting flight time. Volatile
weather can make it difficult for users to design their flight plans and notify authorities in advance.23 In
addition, the data acquisition of slower models can make analysis painstakingly time consuming when the
daily coverage is limited by the number of flights the model can accomplish.24
Furthermore, pilot reports of unmanned aircrafts have increased dramatically over the past year, from a total
of 238 sightings in all of 2014, to more than 650 by August of 2015.25 Conflicting flight patterns with planes
and helicopters is a serious problem and limits drone usage for combating forest fires because airtankers need
to fly above and disperse flame retardants. Resultantly, drones must cease all operations when any Forest
Service airtankers are operating because the risk of a drone colliding with an airtanker. The FAA has been
working closely with industry partners through the “Know Before You Fly” campaign to inform drone users
about flying rules and regulations.26 The FAA is sending out a clear message that operating drones around
airplanes and helicopters is dangerous and illegal.27 Unauthorized and unregistered users risk civil fines up to
$27,500 in addition to criminal fines of up to $250,000 and potentially three years in prison.28
For agricultural drone usage it is important to know that the FAA views all agricultural drone use as commercial
operations; therefore, the government has the right to access all data generated by the drone. For this reason,
data retention and storage policies require particular attention. Connectivity and bandwidth issues can be
problematic for farmers on the frontier because there are millions of acres of farmland in the US that have no
online connectivity or cell coverage. Thus, farmers in frontier communities should only purchase drones that
can store captured images and data in the drone without broadband.29
Lastly, farmers and ranchers might be reluctant to adopt the new drone technology because even though
drones improve crops, they reduce the role of skilled workers and reduce their competence. Farmers may be
reluctant to further reduce their role on the farm and they may distrust the companies handling their crop data.
It is practical to believe that farmers will fear the release of detailed data they provide on their harvests by
using drones.30 For example, they could believe that their commercial secrets could be sold or leaked to rival
farmers. Finally, drones may have the unintended consequence of alienating humans from the tasks that they
wish to accomplish. In the case of wildlife protection it may give operators and conservationists a false sense
of the environmental conditions that an animal is experiencing.31 Also, the increase in various drones hovering
above humans may induce anxiety out of fear for what they may be doing.
CONCLUSION
22 (Puliti et al., 2015) 23 (Fornace et al., 2014) 24 (Puliti et al., 2015) 25 (FAA, 2015) 26 (Werner, 2015) 27 (FAA, 2015) 28 (Kopstein, 2015) 29 (Nixon, 2016) 30 (Economist, 2014) 31 (Peters, 2016)

Drones, Drones on the Range: The Frontier’s Unmanned Aircraft System 10
The findings of this study support that in spite of high prices, regulations, battery problems, and ethical issues,
drones will be useful for frontier communities. Studies support that drones can be useful for farmers on the
frontier to improve their crops and monitor livestock.32 Public health applications of UAVs for frontier
communities, such as search and rescue missions, mapping diseases, delivery of medical supplies, and
disaster relief have been supported to be useful for frontier communities. Lastly, drones are useful for
combating wildfires because of their ability to give information on where a fire is moving, the hotspots behind
the fire front, and potentially endangered structures nearby.33 As the world moves forward with drone
technology, it is easy to place them at the table in frontier communities. Although the limitations may preclude
widespread use of drones today, the days of frontier drone integration are not far off.
32 (Tripicchio et al, 2015) 33 (AV Environment, 2016)
Drones, Drones on the Range: The Frontier’s Unmanned Aircraft System 11
REFERENCES
AV Environment. "FIRE." 2016. Web. <https://www.avinc.com/public-safety/applications/fire>.
Collings, Sophie. "10 Non-Aggressive Uses of Drones." The American Geographical Society. 19 Feb. 2015.
Web. <https://amergeog.wordpress.com/2015/02/19/10-non-aggressive-uses-of-drones/>.
Doctors Without Borders. "MSF and MOAS to Launch Lifesaving Operation for Migrants in Mediterranean." 9
Apr. 2015. Web. <http://www.doctorswithoutborders.org/article/msf-and-moas-launch-lifesaving-
operation-migrants-mediterranean>.
Drone Apps. "Price Wars: Counting the Cost of Drones, Planes and Satellites." 21 Aug. 2015. Web.
<https://droneapps.co/price-wars-the-cost-of-drones-planes-and-satellites/>.
The Economist. "Digital Disruption on the Farm." 24 May 2014. Web.
<http://www.economist.com/news/business/21602757-managers-most-traditional-industries-
distrust-promising-new-technology-digital>.
Federal Aviation Administration (FAA). "Unmanned Aircraft Systems (UAS) Frequently Asked Questions." Feb.
2016. Web. <https://www.faa.gov/uas/faq/>.
FAA. "Pilot Reports of Close Calls With Drones Soar in 2015." 12 Aug. 2015. Web.
<https://www.faa.gov/news/updates/?newsId=83445>.
Fornace, K. M., C. J. Drakeley, T. William, F. Espino, and J. Cox. "DRONES RECORD HOW THE ENVIRONMENT
SHAPES DISEASE RISK." University of Washington Conservation. 24 Oct. 2014. Web.
<http://conservationmagazine.org/2014/10/drones-record-how-the-environment-shapes-disease-
risk/>.
Kopstein, Joshua. "I'll Register My Drone When You Have to Register Your Gun." Vice. 14 Dec. 2015. Web.
<http://motherboard.vice.com/read/ill-register-my-drone-when-you-have-to-regist
McNeish, Hannah. "The First HIV-Fighting Drones Have Been Deployed in Africa." Vice. 16 Mar. 2016. Web.
Nixon, Andrew. "How To Select an Agriculture Drone: An In-Depth Buyer’s Guide. “Best Drone For The Job. 4
Apr. 2016. Web. <http://bestdroneforthejob.com/drones-for-work/agriculture-drone-buyers-guide/>
Peters, Justin. "This Expert Worries That Using Drones to Protect Wildlife Could Backfire." Future Tense. 16 Feb.
2016. Web.
<http://www.slate.com/blogs/future_tense/2016/02/16/chris_sandbrook_argues_that_using_drone
s_for_conservation_could_backfire.html?wpsrc=sh_all_dt_tw_top>.
Puliti, S.; Ørka, H.O.; Gobakken, T.; Næsset, E.Inventory of Small Forest Areas Using an Unmanned Aerial
System. Remote Sens. 2015, 7, 9632-9654.
Tripicchio, P., M. Satler, G. Dabisias, E. Ruffaldi, and C. A. Avizzano. "Towards Smart Farming and Sustainable
Agriculture with Drones." Intelligent Environments (IE), 2015 International Conference on (2015): 140-
43. Web. <http://ieeexplore.ieee.org/stamp/stamp.jsp?tp=&arnumber=7194284>.
Turk, Victoria. "Drones Create Real-Time Maps of How Diseases Spread." Vice. 22 Oct. 2014. Web.
<http://motherboard.vice.com/read/drones-create-real-time-maps-of-how-diseases-sprea>.

Drones, Drones on the Range: The Frontier’s Unmanned Aircraft System 12
Roberson, Roy. "On-farm Remote Sensing Will Be More Valuable in the Future." Farm Press Blog. 23 Oct. 2013.
Web. <http://southeastfarmpress.com/blog/farm-remote-sensing-will-be-more-valuable->
Werner, Debra. "Fire Drones." Aerospace America (2015): 28-31. Web.
WPXI. "Pittsburgh Drone Developers Hope to Use New Technology to save Lives." 7 Apr. 2016. Web.

Broadband in FAR 2 Areas 13
BROADBAND IN FAR 2 AREAS STEVE LUBRANO AND WHITNEY MILLER

Broadband in FAR 2 Areas 14
TABLE OF CONTENTS
Introduction ................................................................................................................................................................ 15
Defining Broadband................................................................................................................................................... 15
Challenges of Broadband in Rural Areas: Expense, Geography, Lack of Demand ................................................ 16
Inequities of Broadband in Rural Areas ................................................................................................................... 17
Figure 1: Gap by Census Blocks Ordered by Population Density (source needed) ........................................ 18
Figure 2: Investment Gap per Housing Unit by Lowest-Cost Technology for Each County (Source Needed)19
Figure 3: Location of Highest-Gap Housing Units (Source Needed) ............................................................... 20
Broadband in Tribal Areas ......................................................................................................................................... 21
Benefits of Broadband in Rural Areas ...................................................................................................................... 22
Telemedicine and Distance Learning ................................................................................................................... 23
Federal Funding ......................................................................................................................................................... 23
NTIA: Broadband USA ............................................................................................................................................ 24
Case Study: Mississippi .................................................................................................................................... 24
FCC Universal Service Health Care Programs: The Rural Health Care Program ................................................ 24
Case Study: Maine ............................................................................................................................................. 25
USDA:The Rural Broadband Access Loan and Loan Guarantee Program .......................................................... 25
Case Study: Nevada........................................................................................................................................... 25
USDA: Distance Learning and Telemedicine Grant ............................................................................................ 26
Case Study: Ute Mountain Ute Tribe reservation and Pyramid Lake Paiute Tribe ......................................... 26
USDA: Community Connect Program ................................................................................................................... 26
Case Study: Alaska ............................................................................................................................................ 26
HRSA: Telehealth Programs ...................................................................................................................................... 27
Telehealth Network Grant Program (TNGP) ......................................................................................................... 27
Telehealth Resource Center Grant Program (TRC) .............................................................................................. 27
Evidence-Based Tele-Emergency Network Grant Program (EB TNGP) ............................................................... 27
Rural Veterans Health Access Program (RVHAP) ................................................................................................. 27
Rural Child Poverty Telehealth Network Grant Program (RCPTNGP)) ................................................................. 28
Rural Health Network Development Planning Program ...................................................................................... 28
Case Study: California ....................................................................................................................................... 28
GIS Analysis ................................................................................................................................................................ 28
Conclusion .................................................................................................................................................................. 36
References ................................................................................................................................................................. 37

Broadband in FAR 2 Areas 15
INTRODUCTION
This paper will discuss broadband on the frontier. For the purposes of this paper, broadband refers to high
speed internet connection as discussed in detail in the first section paper. In the next sections we will
document existing broadband access throughout the country as well as disparities in access, particularly from
an urban vs. rural perspective as well as disparities between racial and tribal groups. We will then detail the
applications for broadband, particularly those of value to frontier communities, and identify local, state and
federal funding sources. Finally, a GIS analysis of frontier broadband will depict existing broadband access,
speed and investment gaps in FAR 2 counties. This paper will reveal that frontier communities are consistently
lacking in broadband investment and facilities compared to the rest of the nation.
The Santa Fe New Mexican’s article “High-speed Internet gaps leave rural New Mexicans lacking a ‘basic right’”
recounts the frustrating internet experiences of residents in rural areas of the state. Residents of Tao pay $70
a month for internet service that provides less than optimal download speeds of 10 Megabits per second,
while in Pojoaque Valley the fastest service is 3 Mbps and costs $96 a month. In the United States overall, high
speed internet is an integral part of everyday life. However many rural communities are forced to pay more for
poorer quality internet than more urbanized areas. For example in New York City, a plan with 300 Mbps costs
about $30 less. Unfortunately, in some areas broadband is not available at all. The New Mexican article
mentions a man named Juanito Jimenez, an artist living in Tesuque. He does not have access to standard
internet options, therefore his family has to access internet using a limited Verizon data plan. This has to be
closely monitored each month so that they do not face overage charges.34
DEFINING BROADBAND
“Broadband” encompasses a wide variety of internet technologies and access typologies. In regard to internet
access, broadband refers to a fast internet connection that is continuously on, distinct from dial up access.
Broadband service is also characterized by two way transmission of data: downstream transmission, commonly
known as download, and upstream transmission, commonly known as upload. Download includes anything
received by the user, including receiving emails, visiting websites, watching videos and other uses. Uploading
includes sending emails, editing web pages, and filling out online forms among other uses.
While generally defined as faster than dial up, the exact speeds necessary to constitute broadband are in
contention and ever changing. The Federal Communications Commission (FCC) typically defines and redefines
the benchmark for broadband, or “advanced telecommunications capability” in its annual Broadband Progress
Reports as required by the Telecommunications Act of 1996. The 2015 FCC Broadband Progress Report
redefined this benchmark to 25 Mbps download and 3 Mbps upload and has stated a desire to increase it
more substantially in the near future35. The National Telecommunications and Information Administration,
however, defined “basic broadband service” as advertised download speeds of 3 Mbps and advertised upload
speeds of 768 Kbps in 201336.
Broadband also comes in a range of delivery mechanisms including Digital Subscriber Line, Cable Modem,
Fiber, Wireless, Satellite and Broadband-Over-Power-Lines37. Digital Subscriber Line or DSL utilizes copper
telephone lines to transmit data. Despite using telephone lines, DSL is distinct from dial up as it can be used
34 (Quintana, 2015) 35 (FCC, February 2015) 36 (Neville, 2013) 37 (FCC, n.d.)

Broadband in FAR 2 Areas 16
without interfering with telephone use. Nationwide, approximately 74% of the population has access to DSL38
and approximately 19% of internet subscribers use DSL39. In non-urban40 areas, approximately 27% of
subscribers use DSL.
Cable modems use coaxial cables, used for television transmissions, to provide internet access. Nationwide,
about 87% of the population has access to cable modem broadband and approximately 51% of internet
subscribers use cable modem technology. In non-urban areas, approximately 39% of subscribers use cable
modem broadband.
Fiber optic technology allows for the transmission of data through light waves at very high speeds. Nationwide,
20% of the population has access to fiber optic Broadband and 8% of internet subscribers use fiber optic
Broadband. In non-urban areas, approximately 4% of internet subscribers use fiber optic Broadband.
Wireless broadband technology utilizes radio frequencies to transmit data between users and service
providers. Wireless providers can either be fixed or mobile. Fixed wireless service uses a stationary transmitter
to provide broadband. These can be long or short range and are the basis for public wifi networks. Importantly,
these are often used in rural or remote areas where wireline infrastructure is lacking or prohibitively difficult to
provide. Nationwide, approximately 34% of the population has access to fixed wireless broadband. Mobile
wireless service is typically provided by cell phone servicers at slower speeds than fixed wireless or wireline
broadband. Approximately 92% of the US population has access to mobile wireless broadband and
approximately 8% of internet subscribers use mobile wireless broadband alone. An additional 25% of
subscribers use mobile wireless broadband in conjunction with a primary fixed or wireline broadband
technology. In non-urban areas approximately 11% of internet subscribers use mobile wireless broadband
alone.
A variant of wireless broadband is satellite broadband which transmits data wirelessly through satellites rather
than radio and cell towers. Nationwide, approximately 4% of internet subscribers use satellite broadband while
8% of subscribers in non-urban areas use satellite broadband. Satellite broadband can be particularly useful
for remote areas as it requires little to no infrastructure and is widely available however it suffers from
relatively slow and inconsistent transmission speeds and is prone to interference by severe weather.
Broadband over powerline (BPL) is an emerging delivery mechanism that utilizes existing power lines to provide
internet service. This technology is highly promising but is not widely used to date.
CHALLENGES OF BROADBAND IN RURAL AREAS: EXPENSE, GEOGRAPHY, LACK OF
DEMAND
When providing broadband in rural areas, many challenges arise such as expense, geography, and lack of
demand compared to urban areas. This lack of access is referred to as the digital divide. Expense can be
directly related to topography and lack of demand. If a household or institution is located in a remote area,
there is less likely to be infrastructure in place to provide speedy and affordable internet access. There is often
not enough profit for service providers to build and maintain the infrastructure. When service providers do
manage to provide broadband, it is most likely at a higher price and slower speed than in urban areas.
Sharon Strover, professor at the University of Texas and director of the Telecommunications and Information
Policy Institute, says that speedy internet service could save people money when it comes to basic services
38 (NTIA, May 2013) 39 (US Census Bureau, 2014) 40People not in census designated “urban areas”

Broadband in FAR 2 Areas 17
such as renewing a driver’s license or pursuing higher education. Fast internet is necessary to take video-
based online classes and to sign up for health care, such as on healthcare.gov. Rural hospitals use broadband
to video-conference with urban medical specialists.41 Those who lack internet access miss out on online
commerce, an important and growing part of our economy.
The topography of an area can greatly affect access to broadband. For example, in the rural West, two million
people lack broadband access due to mountains and narrow valleys. These geological features can block
signals from wireless towers and satellites and make it difficult to install fiber optic cables. Also, when
broadband is available, there is often one provider which creates a lack of competition. This combined with
lack of government incentives and the high cost of installing fiber optic cable in remote areas results in lower
quality service at higher prices. According to the FCC, hundreds of millions of dollars in federal stimulus money
has been spent over the past few years in an effort to provide more fixed broadband in rural areas. However,
there are still 14 million people in rural areas that lack broadband access. Those who lack access to fixed
broadband often use their mobile device instead. However, this limits the range of activities that can be done
online, and can be costly due to overage charges.42
Access to the internet does not guarantee usage, and this is not just due to cost. In rural areas, there tends to
be a lack of knowledge of what the internet is and its benefits. However, there are economic benefits when
rural residents use broadband. According to the NTIA, 47% of people cite lack of need or interest as a reason
for not using the internet. They view the internet as not relevant to their lives and do not believe the internet
could benefit their way of life.43 Twenty-four percent of people stated broadband was too expensive, and 15%
lacked an adequate computer. Some people do not know how to use a computer, and therefore do not know
how to use various online services. In a 2013 study, Sharon Strover found there is more rapid income growth
and slower growth of unemployment in rural counties where over 60% of people used broadband than
comparable counties where fewer people used the internet.44
INEQUITIES OF BROADBAND IN RURAL AREAS
In addition to having less access to broadband overall, non-urban areas have lower levels of use of the faster
and more advanced broadband technologies (fiber optic and cable modem) and have higher levels of use of
slower and less reliable technologies like DSL, wireless and satellite internet service. In 2015, while
approximately 17% of Americans lacked access to broadband, 53% of rural Americans did45. Additionally, rural
areas tend to have far fewer providers in the same place as non-rural areas yielding a lack of options for
consumers and higher prices due to lack of competition46. A 2015 study by the White House Council of
Economic Advisors found a positive correlation between population density and wireline broadband
competition, particularly in medium and low density areas. Moreover, the majority of economic benefits from
broadband in rural and frontier areas have not gone to rural areas; approximately 66% of economic activity and
54% of job creation resulting from rural broadband goes to urban areas47.
41 (Guerin, 2014) 42 (FCC, 2016) 43 (NTIA, 2013) 44 (Guerin, 2014) 45http://www.lightreading.com/services/broadband-services/fcc-rural-broadband-progress-slowing/d/d-id/720719 46 (FCC, March 2010) 47 (Kuttner, 2016)

Broadband in FAR 2 Areas 18
Rural small businesses also experience a broadband gap48. While 2% of small businesses lack access to
broadband nationwide, 8% of rural small businesses lack access to broadband. Moreover, 11% more rural
small businesses are unsatisfied with their internet service than urban small businesses. Rural businesses are
also consistently less satisfied with the price they pay for internet and more likely to be willing to pay more for
faster service.
FIGURE 1: GAP BY CENSUS BLOCKS ORDERED BY POPULATION DENSITY (SOURCE NEEDED)
In 2010, the FCC found that an estimated 7 million households lacked “access to terrestrial broadband
infrastructure capable of meeting the National Broadband Availability Target of 4 Mbps download and 1 Mbps
upload”49 Of these, over 4 million had no broadband capability whatsoever50. The study found that an
investment gap of $23.5 billion existed across the United States. This gap represents the amount of money it
would take to make up the difference between the present value of the capital and operating costs of providing
broadband infrastructure to all unversed households and the present value of the revenue stream generated
by service provision. Broken down into census blocks, a clear inverse relationship was revealed between
population density and the investment gap in each block. Exhibit 1-C from the study (Figure 1) displays this
relationship. Counties and census blocks with the lowest population densities have the highest investment
gaps by margins approaching a tenfold difference between the two extremes. As can be seen in Exhibits 1-I
and 4-AQ, the largest investment gaps appear largely in frontier counties and states as do the majority of
“highest gap housing units.”
48 (Columbia Telecommunications Corp, 2010) 49 (FCC, April 2010) 50 (Beede and Neville, 2013)

Broadband in FAR 2 Areas 19
FIGURE 2: INVESTMENT GAP PER HOUSING UNIT BY LOWEST-COST TECHNOLOGY FOR EACH
COUNTY (SOURCE NEEDED)

Broadband in FAR 2 Areas 20
FIGURE 3: LOCATION OF HIGHEST-GAP HOUSING UNITS (SOURCE NEEDED)

Broadband in FAR 2 Areas 21
This gap widens even further in the most rural areas. A 2013 NTIA study found that “very rural” census blocks,
characterized by population density and geographic location, had substantially lower rates of broadband
availability at all speed levels than all other census blocks51. This “availability gap” between very rural and
other census blocks can be expressed as the difference in the percentage of population with access to
broadband at a specific downstream speed tier. The gap between very rural and “suburban” census blocks,
which consistently had the best service, was roughly 35% at 3 Mbps (NTIA benchmark for “Basic Broadband
Service”), 57% at 25 Mbps (current FCC benchmark for “Advanced Telecommunications Capability) and 35% at
100 Mbps (National Broadband Plan's 2020 benchmark). In relative terms, very rural census blocks had
availability rates of two-thirds, one-fourth and one-twelfth that of suburban census blocks at 3 Mbps, 25 Mbps
and 100 Mbps, respectively. Importantly, very rural census blocks have an average population density of 11
people per square mile. As such, it is likely, particularly considering the trend revealed in this study and its
observation that “a community's proximity to a Metropolitan Statistical Area (MSA) is often more closely
associated with higher broadband speeds than is population density alone”, that the availability gap in remote
and frontier census blocks is even larger.
Recent accounts have variously stated that the rural-urban broadband gap is growing5253, stagnant or closing
at a slowing rate54 but have reached a tenuous consensus that it is not closing as quickly as it had been. An
emerging argument cites growing evidence that broadband adoption is more important than broadband
availability55. This theory argues that while the supply of broadband in rural areas falls short of that of urban
areas, it still outstrips demand for broadband service. A 2015 analysis revealed that differences in broadband
availability explains only 38% of the “adoption gap.56” FCC research reveals that in 2010, “35% of [adult]
Americans do not use broadband at home.57” Further, 22% of Americans do not use the internet at all. Of non-
adopters, 36% cite cost as a factor. Only 5% of non-adopters cited a lack of availability as their primary reason
for not having broadband. This strongly supports the notion that adoption, rather than availability, drives the
digital divide. While 71% of rural Americans have access to broadband, only 50% (compared to 68% nationally)
actually use it. A lack of availability was, however, the most cited reason for non-adoption among rural non
adopters and was cited more often on a percentage basis than among urban and suburban non adopters.
BROADBAND IN TRIBAL AREAS
Race and ethnicity are correlated with disparities in broadband use and home access. 57% of Hispanic
households and 55% of Black households have broadband at home. This is in stark contrast to Asian and
White households. Eighty-one percent of Asian households and 72% of White households had broadband at
home.58 According to the Pew Research Center, rates of Latino internet use are similar in urban, suburban and
rural areas.59 The biggest disparity exists between Native American populations living on reservations and
other Americans.
Less than 10% of homes on tribal lands have broadband internet service. Navajos are the largest tribal group
in the United States, and have been largely disconnected from the rest of the American economy.60 About 40%
51 (Whiteacre, 2013) 52 (Whiteacre, 2016) 53 (Gallardo, 2015) 54 (FCC, January 2016) 55 (Gallardo, 2015) 56 (Whiteacre, Strover, Gallardo, July 2015) 57 (Horrigan, 2010) 58 (NTIA, 2011) 59 (Livingston, 2011) 60 (Smith, 2012)

Broadband in FAR 2 Areas 22
of Navajos live in poverty, and according to the census the median household income is just $24,000. Nearly
one quarter of Navajo people are unemployed, and the high school graduation rate is approximately 30%. In
theory, the internet was supposed to mitigate some of these issues. The internet would allow for Navajo
students to take online classes instead of having to travel long distances to attend school, and allow patients
to speak with doctors via video conference, increasing the convenience of medical care. Some health care
providers on the Navajo reservation do not have internet, which prohibits them from being able to look up
medical records. This has led to the wrong combination of medication being prescribed to patients. Those on
reservations can miss out on employment opportunities because they cannot connect to the internet to check
email. The internet could also alleviate poverty by allowing Navajo artisans to sell their famous handcrafted
rugs online.
Young members of the Navajo Nation are particularly impacted by the lack of internet. College students suffer
because they cannot get a broadband connection on the reservation.61 Connections are unreliable or
nonexistent. The lack of internet connectivity is also driving younger members to leave the reservation because
they want to experience what the rest of the country has. Older Navajos tend to be unsympathetic and do not
understand the urgency to be online. However, lack of connectivity impacts all members considering the fact
that without internet service, tribes cannot apply for federal grants as many of the applications are now online.
Broadband companies lack incentive to install infrastructure on tribal lands. As in other rural areas, this is
because such sparse population yields a lack of profits. On the Navajo reservation, there are only six people
per square mile, as compared to 27,000 people per square mile in New York City. However, the federal
government has subsidized telecom companies that serve tribal lands with grants and loans. This has made it
possible for some tribes to become their own internet providers. However the process can be complicated due
to the fact that tribes are sovereign nations with their own set of laws. To install broadband infrastructure,
companies have to obtain approval from the Bureau of Indian Affairs. This involves environmental and
archaeological reviews, which can take at least two years to assess. The Huffington Post article “On Tribal
Lands, Digital Divide Brings New Form of Isolation,” states that Sacred Wind Communications in Albuguerque
has brought telecommunications services to about 3,600 Navajo households, but is struggling to expand
further because of the necessity of federal approval.62 This shows that despite tribes being able to become
their own internet provider, it can be a long process that puts them behind much of the country.
BENEFITS OF BROADBAND IN RURAL AREAS
The economic impacts of broadband are large and well documented63, particularly in rural areas6465 Distance
learning and telemedicine, for example, allow frontier dwellers to overcome the traditional challenges of
distance and lack of service providers fulfill important needs. Telehealth is defined by the Health Resources
and Services Administration as “the use of electronic communication and information technologies to provide
or support long-distance clinical health care, patient and professional health-related education, public health,
and health administration.”66 Telehealth serves as an umbrella for a variety of health related activities,
including telemedicine, which refers specifically to the provision of clinical services via telecommunications
technology. Telehealth and telemedicine offer benefits to frontier residents including minimizing travel time
and expense for patients and healthcare providers, allowing those who may otherwise not seek healthcare
services due to prohibitive time and expense constraints to do so, give patients access to a wider range of
61 (ibid) 62 (ibid) 63(Connected Nation, 2012) 64 (Whiteacre, Strover, Gallardo, February 2015) 65 (Katz, Avila, Meille, 2011) 66 (National Advisory Committee on Rural Health and Human Services, 2015)

Broadband in FAR 2 Areas 23
services and options and generally improve the level of care. Due to the wide range of activities encompassed
under the realm of telehealth, there is no one standard for broadband access and service.
TELEMEDICINE AND DISTANCE LEARNING
Importantly, only 11% of healthcare related community anchor institutions in frontier counties have download
speeds meeting the speed requirement for rural health clinics and small primary care practices and fewer than
30% meet the speed requirements for a solo primary care practice67.
The rural-urban broadband gap is particularly severe in healthcare. Healthcare facilities in rural areas have less
access to high speed broadband than their urban counterparts by a margin that has widened greatly in recent
years68. This gap is especially prominent among smaller, non-hospital healthcare providers that may be more
critical to healthcare in frontier communities. While rural and urban hospitals utilize telehealth at relatively
similar rates, they do so in different ways69. Rural hospitals were more likely to use telehealth for emergency
care and radiology but less likely to use it for other purposes.
Distance learning is another promising application for broadband in the frontier. At the primary and secondary
school level, distance learning can help schools expand their curriculum offerings by connecting students to
resources that cannot be provided on campus or nearby. Postsecondary distance learning lets students in
remote areas take classes online. This way they can enroll in institutions anywhere without leaving their home.
Students who otherwise would not be able to obtain quality higher education can use distance learning to
study what they want, where they want, when they want. Distance learning involves a variety of applications
and technologies including electronic textbooks, online notes, lectures and course materials, synchronous
videoconferencing, interactive instruction and online discussion forums70. These applications demand widely
different speed levels. Reading an electronic textbook requires far less bandwidth than streaming a lecture or
participating in an interactive digital classroom in which all students must be able to keep up and
communicate seamlessly.
Telecommuting represents another emerging use for broadband in frontier areas. Telecommuting allows
workers to access a greater range of employment opportunities and avoid the time and expense of commuting.
According to the Small Business Administration, 44% of rural small businesses allow telecommuting and 28%
“would encourage more telecommuting if employees had very-high-speed internet that could support
videoconferencing and other advanced features.” While a slightly smaller proportion of rural small businesses
permit telecommuting than urban small businesses, a slightly higher proportion would encourage more if there
were improved broadband capacity.
FEDERAL FUNDING
Slowly but surely federal entities have been trying to rectify the broadband gap in rural America. Nonprofits,
Native American Tribes, and health and education institutions are eligible for the following grants:
67 (National Broadband Map, 2015) 68 (Whiteacre, Wheeler, Landgraf, 2016) 69 (Ward, Ullrich, Mueller, 2014) 70 (Lai et al, 2004)
Broadband in FAR 2 Areas 24
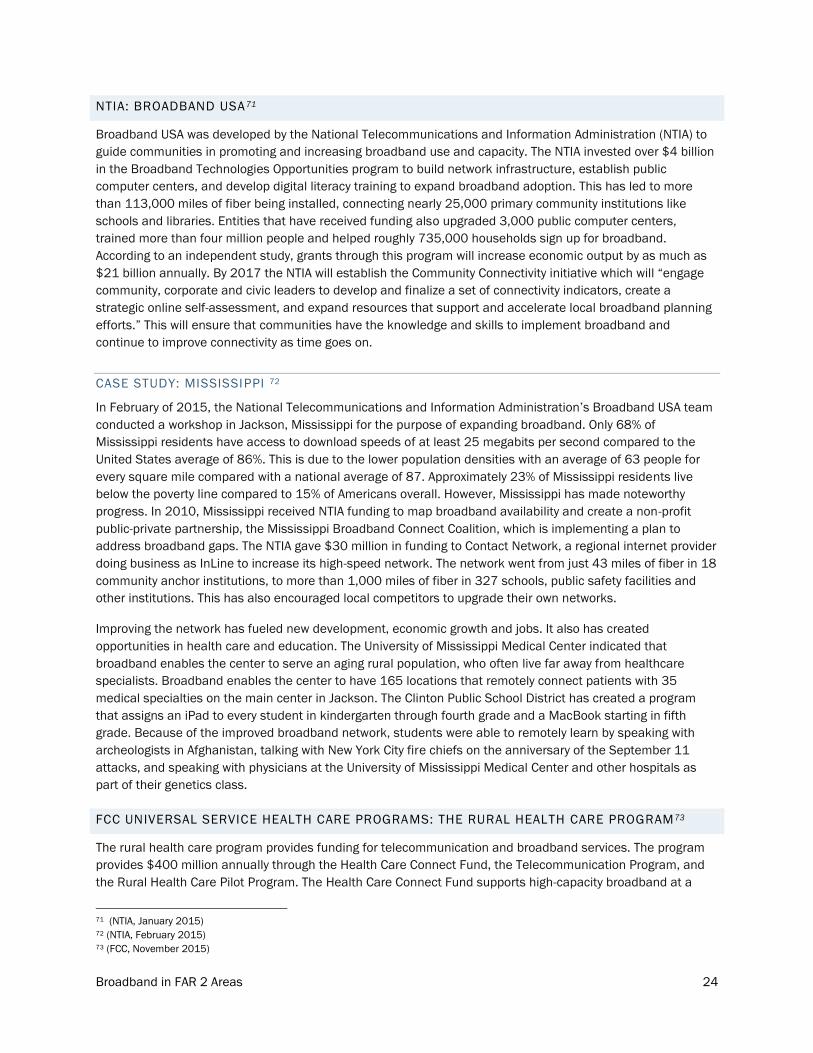
NTIA: BROADBAND USA71
Broadband USA was developed by the National Telecommunications and Information Administration (NTIA) to
guide communities in promoting and increasing broadband use and capacity. The NTIA invested over $4 billion
in the Broadband Technologies Opportunities program to build network infrastructure, establish public
computer centers, and develop digital literacy training to expand broadband adoption. This has led to more
than 113,000 miles of fiber being installed, connecting nearly 25,000 primary community institutions like
schools and libraries. Entities that have received funding also upgraded 3,000 public computer centers,
trained more than four million people and helped roughly 735,000 households sign up for broadband.
According to an independent study, grants through this program will increase economic output by as much as
$21 billion annually. By 2017 the NTIA will establish the Community Connectivity initiative which will “engage
community, corporate and civic leaders to develop and finalize a set of connectivity indicators, create a
strategic online self-assessment, and expand resources that support and accelerate local broadband planning
efforts.” This will ensure that communities have the knowledge and skills to implement broadband and
continue to improve connectivity as time goes on.
CASE STUDY: MISSISSIPPI 72
In February of 2015, the National Telecommunications and Information Administration’s Broadband USA team
conducted a workshop in Jackson, Mississippi for the purpose of expanding broadband. Only 68% of
Mississippi residents have access to download speeds of at least 25 megabits per second compared to the
United States average of 86%. This is due to the lower population densities with an average of 63 people for
every square mile compared with a national average of 87. Approximately 23% of Mississippi residents live
below the poverty line compared to 15% of Americans overall. However, Mississippi has made noteworthy
progress. In 2010, Mississippi received NTIA funding to map broadband availability and create a non-profit
public-private partnership, the Mississippi Broadband Connect Coalition, which is implementing a plan to
address broadband gaps. The NTIA gave $30 million in funding to Contact Network, a regional internet provider
doing business as InLine to increase its high-speed network. The network went from just 43 miles of fiber in 18
community anchor institutions, to more than 1,000 miles of fiber in 327 schools, public safety facilities and
other institutions. This has also encouraged local competitors to upgrade their own networks.
Improving the network has fueled new development, economic growth and jobs. It also has created
opportunities in health care and education. The University of Mississippi Medical Center indicated that
broadband enables the center to serve an aging rural population, who often live far away from healthcare
specialists. Broadband enables the center to have 165 locations that remotely connect patients with 35
medical specialties on the main center in Jackson. The Clinton Public School District has created a program
that assigns an iPad to every student in kindergarten through fourth grade and a MacBook starting in fifth
grade. Because of the improved broadband network, students were able to remotely learn by speaking with
archeologists in Afghanistan, talking with New York City fire chiefs on the anniversary of the September 11
attacks, and speaking with physicians at the University of Mississippi Medical Center and other hospitals as
part of their genetics class.
FCC UNIVERSAL SERVICE HEALTH CARE PROGRAMS: THE RURAL HEALTH CARE PROGRAM73
The rural health care program provides funding for telecommunication and broadband services. The program
provides $400 million annually through the Health Care Connect Fund, the Telecommunication Program, and
the Rural Health Care Pilot Program. The Health Care Connect Fund supports high-capacity broadband at a
71 (NTIA, January 2015) 72 (NTIA, February 2015) 73 (FCC, November 2015)

Broadband in FAR 2 Areas 25
65% discount for health care providers. The Rural Healthcare Pilot Program supports statewide and regional
broadband health care provider networks with an 85% discount, and is being replaced by the Health Care
Connect Fund. The Health Care Connect Fund provides support to a consortium of public and non-profit health
care providers. After June 2014, the Telecommunications Program will no longer provide internet funding, and
will provide telecommunications funding.74 This can be applied for through The Rural Health Care Fund. The
telecommunications program makes sure that rural health care providers pay no higher than the highest
tariffed or publicly available commercial rate for similar service in the closest city in the state with a population
of 50,000 or more people, taking distance charges into account. 75
CASE STUDY: MAINE76
In 2006, The FCC selected 69 sites covering 42 states and 3 US territories to participate in the Rural Health
Care Pilot Program. This included the Rural Western and Central Maine Broadband Initiative. This included 7
sites spanning 4 Maine counties, and the New England Telehealth Consortium, which includes 305 sites over a
three-state area (Maine, New Hampshire, and Vermont). One hundred eleven of these sites are in Maine. $417
million was granted over three years to pay for 85% of eligible costs of building the broadband networks. This
included implementing the information services provided over the networks and connecting them to primary
national providers. This allowed for the consortia to purchase services and build their own broadband
infrastructure. This did not include administrative costs, which proved to be expensive.
However, there was a lead time of several years between award and disbursement. The funding did not cover
administrative costs, which were high because of inefficiencies and regulatory hurdles. The FCC is seeking to
resolve this issue in the administration of the new Healthcare Connect Fund. So far two rural healthcare
consortia in Maine have received a total of $6.6 million in funding to plan and create a broadband networks
that connect primarily nonprofit healthcare centers in Maine, New Hampshire, and Vermont.
USDA:THE RURAL BROADBAND ACCESS LOAN AND LOAN GUARANTEE PROGRAM77
The Rural Broadband Access Loan and Loan Guarantee Program (Broadband Program) furnishes loans and
loan guarantees to provide funds for the costs of infrastructure for providing broadband in eligible rural areas.
The purpose of the program is to lend to organizations that are capable of paying back loans. Also entities
should implement service that can keep up with upgrades in technology, while meeting the demands of
customers in rural America.
CASE STUDY: NEVADA78
KeyOn Communications, Inc. received a $10.1 million award to install 4G, last-mile wireless broadband and
digital phone service in 39 of the most rural communities in Nevada. The Reno-Sparks Indian Colony, Inc. was
awarded $400,000, which will enable to tribe to offer wireless broadband service to communities in a rural
reservation in Hungry Valley. The Rural Telephone Company was also awarded a $2.4 million grant/loan
project. This will extend ADSL2+ high speed broadband service to existing and new customers in the North
Fork, Tuscarora, and Jarbidge Nevada service areas. Lastly, the Arizona Nevada Tower Corporation was
awarded $7.75 million to enable the company to offer microwave radio backbone and middle- mile system to
provide significant bandwidth to wireless internet service providers, anchor institutions and businesses.
Reliable internet will be provided and enhancement of the fiber optic cable network to those living outside of
74 (USAC, n.d.) 75 (FCC, December 2015) 76 (ConnectME, 2014) 77 (USDA, n.d.) 78 (Nevada Broadband, 2010)

Broadband in FAR 2 Areas 26
Washoe and Clark counties. This includes approximately 41,000 people and 186 businesses and community
institutions in 15 service areas.
USDA: DISTANCE LEARNING AND TELEMEDICINE GRANT 7980
The DLT is a competitive national grant, with a minimum grant amount of $50,000 and a maximum grant
amount is $500,000. Funding must be used for telecommunications-enabled information, audio and visual
equipment, and advanced technologies that allow for educational and medical applications in rural areas.
Grant applications must demonstrate matching contributions (in cash or in kind) of at least 15% of the total
amount of financial assistance provided.
CASE STUDY: UTE MOUNTAIN UTE TRIBE RESERVATION AND PYRAMID LAKE PAIUTE TRIBE81
$259,428 of grant funds were awarded for a distance learning project located in the Ute Mountain Ute Tribe
reservation (Towaoc, Colorado & White Mesa, Utah), which includes college and career readiness courses
along with degree programs in health care. This is especially important because there is a growing need for
professionals in this field for the over 20 hospitals in the region. The project will connect the Ute Mountain
Learning Center and the White Mesa Education Center with Utah State University Blanding campus, Southwest
Colorado Community College, and San Juan College. A total of $377,772 of grant funds were awarded to the
Pyramid Lake Paiute Tribe to provide telepharmacy services to eight remote pharmacies in Sutcliff, Nixon,
Wadsworth, McDermitt, Shurz, and Duckwater in Nevada. This is especially important because there is a
shortage of pharmacists in the Pyramid Lake Paiute’s tribal region.
USDA: COMMUNITY CONNECT PROGRAM 8283
This program is aimed at funding broadband implementation in rural communities where it is not economically
feasible for private sector providers to deliver service. The $100,000-$3,000,000 grant funds can be used for
the construction, acquisition, or leasing of infrastructure and facilities for the provision of broadband to all
residential and business customers located within the grant application’s proposed service area, including
funding for up to ten computer access points to be used in a local community center. Funds towards the
Community Center will be limited to 10% of the requested grant amount. The grant allows for funding to
provide broadband free of charge to locations defined as Critical Community Facilities for two years.
CASE STUDY: ALASKA84
Arctic Slope Telephone Association Cooperative, Inc. in the Point Hope Community was awarded $1,418,502
to the Point Hope Proposed Funded Service Area to construct a broadband network for residents and
businesses. ASTAC will provide the following services: high speed internet, local telephone service and custom
calling features, long distance telephone service, and Ethernet transport services. The funding will also enable
ASTAC to plan for the Point Hope access network to install an undersea fiber connection in 2016-2017.
79 (USDA, n.d.) 80 (USDA, 2016) 81 (USDA, 2015) 82 (USDA, n.d.) 83 (USDA, 2014) 84 (USDA, 2015)

Broadband in FAR 2 Areas 27
HRSA: TELEHEALTH PROGRAMS85
The Health Resource and Service Administration offers grants through The Office for the Advancement of
Telehealth (OAT) in the Federal Office of Rural Health Policy (FORHP). This encourages the use of telehealth
technologies for health care delivery, education, and health information services. Telecommunications
technology allows clinical care to be performed from a distance. Telehealth is especially critical in rural and
other remote areas that lack sufficient health care services, especially specialty care. HRSA has the following
Telehealth grant opportunities:
TELEHEALTH NETWORK GRANT PROGRAM (TNGP)
TNGP funds are used for projects that use of telehealth networks to improve healthcare services for medically
underserved populations. The goal is to help build the human, technical, and financial capacity to implement
sustainable telehealth programs and networks. Networks can be used to:
● Expand access to, coordinate, and improve the quality of health care services;
● Improve and expand the training of health care providers; and/or
● Expand and improve the quality of health information available to health care providers, patients,
and their families.
TELEHEALTH RESOURCE CENTER GRANT PROGRAM (TRC)
The TRC program awards grants to implement and continue operation of resource centers so that health care
organizations, networks, and health care providers can create cost-effective telehealth programs to serve rural
and medically underserved areas and populations.
EVIDENCE-BASED TELE-EMERGENCY NETWORK GRANT PROGRAM (EB TNGP)
The EB TNGP supports implementation and evaluation of telehealth networks that deliver 24-hour emergency
department consultation service to rural providers that lack emergency care specialists. The EB TNGP supports
programs that track a significant volume of patient encounters to facilitate detailed analysis of patient
outcomes in rural areas.
RURAL VETERANS HEALTH ACCESS PROGRAM (RVHAP)
To deliver services to veterans in rural areas, RVHAP focuses on regional approaches, including networks,
health information exchange, telehealth, and/or telemedicine. The RVHAP provides funding to enhance mental
health services for veterans of Operation Iraqi Freedom and Operation Enduring Freedom, including:
● Crisis intervention and diagnostic assessments;
● Detection of post-traumatic stress disorder;
● Traumatic brain injury; and
● Other mental health conditions associated with veterans.
85 (HRSA, 2015)

Broadband in FAR 2 Areas 28
RURAL CHILD POVERTY TELEHEALTH NETWORK GRANT PROGRAM (RCPTNGP))
Supports established telehealth networks in the delivery of social services such as early childhood
development counseling, food and nutrition support and job counseling to rural areas.
RURAL HEALTH NETWORK DEVELOPMENT PLANNING PROGRAM86
The purpose of the Network Planning program is to assist in the creation of an integrated healthcare network.
Health care networks can be an effective strategy to help smaller rural health care providers and health care
service organizations align resources and strategies, achieve economies of scale and efficiency, and address
challenges more effectively as a group than as single providers. This can be done by “identifying a strategy to
leverage broadband connectivity to support health information technology applications in rural communities.
This may include developing partnerships to leverage broadband funding through the Federal Communications
Commission Health Care Connect program and the United States Department of Agriculture Broadband
Program.”87
CASE STUDY: CALIFORNIA88
California Telehealth Network has been awarded a $1.3 million Health Resources and Services Administration
(HRSA) grant which will be implemented by the California Telehealth Resource Center (CTRC) to expand
telehealth training and support for rural and medically underserved clinics and hospitals in California. CTRC will
collaborate with Telehealth Resource Centers across the country to provide assistance to California hospitals,
clinics, public and private health plans and community entities wanting to create and maintain telemedicine
and eHealth programs, collaboratives, and networks of care. CTRC will continue to provide quality webinars on
telehealth topics, host regional workshops, and will present a statewide conference on telehealth. CTRC is
currently working in partnership with the California Telehealth Network and the UC Davis Broadband
Technology Opportunities Program’s 15 Model eHealth Communities, as well as UC Irvine and UC San
Francisco as they extend their telehealth networks and services throughout the state.
GIS ANALYSIS
The following maps depict broadband service and access across the frontier in FAR 2 Counties based upon
data from the FCC and the National Broadband Map. Importantly, these maps and the statistics therein refer to
maximum advertised speeds which are typically higher than actual speeds, often by substantial margins89.
86 (HRSA, n.d.) 87 (ibid.) 88 (California Telehealth Network, 2012) 89 (Molla, 2014)

Broadband in FAR 2 Areas 29
This map depicts
the percentage of
residents in frontier
counties with
access to download
speeds of at least
1.5 Mbps. This
speed is adequate
for streaming
standard definition
video.
Approximately 99%
of frontier residents
have access to
download speeds at
this level compared
to nearly 100% of
residents
nationwide.
This map depicts
the percentage of
residents in frontier
counties with
access to download
speeds of at least 3
Mbps. This speed is
adequate for
streaming high
definition video.
Approximately 99%
of frontier residents
have access to
download speeds
at this level
compared to nearly
100% of residents
nationwide.

Broadband in FAR 2 Areas 30
____________-
This map depicts
the percentage of
residents in
frontier counties
with access to
download speeds
of at least 10
Mbps. This speed
is adequate for
videoconferencing
and E-
Government.
Approximately
97% of frontier
residents have
access to
download speeds
at this level
compared to 99%
of residents
nationwide.
_________-------
This map depicts
the percentage of
residents in
frontier counties
with access to
download speeds
of at least 25
Mbps. This
standard
represents the
FCC “Advanced
Telecom.
Capability”
Benchmark, the
working definition
of broadband
adopted in 2015.
Approximately
73% of frontier
residents have
access to
download speeds
at this level
compared to
nearly 85% of
residents
nationwide.
Broadband in FAR 2 Areas 31
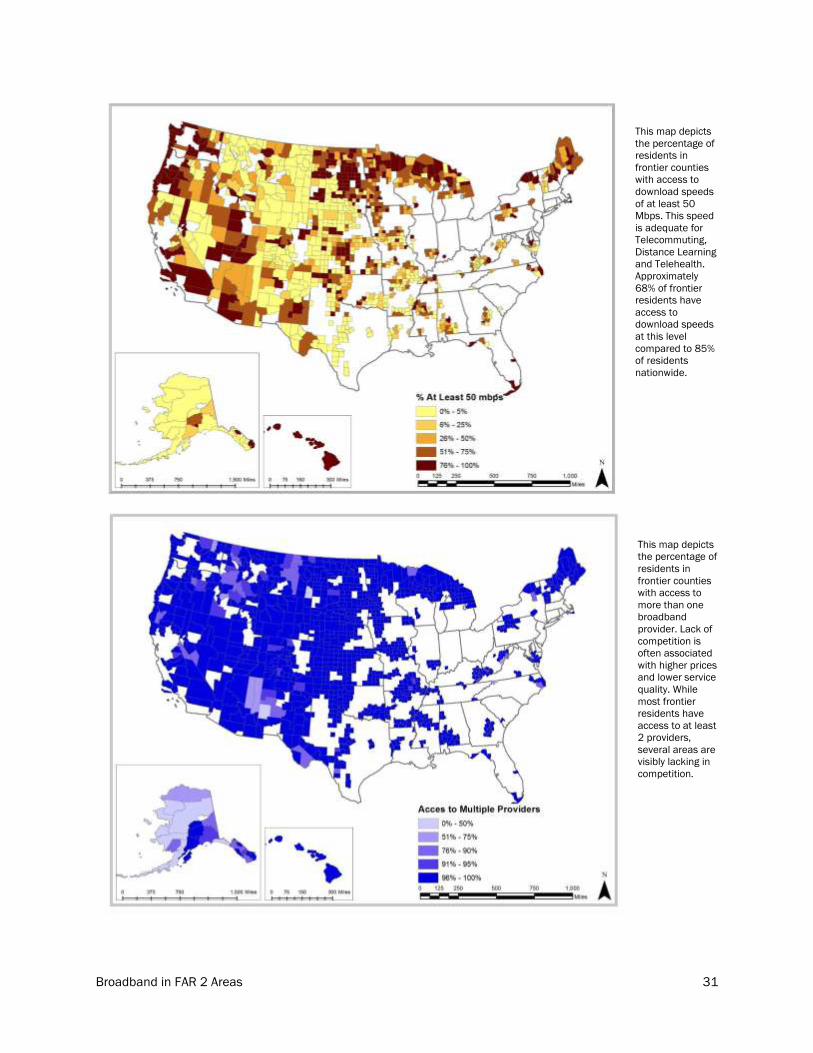
This map depicts
the percentage of
residents in
frontier counties
with access to
download speeds
of at least 50
Mbps. This speed
is adequate for
Telecommuting,
Distance Learning
and Telehealth.
Approximately
68% of frontier
residents have
access to
download speeds
at this level
compared to 85%
of residents
nationwide.
This map depicts
the percentage of
residents in
frontier counties
with access to
more than one
broadband
provider. Lack of
competition is
often associated
with higher prices
and lower service
quality. While
most frontier
residents have
access to at least
2 providers,
several areas are
visibly lacking in
competition.

Broadband in FAR 2 Areas 32
This map
depicts frontier
Primary and
Secondary
Schools by
Broadband
access and
speed. The FCC
recommends
download
speeds of 1
Gbps for each
1,000
students.
This map
depicts frontier
libraries by
Broadband
access and
speed.
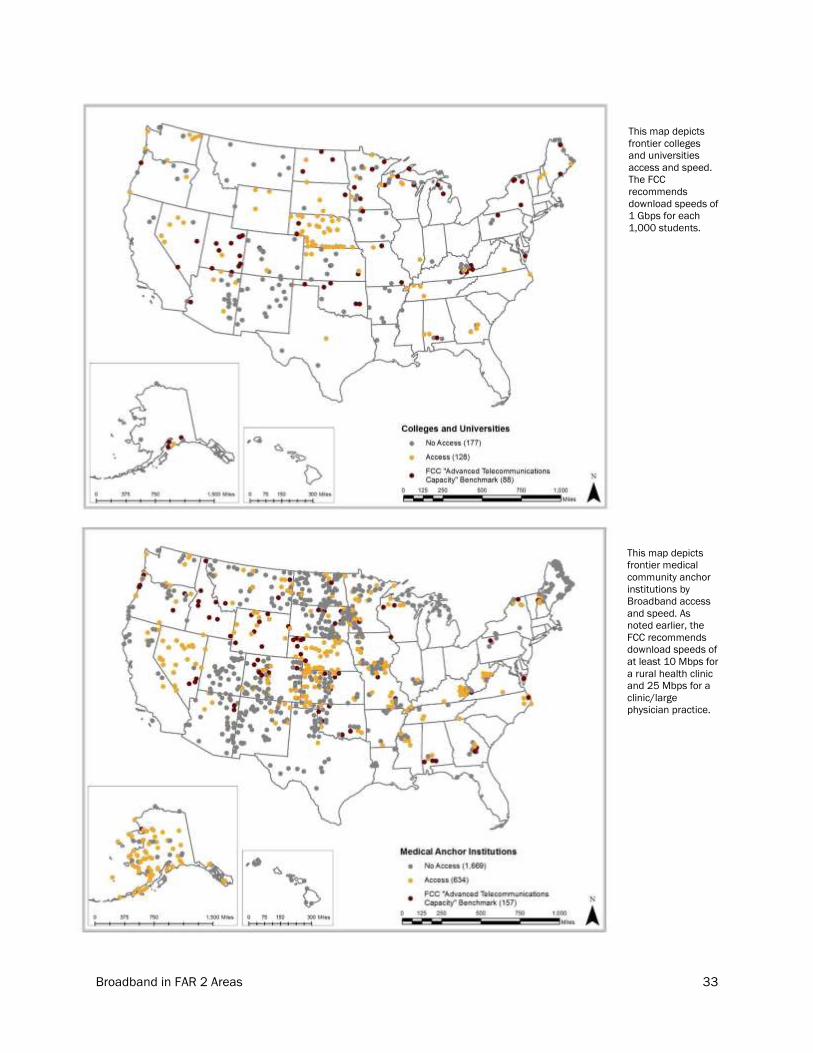
Broadband in FAR 2 Areas 33
This map depicts
frontier colleges
and universities
access and speed.
The FCC
recommends
download speeds of
1 Gbps for each
1,000 students.
This map depicts
frontier medical
community anchor
institutions by
Broadband access
and speed. As
noted earlier, the
FCC recommends
download speeds of
at least 10 Mbps for
a rural health clinic
and 25 Mbps for a
clinic/large
physician practice.

Broadband in FAR 2 Areas 34
This map depicts
the broadband
investment gap
in frontier
counties. As one
can see, the
largest
investment gaps
appear to occur
in the Southwest.
The total
investment gap
for frontier
counties is over
$13 billion or
57% of the total
national $23.5
billion
investment gap.
This map depicts
the broadband
investment gap
per person in
frontier counties.
As one can see,
the largest per
capita
investment gaps
appear to occur
in the
Northernmost
counties. The per
capita
investment gap
in frontier
counties is $360
compared to only
approximately
$74 nationwide
and $36 in non-
frontier counties.

Broadband in FAR 2 Areas 35
This map depicts
the broadband
investment gap
per square mile
in frontier
counties. As one
can see, the
largest
investment gaps
appear to occur
in the
Northernmost
counties. The
investment gap
for frontier
counties is
approximately
$5,500 per
square mile
compared to
approximately
$6,200 per
square mile
nationwide and
$7,300 in non
frontier counties.
This map depicts
access to 25
Mbps download
speeds in
majority nonwhite
counties in the
frontier.
Approximately
81% of residents
of majority
nonwhite
counties have
access to 25
Mbps download
speeds compared
to 73% of
residents of all
frontier counties.

Broadband in FAR 2 Areas 36
CONCLUSION
One can easily see that functional broadband access continues to be a challenge for frontier
communities. While most frontier areas have broadband access at low levels of quality, high speed broadband
is sorely lacking across the frontier. The significant and well documented urban-rural broadband gap grows
even larger when narrowed down to frontier areas. These counties, despite making up only a fraction of the
country’s population, represent the majority of the broadband investment gap and are disproportionately
disinvested compared to the rest of the country. Applications such as distance learning, telecommuting and
telehealth hold enormous potential for improving quality of life and service provision on the frontier, however
many frontier communities lack the necessary level of broadband service.

Broadband in FAR 2 Areas 37
REFERENCES
Beede, David & Neville, Anne. (2013, May). Broadband Availability Beyond the Rural/Urban Divide. NTIA &
Economics and Statistics Administration. Retrieved May 11, 2016 from
https://www.ntia.doc.gov/files/ntia/publications/broadband_availability_rural_urban_june_2011_fin
al.pdf
California Telehealth Network. (2012, September 10). HRSA Awards California Telehealth Network $1.3 Million
to Expand Telehealth Grant will be Implemented by the California Telehealth Resource Center [Press
release]. Retrieved May 10, 2016, from http://www.caltelehealth.org/press-release/hrsa-awards-
california-telehealth-network-13-million-expand-telehealth
Columbia Telecommunications Corporation (2010, November) The Impact of Broadband Speed and Price on
Small Business. https://www.sba.gov/sites/default/files/rs373tot_0.pdf
Connected Nation. (2012, May) The 2012 Jobs and Broadband Report. Retrieved May 11, 2016 from
http://www.connectednation.org/sites/default/files/cn_biz_whitepaper2012_final.pdf
ConnectME Authority, & James W. Sewall Company. (2014). Universal Service Fund (USF) Assessment A Study
on the Impacts and Opportunities of USF Reforms in Maine (pp. 1-89, Rep.). Maine.
Federal Communications Commission. (2010, March). Connecting America: The National Broadband Plan.
Federal Communications Commission. (2010, April) The Broadband Availability Gap. OBI Technical Paper No.
1.
Federal Communcations Commission. (2015, Feb 4). 2015 Broadband Progress Report. Retrieved May 11,
2016 from https://www.fcc.gov/reports-research/reports/broadband-progress-reports/2015-
broadband-progress-report
Federal Communications Commission. (2015, November 5). The FCC's Universal Service Rural Health Care
Programs. Retrieved May 10, 2016, from https://www.fcc.gov/consumers/guides/fcc’s-universal-
service-rural-health-care-program
Federal Communications Commission. (2015, December 18). Rural Health Care Program. Retrieved May 10,
2016, from https://www.fcc.gov/general/rural-health-care-program
Federal Communications Comission, (2016, Jan 28) FCC: Rural Broadband Progress Slowing. Retrieved May
11, 2016 from http://www.lightreading.com/services/broadband-services/fcc-rural-broadband-
progress-slowing/d/d-id/720719
Federal Communications Commission. Fact Sheet: 2016 Broadband Progress Report Chairman’s Draft (pp. 1-
2, Rep.). (n.d.). FCC.
Federal Communications Commission. Types of Broadband Connections. Retrieved May 11, 2016 from
https://www.fcc.gov/general/types-broadband-connections
Whitacre, Brian; Wheeler Denna; Landgraf, Chad. (2016, March 2) What Can the National Broadband Map Tell
Us About the Health Care Connectivity Gap? The Journal of Rural Health. Retrieved May 11, 2016
from http://onlinelibrary.wiley.com/doi/10.1111/jrh.12177/abstract

Broadband in FAR 2 Areas 38
Guerin, E. (2014). Rural Americans have inferior Internet access. Retrieved May 10, 2016, from
https://www.hcn.org/issues/46.2/rural-americans-have-inferior-internet-access
Health Resources and Services Administration Rural Health Network Development Planning Program. (n.d.).
Retrieved May 10, 2016, from
http://www.hrsa.gov/ruralhealth/programopportunities/fundingopportunities/default.aspx?id=3bcf6a
6e-aa56-4d34-8d79-90894f31ea24
Health Resources and Services Administration Telehealth Programs. (2015, November). Retrieved May 10,
2016, from http://www.hrsa.gov/ruralhealth/telehealth/
Horrigan, John. (2010, Feb) Broadband Adoption and Use in America. FCC.
Katz, Raul; Avila, Javier; Meille, Giacomo. (2011, Feb) Economic Impact of Wireless Broadband in Rural
America. Retrieved May 11, 2016 from https://ccamobile.org/wp-
content/uploads/2011/02/Economic-Study-02.24.11.pdf
Kuttner, Hanns. (2016, April). The Economic Impact of Rural Broadband. The Hudson Institute. Retrieved May
11,, 2016 from
https://s3.amazonaws.com/media.hudson.org/files/publications/20160419KuttnerTheEconomicImp
actofRuralBroadband.pdf
Junwen Lai; Elisha Ziskind; Fengzhou Zheng; Yilei Shao; Chi Zhang; Ming Zhang; Nitin Garg; Sumeet Sobti;
Randolph Wang; Arvind Krishnamurthy (2004) Distance Learning Technologies for Basic Education in
Disadvantaged Areas. Retrieved May 11, 2016 from
http://www.cs.princeton.edu/~sobti/papers/gccce04/gccce.pdf
Livingston, G. (2011, February 09). Latinos and Digital Technology, 2010. Retrieved May 10, 2016, from
http://www.pewhispanic.org/2011/02/09/latinos-and-digital-technology-2010/
Molla, Rani. (2014, Apr 21) Is Your Internet Connection Slower than Advertised? Wall Street Journal.
Retrieved May 11, 2016 from http://blogs.wsj.com/digits/2014/04/21/is-your-internet-connection-
slower-than-advertised/
National Advisory Committee on Rural Health and Human Services. (2015, Mar) Telehealth in Rural America.
Retrieved May 11, 2016 from
http://www.hrsa.gov/advisorycommittees/rural/publications/telehealthmarch2015.pdf
National Broadband Map. (2015) Broadbandmap.gov.
Nevada Broadband Preliminary Overview of Broadband Infrastructure & Adoption in Nevada (pp. 1-66, Rep. No.
1). (2010). NV: Connect Nevada.
Neville, Anne. (2013, May 13). NTIA Ecplores Broadband Availability in New Report Series. National
Telecommunications & Information Administration. Retrieved May 11, 2016 from
https://www.ntia.doc.gov/blog/2013/ntia-explores-broadband-availability-new-report-series
NTIA, United States Department of Commerce. (2011, November 9). New Commerce Department Report
Shows Broadband Adoption Rises but Digital Divide Persists [Press release]. Retrieved May 10, 2016,
from https://www.ntia.doc.gov/press-release/2011/new-commerce-department-report-shows-
broadband-adoption-rises-digital-divide-pers

Broadband in FAR 2 Areas 39
NTIA Broadband Adoption Toolkit (pp. 1-61, Rep.). (2013). National Telecommunications and Information
Administration.
NTIA. (2013, May) U.S. Broadband Availability June 2010-June 2012. Retrieved May 11, 2016 from
https://www.ntia.doc.gov/files/ntia/publications/usbb_avail_report_05102013.pdf
NTIA, United States Department of Commerce. (2015, January 14). NTIA Announces BroadbandUSA Effort to
Assist Communities with Broadband Plans[Press release]. Retrieved May 10, 2016, from
https://www.ntia.doc.gov/blog/2015/ntia-announces-broadbandusa-effort-assist-communities-
broadband-plans
NTIA. (2015, February 11). Expanding the Benefits of Broadband in Mississippi | BroadbandUSA - NTIA.
Retrieved May 10, 2016, from http://www2.ntia.doc.gov/node/909
Quintana, C., & Matlock, S. (2015, May 30). High-speed Internet gaps leave rural New Mexicans lacking a
‘basic right’. Retrieved May 9, 2016, from http://www.santafenewmexican.com/life/tech/high-speed-
internet-gaps-leave-rural-new-mexicans-lacking-a/article_a74dc838-a35f-5000-b7da-
0aebd21f8897.html
Smith, G. (2012, April 20). On Tribal Lands, Digital Divide Brings New Form Of Isolation. Retrieved May 10,
2016, from http://www.huffingtonpost.com/2012/04/20/digital-divide-tribal-lands_n_1403046.html
USAC. (n.d.). Rural Health Care. Retrieved May 10, 2016, from http://www.usac.org/rhc/
U.S. Census Bureau. American Community Survey 2014 1-year estimates.
USDA, Rural Utilities Service. (2014, May 29). USDA Announces 2014 Community Connect Grant Program
Application Window and Notice of Funds Availability A Connected Nation Policy Brief [Press release].
Retrieved May 10, 2016, from
http://www.connectednation.org/sites/default/files/bb_pp/cn_policy_brief_-
_fy2014_usda_community_connect_grant_program.pdf
USDA, Rural Development. (n.d.). 2015 Community Connect Broadband Grant Program Award
Summaries [Press release]. Retrieved May 10, 2016, from http://www.rd.usda.gov/files/UTP-
CCProjectSummaries2015.pdf
USDA Community Connect Grants. (n.d.). Retrieved May 10, 2016, from http://www.rd.usda.gov/programs-
services/community-connect-grants
United States Department of Agriculture, Rural Development. (n.d.). Distance Learning and Telemedicine
Awardees 2015 [Press release]. Retrieved May 10, 2016, from
http://www.rd.usda.gov/files/DLTAwardees_2015.pdf
United States Department of Agriculture, Rural Development. (2016, January 21). USDA Makes Distance
Learning Telemedicine Broadband Grants Available [Press release]. Retrieved May 10, 2016, from
http://www.rd.usda.gov/newsroom/news-release/usda-makes-distance-learning-telemedicine-
broadband-grants-available
United States Department of Agriculture. (n.d.). Farm Bill Broadband Loans & Loan Guarantees. Retrieved May
10, 2016, from http://www.rd.usda.gov/programs-services/farm-bill-broadband-loans-loan-
guarantees

Broadband in FAR 2 Areas 40
United States Department of Agriculture Distance Learning & Telemedicine Grants. (n.d.). Retrieved May 10,
2016, from http://www.rd.usda.gov/programs-services/distance-learning-telemedicine-grants
Ward, Marcia; Ullrich, Fred; Mueller, Keith. (2014) Extent of Telehealth Use in Rural and Urban Hospitals.
RUPRI Center for Rural Health Policy Analysis. Retrieved May 11, 2016 from http://www.public-
health.uiowa.edu/rupri/publications/policybriefs/2014/Telehealth%20Utilization.pdf
Whitacre, Brian. (2013, August 14) Digital Gap Widens for Rural Elderly, Poor. The Daily Yonder. Retrieved
May 11, 2016 from ttp://www.dailyyonder.com/digital-gap-widens-some-rural/2013/08/14/6695/
Whitacre, Brian; Gallardo, Roberto; Strover, Sharon. (2015, February) Broadband's Contribution to Economic
Health in Rural Areas. Community and Regional Development Institute. Retrieved May 11, 2016 from
https://cardi.cals.cornell.edu/sites/cardi.cals.cornell.edu/files/shared/documents/ResearchPolicyBri
efs/Policy-Brief-Feb15-draft03.pdf
Whitacre, Brian; Strover, Sharon; Gallardo, Roberto. (2015, July) How much does broadband infrastructure
matter? Decomposing the metro–non-metro adoption gap with the help of the National Broadband
Map. Government Information Quarterly. Retrieved May 11, 2016 from
http://www.sciencedirect.com/science/article/pii/S0740624X15000325
Whitacre, Brian; Wheeler Denna; Landgraf, Chad. (2016, March 2) What Can the National Broadband Map Tell
Us About the Health Care Connectivity Gap? The Journal of Rural Health. Retrieved May 11, 2016
from http://onlinelibrary.wiley.com/doi/10.1111/jrh.12177/abstract
Mental and Behavioral Healthcare Access on the Frontier 41
ACCESS TO MENTAL AND BEHAVIORAL
HEALTH CARE IN FRONTIER AREAS LOAN DAO AND SARAH DEGIORGIS

Mental and Behavioral Healthcare Access on the Frontier 42
TABLE OF CONTENTS
INTRODUCTION .......................................................................................................................................................... 44
The Frontier and Healthcare Professional Shortage Areas ................................................................................. 44
OVERVIEW OF THE CURRENT MENTAL HEALTH CARE LANDSCAPE ....................................................................... 44
Map 1: Mental health professional shortage areas and far 2 Zip Codes ....................................................... 45
Map 2: Frontier Mental Health Professional Shortage Areas and Far 2 Zip Codes ....................................... 45
Demographics ........................................................................................................................................................ 46
Table 1: Educational Attainment in Metro and Nonmetro Areas from 2000-2014 ................................... 46
Mortality ............................................................................................................................................................. 46
Table 2: Rural and Urban Mortality Rates .................................................................................................... 47
Substance Abuse ............................................................................................................................................... 47
Table 3: Trends in Drug Use Among Rural and Urban U.S. Residents Ages 12-17 ................................... 47
Table 4: Trends in Alcohol Use Among Rural and Urban U.S. Residents Ages 12 and older .................... 47
Table 5: Trends in Methamphetamine Drug Use Among Rural and Urban U.S. Residents Ages 12 and
older ................................................................................................................................................................ 48
Table 6: Substance Abuse Among Rural Residents .................................................................................... 48
by Age and Substance Type in 2003 ............................................................................................................ 48
Table 7: Substance Abuse Treatment Admission Rates ............................................................................. 48
Mental Illness ..................................................................................................................................................... 48
Table 8: Any Mental Illness (AMI) Among Persons 18 Years of Age and Older .......................................... 49
Table 9: Past 30-day Serious Psychological Distress (SPD) Among Persons 18 Years of Age and Older 49
Types of Mental Health Care Providers ................................................................................................................ 49
Table 10: Types of Health Care Professionals ............................................................................................. 50
Table 11: Active Physicians per 100,000 People ........................................................................................ 51
CHALLENGES OF PROVIDING MENTAL HEALTH CARE IN FRONTIER REGIONS ..................................................... 51
Geographical Determinants and Long Travel Times ............................................................................................ 51
Poverty .................................................................................................................................................................... 51
Table 12: Poverty Rates by Race in Rural Areas .......................................................................................... 52
Cultural Issues ....................................................................................................................................................... 52
Stigma, Lack of Anonymity, and Stoicism ........................................................................................................ 52
CASE STUDIES OF MENTAL AND BEHAVIORAL HEALTH TREATMENT MODELS IN FRONTIER AREAS .................. 52
Behavioral Health Aides ........................................................................................................................................ 52
Telehealth .............................................................................................................................................................. 53
CONCLUSION AND HEALTH POLICY CONSIDERATIONS ........................................................................................... 53
Behavioral Health Aides Funding .......................................................................................................................... 53
Expand the Ability of Providers to Prescribe Medications ................................................................................... 54

Mental and Behavioral Healthcare Access on the Frontier 43
Telehealth .............................................................................................................................................................. 54
Conclusion .............................................................................................................................................................. 54
References ................................................................................................................................................................. 55

Mental and Behavioral Healthcare Access on the Frontier 44
INTRODUCTION
When looking at access to mental and behavioral health care, the small population in frontier areas translates
to a lack of health care providers. This chapter provides an overview of the state of mental and behavioral
health care access in frontier areas and a review of some innovations in mental and behavioral health care
that may warrant further investigation for use in areas with a shortage of mental health care providers.
Mental health problems are common and undertreated; it is estimated that fewer than half of all people with
mental health issues receive any treatment, and an even smaller proportion receives treatment that meets
acceptable minimal standards90. This is exacerbated in rural areas where there are fewer health care
professionals. Though data show that rural and urban populations have similar rates of clinically defined
mental health problems91, there are both cultural and geographical barriers to entry to mental health care for
rural and frontier residents in addition to a lack of providers. There is evidence that residents of rural and
frontier communities receive less talk therapy (psychotherapy) and more prescribed medications
(pharmacotherapy) than residents of urban areas, most likely due to the lack of mental health care providers in
frontier areas92. It has also been shown that rural areas have higher instances of suicide and substance abuse
than urban areas93. This chapter discusses these issues and provides a preliminary roadmap of ways to
increase access to mental health care in very rural and frontier regions.
THE FRONTIER AND HEALTHCARE PROFESSIONAL SHORTAGE AREAS
The United States Department of Health and Human Services (HHS) designates certain areas as “Health
Professional Shortage Areas” and, beyond that, “Mental Health Professional Shortage Areas” (MHPSAs) based
on geographic area, population, and facilities94. Map 1 shows the counties that are designated as FAR level
two and also the designated Mental Health Professional Shortage Areas. In addition, HHS identifies certain
MHPSAs as “frontier,” though their definition of frontier does not use the FAR methodology. Map 2 shows FAR
2 areas and also MHPSAs that are designated as frontier. Frontier areas are not the only MHPSAs, and we
have considered innovations in mental health care that come from other areas of the country, some
designated MHPSAs.
OVERVIEW OF THE CURRENT MENTAL HEALTH CARE LANDSCAPE
In this section we discuss the current state of mental health care in frontier areas, including demographics of
frontier populations and types of mental health care providers. This section is a broad overview, as frontier
areas can vary significantly in demographics. Due to small population size, any health data on frontier areas
can be hard to obtain. In the absence of true frontier data, we have substituted metro and nonmetro data.
Though a reasonable substitute for purely frontier area data, this data should be taken as estimates.
90 (Hauenstein et al., 2007) 91 (Hartley et al., 2002) 92 (Fortney et al., 2009) 93 (Nayar et al., 2013) 94 (Health Resources and Services Administration, n.d.)

Mental and Behavioral Healthcare Access on the Frontier 45
MAP 1: MENTAL HEALTH PROFESSIONAL SHORTAGE AREAS AND FAR 2 ZIP CODES
MAP 2: FRONTIER MENTAL HEALTH PROFESSIONAL SHORTAGE AREAS AND FAR 2 ZIP CODES

Mental and Behavioral Healthcare Access on the Frontier 46
DEMOGRAPHICS
The American frontier community has a diverse population. Compared to the country as a whole, frontier areas
tend to have a greater number of older (over 65 years) residents and fewer young (under 18 years) residents95.
This presents a challenge for health care access as the needs of an aging population must be addressed. In
addition, residents in frontier areas have lower median incomes but also lower rates of unemployment and
higher literacy rates as compared to the rest of the country. Importantly, though, frontier areas have a higher
proportion of Latino and Native American/American Indian populations and lower proportions of African
American and Asian populations. Frontier communities also have a higher percentage of non-English
speakers96.
In recent years, there has been an increase in the portion of adults with a 4-year college degree (an increase of
4 percentage points from 2000 to 2014). Additionally, the portion of adults without a high school diploma or
equivalent has declined by 9 percentage points. However, there remains a large gap in education between
urban and rural populations97. Table 1 shows the change in educational attainment rates between metro and
nonmetro areas from 2000 to 2014. These factors must be considered when considering access to mental
and behavioral health care in frontier areas. Some additional demographic factors to consider are discussed in
the next sections.
Table 1: Educational Attainment in Metro and Nonmetro Areas from 2000-2014
Nonmetro Less than High
School Diploma
High School
Diploma
Some College or
Associate’s Degree
Bachelor’s Degree or
Higher
2000 24% 36% 25% 15%
2014 15% 36% 30% 19%
Metro Less than High
School Diploma
High School
Diploma
Some College or
Associate’s Degree
Bachelor’s Degree or
Higher
2000 19% 27% 28% 26%
2014 13% 26% 29% 32%
MORTALITY
The health disparities among rural and urban populations are drastic. Rates such as chronic obstructive
pulmonary disease (COPD) are higher among those in rural counties. There are higher rates of suicide in small
rural communities than there are in inner cities. Due to the limited access to psychologists and other mental
health professionals, those living in remote areas do not receive the care they need. Small rural communities
experience a suicide rate of 20% while inner cities experience a suicide rate of 13%. Figure 3 is a comparison
of mortality rates among rural and urban counties. 98 It is worth noting that in every category listed in table 2,
mortality rates are always higher in nonmetro counties. Higher rates of suicide in rural areas may mean that
the prevalence of depression and other mental issues may be underreported in these areas99.
95 (Nayar et al., 2013) 96 Ibid 97 (USDA, US Census Bureau, n.d.) 98 (Rural Health Reform Policy Research Center, 2014) 99 (Hartley et al., 2002)

Mental and Behavioral Healthcare Access on the Frontier 47
Table 2: Rural and Urban Mortality Rates100
Metro Counties Nonmetro Counties
Inner Cities
(Large
Central)
Suburban
(Large
Fringe)
Small Metro
(Population
< 1 million)
Large Rural
(Without a city >
10,000
population)
Small Rural
(With a city >
10,000)
Infant Mortality 6.8 5.7 6.7 6.8 7.0
Chronic Obstructive
Pulmonary Disease
(COPD)*
56.2 60.6 70.9 79.9 81.9
Ischemic Heart
Disease*
192.9 174.9 173.8 197.2 206.5
All Unintentional
Injuries
32.1 33.1 40.8 58.9 52.7
All Motor Vehicle
Traffic-Related
Injuries
7.9 9.3 12.1 23.3 19.5
Suicide 12.8 13.7 16.1 18.2 20.0
Data is per 100,000 Population (* Persons 20 years of age or older)
SUBSTANCE ABUSE
Coupled with this data, research suggests that the number of rural and frontier residents suffering from
substance abuse is increasing. In 1997, roughly 10% of rural residents ages 12 and older reported using
drugs. That figure increased by 3% in 2003, with roughly 13% of rural residents in the same age group
reported using drugs.
Although total trends in drug use among rural residents remain lower those in urban areas, alcohol and
methamphetamine use among rural residents are higher than in urban areas (Tables 4 and 5). In 2003,
alcohol use among rural residents ages 12 to 17 was roughly 5% higher than those in urban areas.
Additionally, methamphetamine use among rural residents ages 12 and older was roughly 0.3% higher in than
in urban areas.
100 (Rural Health Reform Policy Research Center, 2008–2011 data) 101 (NSDUH, 1979-2003) 102 (Samhsa.gov)
Table 3: Trends in Drug Use Among Rural and Urban U.S. Residents Ages 12-17101
1979 1985 1991 1997 2003
Rural 15% 13% 11% 10% 13%
Urban 22% 21% 13% 12% 15%
Table 4: Trends in Alcohol Use Among Rural and Urban U.S. Residents Ages 12 and older102
1979 1985 1991 1997 2003
Rural 52% 52% 35% 20% 31%
Urban 55% 50% 36% 29% 26%

Mental and Behavioral Healthcare Access on the Frontier 48
Table 5: Trends in Methamphetamine Drug Use Among Rural and Urban U.S. Residents Ages 12 and
older103
1999 2000 2001 2002 2003
Rural 48% 42% 70% 71% 78%
Urban 54% 40% 58% 66% 49%
There are many factors that can contribute to substance abuse, including untreated mental health issues. It is
important to consider the possibility that substance abuse rates mask other behavioral and mental health
issues in addition to their complication in other areas of concern like overdose and suicide.
Rates of substance abuse vary among different age groups. For example, young adults tend to have higher
rates of substance abuse than older adults. Table 6 shows residents ages 18 to 25 have higher rates of
substance abuse compared to residences ages 26 or older.
It bears keeping in mind that surveys asking about
substance abuse suffer from respondent bias, so
these numbers should not be used to draw strong
conclusions. However, substance abuse treatment
admission rates do show some disparities between
metro and nonmetro areas. Table 7 shows that
communities in small rural areas have lower
substance abuse treatment admission rates compared to those in metropolitan areas. Table 7 makes clear
that residents of small rural areas are admitted to substance abuse treatment programs less frequently than
residents of metro areas.
Table 7: Substance Abuse Treatment Admission Rates105
Metro Counties Nonmetro Counties
Inner Cities
(Large
Central)
Suburban
(Large
Fringe)
Small Metro
(Population <
1 million)
Large Rural
(Without a city
> 10,000
population)
Small Rural
(With a city >
10,000)
Alcohol 247.8 245.2 292.7 326.8 250.3
Opiates 175.0 172.5 142.8 127.3 90.4
Cocaine 75.8 43.6 53.7 38.2 21.7
Marijuana 128.9 99.9 137.2 162.8 112.0
Stimulants 48.7 21.5 50.1 57.9 45.8
*Admissions per 100,000 population- age-adjusted
MENTAL ILLNESS
Data show that mental health issues are slightly more prevalent in rural areas. The shortage of mental health
professionals is a major problem. Additionally, cultural considerations like stigma, lack of anonymity and
stoicism can inhibit frontier residents’ use of mental health care. According to the National Survey on Drug Use
and Health (NSDUH), any mental illness (AMI) includes persons 18 or older who currently or at any time in the
103 (Samsha.gov) 104 (Scholars.unh.edu) 105 (Rural-Urban Chartbook, 2014)
Table 6: Substance Abuse Among Rural Residents
by Age and Substance Type in 2003104
Age Alcohol Drugs Alcohol and
Drugs
12-17 7% 5% 10%
18-25 18% 8% 20%
26 and older 6% 3% 7%

Mental and Behavioral Healthcare Access on the Frontier 49
past year who have been diagnosable mental, behavioral, or emotional disorders. The total rates of any mental
illness in small rural areas are higher than in inner cities by 2%.
Table 8: Any Mental Illness (AMI) Among Persons 18 Years of Age and Older106
Metro Counties Nonmetro Counties
Inner Cities
(Large
Central)
Suburban
(Large
Fringe)
Small Metro
(Population <
1 million)
Large Rural
(Without a city
> 10,000
population)
Small Rural
(With a city >
10,000)
Men 13.9 14.1 15.2 15.1 15.2
Women 19.9 20.6 22.8 23.9 23.1
Total 17.0 17.5 19.0 19.6 19.2
Additionally, serious psychological distress (SPD) is an indicator of nonspecific psychological distress that is
constructed from a scale administered to adults ages 18 and older by NSDUH. This scale gathers information
on how frequently a respondent experiences symptoms of psychological distress over the last 1 month in the
past year when he or she was at his or her worst emotionally.
Again, data show that residents living in small rural counties experience serious psychological distress (SPD) at
a slightly higher rate than those in inner cities. Serious psychological distress is higher among women than
men in all regions. For example, 7% of women in small rural communities experience distress while 5% of men
experience distress.
Moreover, the national percentage of adults with serious psychological distress (SPD) was lower in metro
counties and the highest in nonmetro counties. More specifically, the regional data shows that the number of
adults who had SPD in the south was higher in nonmetro counties than in metro counties.
Table 9: Past 30-day Serious Psychological Distress (SPD) Among Persons 18 Years of Age and Older107
Metro Counties Nonmetro Counties
Inner Cities
(Large
Central)
Suburban
(Large
Fringe)
Small Metro
(Population <
1 million)
Large Rural
(Without a city
> 10,000
population)
Small Rural
(With a city >
10,000)
Men 4.1 3.5 4.1 4.6 4.9
Women 5.6 4.5 6.1 6.7 6.5
Total 4.8 4.0 5.1 5.7 5.7
TYPES OF MENTAL HEALTH CARE PROVIDERS
When looking at the state of mental health care on the frontier, it is important to consider all the providers who
may be involved in mental health care. We have compiled a list of both licensed and unlicensed providers who
may provide mental health care below.
The National Alliance on Mental Illness (NAMI) lists types of health care professionals who can and do provide
mental health treatment. Some can prescribe medication while others provide therapy.
106 (Rural-Urban Chartbook, 2014) 107 (Rural-Urban Chartbook, 2014)

Mental and Behavioral Healthcare Access on the Frontier 50
Table 10: Types of Health Care Professionals108
Name Degree Ability to prescribe
medication?
Ability to provide
therapy? Notes
Primary Care
Physicians MD Yes No
Psychiatrists MD Yes Yes
Clinical Psychologists PhD or PsyD Depends on the
state Yes
School Psychologists
Psychiatric or Mental
Health Nurse
Practitioners
MA or PhD Depends on the
state Yes
Clinical Social Workers MA No Yes
Social Workers BA or BS No Yes
Counselors Varies No Yes
Pastoral Counselors Varies No Yes
Can be members of the
Association of Pastoral
Counselors (AAPC)
Peer Specialists Certification No Yes
Peer specialists have
personally experienced
mental and behavioral
health issues
Psychiatric
Pharmacists Varies No Yes
Usually work in
conjunction with a
physician
It is important to recognize that many types of professionals (and non-professionals) can provide mental and
behavioral health care. Since frontier areas have fewer licensed mental and behavioral health providers, it
might be necessary to rely on some of these non-licensed providers. NAMI points out that many Primary Care
Physicians (PCPs) provide mental and behavioral health care in areas with a mental health professional
shortage. Though PCPs can prescribe medication, they are not trained to diagnose and treat mental disorders
and a specialized trained psychiatrist is preferable in mental and behavioral health cases109. Although not
specialists, PCPs can and do provide a large amount of mental and behavioral health care.
The supply of physicians is a direct influence on healthcare. The shortage of health professionals forces
patients to travel farther to receive service. Although the number of health professionals has risen in the last
decade, many health professionals choose to practice in more populated urban areas. In 2010, differences in
physicians practicing in specialized fields such as neurology, anesthesiology, and psychiatry where the most
disparate. Central counties of metropolitan areas had roughly 263 specialists per 100,000 populations while
most rural counties had only 30 per 100,000. Additionally, the number of total physicians in small rural regions
is 77 per 100,000 populations while the number in inner cities is 380.5 per 100,000 populations.
108 (National Alliance on Mental Illness, n.d.) 109 (NAMI)

Mental and Behavioral Healthcare Access on the Frontier 51
Table 11: Active Physicians per 100,000 People110
Metro Counties Nonmetro Counties
Inner Cities
(Large
Central)
Suburban
(Large
Fringe)
Small Metro
(Population <
1 million)
Large Rural
(Without a city
> 10,000
population)
Small Rural
(With a city >
10,000)
General and family
practitioners
27.0 24.5 34.2 29.6 31.6
Pediatricians 25.1 20.1 15.6 8.8 3.7
General Internists 49.6 37.1 30.5 17.9 8.9
Obstetricians and
Gynecologists
16.0 12.4 11.4 7.5 3.0
Other Specialists 262.8 174.2 169.1 80.1 30.2
All Physicians 380.5 268.4 260.8 143.9 77.3
The lack of health insurance and access to care are also factors leading to an increase in mental health
problems in rural America. National data from the year 2011 shows that residents in rural counties were more
likely to be uninsured (23 percent) than those in metropolitan areas (19 percent). Though studies have shown
that a lack of insurance does not have a significant impact on the utilization of mental health care services111,
it is a disparity between urban and rural areas that cannot be ignored.
CHALLENGES OF PROVIDING MENTAL HEALTH CARE IN FRONTIER REGIONS
Many factors such as geographical limitations and social stigmas, those facing drug addiction and other health
problems are less likely to seek help. Conflicts between community values and professional guidelines can also
limit services and resources. This section seeks to explore those areas in more detail.
GEOGRAPHICAL DETERMINANTS AND LONG TRAVEL TIMES
The geographic context of Frontier areas results in isolation, smaller population size, and limited access to
specialized jobs. As previously stated, frontier areas often suffer from a lack of specialized mental and
behavioral health care providers. Clinicians often work far from peers and patients while facing geographic
barriers. Access to sufficient roads and public transportation such as buses, trains, or taxi services make it
difficult for patients to seek medical attention112. Increasing transportation infrastructure may not be a priority
for frontier residents, but improved ride sharing services or shuttles for elderly people may warrant
consideration in the future.
POVERTY
The poverty level in frontier areas, specifically child poverty, has increased in recent years. The child poverty
rate increased from 22% in 2007 to 26% in 2014 (based on income, size, and family composition). 113 Minority
racial and ethnic groups experience the most poverty in frontier areas. From 2007 to 2009, these groups saw
an increase in poverty rates; the poverty rate among Latinos increased the most (by 2 percentage points).
110 (Rural Health Reform Policy Research Center, 2008–2011 data) 111 (Deen et al., 2012) 112 (NSDUH) 113 (USDA, 2015)

Mental and Behavioral Healthcare Access on the Frontier 52
Table 11 shows the change in poverty rate among all racial and ethnic groups from 2007 to 2014. Poverty can
mean the inability to pay for doctor’s visits and medications, and also a higher probability of being uninsured.
All of these factors need to be considered when studying mental health care use and access.
CULTURAL ISSUES
Cultural issues related to mental health care and frontier residents can largely be divided into three main
groups: stigma, lack of anonymity, and stoicism. Of course these are not the only cultural issues; religion and
general culture play a part as well. For this report we have chosen to focus on the three issues listed above
because they seem to be the most prevalent from our literature review.
STIGMA, LACK OF ANONYMITY, AND STOICISM
Assessing “stigma” around mental health care issues is hard to do, and especially hard when it comes to
frontier areas. One study did specifically ask survey participants about stigma using the statement “My friends
and family will think I am crazy if I see a counselor or therapist” to which respondents answered “yes” or “no.”
This study tested participants’ views on a lack of anonymity with the statement “My friends and neighbors will
know if I see a counselor of therapist” to which respondents answered “yes” or “no.” Stoicism was assessed
using the following statement: “My problems are my own business” to which respondents answered “yes” or
“no115.” It is unclear if the methods used in this study skewed the results or not (the authors point out that
since this study asked about prior mental health care usage, the results may be limited because of temporal
biases.) Nonetheless, the study found that these cultural issues of stigma, lack of anonymity, and stoicism do
not significantly predict lower mental health care utilization116. This does not mean that these cultural issues
do not exist and mental and behavioral treatment providers should be sensitive to these and other cultural
issues when practicing in frontier areas.
CASE STUDIES OF MENTAL AND BEHAVIORAL HEALTH TREATMENT MODELS IN
FRONTIER AREAS
In this section, we discuss mental and behavioral treatment options that may not have been explored in some
frontier areas. Though we recognize that all frontier areas are very different, these case studies may warrant
further investigation for use in frontier areas with a lack of mental and behavioral health professionals.
BEHAVIORAL HEALTH AIDES
The Behavioral Health Aide (BHA) model offers a new way of providing mental and behavioral health care that
could apply to frontier areas. BHAs expand the mental health care workforce by employing local residents
114 (USDA, US Census Bureau, n.d.) 115 (Deen et al., 2012) 116 Ibid.
Table 12: Poverty Rates by Race in Rural Areas114
White Black or African
American
American
Indian or
Alaskan
Native
White, non-
Latino
Latino
2007 14% 34% 31% 13% 28%
2014 16% 37% 33% 13% 27%

Mental and Behavioral Healthcare Access on the Frontier 53
instead of bringing in outside mental health professionals. BHAs have significant differences from traditional
mental and behavioral health care:
o BHAs practice in the community, making them easier to access
o Since BHAs come from the same community as their patients, their level of cultural understanding is
high
o BHAs often educate the community about behavioral health so as to reduce stigma117
Though there are numerous types of BHAs, we want to focus on one that may be particularly well-suited to
frontier areas with different cultural issues: Peer Counselors or Peer Specialists. Peer Counselors are people
who have experienced a certain behavioral health issue and who have received training in how to use their
experiences to counsel and help others experiencing something similar.118 As van Hecke (2012) and others
note, Peer Counselors can be particularly helpful in situations of cultural sensitivities, including stigma around
mental and behavioral issues119. By sharing their experiences of mental and behavioral treatment, Peer
Counselors may be very useful for patients who can be skeptical of mental health professionals or who just feel
more comfortable talking to a peer. We urge frontier area mental and behavioral health clinics to utilize the
peer counseling method as a way to access underserved populations.
TELEHEALTH
Though face-to-face contact is best for diagnoses and treatment of mental and behavioral health issues,
telehealth may be of use in areas with a lack of mental health care providers. In addition to diagnoses,
telehealth could prove important in provider-to-provider interactions120 – for instance, if a PCP sees a patient
with a behavioral or mental health issue that is outside their scope of expertise, that PCP could compare notes
with experts in that field via telehealth.
An issue with telehealth is that it is not always covered by insurance. Reimbursement policies need to be
modified in order to improve the business case for delivering evidence-based psychotherapy to rural patients via
telephones, video and computer121. For frontier areas lacking behavioral and mental health providers, a case
could be made for telehealth as a partial substitute for these providers as long as the area has sufficient internet
or broadband access.
CONCLUSION AND HEALTH POLICY CONSIDERATIONS
Though far from experts on health policy and especially frontier-specific health policy, we wanted to provide
some ideas for moving forward. We think that Behavioral Health Aides, increased prescribing ability, and
telehealth should be explored further for their applicability to frontier areas. Brief concluding remarks on those
three issues follow.
BEHAVIORAL HEALTH AIDES FUNDING
A big hurdle for the Behavioral Health Aide model is funding. Studies have shown that Behavioral Health Aides
are less expensive than traditional, licensed providers122, which may help make a case for increased funding.
117 (Van Hecke, 2012) 118 (Van Hecke, 2012) 119 Ibid 120 (Grube et al, 2016) 121 (Fortney, et al, 2009) 122 (Berner et al, 2014)

Mental and Behavioral Healthcare Access on the Frontier 54
Though licensed providers are important, we argue that Behavioral Health Aides could be very helpful in
frontier areas and areas where cultural competency of licensed providers might be a concern. Behavioral
Health Aides are particularly useful in frontier areas because of these cultural issues, and that aspect of the
Behavioral Health Aide model should be emphasized when seeking funding.
EXPAND THE ABILITY OF PROVIDERS TO PRESCRIBE MEDICATIONS
Nonlicensed providers should be able to prescribe in areas, like frontier areas, with few licensed physicians.
Though medication is not the answer to all behavioral and mental health issues, it is helpful in many cases and
expanding access to medications has the potential to help a lot of people living in areas where licensed
providers may be long drives away.
TELEHEALTH
Telehealth needs to be covered by insurance in order to make it a viable alternative for use in frontier areas.
Although not all residents of frontier areas have health insurance, making telehealth services able to be
covered by insurance would still be beneficial to frontier residents. There are many applications for telehealth
that have not been explored in this chapter that may prove helpful for people in frontier areas, including
patients and health care providers. When considering frontier-specific health policy, telehealth has the
potential to provide many services for a relatively small amount of money as long as the broadband
infrastructure is already in place.
CONCLUSION
We hope this chapter serves as a helpful overview for behavioral and mental health care access in frontier
areas. Though challenging, increased behavioral and mental health care access is possible in remote areas. It
bears keeping in mind that urban and densely populated areas will always have more health care providers
because of the greater population. But those living in frontier areas should be able to access health care
services as their urban counterparts do. This chapter covers some of the challenges and innovations for
successful frontier behavioral and mental health care access.

Mental and Behavioral Healthcare Access on the Frontier 55
REFERENCES
Berner, E. S., Burkhardt, J. H., Panjamapirom, A., & Ray, M. N. (2014, November). Cost Implications of Human
and Automated Follow-up in Ambulatory Care. The American Journal of Managed Care, 20(Special
Issue), 531-540.
Bushy, A. (2009). A Landscape View of Life and Health Care in Rural Settings. Dartmouth College Press, 16-38.
Retrieved from https://geiselmed.dartmouth.edu/cfm/resources/ethics/chapter-02.pdf.
Deen, T. L., Bridges, A. J., McGahan, T. C., & Andrews III, A. R. (2012). Cognitive Appraisals of Specialty Mental
Health Services and their Relation to Mental Health Service Utilization in the Rural Population. The
Journal of Rural Health(28), 142-151.
Fortney, J. C., Harman, J. S., Xu, S., & Dong, F. (2009). Rural-Urban Differences in Depression Care. Boulder,
CO: Western Interstate Commission for Higher Education, Mental Health Program.
Grube, M., Kaufman, K., Clarin, D., & O'Riordan, J. (2016, January). Health Care on Demand: Four Telehealth
Priorities for 2016. Healthcare Financial Management: Journal of the Healthcare Financial
Management Association, 70(1), 42-51.
Hartley, D. P., Britain, C., & Sulzbacher, S. P. (2002). Behavioral Health: Setting the Rural Health Research
Agenda. The Journal of Rural Health, 18(S), 242-255.
Hauenstein, E. J., Petterson, S., Rovnyak, V., Merwin, E., & Heise, B. W. (2007, May). Rurality and Mental
Health Treatment. Administration and Policy in Mental Health and Mental Health Services Research,
34(3), 255-267.
Health Resources and Services Administration. (n.d.). Mental Health HPSA Designation Overview. Retrieved
April 10, 2016, from US Department of Health and Human Services:
http://bhpr.hrsa.gov/shortage/hpsas/designationcriteria/mentalhealthhpsaoverview.html
Morgan, A. (2002). A National Call to Action: CDC's 2001 Urban and Rural Health Chartbook. J Rural Health The
Journal of Rural Health, 18(3), 382-383. doi:10.1111/j.1748-0361.2002.tb00900.x
Nayar, P. M., Yu, F. P., & Apenteng, B. A. (2013). Frontier America's Health System Challenges and Population
Health Outcomes. The Journal of Rural Health, 29, 258-265.
Results from the 2013 National Survey on Drug Use and Health: Summary of National Findings. (2014). U.S.
Department Of Health And Human Services Substance Abuse and Mental Health Services
Administration Center for Behavioral Health Statistics and Quality. Retrieved from
http://www.samhsa.gov/data/sites/default/files/NSDUHresultsPDFWHTML2013/Web/NSDUHresults
2013.pdf
Substance Use Disorder and Serious Psychological Distress, by Employment Status. (2006). The NSDUH
Report, (38). Retrieved from http://archive.samhsa.gov/data/2k6/employDual/EmployDual.pdf
USDA Economic Research Service. (2015, April 15). Frontier and Remote Area Codes. Retrieved March 26,
2016, from United States Department of Agriculture Economic Research Service:
http://www.ers.usda.gov/data-products/frontier-and-remote-area-codes.aspx

Mental and Behavioral Healthcare Access on the Frontier 56
van Hecke, S. (2012). Behavioral Health Aides: A Promising Practice for Frontier Communities. National Center
for Frontier Communities and the Frontier and Rural Expert Panel.

Food Insecurity on the Frontier 57
FOOD INSECURITY ON THE FRONTIER MARLANA MOORE, CHANNING BICKFORD & DANIEL BURTON

Food Insecurity on the Frontier 58
TABLE OF CONTENTS
Estimating Food Insecurity on the Frontier .............................................................................................................. 59
Table 1: Estimating Food Insecurity on the Frontier .................................................................................... 60
Food Insecurity in Frontier Counties ......................................................................................................................... 61
Table 2: Descriptive Statistics for Food Insecurity in Frontier Counties ..................................................... 61
Table 3: Food Insecurity and Child Food Insecurity by Frontier County ...................................................... 61
Map 1 - Food Insecurity in Frontier Counties, 2013 ........................................................................................ 62
Poverty & Frontier Counties .................................................................................................................................. 62
Table 4: Top Poverty Rates in Frontier Counties .......................................................................................... 63
Map 2: Poverty Rates in Frontier Counties, 2013 ........................................................................................... 63
Map 3: Persistent Poverty in Frontier Counties, 2013 .................................................................................... 64
Unemployment & Frontier Counties ..................................................................................................................... 65
Map 4: Unemployment in Frontier Counties, 2013 ......................................................................................... 65
Table 5: Top Frontier Counties by Unemployment ....................................................................................... 66
SNAP Rates & Frontier Counties ........................................................................................................................... 66
Map 5: SNAP Rates in Frontier Counties, 2013 .............................................................................................. 66
Table 6: Top Household Snap Rates in Frontier Counties ........................................................................... 67
Racial Breakdown of Food Insecurity in Frontier Counties ..................................................................................... 67
Table 7: Top 10 Frontier Counties with Highest African American Populations by Percent ...................... 67
Map 5: Percent Non-White in frontier counties, 2013 .................................................................................... 68
Distribution By Race: African American ................................................................................................................ 68
Table 8: Top 10 Frontier Counties with Highest African American Populations by Percent ...................... 69
Map 6: Percent African American in Frontier Counties, 2013 ........................................................................ 69
Case Study: Lower Mississippi Delta Region ....................................................................................................... 69
Distribution By Race: American Indian/ Alaska Native Population..................................................................... 70
Table 7: Top 10 Frontier Counties with Highest American Indian / Alaska Native Population by Percent
........................................................................................................................................................................ 70
Map 7: Percent American Indian / Alaska Native, 2013 ................................................................................ 71
Distribution By Ethnicity: Hispanic Population ..................................................................................................... 71
Table 9: Top 10 Frontier Counties with Highest Hispanic Population by Percent ...................................... 71
Map 8: Percent Hispanic / Latino ..................................................................................................................... 72
Conclusion .................................................................................................................................................................. 73
References ................................................................................................................................................................. 74

Food Insecurity on the Frontier 59
INTRODUCTION
To be food secure means to have access to healthy, affordable and culturally appropriate food at all times. We
normally discuss food security in context to the individuals who are food insecure, those who struggle to
nourish themselves and their families; we see this in hunger, malnutrition, and the inability of individuals and
families to get enough to eat. Isolated in remote, low density areas, frontier communities face additional
challenges that can make even accessing food incredibly difficult. For example, someone with a very low
income may be far from an emergency food provider or a county office to apply for SNAP benefits. Feeding
America, a nationwide network of food banks that provides research on food insecurity, determined the
national food insecurity rate in 2013 to be 16%. Over 400 counties with frontier communities have food
insecurity rates above the national average.
In order to establish an understanding of food insecurity, we used 2013 data from the US Census Bureau’s
American Community Survey (ACS) 5-year Estimates, USDA ERS’s county-level persistent poverty data, and
Feeding America’s Map the Meal Gap study. Feeding America conducts an annual study called Map the Meal
Gap which looks at hunger at a local level based on determinants of food insecurity such as poverty,
unemployment, and median income from the Current Population Survey, ACS, and Bureau of Labor
Statistics.123 Because Feeding America’s annual data over the past five years saw no statistically significant
changes, we used the most recent year for which data was available. In order to get a clearer idea of how food
insecurity intersects with other variables, we first gave each county a set ranking (FI Rank) based on the food
insecurity rate (FI Rate).
Our analysis had several major findings:
Over 1 million people living in frontier communities are food insecure;
Majority minority counties tend to have higher rates of food insecurity;
Counties with majority African American or American Indian/Alaska Native populations tend to face
the highest food insecurity rates; and
The Lower Mississippi Delta is the area of greatest concern on the frontier.
ESTIMATING FOOD INSECURITY ON THE FRONTIER
The frontier is a large and varied place, with various scales of geography and populations spread out across
the country. The USDA provides counts of the frontier population in every zip code, even if the entire zip code is
not designated as being on the frontier. However, the smallest geographic area at which food insecurity rates
are calculated is at the county level, and zip codes often overlap county boundaries. Census data is also not
calculated at the zip code level. In order to create a national estimate of food insecurity on the frontier, we
summed the 2010 counts of FAR 2 populations at the state level (the earliest year FAR 2 data was available)
and applied the 2010 Feeding America state level food insecurity rate. This ensures we are not missing
individuals who could be overlooked due to the location of zip code boundaries. Because food insecurity levels
for specific frontier communities could likely be higher than the state level data, this estimate should be
123 From Feeding America: “Data Sources: Feeding America (FA) uses the Current Population Survey (CPS) survey data to assess the
relationship between food insecurity and determinants of food insecurity at the state level. FA selected these variables because of their
availability at the county, congressional district, and state level and included unemployment rates, median income, poverty rates,
homeownership rates, African American percentage of the population, and Hispanic percentage of the population. Researchers drew
County and congressional district level data from the American Community Survey (ACS), with the exception of the unemployment data,
which came from the Bureau of Labor Statistics (BLS). For the child food-insecurity estimates, we use data restricted to households with
children for all variables except the unemployment rate, which includes the full population of the county.”

Food Insecurity on the Frontier 60
viewed as conservative. The estimate also provides an overview of which states have the most people living in
frontier communities and which have higher rates of food insecurity. It is important to provide this general
overview because our later data analysis uses rates as opposed to estimates of the frontier population at the
county level.
Table 1: Estimating Food Insecurity on the Frontier
State FI Rate FAR 2 Pop # FI State FI Rate FAR 2 Pop # FI
AK 15% 214,228 31,358 MT 15% 223,190 32,466
AL 19% 142,076 27,305 NC 20% 112,882 22,080
AR 19% 311,471 59,745 ND 8% 205,188 15,773
AZ 19% 316,229 59,999 NE 13% 174,285 23,213
CA 17% 222,983 38,230 NH 11% 62,410 6,785
CO 16% 449,521 69,745 NJ 14% 295 40
CT 14% 132 18 NM 19% 235,228 43,459
DE 13% 183 23 NV 18% 121,671 21,265
FL 19% 43,708 8,372 NY 14% 174,628 24,829
GA 20% 134,435 26,803 OH 18% 1,481 267
HI 14% 106,824 14,908 OK 18% 304,207 53,769
IA 13% 289,689 38,780 OR 18% 178,668 31,249
ID 17% 116,433 19,829 PA 15% 135,627 19,743
IL 15% 97,824 14,720 RI 15% 61 9
IN 16% 8,207 1,328 SC 19% 11,246 2,111
KS 15% 296,533 44,440 SD 13% 246,547 30,943
KY 17% 294,136 50,785 TN 18% 108,795 19,109
LA 17% 54,641 9,135 TX 19% 308,966 57,161
MA 12% 10,555 1,298 UT 17% 169,149 28,755
MD 13% 2,328 298 VA 12% 84,502 10,451
ME 15% 171,125 25,556 VT 14% 79,938 11,271
MI 19% 509,563 96,613 WA 16% 163,150 25,868
MN 12% 546,816 62,683 WI 13% 196,631 26,125
MO 17% 401,258 68,670 WV 15% 80,745 11,835
MS 22% 203,565 44,349 WY 12% 226,336 27,571
Grand Total 8,550,289 1,361,141
Our analysis, summarized in Table 1, estimates a total of 1.4 million food insecure people in frontier
communities. 8.5 million Americans live in FAR 2 conditions, accounting for 3% of the country’s population.
Michigan and Colorado have the highest estimates of FAR 2 food insecure individuals, while Michigan and
Minnesota have the largest frontier populations. The frontier states with the highest food insecurity rates are
largely located in the South (Mississippi, Georgia, North Carolina, Arkansas, Alabama, and Florida) while
Arizona, Michigan, and New Mexico follow close behind.
Food insecure people in frontier communities account for 15.9% of the total frontier population, which is very
close to the national average of 15.8%. Because these percentages are so close to the national average, we
cannot say that frontier communities are on the whole more food insecure than the country at large. We can
look more closely at different scales of geography and different characteristics to explore how food insecurity
manifests itself on the frontier.

Food Insecurity on the Frontier 61
FOOD INSECURITY IN FRONTIER COUNTIES
Food insecurity has a number of different indicators, including poverty, unemployment, high food costs and
lack of access to programs such as the Supplemental Nutrition Assistance Program (SNAP, formerly Food
Stamps). Hunger and poverty are generally more prevalent in rural areas compared with urban areas. Rural
areas face challenges such as higher un- and underemployment, lower levels of education, lack of available
childcare and public transportation, and an overall lack of access to resources. 124 Because frontier
communities are the most isolated of rural areas, the effects associated with these challenges are much more
severe. To uncover a clearer picture of food insecurity, we looked at food insecurity rates, persistent poverty,
unemployment and other demographic data in counties that contain frontier communities, hereafter referred
to as frontier counties.
We also included information about food insecurity in children, who disproportionately experience food
insecurity and poverty. As children are some of the most vulnerable members of our society, it is important to
understand how food insecurity affects children. Feeding America calculates food insecurity rates overall as
well as for children. The problems children retain due to food insecurity will follow them through their lives.
Food insecure children face hunger and numerous health
challenges that affect their education as well as their future job
readiness prospects.125
Across frontier counties, food insecurity tends to be normally
distributed, with the mean and median slightly below the national
average of 15.8% (Table 2). These distributions have a clear
spatial and racial component, which we will explore in later in our
analysis. Looking at food insecurity regionally, counties in the
South tend to have the highest rates of food insecurity, followed by the Southwest. While we will explore race in
another section, counties with the highest overall rates of food insecurity tend to be majority minority, with high
percentages of African American or Native American populations.
The most food insecure frontier counties are concentrated in the Lower Mississippi Delta, with the exception of
Wilcox County, Alabama (Table 3). This concentration of food insecurity is intense; approximately one in three
people in these counties do not know where their next meal is coming from. Frontier counties with high rates of
child food insecurity are not spread across Arizona, South Dakota, Texas, Alaska and Georgia. The most food
secure frontier households are geographically concentrated in North Dakota: 40 of the top 50 most food
secure frontier counties are located in North Dakota.
124 (Feeding America, 2016) 125 (Cook and Jeng, 2009)
Table 2: Descriptive Statistics for Food
Insecurity in Frontier Counties Maximum 33%
Minimum 4%
Mean 15%
Median 14%
Standard Deviation 4%
Table 3: Food Insecurity and Child Food Insecurity by Frontier County
Most Food Insecure Frontier Counties Most Child Food Insecure Frontier Counties
County Name State FI Rate FI Rank County State Child FI Rate FI Rank
Holmes MS 33% 2 Apache AZ 43% 13
Humphreys MS 33% 2 Oglala Lakota SD 39% 17
Coahoma MS 32% 4 Navajo AZ 39% 29
Leflore MS 32% 4 Sabine TX 38% 20
Sunflower MS 31% 5 Telfair GA 38% 29
Wilcox AL 30% 8 Holmes MS 37% 2
Phillips AR 30% 8 Kusilvak AK 37% 17
East Carroll LA 30% 8 Ben Hill GA 37% 29
Noxubee MS 30% 8 Zavala TX 37% 361
Quitman MS 30% 8 East Carroll LA 36% 8

Food Insecurity on the Frontier 62
MAP 1 - FOOD INSECURITY IN FRONTIER COUNTIES, 2013
POVERTY & FRONTIER COUNTIES
Poverty is an important indicator of food insecurity as a family’s available resources determine how much they
are able to spend on food. At the federal level, poverty is measured by income on a sliding scale that depends
on household size.126 Since the 1960s, the poverty rate has been measured by multiplying the cost of food for
an individual or family by three, adjusted for inflation. In 2013, the poverty threshold for an individual under 65
was $12,119, and $23,834 for a family of four.127 Based on increases in other costs of living, such as housing,
transportation, childcare and health care, the threshold for poverty is quite low. In fact, many people with
incomes above the poverty threshold still struggle to meet expenses and provide for themselves and their
families; those with incomes above the poverty threshold also struggle with food insecurity.
Examining poverty in frontier counties, the Midwest and Mountain regions (such as North Dakota, Colorado,
and Minnesota) tend to have lower poverty rates than the South and Southwest (Map 2). The same geographic
areas that struggle with food insecurity also struggle with high rates of poverty. The sole county in Minnesota
with a poverty rate in the top quantile, Mahnomen, has a majority nonwhite population primarily of Native
Americans (41%) and people with two or more races (8%). North Dakota’s three most impoverished counties
also have majority nonwhite populations: Sioux at 87%, Benson with 57% and Rolette at 80%). These counties
are the only frontier counties in Minnesota and North Dakota with majority non-white populations.
126 (National Center for Children in Poverty, 2008) 127 (US Census Bureau n.d.)

Food Insecurity on the Frontier 63
Table 4: Top Poverty Rates in Frontier Counties County State Poverty Rate FI Rate FI Rank Child FI Rate
Oglala Lakota SD 52% 26% 17 39%
Humphreys MS 44% 33% 2 35%
Corson SD 44% 21% 77 33%
Todd SD 44% 23% 41 35%
Holmes MS 42% 33% 2 37%
Ziebach SD 42% 20% 103 32%
Hudspeth TX 42% 13% 699 35%
East Carroll LA 41% 30% 8 36%
Wolfe KY 40% 22% 57 35%
Sioux ND 40% 16% 361 26%
The counties that have the highest rates of poverty have between four and five people out of ten living in
poverty. These counties also have at least 75% nonwhite populations, except for Wolfe County, Kentucky which
is 99% white. Half are located in the Upper Midwest, primarily in South Dakota. These counties have between
75 – 97% nonwhite populations; their nonwhite populations are almost wholly American Indian/Alaska Native.
The Lower Mississippi Delta counties (Humphreys, Holmes and East Carroll), with majority black populations,
all have some of the highest rates of food insecurity of the frontier counties. Hudspeth County, TX is nearly 80%
Hispanic.
MAP 2: POVERTY RATES IN FRONTIER COUNTIES, 2013

Food Insecurity on the Frontier 64
While we have associated high poverty with high rates of nonwhite populations, the pocket of poverty in
eastern Kentucky is an important exception; formerly coal country, these counties have increasingly faced poor
economic opportunity and declining populations.128
MAP 3: PERSISTENT POVERTY IN FRONTIER COUNTIES, 2013
Many frontier counties have had high poverty rates for decades. The USDA’s Economic Research Service tracks
the persistence of poverty in counties, defined as 20% or more of their population living below the federal
poverty line for the past 30 years, using decennial census data from 1990-2010.129 Persistent poverty tends to
be a rural problem, with 86% of persistent poverty counties having exclusively rural populations, 130 and over
half of all persistent poverty counties contain frontier communities.
Approximately 14% of all frontier counties are persistent poverty counties. The states with the most persistent
poverty frontier counties include Kentucky (22), Mississippi (19), Texas (14), Missouri (12) and South Dakota
(11). Many regions that face persistent poverty are ones we have discussed, such as the Lower Mississippi
128 (Lowrey, 2014) 129 (US Department of Agriculture, 2015) 130 (George, 2012)

Food Insecurity on the Frontier 65
Delta, eastern Kentucky and primarily Native American counties in the North. Others include the Southwest,
the Ozark Mountains and the South. These areas also struggle with food insecurity as shown in Map 1.
UNEMPLOYMENT & FRONTIER COUNTIES
Unemployment is a strong indicator of food insecurity, as families without a consistent income lack sufficient
resources for food.131 Rural areas generally face sluggish economic growth compared with metropolitan areas,
and by their nature of being the most remote, frontier areas are far from employment centers. Frontier
communities also tend to rely on inconsistent and seasonal employment such as in agriculture.
MAP 4: UNEMPLOYMENT IN FRONTIER COUNTIES, 2013
We examined 2013 county-level unemployment data from the US Bureau of Labor Statistics as applied to
frontier counties. Over 400 frontier counties have unemployment rates above the 2013 national rate of 7%. In
addition to the areas of need we have highlighted previously, the West (California, Oregon and Washington
State) and the Upper Peninsula region of Michigan and northern Michigan are in the top quintile of
unemployment (Map 4).
Looking at the counties with the highest rates of unemployment (Table 5), Kusilvak Census Area in Alaska has
an alarming rate of unemployment – nearly one in four people who are part of the workforce do not have a job.
Located on the peninsula on Alaska’s northwest coast, relies heavily on the fisheries in the Bering Strait and
Gulf of Alaska, which provides only seasonal employment.132 Colusa County in California’s Central Valley relies
primarily on agriculture. Apache County, Arizona, located in the state’s northwestern corner, has the highest
131 (Coleman-Jensen and Nord, 2013) 132 (Alaska Department of Labor and Workforce Development, 2016)

Food Insecurity on the Frontier 66
rate of child food insecurity in the country, in addition to being a persistent poverty county and in the top
quantile for food insecurity and poverty.
Table 5: Top Frontier Counties by Unemployment
County State UE Rate FI Rate FI Rank Child FI Rate
Kusilvak AK 24% 26% 17 37%
Wilcox AL 19% 30% 8 32%
Colusa CA 19% 15% 464 29%
Apache AZ 18% 28% 13 43%
Harlan KY 18% 23% 41 33%
Yukon-Koyukuk AK 18% 21% 77 31%
Magoffin KY 18% 22% 57 32%
Leslie KY 18% 21% 77 29%
Humphreys MS 17% 33% 2 35%
East Carroll LA 17% 30% 8 36%
SNAP RATES & FRONTIER COUNTIES
SNAP, the Supplemental Nutrition Assistance Program, is a federal program that provides low income families
with funding and other benefits that help them improve their health and wellbeing and reduce hunger.133
Individuals eligible for SNAP can have incomes up to 130% of the poverty line, but those with higher incomes
must prove their hardship and eligibility.134
MAP 5: SNAP RATES IN FRONTIER COUNTIES, 2013
133 (Mabli, 2014) 134 (Feeding America, 2016)

Food Insecurity on the Frontier 67
While this program has been widespread and successful, it also faces challenges and cutbacks, much like
similar programs that comprise the “safety net” for the poor. Despite its critical role in providing resources for
food, the program continues to face significant funding challenges and cutbacks. As of 2016, unemployed,
childless individuals under 49 years old are limited to three months of benefits, no matter how long or arduous
their search for employment has been.135 Our mapping and analysis looks at the Census variable that tracks
households that have received SNAP benefits in the last 12 months. Counties with high household SNAP rates
may have relatively higher rates of food security because of the resources SNAP provides.
Table 6: Top Household Snap Rates in Frontier Counties
County State SNAP Rate FI Rate FI Rank Child FI Rate
Kusilvak AK 52% 26% 17 37%
Todd SD 46% 23% 41 35%
Owsley KY 44% 21% 77 30%
Oglala Lakota SD 43% 26% 17 39%
Ziebach SD 42% 20% 103 32%
Zavala TX 41% 16% 361 37%
Humphreys MS 40% 33% 2 35%
Lee KY 40% 22% 57 34%
Lake TN 40% 23% 41 35%
Buffalo SD 40% 24% 29 35%
RACIAL BREAKDOWN OF FOOD INSECURITY IN FRONTIER COUNTIES
As our earlier analysis suggested, we have determined that race may be the most important predictor of food
insecurity in frontier counties. While frontier counties with low percentages of non-white residents are
scattered throughout the United States and particularly in the Northeast and Upper Midwest, five distinct
pockets of frontier counties have significant percentages of non-white residents. The first is along the U.S –
Mexico border, starting in California and stretching to Texas in the east where there is a large Hispanic
population (see Map 5). The second is located in the northern Great Plains and edge of the Rocky Mountains,
stretching through Montana and North Dakota and concentrating in central-western South Dakota, where there
is a large American Indian population. The third concentration is in the South, beginning in Arkansas, stretching
through central Mississippi and reaching the southern part of Alabama, where there is a high percentage of
African American population. The fourth concentration is in northern and eastern Alaska with a high American
Indian population, while in Hawaii has a racially diverse majority nonwhite population.
Table 7: Top 10 Frontier Counties with Highest African American Populations by Percent
County State FI Rank FI Rate
Child FI
Rate
% Non-
White
%
Black
%
Hispanic
% Am Indian
/ Al Native
Kusilvak AK 17 26% 37% 96% 0.2% 0.2% 91%
Oglala Lakota SD 17 26% 39% 96% 0.1% 1% 96%
Zavala TX 361 16% 37% 94% 0.3% 93% 0.1%
Todd SD 41 23% 35% 90% 0.0% 3% 80%
McKinley NM 29 24% 35% 90% 0.5% 14% 74%
Duval TX 1012 9% 26% 90% 0.7% 88% 1%
Bethel AK 77 21% 30% 89% 0.6% 1% 82%
Northwest Arctic AK 77 21% 30% 89% 0.6% 1% 81%
Sioux ND 361 16% 26% 87% 0.0% 3% 83%
Rio Arriba NM 820 12% 26% 87% 0.4% 71% 15%
135 (Center for Budget and Policy Priorities, 2016)

Food Insecurity on the Frontier 68
Counties with the highest percentage of non-white residents are most likely to be heavily American Indian or
Alaska Native with seven of the top ten counties having 80% or more of the population in this category (Table
6). The remaining three counties on this list are heavily Latino, with Rio Arriba County, New Mexico consisting
of 72% Latino and 15% American Indian/Native Alaskan. Of the counties on this list, six counties are in the top
25% of food insecure frontier counties, and all of those six counties are 80% or more Native American/Native
Alaskan. Counties with higher percentages of this population see higher rates of food insecurity.
MAP 5: PERCENT NON-WHITE IN FRONTIER COUNTIES, 2013
DISTRIBUTION BY RACE: AFRICAN AMERICAN
Nationally, African Americans are not only disproportionately impacted by unemployment and poverty, but also
food insecurity. 26% of African American households are food insecure compared 11% of White households
and 14% of all households.136 Across frontier counties the trend of higher rates of food insecurity for African
American communities holds true, as counties with high percentages of African Americans have the most
acute incidence of food insecurity. Frontier counties with high concentrations of African American populations
are located almost exclusively in the South (Map 6). Save for Phillips County, Arkansas, the top ten food
insecure counties overall are the same as in the frontier counties with the highest percentage of African
American populations; Dallas County, Louisiana is number 11 overall (Table 7).
136 Feeding America, http://www.feedingamerica.org/hunger-in-america/impact-of-hunger/african-american-hunger/african-american-
hunger-fact-sheet.html

Food Insecurity on the Frontier 69
Table 8: Top 10 Frontier Counties with Highest African American Populations by Percent
County State
FI
Rank
FI
Rate
Child FI
Rate
% Non-
White
%
Black
%
Hispanic
% AI
/ AN White
Holmes MS 2 33% 37% 84% 83% 0.2% 0.1% 16%
Coahoma MS 4 32% 34% 77% 76% 0.5% 0.1% 23%
Humphreys MS 2 33% 35% 78% 76% 2% 0.1% 22%
Sunflower MS 5 31% 33% 75% 73% 1% 0.1% 25%
Wilcox AL 8 30% 32% 73% 73% 0.2% 0.0% 27%
Leflore MS 4 32% 34% 76% 72% 2% 0.5% 25%
Noxubee MS 8 30% 33% 73% 72% 1% 0.3% 27%
East Carroll LA 8 30% 36% 73% 70% 3% 0.1% 27%
Quitman MS 8 30% 34% 71% 70% 1% 0.1% 29%
Dallas LA 11 29% 33% 71% 69% 1% 0.1% 29%
MAP 6: PERCENT AFRICAN AMERICAN IN FRONTIER COUNTIES, 2013
CASE STUDY: LOWER MISSISSIPPI DELTA REGION
A study by the Lower Mississippi Delta Nutrition Intervention Research Initiative of diet quality in the region
found that even individuals not struggling with food insecurity have nutritionally poorer diets than peers in
other regions. The diets of both food secure and food insecure individuals were far too low in fiber, and too
high in calorie dense foods (processed, fatty, and sugary foods). This study found that in the Delta race,
education, and age were more strongly correlated with the healthfulness of an individual’s diet than food

Food Insecurity on the Frontier 70
security alone was.137 The nutritional quality of the diets of residents in other frontier areas should be studied
in the same way, as underlying factors like a low density of grocery stores are similar across regions.
Rural populations in the Delta had reduced access to a healthful variety of foods, and rely on smaller and more
expensive grocery stores than their urban counterparts. The same study found that even families using SNAP
and similar food assistance programs still had a nearly 40% rate of food insecurity, and 13% of these families
experience hunger. Food insecurity rates for families with children in the Delta were twice as high as they are
nationwide, but were especially high for Black families with children. Although the food insecurity rate is higher
for Black households nationwide, Black households in the Delta were about twice as likely to be food insecure.
Even after adjusting for income and the presence of children, Black Delta households were still twice as likely
to be food insecure as White Delta households. Food insecurity seems to be more intense overall in the Delta,
and not only because of the high prevalence of low-income families, families with children, and minority
families—even within those groups the rates of food insecurity are higher than they are for their peers
nationwide.138
DISTRIBUTION BY RACE: AMERICAN INDIAN/ ALASKA NATIVE POPULATION
While American Indian/Alaska Native serves as one category, it captures a diverse set of cultures and tribes
across the country. Unfortunately, American Indian populations continue to be disproportionately affected by
poverty, hunger and food insecurity, as well as obesity and chronic disease. These communities are affected by
high unemployment and persistent poverty as well. Populations located on reservations are often far from food
retailers. American Indian families are also more likely to rely on federal assistance programs such as SNAP,
Temporary Assistance for Needy Families (TANF), and Women, Infants and Children (WIC) Special Supplement
Nutrition Program.139 Clearly, American Indian communities are in great need when looking at food insecurity
on the Frontier.
Spatially, frontier counties with high percentages of American Indian populations are nearly exclusively located
west of the Mississippi River (Map 7). The highest populations tend to be located in the Southwest, near the
border between Arizona and New Mexico, in South Dakota, and pockets of Montana and North Dakota. Oglala
Lakota County (formerly Shannon County) in the Black Hills region of South Dakota is where the Pine Ridge
Reservation is located. Almost exclusively American Indian, Oglala Lakota is one of the poorest counties in the
country; it also has one of the highest rates of child food insecurity on the frontier.140
Table 7: Top 10 Frontier Counties with Highest American Indian / Alaska Native Population by Percent
County State
FI
Rank
FI
Rate
Child FI
Rate
% Non-
White % Black
%
Hispanic
% Am Indian
/ Al Native
Oglala Lakota SD 17 26% 39% 96% 0.1% 1% 96%
Kusilvak AK 17 26% 37% 96% 0.2% 0.2% 91%
Sioux ND 361 16% 26% 87% 0.0% 3% 83%
Bethel AK 77 21% 30% 89% 0.6% 1% 82%
Northwest Arctic AK 77 21% 30% 89% 0.6% 1% 81%
Todd SD 41 23% 35% 90% 0.0% 3% 80%
Buffalo SD 29 24% 35% 83% 0.5% 1% 79%
Rolette ND 197 18% 29% 80% 0.4% 1% 77%
Dewey SD 57 22% 34% 79% 0.4% 2% 76%
McKinley NM 29 24% 35% 90% 0.5% 14% 74%
137 (Champagne, et al., 2007) 138 (Stuff, et al., 2004) 139 (Chino, Haff and Dodge Francis, 2009) 140 (Gordon and Oddo, 2012)

Food Insecurity on the Frontier 71
MAP 7: PERCENT AMERICAN INDIAN / ALASKA NATIVE, 2013
DISTRIBUTION BY ETHNICITY: HISPANIC POPULATION
Similarly to African American and American Indian populations, Hispanic and Latino families are
disproportionately food insecure; nationally, over one in five Latino families are food insecure.141 While
counties with majority African American and American Indian populations experience extreme poverty and food
insecurity, we did not find the same for frontier counties with majority Latino populations (Table 8).
Table 9: Top 10 Frontier Counties with Highest Hispanic Population by Percent
County State
FI
Rank
FI
Rate
Child FI
Rate
% Non-
White
%
Black
%
Hispanic
% Am Indian
/ Al Native
Zavala TX 361 16% 37% 93.5% 0.3% 93.2% 0.1%
Duval TX 1,012 9% 26% 89.7% 0.7% 88.3% 0.7%
Dimmit TX 978 10% 29% 86.3% 0.8% 85.8% 0.1%
Presidio TX 577 14% 33% 84.8% 0.3% 82.1% 2.5%
Mora NM 699 13% 28% 82.7% 0.1% 81.7% 2.1%
Val Verde TX 915 11% 27% 82.6% 1.2% 80.2% 0.3%
Hudspeth TX 699 13% 35% 80.1% 0.6% 79.0% 0.0%
Culberson TX 915 11% 20% 79.9% 0.6% 77.4% 0.7%
Guadalupe NM 915 11% 26% 81.9% 1.7% 76.9% 2.0%
San Miguel NM 699 13% 28% 80.6% 1.7% 76.9% 1.2%
141 (Coleman-Jensen, et al., 2015)

Food Insecurity on the Frontier 72
Of the 1,068 counties in our study, only 33 contain majority Hispanic populations; they are all located in the
West, primarily in Texas and New Mexico, but also in Colorado, California and Washington (Map 8). The
average food insecurity rate for these counties was 12%, which is below the national average of 16%. While
these are comparably low food insecurity rates, the average child food insecurity rate for these counties is
27%, meaning that more than 1 in 4 children are food insecure. Understanding food insecurity in Latino
families in frontier communities should be of concern.
Of these counties, Zavala County, Texas and Fresno County, California are the only two with food insecurity
rates above the national average. While Fresno County contains frontier and remote areas (such as a portion of
the Sierra Nevadas), it also contains the fifth largest city in California. Zavala County is located in the Winter
Garden region of southern Texas, close to the Mexican border. Primarily agricultural, the region produces
winter and early spring vegetables such as leafy greens, broccoli and strawberries with the help of irrigation.142
Its unemployment rate (14%) is about double the national average, and is comparable to agricultural Colusa
County, discussed in the unemployment section. Food insecurity in families should be of greatest concern in
Zavala County; approximately one third of the population is below the age of 18. Given a child food insecurity
rate of 37%, over 1,300 children in the county are food insecure, approximately 12% of the county’s total
population.
MAP 8: PERCENT HISPANIC / LATINO
142 (Wheelus, 2012)

Food Insecurity on the Frontier 73
CONCLUSION
Our analysis provides a general overview of food insecurity issues across counties containing frontier
communities. We estimated food insecurity at the national level; we examined food insecurity rates, poverty,
unemployment and SNAP rates across frontier counties, and we showed the intersection of majority nonwhite
counties and food insecurity across the country. We intend to lay the groundwork for further study of food
insecurity in frontier communities at more detailed geographies.
The frontier is a vast and diverse but ultimately segregated part of America, with hunger, poverty and food
insecurity primarily present in its segregated areas. Of the entire frontier, the areas with greatest food
insecurity tend to have majority non-white populations. A large portion of the African American population lives
in the Lower Mississippi Delta, facing generational poverty and little to no access to healthy food. Counties with
majority American Indian populations are segregated across the West, in reservations such as Pine Ridge in
Oglala Lakota County, South Dakota. We can also see Latino children as bearing the burden of food insecurity
in the Southwest. These findings should direct future research into food insecurity in frontier communities
across the country.
Food Insecurity on the Frontier 74
REFERENCES
Alaska Department of Labor and Workforce Development. 2016. "Unemployment rate at 6.6 percent in
January." March 11. Accessed May 9, 2016. http://www.labor.state.ak.us/news/2016/news16-
12.pdf.
American Indian Relief Council. 2016. South Dakota: Pine Ridge Reservation. Accessed May 9, 2016.
http://www.nrcprograms.org/site/PageServer?pagename=airc_res_sd_pineridge.
Center for Budget and Policy Priorities. 2016. More Than 500,000 Adults Will Lose SNAP Benefits in 2016 as
Waivers Expire. March 18. Accessed May 6, 2016. http://www.cbpp.org/research/food-
assistance/more-than-500000-adults-will-lose-snap-benefits-in-2016-as-waivers-expire.
Champagne, Catherine, Patrick Casey, Carol Conell, Janice Stuff, Jeffrey Gossett, and David Harsha. 2007.
"Poverty and Food Intake in Rural America: Diet Quality is Lower in Food Insecure Adults of the
Mississippi Delta." Journal of the American Dietetic Association 1886-1894.
Chino, Michelle, Darlene Haff, and Carolee Dodge Francis. 2009. "Patterns of Commodity Food Use among
American Indians." Pimatisiwin: A Journal of Aboriginal and Indigenous Community Health 7 (2): 279-
289.
Coleman-Jensen, Alisha, and Mark Nord. 2013. "Post-Recession, a Greater Share of Food-Insecure Children
Have Parents Who Are Unemployed or Working Part-Time." Amber Waves, August 5. Accessed May 6,
2016. http://www.ers.usda.gov/amber-waves/2013-august/post-recession,-a-greater-share-of-food-
insecure-children-have-parents-who-are-unemployed-or-working-part-time.aspx#.Vyzby4QwhaQ.
Coleman-Jensen, Alisha, Matthew Rabbitt, Christian Gregory, and Anita Singh. 2015. Household Food
Insecurity in the United States in 2014. US Department of Agriculture, Economic Research Service.
Accessed May 9, 2016. http://www.ers.usda.gov/media/1896841/err194.pdf.
Cook, John, and Karen Jeng. 2009. Child Food Insecurity: The Economic Impact on our Nation. Feeding
America. https://www.nokidhungry.org/sites/default/files/child-economy-study.pdf.
Feeding America. 2016. Rural Hunger Facts. Accessed May 6, 2016. http://www.feedingamerica.org/hunger-
in-america/impact-of-hunger/rural-hunger/rural-hunger-fact-sheet.html.
—. 2016. Supplemental Nutrition Assistance Program (SNAP). Accessed May 6, 2016.
http://www.feedingamerica.org/take-action/advocate/federal-hunger-relief-programs/supplemental-
nutrition-assistance-program.html.
George, Lance. 2012. "Persistent Poverty in Rural America." Rooflines: The Shelterforce Blog, August 20.
Accessed May 9, 2016. http://www.rooflines.org/2819/persistent_poverty_in_rural_america/.
Gordon, Anne, and Vanessa Oddo. 2012. Addressing Child Hunger and Obesity in Indian Country: Report to
Congress. US Department of Agriculture, Food and Nutrition Service. Accessed May 9, 2016.
http://www.fns.usda.gov/sites/default/files/IndianCountry.pdf.
Gundersen, C, E Waxman, E Englehard, A Satoh, and N Chawla. 2013. Map the Meal Gap 2013: Food
Insecurity Estimates at the County Level. Feeding America.
Lowrey, Annie. 2014. "What's the Matter With Eastern Kentucky?" The New York Times Magazine, June 26.
http://www.nytimes.com/2014/06/29/magazine/whats-the-matter-with-eastern-kentucky.html.

Food Insecurity on the Frontier 75
Mabli, James. 2014. SNAP Participation and Urban and Rural Food Security. US Department of Agriculture,
Food and Nutrition Service. Accessed May 9, 2016.
http://www.fns.usda.gov/sites/default/files/SNAPFS_UrbanRural.pdf.
National Center for Children in Poverty. 2008. Measuring Poverty in the United States. June. Accessed May 5,
2016. http://www.nccp.org/publications/pub_825.html.
Stuff, Janice, Jacqueline Horton, Margaret Bogle, and Carol Connell. 2004. "High Prevalence of Food Insecurity
and Hunger in Households in the Lower Mississippi Delta." Journal of Rural Health 173-180.
US Census Bureau. n.d. "2013 American Community Survey, 5-Year Estimates."
—. n.d. Poverty Thresholds. Accessed May 6, 2016.
https://www.census.gov/hhes/www/poverty/data/threshld/.
US Department of Agriculture. 2015. Geography of Poverty. December 17. Accessed May 6, 2016.
http://www.ers.usda.gov/topics/rural-economy-population/rural-poverty-well-being/geography-of-
poverty.aspx.
Wheelus, Monica. 2012. "Texas Winter Garden, the often overlooked farmers." The Examiner, January 22.
http://www.examiner.com/article/texas-winter-garden-the-often-over-looked-farmers.