Front of Pack labelling - ec.europa.eu · impact of nutritional labeling on FSA score in real...
29
Front of Pack labelling: Evidence base for regulation Dr Michel Chauliac/ Director ate general for Health, France [email protected]
-
Upload
phungkhuong -
Category
Documents
-
view
213 -
download
0
Transcript of Front of Pack labelling - ec.europa.eu · impact of nutritional labeling on FSA score in real...
Front of Pack labelling:
Evidence base for regulation
Dr Michel Chauliac/ Director ate general for Health, France

Example of soft drinks
Works of the observatory of food quality
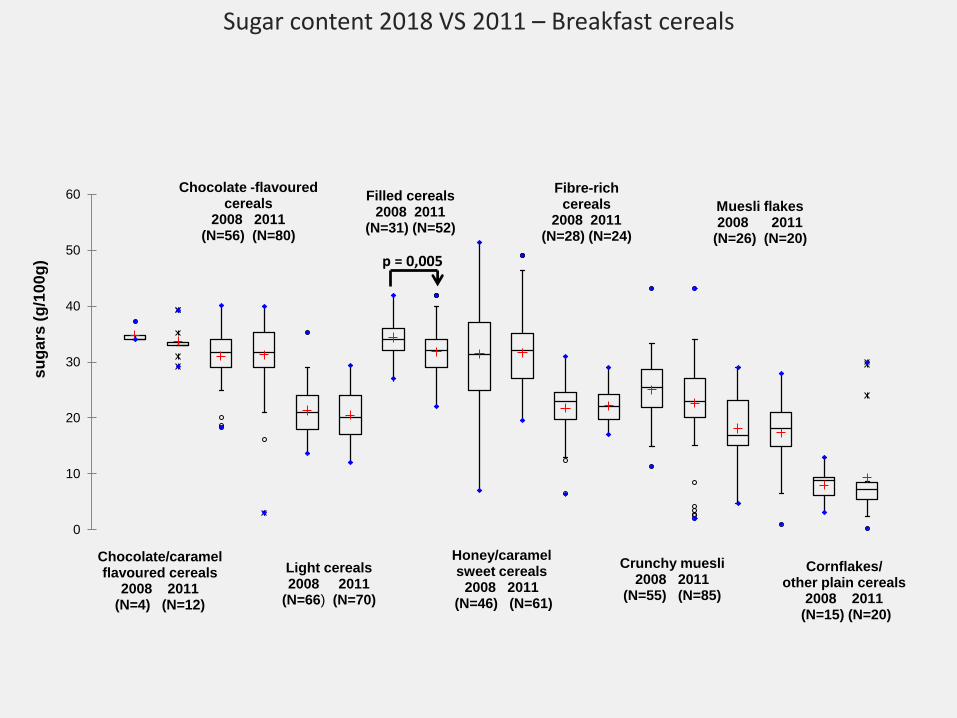
Sugar content 2018 VS 2011 – Breakfast cereals
Chocolate/caramel flavoured cereals
2008 2011 (N=4) (N=12)
Chocolate -flavoured cereals
2008 2011 (N=56) (N=80)
Light cereals 2008 2011
(N=66) (N=70)
Filled cereals 2008 2011
(N=31) (N=52)
Honey/caramel sweet cereals
2008 2011 (N=46) (N=61)
Fibre-rich cereals
2008 2011 (N=28) (N=24)
Crunchy muesli 2008 2011
(N=55) (N=85)
Muesli flakes 2008 2011
(N=26) (N=20)
Cornflakes/ other plain cereals
2008 2011 (N=15) (N=20)
0
10
20
30
40
50
60
su
gars
(g
/10
0g
) p = 0,005
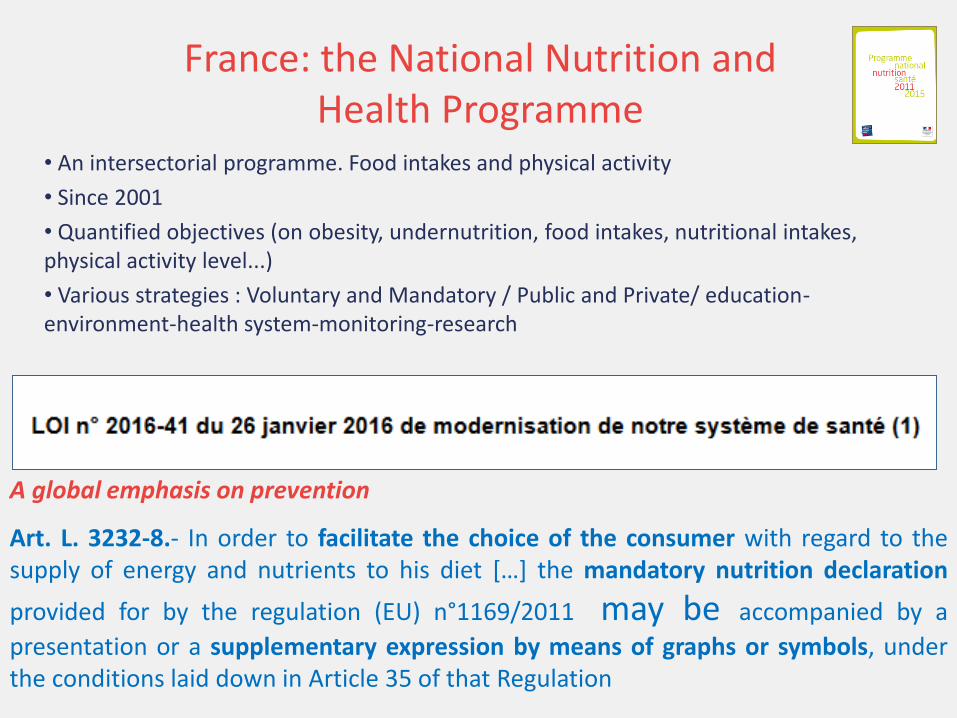
• An intersectorial programme. Food intakes and physical activity
• Since 2001
• Quantified objectives (on obesity, undernutrition, food intakes, nutritional intakes, physical activity level...)
• Various strategies : Voluntary and Mandatory / Public and Private/ education-environment-health system-monitoring-research
France: the National Nutrition and Health Programme
Art. L. 3232-8.- In order to facilitate the choice of the consumer with regard to the supply of energy and nutrients to his diet […] the mandatory nutrition declaration
provided for by the regulation (EU) n°1169/2011 may be accompanied by a
presentation or a supplementary expression by means of graphs or symbols, under the conditions laid down in Article 35 of that Regulation
A global emphasis on prevention
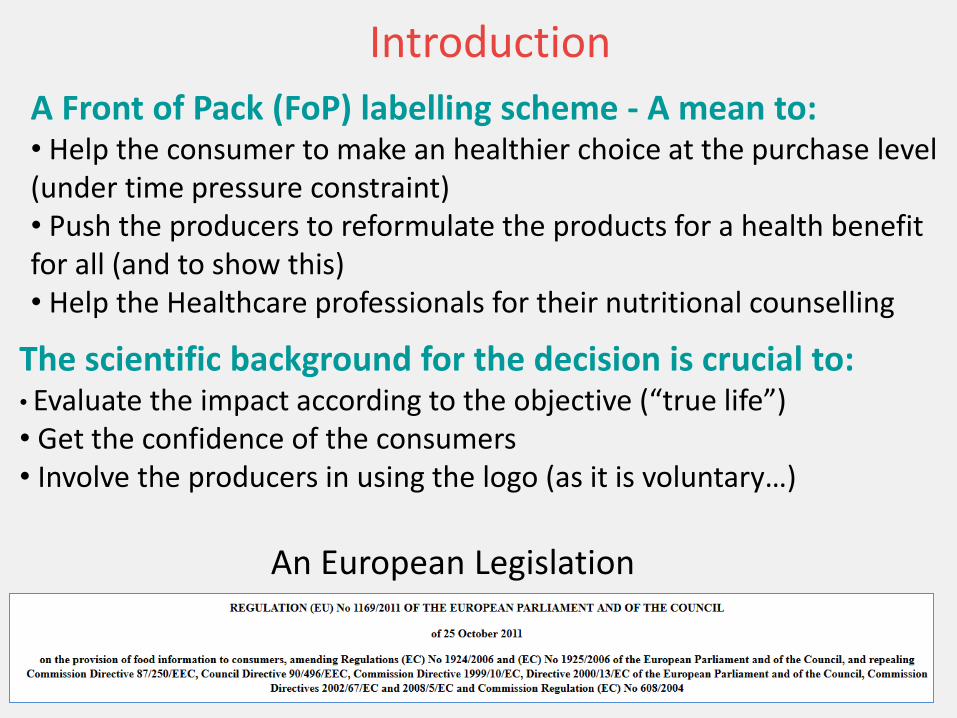
Introduction
A Front of Pack (FoP) labelling scheme - A mean to: • Help the consumer to make an healthier choice at the purchase level (under time pressure constraint) • Push the producers to reformulate the products for a health benefit for all (and to show this) • Help the Healthcare professionals for their nutritional counselling
The scientific background for the decision is crucial to: • Evaluate the impact according to the objective (“true life”) • Get the confidence of the consumers • Involve the producers in using the logo (as it is voluntary…)
An European Legislation

A demand from the consumers to have one and only one system, understandable by all, elaborated in a transparent way
A proposal, accepted by all, made by the “Fonds Français pour l’Alimentation et la Santé” to conduct a study in “real life conditions” to analyse the impact of a FoP nutritional labelling on the nutritional quality of food purchases
Why?
• No study proved its impact in real life
• An important step to federate the various actors
• Based on the voluntary will (by the European regulation)
Since march 2015 : a wide consultation involving consumers, producers, retailers and scientists

A Steering Committee (Co Chaired by the DGS and the chairman
of the FFAS ; consumers, research institutes, economic actors ; the
National Health Insurance ; DG Santé is invited)
An independent Scientific Committee (Chaired by a High Level
Civil Servant) with 12 multidisciplinary experts (with declarations of
interest)
An operational responsibility (FFAS)
An agreed governance for the study

Published on http://social-sante.gouv.fr/prevention-en-sante/preserver-sa-sante/article/l-
evaluation-en-conditions-reelles-d-achat-des-systemes-d-information-317290
Objective : to differentiate systems on the basis of their impact on the nutritional composition of shopping baskets. The nutritional quality of the baskets will be evaluated with a measuring system allowing comparisons between baskets.
Protocol (summary)
FSA score : From -15 to +40
The main criteria for evaluation
Various scientific works published in international scientific peer reviewed journals have shown the link between the level of this score (calculated on the average diet of individuals) and the occurrence of cancers, cardiovascular diseases, obesity or the metabolic syndrome.
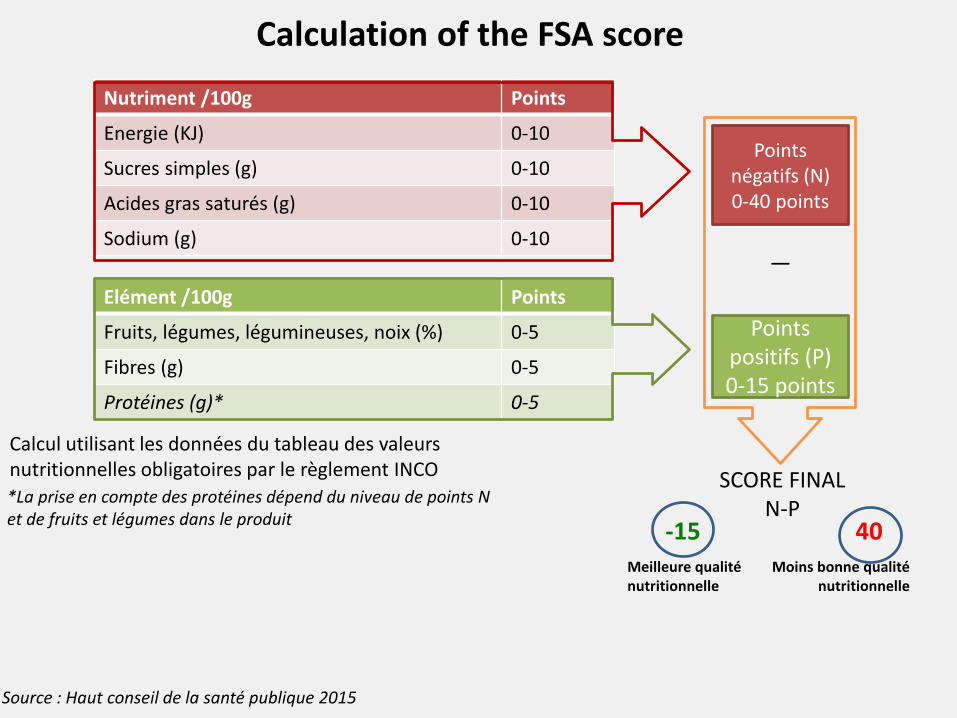
Calculation of the FSA score
Nutriment /100g Points
Energie (KJ) 0-10
Sucres simples (g) 0-10
Acides gras saturés (g) 0-10
Sodium (g) 0-10
Elément /100g Points
Fruits, légumes, légumineuses, noix (%) 0-5
Fibres (g) 0-5
Protéines (g)* 0-5
Points négatifs (N) 0-40 points
Points positifs (P) 0-15 points
—
SCORE FINAL N-P
Calcul utilisant les données du tableau des valeurs nutritionnelles obligatoires par le règlement INCO
*La prise en compte des protéines dépend du niveau de points N et de fruits et légumes dans le produit
Meilleure qualité nutritionnelle
Moins bonne qualité nutritionnelle
-15 40
Source : Haut conseil de la santé publique 2015

Points Energy
(KJ/100g)
SFA
(g/100g)
Sugars
(g/100g)
Sodium1
(mg/100g)
0 < 335 < 1 < 4,5 < 90
1 > 335 > 1 > 4,5 > 90
2 > 670 > 2 > 9 > 180
3 > 1005 > 3 > 13,5 > 270
4 > 1340 > 4 > 18 > 360
5 > 1675 > 5 > 22,5 > 450
6 > 2010 > 6 > 27 > 540
7 > 2345 > 7 > 31 > 630
8 > 2680 > 8 > 36 > 720
9 > 3015 > 9 > 40 > 810
10 > 3350 > 10 > 45 > 900
Points attribués à chacun des éléments de la composante dite « négative » N
1 Salt/2,5.

Points
Fruits,
vegetables,
pulses, fruits à
coque
(g/100g)1
(%)
Fibers
(g/100g) Proteins
(g/100g) Method NSP2 Method
AOAC3
0 < 40 <0,7 < 0,9 < 1,6
1 > 40 >0,7 > 0,9 > 1,6
2 > 60 >1,4 > 1,9 > 3,2
3 - >2,1 > 2,8 > 4,8
4 - >2,8 > 3,7 > 6,4
5 80 >3,5 > 4,7 > 8,0
Points attribués à chacun des nutriments de la composante dite « positive » P
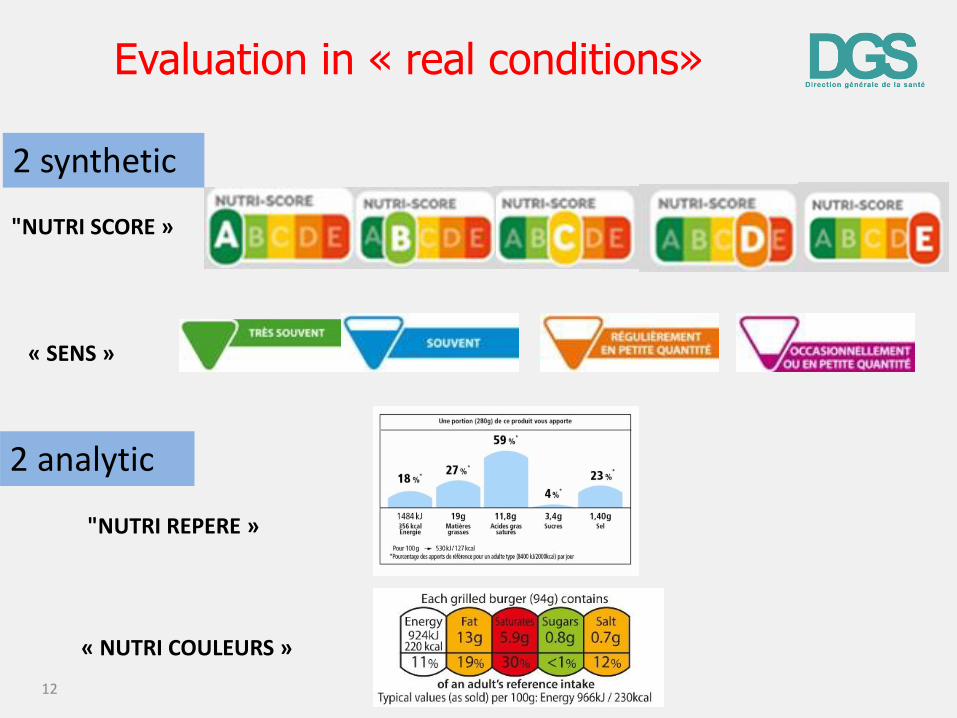
Evaluation in « real conditions»
12
« SENS »
"NUTRI SCORE »
2 synthetic
"NUTRI REPERE »
« NUTRI COULEURS »
2 analytic
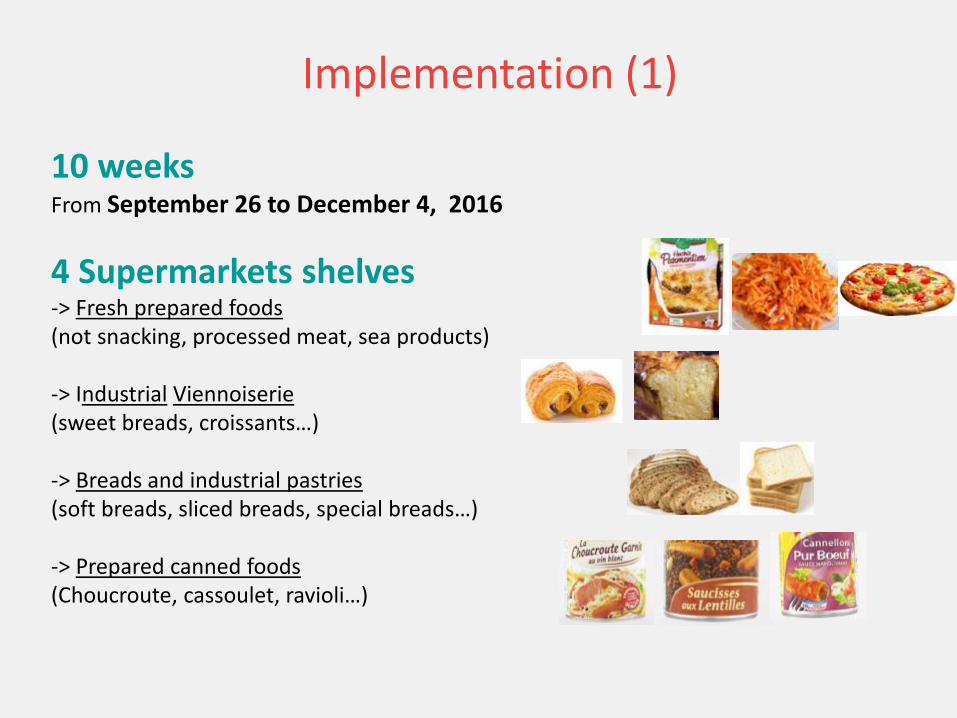
Implementation (1)
10 weeks From September 26 to December 4, 2016
4 Supermarkets shelves -> Fresh prepared foods (not snacking, processed meat, sea products) -> Industrial Viennoiserie (sweet breads, croissants…) -> Breads and industrial pastries (soft breads, sliced breads, special breads…) -> Prepared canned foods (Choucroute, cassoulet, ravioli…)
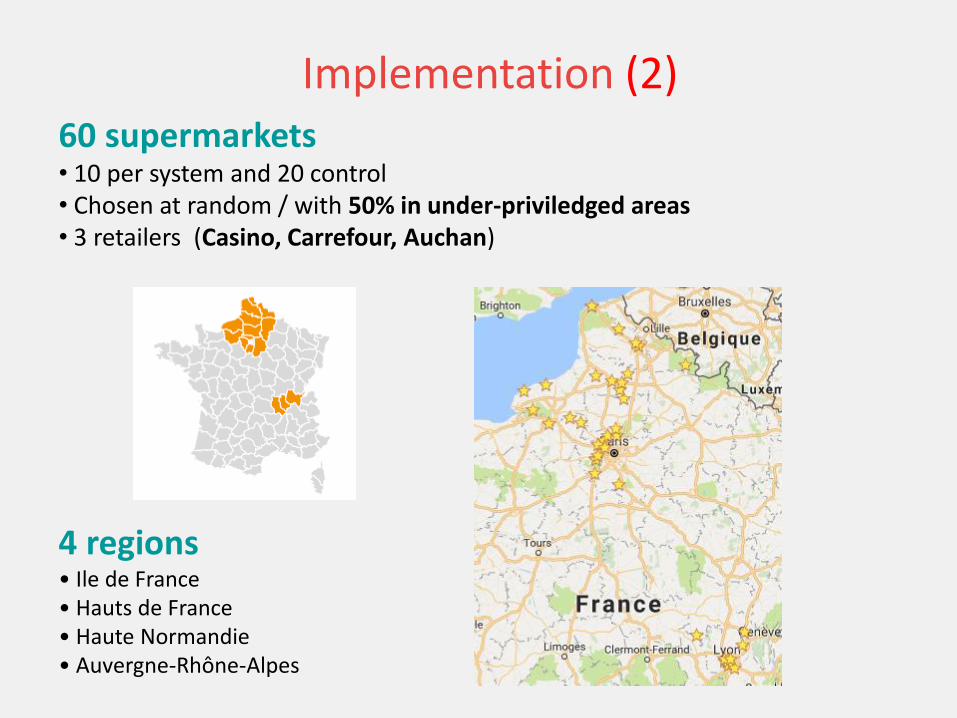
60 supermarkets • 10 per system and 20 control • Chosen at random / with 50% in under-priviledged areas • 3 retailers (Casino, Carrefour, Auchan)
Implementation (2)
4 regions • Ile de France • Hauts de France • Haute Normandie • Auvergne-Rhône-Alpes
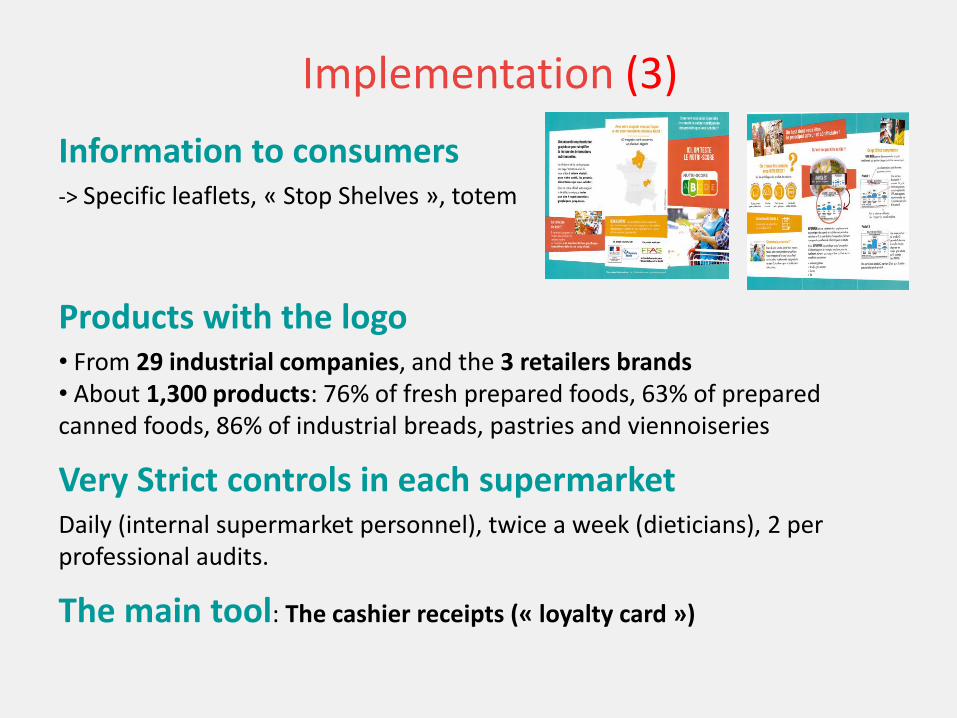
Information to consumers -> Specific leaflets, « Stop Shelves », totem
Products with the logo • From 29 industrial companies, and the 3 retailers brands • About 1,300 products: 76% of fresh prepared foods, 63% of prepared canned foods, 86% of industrial breads, pastries and viennoiseries
Very Strict controls in each supermarket Daily (internal supermarket personnel), twice a week (dieticians), 2 per professional audits.
The main tool: The cashier receipts (« loyalty card »)
Implementation (3)
Implementation (4)
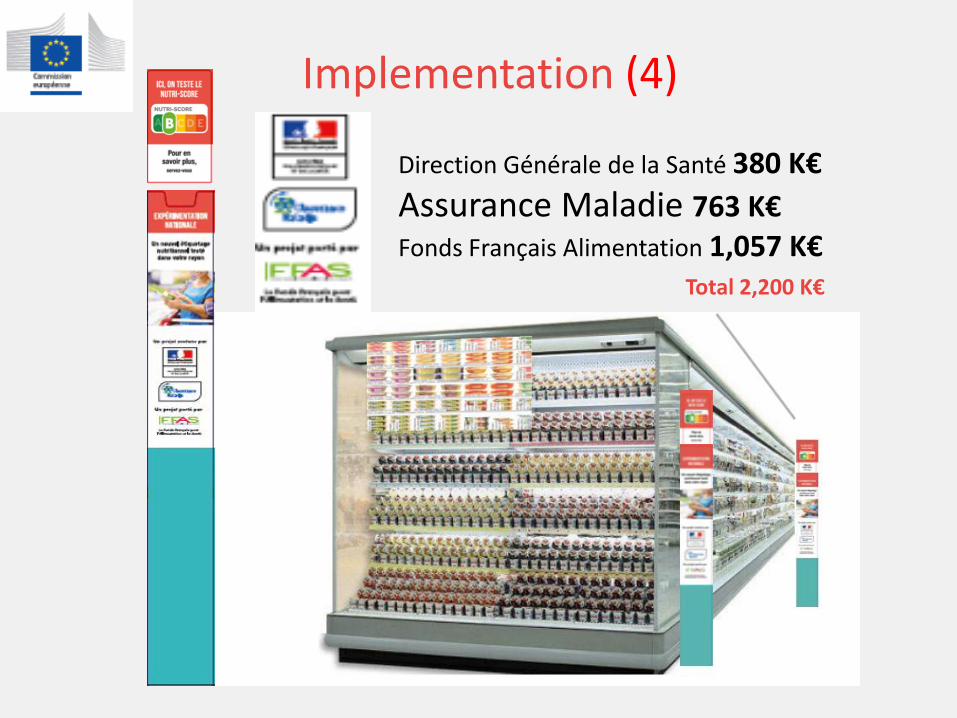
Direction Générale de la Santé 380 K€
Assurance Maladie 763 K€ Fonds Français Alimentation 1,057 K€ Total 2,200 K€

Implementation (5)
Implementation (6)

Results : Survey in real life, observation of the food purchasing behaviors
;
3 out of 4 systems are significantly effective in reducing the FSA score
Average reduction in FSA score:
Average of the FSA score for the food basket : about 6
• Nutri-Score -0.267 (4,5%);
• Nutri Couleurs -0.233 (3,9%),
• SENS -0.198 (3,3%),
• Nutri Repère +0.027 (+0,4%) degradation of the nutritional quality
-0.312
-0.229
-0.051
+0.052
consumers who buy low price products average consumers
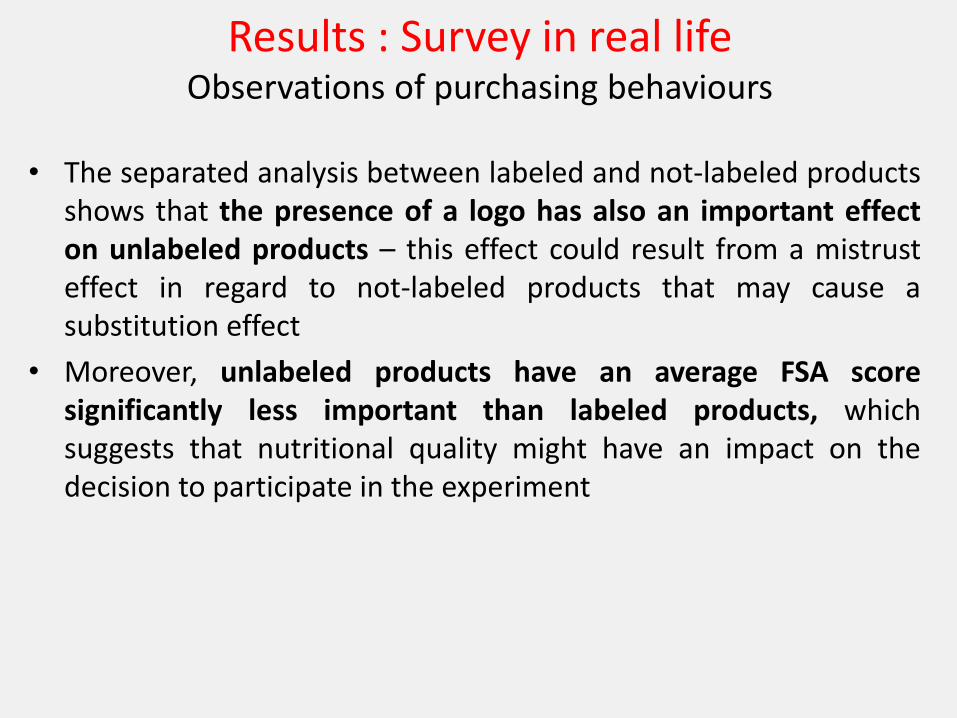
• The separated analysis between labeled and not-labeled products shows that the presence of a logo has also an important effect on unlabeled products – this effect could result from a mistrust effect in regard to not-labeled products that may cause a substitution effect
• Moreover, unlabeled products have an average FSA score significantly less important than labeled products, which suggests that nutritional quality might have an impact on the decision to participate in the experiment
Results : Survey in real life Observations of purchasing behaviours
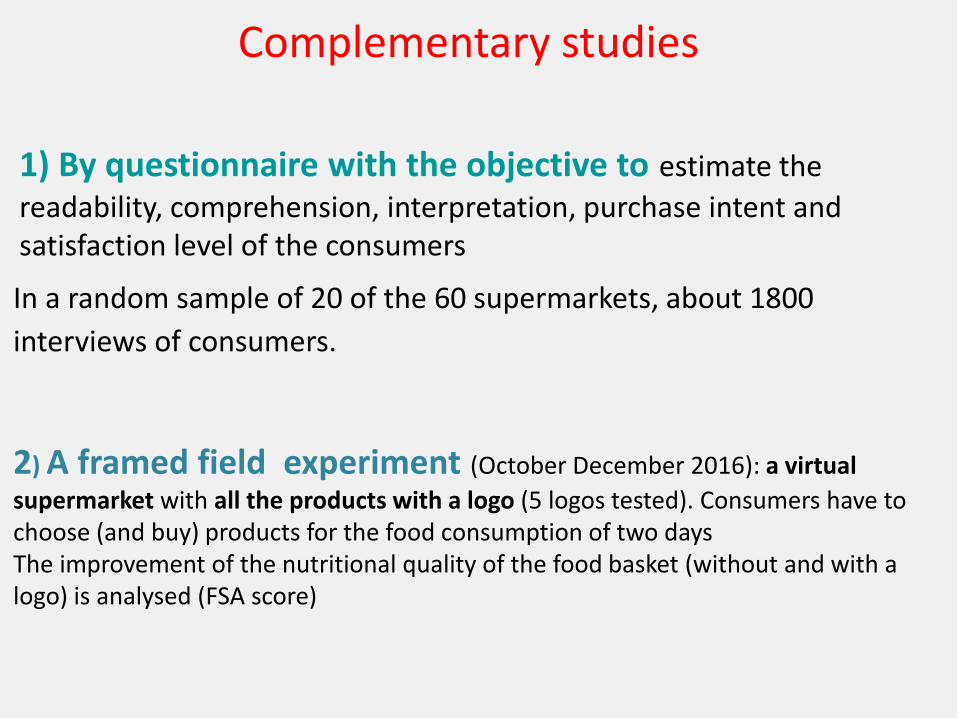
Complementary studies
1) By questionnaire with the objective to estimate the
readability, comprehension, interpretation, purchase intent and satisfaction level of the consumers
In a random sample of 20 of the 60 supermarkets, about 1800
interviews of consumers.
2) A framed field experiment (October December 2016): a virtual
supermarket with all the products with a logo (5 logos tested). Consumers have to choose (and buy) products for the food consumption of two days The improvement of the nutritional quality of the food basket (without and with a logo) is analysed (FSA score)
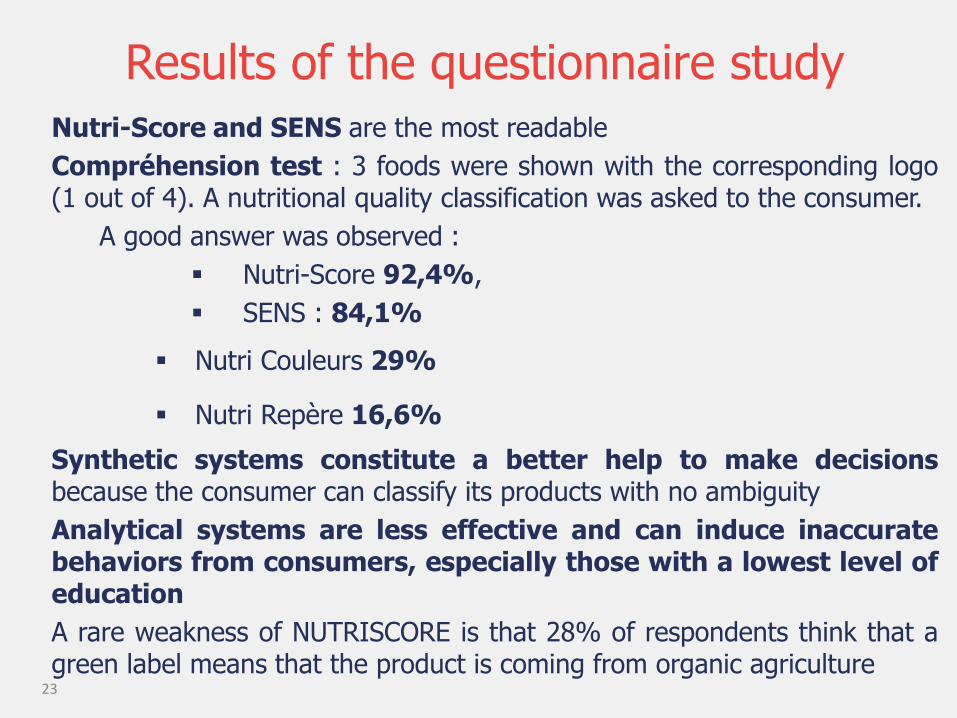
Results of the questionnaire study
23
Nutri-Score and SENS are the most readable
Compréhension test : 3 foods were shown with the corresponding logo (1 out of 4). A nutritional quality classification was asked to the consumer.
A good answer was observed :
Nutri-Score 92,4%,
SENS : 84,1%
Nutri Couleurs 29%
Nutri Repère 16,6%
Synthetic systems constitute a better help to make decisions because the consumer can classify its products with no ambiguity
Analytical systems are less effective and can induce inaccurate behaviors from consumers, especially those with a lowest level of education
A rare weakness of NUTRISCORE is that 28% of respondents think that a green label means that the product is coming from organic agriculture
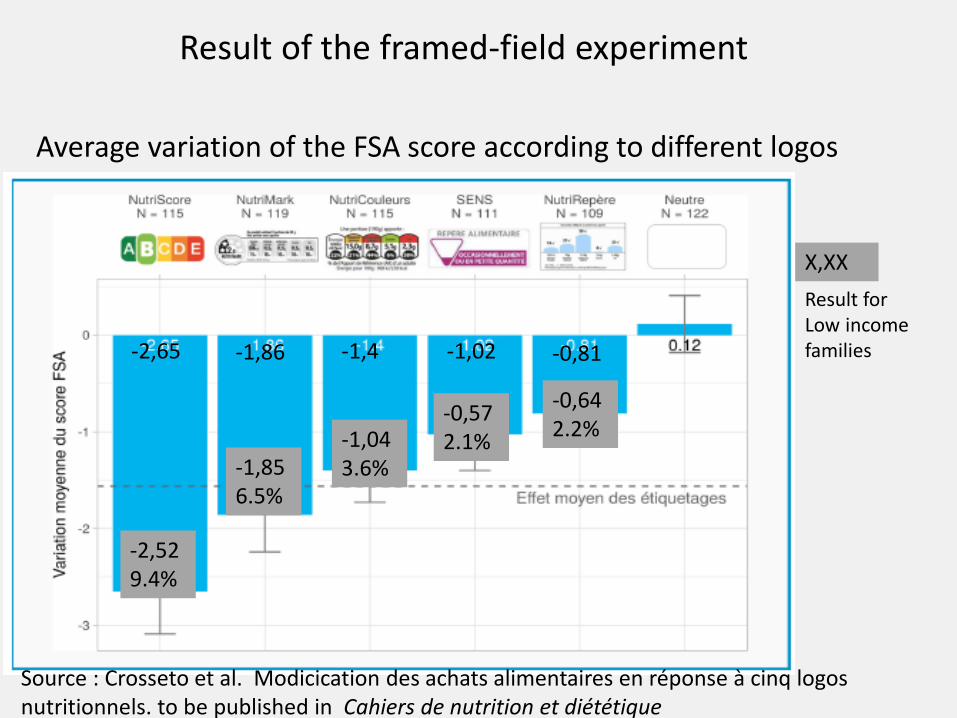
Average variation of the FSA score according to different logos
Source : Crosseto et al. Modicication des achats alimentaires en réponse à cinq logos nutritionnels. to be published in Cahiers de nutrition et diététique
Result of the framed-field experiment
-0,81 -2,65 -1,86 -1,4 -1,02
-0,57 2.1%
-2,52 9.4%
-1,85 6.5%
-1,04 3.6%
-0,64 2.2%
X,XX
Result for Low income families
Conclusions of the French experiments
The studies show: • The interest and feasibility of these studies for the measure of the
impact of nutritional labeling on FSA score in real conditions of purchase ;
• The capacity of a FoP labelling to bring about modifications in purchasing behaviors of consumers and to significantly improve the FSA score (so, nutrient intakes and further health);
• The effectiveness of a synthetic label compared to an analytical label and particularly for NUTRISCORE compared to other FoP labels, in particular for consumers who buy the cheapest products or have the lowest level of education ;
• Synthetic systems are more visible, better understood by consumers and constitute a better help for decision than analytical systems.
• NUTRISCORE appears to be the most effective system from the overall analysis

Point of situation
Decree July 19th 2016 on Supplementary nutritional information on foodstuffs
Notification to the Commission (April 24th 2017) : Draft decree establishing the form of supplementary presentation to the nutritional declaration recommended by the State
April 27 2017 Signature of a charter of commitments between the: Ministers of Health, Agriculture, Consumption And Some retailers and Producers : Auchan, Leclerc, Intermarché, Fleury Michon Danone will sign soon; Others are preparing
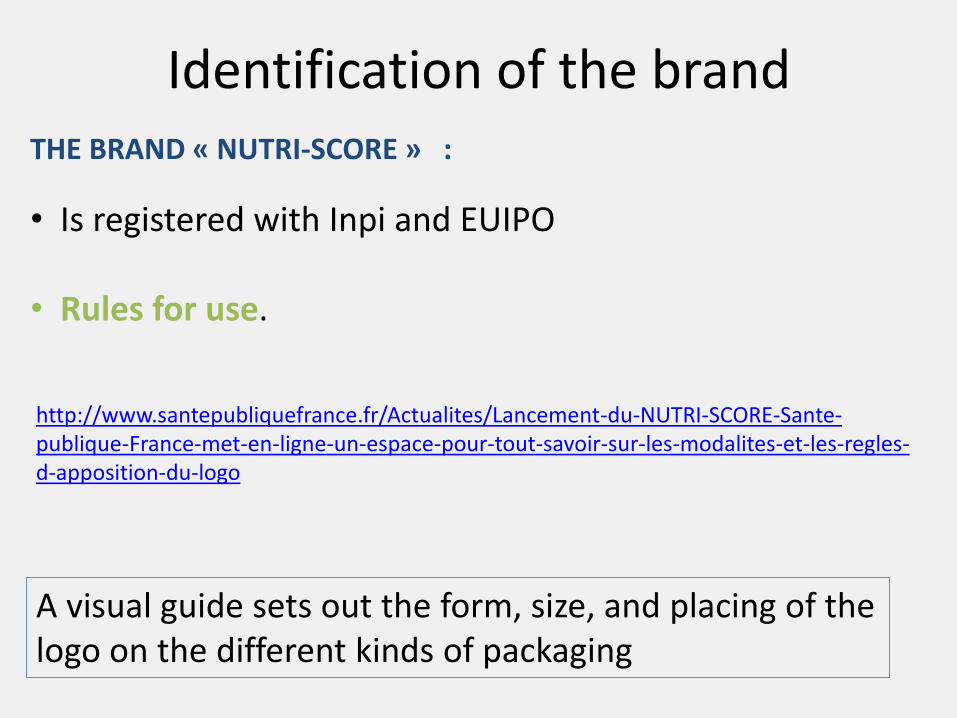
Identification of the brand THE BRAND « NUTRI-SCORE » :
• Is registered with Inpi and EUIPO • Rules for use.
A visual guide sets out the form, size, and placing of the logo on the different kinds of packaging
http://www.santepubliquefrance.fr/Actualites/Lancement-du-NUTRI-SCORE-Sante-publique-France-met-en-ligne-un-espace-pour-tout-savoir-sur-les-modalites-et-les-regles-d-apposition-du-logo

Cut offs of the FSA score for the definition of the 5 categories of the Nutri-Score
(source HCSP)
Classe Bornes du score Couleur
A Min à -1 Vert foncé
B 0 à 2 Vert clair
C 3 à 10 Orange clair
D 11 à 18 Orangé moyen
E 19 à Max Orange foncé
Adaptations pour 3 familles d’aliments: - Matières grasses ajoutées: beurre, huile… - Formages - Boissons
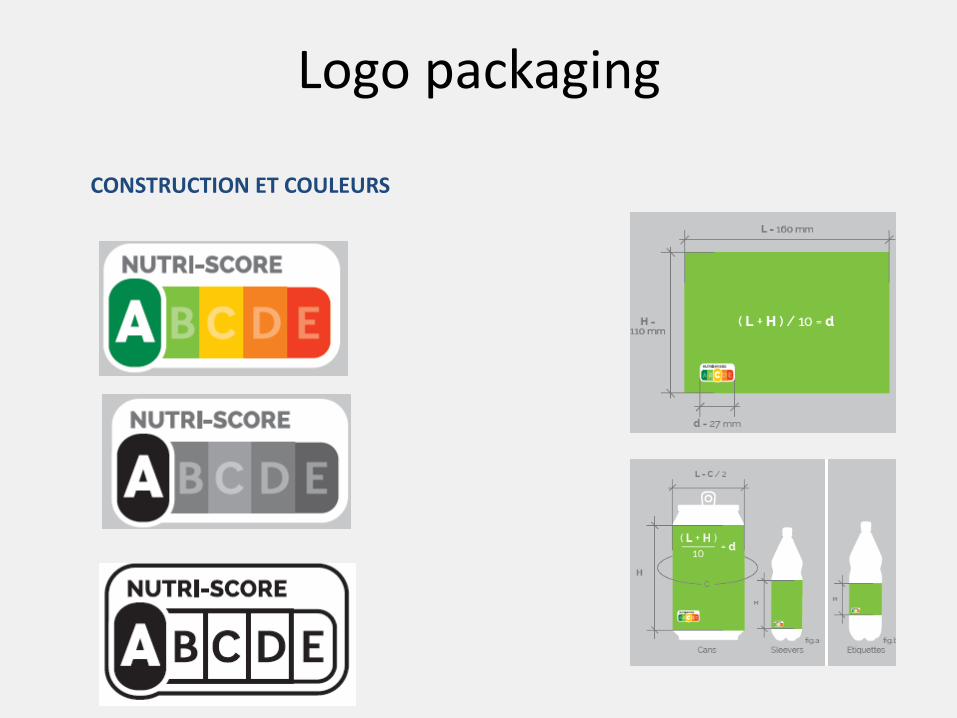
Logo packaging
CONSTRUCTION ET COULEURS

Thank you
The perspective: • The European discussion on this subject (planned by the regulation n°1169/2011 for the end of 2017):


![fsa imagery [Read-Only] · PDF fileObjectives of Presentation: ... FSA Imagery Requirements ... FSA Ortho Large Format FSA Ortho DOQs Small Format GIS Possible Yes Yes FAA](https://static.fdocuments.in/doc/165x107/5ab947c47f8b9ad5338dc355/fsa-imagery-read-only-of-presentation-fsa-imagery-requirements-fsa-ortho.jpg)