From the Mutual Fund House of the Year - Farsight
44
From the Mutual Fund House of the Year Presenting For further details of Birla Sun Life Century SIP refer overleaf. J u n e 2 0 0 8
Transcript of From the Mutual Fund House of the Year - Farsight

From the Mutual Fund House of the Year
Presenting
For further details of Birla Sun Life Century SIP refer overleaf.
J u n e 2 0 0 8

Birla Sun Life Century SIP is a product offering from Birla Sun Life Mutual Fund which aids you to Power your investments with an added benefit of upto 100 times monthly SIP installment Free life insurance cover.
Investing in Birla Sun Life Century SIP helps you to:
3
The Insurance cover available with Century SIP will come at no extra cost to the investor. The cost of insurance will be entirely borne by the AMC.
3
In the unfortunate event of the demise of an investor during the tenure of the SIP, the nominee gets the Fund Value + Insurance Cover equivalent upto 100 times monthly SIP installments. The insurance cover offered to the investor grows with the tenure of the SIP.
3 Continued Insurance Cover*
The life insurance cover offered to the eligible investor would continue even if the SIP stops after a minimum period of 3 years at the fund value subject to a maximum of 100 times of the monthly SIP installment. The cover ceases to exist on full/partial redemption or switching prior to completion of the SIP tenure.
*All the above mentioned limits are subject to maximum cover of Rs. 20 lacs per investor across all schemes/plans/folios.
Free Insurance Cover
Upto 100 times Insurance Cover*
3 Hassle Free
To avail of the life cover all an investor needs to do is enroll for CSIP & sign a “Declaration of Good Health”. In case of unfortunate demise of investor the insurance claim will be directly paid to the nominee by the insurance company (Birla Sun Life Insurance Company).
3 Benefits to the Family /Nominee
Assuming a scenario where in an investor had started a 10 year CSIP @ Rs. 20,000 pm installment and a rate of return @ 8% p.a.
On completion of the CSIP tenure, value of investment and insurance cover would be Rs. 36.59 lakhs and Rs. 20 lakhs respectively.
The illustration below explains the same.
Highlights of the Insurance Cover
Birla Sun Life Century SIPTaking care of your financial planning needs - completely
During Year 1 X 10^
During Year 2 Monthly SIP Installment X 50^
Year 3 onwards X 100^
^ Insurance Cover
For complete details on terms & conditions of Birla Sun Life Century SIP, Investors should read the Offer Document/ Key Information Memorandum available at Investor Service Centers and with Distributors carefully before investing.
Create wealth, by systematically investing as little as Rs. 1000 per month in Equity Schemes of Birla Sun Life Mutual Fund.
Protects, by providing a cushion of security through free insurance cover of up to 100 times the SIP installment in case of an unfortunate demise.
Features of Birla Sun Life Century SIP
Features Century SIP
Minimum CSIP Installment Rs. 1,000 pm
Entry Load* For purchase of units under CSIP: 2.25%
Exit Load** Redeemed / switched out within 3 yrs: 2% Nil thereafter
Payment Options ECS, Direct Debits & PDCs
Life Cover Proceeds^ Goes to the nominee
Benefits to Nominee^ Fund Value + Life Cover equivalent upto 100 times SIP installments
Schemes Available All Open Ended Equity Schemes
* Nil for Direct application**In the unfortunate event of death of the investor, no exit load on redemption/switching out of units by the nominee/joint holder, as the case may be.^in case of pre mature death
Incase of any unfortunate circumstances, the fund value & the value of life cover would payable to the nominee.
4000000
3600000
3200000
2800000
2400000
2000000
1600000
1200000
800000
400000
0
Year 1 Year 2 Year 3 Year 4 Year 5 Year 6 Year 7 Year 8 Year 9 Year 10
BSL Century SIP Fund Value Life Insurance Cover
Scenario – 10 Year SIP @ Rs. 20,000 pm Installment
36,58,921
Rate of Returns assumed @ 8% p.a. Computations - Internal
Unfortunate Event of Death at the end of year 5
Unfortunate Event of Death at the end of year 10
Fund ValueRs. in Lakhs
14.70
36.59
Life CoverRs. in Lakhs
20
20
Total Benefit to the Family
Rs. in Lakhs
34.70
56.59
Systematic Investment Plan with free life insurance cover of 100 times your monthly installment

Market OutlookJ u n e 2 0 0 8
EQUITY MARKET
DEBT MARKET
Our Investment Team (In alphabetical order):
A. Balasubramanian Chief Investment Officer
Achala Kanitkar Research Analyst - Equity
Ajay Argal Co - Head Equity
Ajay Garg Fund Manager - Equity
Ankit Sancheti Fund Manager - Equity
Atul Penkar Fund Manager - Equity
Hemang Dagli Sr. Dealer - Equity & Deri. Specialist
Hina Sampat Executive - Knowledge Management
Jignesh Shah Fund Manager
Lokesh Mallya Credit Analyst-Fixed Income
Mahesh Patil Co - Head Equity
Maneesh Dangi Co - Head Fixed Income
Paresh Khandelwal Equity Analyst
Prasad Dhonde Fund Manager - Debt
Sanjay Chawla Fund Manager - Equity
Satyabrata Mohanty Co - Head Fixed Income
Sujit Patki Dealer-Equity
Sunaina da Cunha Credit Analyst-Fixed Income
Vineet Maloo Fund Manager - Equity
The Central Statistical Organization (CSO) announced quick estimates of GDP
growth for Mar-2008 quarter at 8.8%. This compares with 8.8% (revised
upwards from 8.4%) and 9.3% (revised upwards from 8.9%) registered in Dec-
2007 and Sep-2007. The growth for FY 2008 stands at 9% compared with 9.6%
last year. Services sector growth accelerated while that for manufacturing and
agriculture slowed down bit.
Equity markets gave away part of gains amassed over previous month with Nifty
and Sensex declining by 5.73% and 5.04% respectively. IT and Metals sectors
were top performing sectors while Real Estate, Banks and Oil & Gas looked
feeble.
During the month, crude oil price has risen by 12.2% reaching US$ 127/bbl as
indicated by WTI Crude futures on traded on Nymex. Over a slightly longer-term
period of 12 months, the same has doubled from US$ 64/bbl. On the other
hand, domestic fuel prices in India (Petrol & Diesel) have risen only 3.5-4.5%;
thus severely straining the oil marketing companies’ finances. The government
faces the conundrum of letting fiscal deficit increase on account of massive
subsidy burden or risk fuel price hikes even as general elections are
approaching. Increasing oil import bill has stretched the current account deficit
taking Indian Rupee down by 14.8% from 40.50 to 42.16. A bloated fiscal
deficit could starve the country for already scarce capital and scuttle public and
private investment plans.
The bond market swayed in a wide range in either direction during the month of
May. The entire yield curve shifted higher and 10-year yield finished from 7.95%
at 8.10%. The market mood was positive in the first half of May starting with the
improved liquidity conditions at the start of the month. Bonds received a solid
boost in the second week with the release of the industrial production data that
was sharply weaker than expectations and reduced expectations of tighter
monetary policy.
However, rising inflation and oil prices soon took over and dragged bonds lower.
In the later part of the month, the money market went into a deficit as the third
part of the CRR hikes took effect, draining an estimated Rs. 9,000 crore from the
system. Concurrently, bond auctions sucked out cash and in the absence of
investment inflows, the impact was visible on money market liquidity that went
into a deficit.
Crude oil prices eased at the fag end of the month, offering mild solace to
sentiment under stress from the inflation front. However, anxiety over an
impending government decision over fuel prices kept the market on tenterhooks.
In addition to relief from crude prices, relaxation of ECB and FII investment
norms announced by the government helped bonds to cut losses.
Global commodity prices, fuel price increases, domestic inflation and a
politically hobbled government have resulted in rising volatility in equity markets.
The newly launched India NSE Volatility Index mirrored these sentiments as it
touched 34.86 during the month as compared to 25.16 at the beginning of the
month.
1It is estimated that 55% of Asian oil consumption comes from markets with some 2form of subsidy. Those subsidized markets combined account for over 16% of
global crude consumption. Over the past month, Malaysia, Taiwan and
Indonesia have taken decision to gradually unwind subsidies, while Vietnam has
also hinted towards the same. Thailand, however, seems to be moving in the
opposite direction and adding subsidies. High oil prices imply that a breakpoint
for fuel prices in India could be nigh.
In such a scenario, it is crucial to step back and have a dispassionate look at the
bigger picture of India’s domestic growth story. Although key factors of
favourable demographics, consumption and investments continue to underpin
growth argument, investors should expect volatility in near term. Extreme
reactions by market participants could, in fact, throw attractive opportunities to
pick up mis-priced assets.1,2 Source: Macquarie Research (Equities)
In other news, the RBI said it would conduct special open market operations in the secondary market in oil bonds held by state-run oil companies to provide liquidity to crude refiners.
The corporate bond yield curve tracked the overall trend of the risk-free curve but moved in a narrower range. The AAA 5-year yield ended at 9.61% from 9.5% offering a spread of 139 bps above the 5-year risk-free, mildly lower than 144 bps over the month. A gradually improving primary market was hit by liquidity constraints.
Outlook for bond markets
Our base case scenario is that commodities prices will fall and will eventually give central bankers across the emerging nations, a headroom to cut rates over next 12 months. We believe that high crude, steel and base metal prices will have serious impact on global disposable income which will finally ease pressure on commodity prices. But there is a possibility that supply side remains sticky and moderation in demand too may not ease pressure on input costs. High commodity prices cause economic distortions and eventually political turmoil. In such scenario, we may see some central banks resuming tightening bias in their monetary policy framework which may be bad for long duration bonds. Though we aren’t expecting monetary tightening in India but rising commodity prices pose a significant risk to our long held softer interest outlook.
03
As on May 31, 2008
Birla Sun Life Equity Fund
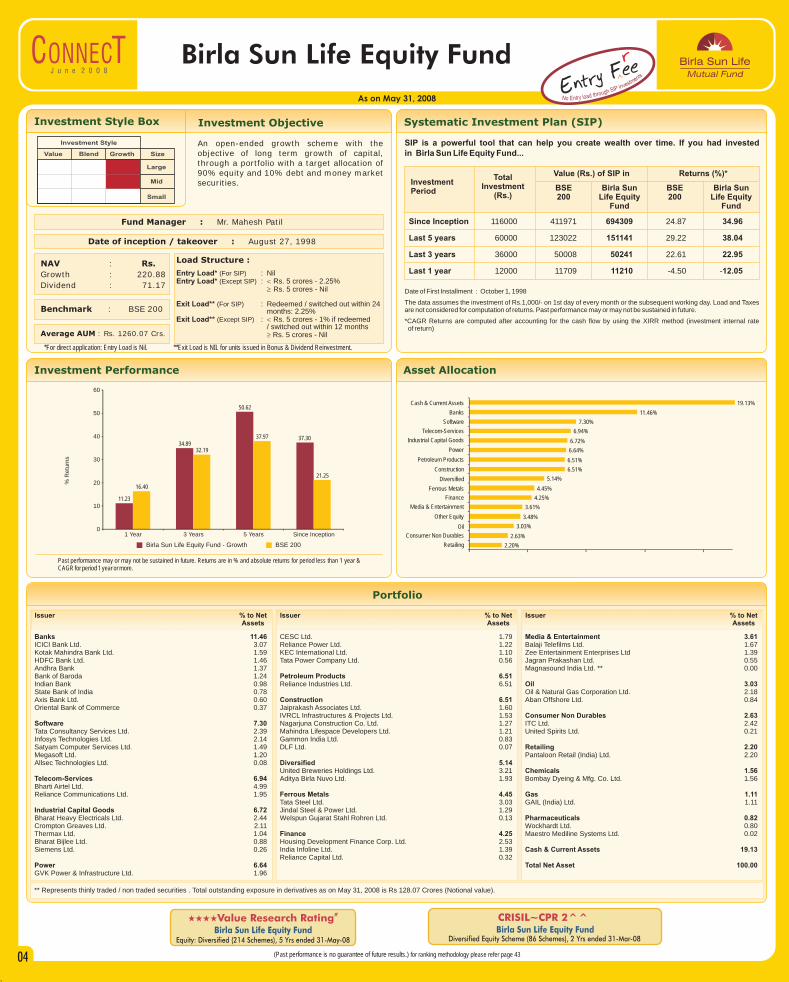
Investment Performance
Past performance may or may not be sustained in future. Returns are in % and absolute returns for period less than 1 year & CAGR for period 1 year or more.
Portfolio
Banks 11.46ICICI Bank Ltd. 3.07Kotak Mahindra Bank Ltd. 1.59HDFC Bank Ltd. 1.46Andhra Bank 1.37Bank of Baroda 1.24Indian Bank 0.98State Bank of India 0.78Axis Bank Ltd. 0.60Oriental Bank of Commerce 0.37
Software 7.30Tata Consultancy Services Ltd. 2.39Infosys Technologies Ltd. 2.14Satyam Computer Services Ltd. 1.49Megasoft Ltd. 1.20Allsec Technologies Ltd. 0.08
Telecom-Services 6.94Bharti Airtel Ltd. 4.99Reliance Communications Ltd. 1.95
Industrial Capital Goods 6.72Bharat Heavy Electricals Ltd. 2.44Crompton Greaves Ltd. 2.11Thermax Ltd. 1.04Bharat Bijlee Ltd. 0.88Siemens Ltd. 0.26
Power 6.64GVK Power & Infrastructure Ltd. 1.96
CESC Ltd. 1.79Reliance Power Ltd. 1.22KEC International Ltd. 1.10Tata Power Company Ltd. 0.56
Petroleum Products 6.51Reliance Industries Ltd. 6.51
Construction 6.51Jaiprakash Associates Ltd. 1.60IVRCL Infrastructures & Projects Ltd. 1.53Nagarjuna Construction Co. Ltd. 1.27Mahindra Lifespace Developers Ltd. 1.21Gammon India Ltd. 0.83DLF Ltd. 0.07
Diversified 5.14United Breweries Holdings Ltd. 3.21Aditya Birla Nuvo Ltd. 1.93
Ferrous Metals 4.45Tata Steel Ltd. 3.03Jindal Steel & Power Ltd. 1.29Welspun Gujarat Stahl Rohren Ltd. 0.13
Finance 4.25Housing Development Finance Corp. Ltd. 2.53India Infoline Ltd. 1.39Reliance Capital Ltd. 0.32
Media & Entertainment 3.61Balaji Telefilms Ltd. 1.67Zee Entertainment Enterprises Ltd 1.39Jagran Prakashan Ltd. 0.55Magnasound India Ltd. ** 0.00
Oil 3.03Oil & Natural Gas Corporation Ltd. 2.18Aban Offshore Ltd. 0.84
Consumer Non Durables 2.63ITC Ltd. 2.42United Spirits Ltd. 0.21
Retailing 2.20Pantaloon Retail (India) Ltd. 2.20
Chemicals 1.56Bombay Dyeing & Mfg. Co. Ltd. 1.56
Gas 1.11GAIL (India) Ltd. 1.11
Pharmaceuticals 0.82Wockhardt Ltd. 0.80Maestro Mediline Systems Ltd. 0.02
Cash & Current Assets 19.13
Total Net Asset 100.00
** Represents thinly traded / non traded securities . Total outstanding exposure in derivatives as on May 31, 2008 is Rs 128.07 Crores (Notional value).
SIP is a powerful tool that can help you create wealth over time. If you had invested in Birla Sun Life Equity Fund...
Systematic Investment Plan (SIP)
Asset Allocation
Date of First Installment : October 1, 1998
The data assumes the investment of Rs.1,000/- on 1st day of every month or the subsequent working day. Load and Taxes are not considered for computation of returns. Past performance may or may not be sustained in future.
*CAGR Returns are computed after accounting for the cash flow by using the XIRR method (investment internal rate of return)
An open-ended growth scheme with the objective of long term growth of capital, through a portfolio with a target allocation of 90% equity and 10% debt and money market securities.
Investment Objective
Date of inception / takeover : August 27, 1998
Fund Manager : Mr. Mahesh Patil
NAV : Rs.
Growth : 220.88
Dividend : 71.17
Load Structure :
Entry Load* (For SIP) : NilEntry Load* (Except SIP) : < Rs. 5 crores - 2.25%
³ Rs. 5 crores - Nil
Exit Load** (For SIP) : Redeemed / switched out within 24 months: 2.25%
Exit Load** (Except SIP) : < Rs. 5 crores - 1% if redeemed / switched out within 12 months ³ Rs. 5 crores - Nil
Benchmark : BSE 200
Investment Style Box
Investment Period
Total Investment
(Rs.)
Value (Rs.) of SIP in Returns (%)*
Birla Sun Life Equity
Fund
Birla Sun Life Equity
Fund
BSE200
BSE200
Value Blend Growth Size
Large
Mid
Small
Investment Style
Since Inception 116000 411971 694309 24.87 34.96
Last 5 years 60000 123022 151141 29.22 38.04
Last 3 years 36000 50008 50241 22.61 22.95
Last 1 year 12000 11709 11210 -4.50 -12.05
Issuer % to NetAssets
Issuer % to NetAssets
Issuer % to NetAssets
Birla Sun Life Equity Fund - Growth BSE 200
% R
etu
rns
#iiiiValue Research Rating
Birla Sun Life Equity FundEquity: Diversified ( Schemes), 5 214 Yrs ended 31-May-08
(Past performance is no guarantee of future results.) for ranking methodology please refer page 43
*For direct application: Entry Load is Nil. **Exit Load is NIL for units issued in Bonus & Dividend Reinvestment.
J u n e 2 0 0 8
Average AUM : Rs. 1260.07 Crs.
04
11.23
34.89
50.62
37.30
16.40
32.19
37.97
21.25
0
10
20
30
40
50
60
1 Year 3 Years 5 Years Since Inception
2.20%
2.63%
3.03%
3.48%
3.61%
4.25%
4.45%
5.14%
6.51%
6.51%
6.64%
6.72%
6.94%
7.30%
11.46%
Retailing
Consumer Non Durables
Oil
Other Equity
Media & Entertainment
Finance
Ferrous Metals
Diversified
Construction
Petroleum Products
Power
Industrial Capital Goods
Telecom-Services
Software
Banks
Cash & Current Assets 19.13%
CRISIL~CPR 2^^Birla Sun Life Equity Fund
Diversified Equity Scheme ( Schemes), 2 86 Yrs ended 31-Mar-08

Birla Midcap Fund
As on May 31, 2008
Investment Performance
Past performance may or may not be sustained in future. Returns are in % and absolute returns for period less than 1 year & CAGR for period 1 year or more.
Portfolio
Consumer Non Durables 11.44ITC Ltd. 3.65Shaw Wallace Company Ltd. 2.78Triveni Engineering & Industries Ltd. 2.17Marico Ltd. 2.09Balrampur Chini Mills Ltd. 0.75
Industrial Capital Goods 10.00Havells India Ltd. 2.16Bharati Shipyard Ltd. 1.63Crompton Greaves Ltd. 1.52Thermax Ltd. 1.35Bharat Bijlee Ltd. 1.35Jyoti Structures Ltd. 1.24Bharat Electronics Ltd. 0.76
Banks 9.57Union Bank of India. 3.05Federal Bank Ltd. 1.91Indian Overseas Bank. 1.81ING Vysya Bank Ltd. 1.52Indian Bank. 1.28
Construction 8.72Simplex Infrastructures Ltd. 3.38IVRCL Infrastructures & Projects Ltd. 2.92Akruti City Ltd. 1.65Hindustan Construction Co. Ltd. 0.77
Consumer Durables 4.81Blue Star Ltd. 3.12Voltas Ltd. 1.70
Ferrous Metals 4.52Monnet Ispat Ltd. 2.50
Welspun Gujarat Stahl Rohren Ltd. 2.02
Chemicals 3.58Solar Explosives Ltd. 3.58
Fertilisers 3.49Tata Chemicals Ltd. 3.49
Industrial Products 3.43Sintex Industries Ltd. 3.43
Power 3.41GVK Power & Infrastructure Ltd. 1.72CESC Ltd. 1.69
Non - Ferrous Metals 3.28Nava Bharat Ventures Ltd. 3.28
Software 3.17Tata Consultancy Services Ltd. 1.80Tech Mahindra Ltd. 1.37
Media & Entertainment 3.07Balaji Telefilms Ltd. 1.70Television Eighteen India Ltd. 1.37
Diversified 2.80Aditya Birla Nuvo Ltd. 2.80
Auto 2.48Ashok Leyland Ltd. 2.48
Pharmaceuticals 2.32Glenmark Pharmaceuticals Ltd. 2.32
Cement 2.21Century Textile & Industries Ltd. 2.21
Textile Products 1.77Raymond Ltd. 1.77
Trading 1.74Adani Enterprises Ltd. 1.74
Hotels 1.44Indian Hotels Co. Ltd. 1.44
Commodity Chemicals 1.23Gujarat Alkalies & Chemicals Ltd. 1.23
Transportation 1.14Great Eastern Shipping Company Ltd. 1.14
Gas 0.95GAIL (India) Ltd. 0.95
Auto Ancillaries 0.55Exide Industries Ltd. 0.55
Corporate Debt 0.10Trent Ltd. ** 0.10
Cash & Current Assets 8.78
Total Net Asset 100.00
SIP is a powerful tool that can help you create wealth over time. If you had invested in Birla Midcap Fund…
Systematic Investment Plan (SIP)
Asset Allocation
Date of First Installment - November 1, 2002.
The data assumes the investment of Rs.1,000/- on 1st day of every month or the subsequent working day. Load and Taxes are not considered for computation of returns. Past performance may or may not be sustained in future.
*CAGR Returns are computed after accounting for the cash flow by using the XIRR method (investment internal rate of return)
An Open-ended growth scheme with the objective to achieve long-term growth of capital at controlled level of risk by primarily investing in midcap stocks.
Investment Objective
Date of inception / takeover : October 3, 2002
Fund Manager : Mr. A. Balasubramaniam & Mr. Sanjay Chawla
NAV : Rs.
Growth : 81.20
Dividend : 24.96
Benchmark : CNX Midcap
Investment Style Box
Investment Period
Total Investment
(Rs.)
Value (Rs.) of SIP in Returns (%)*
Birla Midcap Fund
Birla Midcap Fund
CNX Midcap
CNX Midcap
Since Inception 67000 173246 197980 34.50 39.56
Last 5 years 60000 125765 143357 30.16 35.75
Last 3 years 36000 48883 50251 20.96 22.96
Last 1 year 12000 11570 11266 -6.62 -11.22
Value Blend Growth Size
Large
Mid
Small
Investment Style
Load Structure (Incl. for SIP):
Entry Load* :< Rs. 5 crores - 2.25%
³ Rs. 5 crores - Nil
Exit Load** :< Rs. 5 crores - 1% if redeemed
/ switched out within 12 months
³ Rs. 5 crores - Nil
Issuer % to NetAssets
Issuer % to NetAssets
Issuer % to NetAssets
Birla Mid Cap Fund - Growth CNX Midcap
CRISIL~CPR 2^^Birla Mid Cap Fund
Diversified Equity Scheme ( Schemes), 2 86 Yrs ended 31-Mar-08
(Past performance is no guarantee of future results.) for ranking methodology please refer page 43
% R
etu
rns
** Represents thinly traded / non traded securities . Total Percentage of thinly/non traded securities is 0.10%.
J u n e 2 0 0 8
Average AUM: Rs. 648.65 Crores
05
*For direct application: Entry Load is Nil. **Exit Load is NIL for units issued in Bonus & Dividend Reinvestment.
14.28
33.51
46.6444.77
17.14
29.40
41.13 42.06
0
5
10
15
20
25
30
35
40
45
50
1 Year 3 Years 5 Years Since Inception
0.10%
2.21%
2.32%
2.48%
2.80%
3.07%
3.17%
3.28%
3.41%
3.43%
3.49%
3.58%
4.52%
4.81%
8.72%
8.78%
8.82%
9.57%
10.00%
11.44%
Corporate Debt
Cement
Pharmaceuticals
Auto
Diversified
Media & Entertainment
Software
Non - Ferrous Metals
Power
Industrial Products
Fertilisers
Chemicals
Ferrous Metals
Consumer Durables
Construction
Cash & Current Assets
Other Equity
Banks
Industrial Capital Goods
Consumer Non Durables

Birla Sun Life Frontline Equity Fund
As on May 31, 2008
Investment Performance
Past performance may or may not be sustained in future. Returns are in % and absolute returns for period less than 1 year & CAGR for period 1 year or more.
Portfolio
Banks 12.26ICICI Bank Ltd. 2.69ING Vysya Bank Ltd. 2.32Axis Bank Ltd. 2.10HDFC Bank Ltd. 1.40Indian Bank 1.38Union Bank of India 1.29State Bank of India 1.08
Software 8.81Tata Consultancy Services Ltd. 3.77Infosys Technologies Ltd. 2.58Satyam Computer Services Ltd. 1.43HCL Technologies Ltd. 1.03
Petroleum Products 8.63Reliance Industries Ltd. 7.58Indian Oil Corporation Ltd. 1.05
Telecom-Services 8.33Bharti Airtel Ltd. 4.43Reliance Communications Ltd. 2.35Idea Cellular Ltd. 1.56
Industrial Capital Goods 6.51Bharat Heavy Electricals Ltd. 2.06Bharat Electronics Ltd. 1.92Crompton Greaves Ltd 1.75Thermax Ltd. 0.77
Construction 6.06Larsen & Toubro Ltd. 2.44Jaiprakash Associates Ltd. 1.51DLF Ltd. 1.45Madhucon Projects Ltd. 0.65
Power 5.95GVK Power & Infrastructure Ltd. 1.62Reliance Infrastructure Ltd. 1.56Reliance Power Ltd. 1.43CESC Ltd. 1.34
Finance 4.96Housing Development Finance Corporation Ltd. 2.43India Infoline Ltd. 1.44ICRA Ltd. 1.10
Consumer Non Durables 4.51ITC Ltd. 3.83United Spirits Ltd. 0.68
Ferrous Metals 4.37Tata Steel Ltd. 3.03Jindal Steel & Power Ltd. 1.35
Auto 2.55Maruti Suzuki India Ltd. 1.63Hero Honda Motors Ltd. 0.92
Oil 2.39Oil & Natural Gas Corporation Ltd. 2.39
Gas 2.19GAIL (India) Ltd. 2.19
Hotels 2.00Indian Hotels Co. Ltd. 2.00
Media & Entertainment 1.79Balaji Telefilms Ltd. 1.30Zee Entertainment Enterprises Ltd. 0.48
Pharmaceuticals 1.62Cipla Ltd. 1.28Wockhardt Ltd. 0.35
Cement 1.41Century Textile & Industries Ltd. 1.41
Fertilisers 0.40Gujarat Narmada Valley Fertilisers Co. Ltd. 0.40
Cash & Current Assets 15.25
Total Net Asset 100.00
SIP is a powerful tool that can help you create wealth over time. If you had invested in Birla Sun Life Frontline Equity Fund...
Systematic Investment Plan (SIP)
Asset Allocation
Date of First Installment : October 01, 2002
The data assumes the investment of Rs.1,000/- on 1st day of every month or the subsequent working day. Load and Taxes are not considered for computation of returns. Past performance may or may not be sustained in future.
*CAGR Returns are computed after accounting for the cash flow by using the XIRR method (investment internal rate of return)
An open-end growth scheme with the objective of long term growth of capital, through a portfolio with a target allocation of 100% equity by aiming at being as diversified across various industries and or sectors as its chosen benchmark index, BSE 200.
Investment Objective
Date of inception / takeover : August 30, 2002
Fund Manager : Mr. Mahesh Patil
NAV : Rs.
Growth : 63.41
Dividend : 22.27
Benchmark : BSE 200
Investment Style Box
Investment Period
Total Investment
(Rs.)
Value (Rs.) of SIP in Returns (%)*
Birla Sun Life Frontline
Equity Fund
Birla Sun Life Frontline
Equity Fund
BSE200
BSE200
Value Blend Growth Size
Large
Mid
Small
Investment Style
Since Inception 68000 166812 188390 31.97 36.48
Last 5 Years 60000 123022 137018 29.22 33.81
Last 3 years 36000 50008 52410 22.61 26.04
Last 1 year 12000 11709 11679 -4.50 -4.95
#iiiValue Research Ratingi
Birla Sun Life Frontline Equity FundEquity: Diversified ( Schemes), 5 214 Yrs ended 31-May-08
CRISIL~CPR 2^^Birla Sun Life Frontline Equity Fund
(Past performance is no guarantee of future results.) for ranking methodology please refer page 43
Load Structure (Incl. for SIP):Entry Load* :< Rs. 5 crores - 2.25%
³ Rs. 5 crores - NilExit Load**:< Rs. 5 crores - 1% if redeemed
/ switched out within 12 months ³ Rs. 5 crores - Nil
Issuer % to NetAssets
Issuer % to NetAssets
Issuer % to NetAssets
Birla Sun Life Frontline Equity Fund - Growth BSE 200
% R
etu
rns
J u n e 2 0 0 8
Total outstanding exposure in derivatives as on May 31, 2008 is Rs 28.95 Crores (Notional value).
&&CNBC TV-18 CRISIL AWARD 2007Birla Sun Life Frontline Equity Fund
Category: Large Cap oriented Equity Fund 1 yr performance ended 31 Dec, ‘07 Total Schemes in Category = 22
Average AUM: Rs. 410.91 Crores
06
*For direct application: Entry Load is Nil. **Exit Load is NIL for units issued in Bonus & Dividend Reinvestment.
15.10
37.23
41.45
37.86
16.40
32.19
37.97
34.04
0
5
10
15
20
25
30
35
40
45
1 Year 3 Years 5 Years Since Inception
2.00%
2.19%
2.39%
2.55%
4.37%
4.51%
4.96%
5.22%
5.95%
6.06%
6.51%
8.33%
8.63%
8.81%
12.26%
15.25%
Hotels
Gas
Oil
Auto
Ferrous Metals
Consumer Non Durables
Finance
Other Equity
Power
Construction
Industrial Capital Goods
Telecom-Services
Petroleum Products
Software
Banks
Cash & Current Assets
Diversified Equity Scheme ( Schemes), 2 86 Yrs ended 31-Mar-08

Birla Sun Life Tax Relief '96An Open-ended Equity Linked Savings Scheme (ELSS) with a lock-in of 3 years
As on May 31, 2008
Investment Performance
Past performance may or may not be sustained in future. Returns are in % and absolute returns for period less than 1 year & CAGR for period 1 year or more. Returns assume reinvestment of the tax free dividend declared.
Portfolio
Banks 13.14ICICI Bank Ltd. 3.53HDFC Bank Ltd. 2.74ING Vysya Bank Ltd. 2.48Axis Bank Ltd. 2.14Kotak Mahindra Bank Ltd. 1.40State Bank of India 0.85
Finance 11.21ICRA Ltd. 3.55Housing Development Finance Corp. Ltd. 3.32India Infoline Ltd. 2.24Reliance Capital Ltd. 2.10
Industrial Capital Goods 8.04Honeywell Automation India Ltd. 2.43Bharat Bijlee Ltd. 1.88Crompton Greaves Ltd. 1.73Siemens Ltd. 1.02Bharat Heavy Electricals Ltd. 0.99
Diversified 7.72United Breweries Holdings Ltd. 5.97Aditya Birla Nuvo Ltd. 1.75
Petroleum Products 7.26Reliance Industries Ltd. 7.26
Construction 6.35Larsen & Toubro Ltd. 4.91Punj Lloyd Ltd. 1.44
Power 6.02Reliance Infrastructure Ltd. 2.80Reliance Power Ltd. 1.78GVK Power & Infrastructure Ltd. 1.45
Ferrous Metals 5.22Jindal Steel & Power Ltd. 3.54Tata Steel Ltd. 1.68
Telecom-Services 4.50Bharti Airtel Ltd. 4.01Spice Communications Ltd. 0.49
Hotels 3.57Asian Hotels Ltd. 2.04Taj GVK Hotels & Resorts Ltd. 1.53
Auto Ancillaries 3.36Bosch Ltd. 2.30MRF Ltd. 1.06
Consumer Non Durables 3.15Shaw Wallace Company Ltd. 2.01
Radico Khaitan Ltd 1.14
Media & Entertainment 3.09Television Eighteen India Ltd. 3.09Magnasound India Ltd. ** 0.00
Auto 2.64Maruti Suzuki India Ltd. 1.75Mahindra & Mahindra Ltd. 0.89
Software 2.49Infosys Technologies Ltd. 1.69Tata Consultancy Services Ltd. 0.80
Consumer Durables 1.53Blue Star Ltd. 1.53
Pesticides 1.38United Phosphorous Ltd. 1.38
Trading 0.82Uniphos Enterprises Ltd. 0.82
Cash & Current Assets 8.53
Total Net Asset 100.00
** Represents thinly traded / non traded securities.Total outstanding exposure in derivatives as on May 31, 2008 is Rs 33.95Crores (Notional value).
SIP is a powerful tool that can help you create wealth over time. If you had invested in Birla Sun Life Tax Relief '96...
Systematic Investment Plan (SIP)
Asset Allocation
Date of First Installment : April 1, 1996
The data assumes the investment of Rs.1,000/- on 1st day of every month or the subsequent working day. Load and Taxes are not considered for computation of returns. Past performance may or may not be sustained in future.
*CAGR Returns are computed after accounting for the cash flow by using the XIRR method (investment internal rate of return)
An open-end equity linked savings scheme (ELSS) with the objective of long term growth of capital through a portfolio with a target allocation of 80% equity, 20% debt and money market securities
Investment Objective
Date of inception / takeover : March 29, 1996
Fund Manager : Mr. Ajay Garg
NAV : Rs.
Growth* : 9.88
Dividend : 90.43*Introduced with effect from 06/03/08
Load Structure (Incl. for SIP):Entry Load* : < Rs. 5 crores - 2.25%
³ Rs. 5 crores - NilExit Load : NIL
Benchmark : BSE 200 Average AUM: Rs. 677.72 Crores
Investment Style Box
Investment Period
Total Investment
(Rs.)
Value (Rs.) of SIP in Returns (%)*
Birla Sun Life Tax
Relief '96
Birla Sun Life Tax
Relief '96
BSE200
BSE200
Value Blend Growth Size
Large
Mid
Small
Investment Style
Since Inception 146000 585467 1708638 21.10 36.73
Last 5 years 60000 123022 125659 29.22 30.12
Last 3 years 36000 50008 49292 22.61 21.56
Last 1 year 12000 11709 10965 -4.50 -15.69
CRISIL~CPR 2^^Birla Sun Life Tax Relief '96
Equity Linked Savings Scheme (21 Schemes), 2 Yrs ended 31-Mar-08
Issuer % to NetAssets
Issuer % to NetAssets
Issuer % to NetAssets
Birla Sun Life Tax Relief ‘96 - Dividend Plan BSE 200
Ranked 3rd among Top Performing Equity&
Funds in the World by LipperBirla Sun Life Tax Relief '96
Equity Funds (6302 funds), 10 yrs ended 31 Dec 07
(Past performance is no guarantee of future results.) for ranking methodology please refer page 43
% R
etu
rns
J u n e 2 0 0 8
07
*For direct application: Entry Load is Nil. **Exit Load is NIL for units issued in Bonus & Dividend Reinvestment.
11.00
33.54
40.49
37.28
16.40
32.19
37.97
15.69
0
5
10
15
20
25
30
35
40
45
1 Year 3 Years 5 Years Since Inception
2.49%
2.64%
3.09%
3.15%
3.36%
3.57%
3.72%
4.50%
5.22%
6.02%
6.35%
7.26%
7.72%
8.04%
8.53%
11.21%
13.14%
Software
Auto
Media & Entertainment
Consumer Non Durables
Auto Ancillaries
Hotels
Other Equity
Telecom-Services
Ferrous Metals
Power
Construction
Petroleum Products
Diversified
Industrial Capital Goods
Cash & Current Assets
Finance
Banks

Birla Infrastructure Fund
As on May 31, 2008
Investment Performance
Past performance may or may not be sustained in future. Returns are in % and absolute returns for period less than 1 year & CAGR for period 1 year or more.
Portfolio
Industrial Capital Goods 12.88Bharat Heavy Electricals Ltd. 3.06Crompton Greaves Ltd. 2.74Bharati Shipyard Ltd. 2.49Thermax Ltd. 1.96Bharat Electronics Ltd. 1.46Jyoti Structures Ltd. 1.18
Power 11.98CESC Ltd. 3.31KEC International Ltd. 1.87Reliance Power Ltd. 1.78Reliance Infrastructure Ltd. 1.54Kalpataru Power Transmission Ltd. 1.26GVK Power & Infrastructure Ltd. 1.22Power Grid Corporation of (I) Ltd. 1.00
Construction 11.05Larsen & Toubro Ltd. 2.31Madhucon Projects Ltd. 1.87Jaiprakash Associates Ltd. 1.53Nagarjuna Construction Co. Ltd. 1.36GMR Infrastructure Ltd. 1.17ITD Cementation India Ltd. 1.17Simplex Infrastructures Ltd. 1.15Hindustan Construction Co. Ltd. 0.50
Banks 6.46ICICI Bank Ltd. 2.10
South Indian Bank Ltd. 1.30State Bank of India 1.05Axis Bank Ltd. 0.95Kotak Mahindra Bank Ltd. 0.57Central Bank of India 0.49
Telecom-Services 6.16Bharti Airtel Ltd. 4.08Reliance Communications Ltd. 2.08
Ferrous Metals 6.09Jindal Steel & Power Ltd. 3.21Tata Steel Ltd. 2.26Jindal Saw Ltd. 0.62
Petroleum Products 5.85Reliance Industries Ltd. 5.85
Industrial Products 5.46Kirloskar Oil Engines Ltd. 2.25Sintex Industries Ltd. 1.31Finolex Cables Ltd. 1.25Torrent Cables Ltd. 0.65
Finance 5.41Housing Development Finance Corp. Ltd. 2.59Rural Electrification Corporation Ltd 1.11Power Finance Corporation Ltd 0.90Infrastructure Development Finance Co. Ltd 0.81
SIP is a powerful tool that can help you create wealth over time. If you had invested in Birla Infrastructure Fund...
Systematic Investment Plan (SIP)
Asset Allocation
Date of First Installment : April 01, 2006
The data assumes the investment of Rs.1,000/- on 1st day of every month or the subsequent working day. Load and Taxes are not considered for computation of returns. Past performance may or may not be sustained in future.
*CAGR Returns are computed after accounting for the cash flow by using the XIRR method (investment internal rate of return)
An open-end growth scheme with the objective to providing for medium to long-term capital appreciation by investing predominantly in a diversified portfolio of equity and equity related securities of companies that are participating in the growth and development of Infrastructure in India.
Investment Objective
Date of inception / takeover : March 17, 2006
Fund Manager : Mr. Mahesh Patil
NAV : Rs.
Growth : 14.13
Dividend : 13.12
Benchmark :S&P CNX NIFTY
Average AUM : Rs. 501.60 Crs
Investment Style Box
Investment Period
Total Investment
(Rs.)
Value (Rs.) of SIP in Returns (%)*
Birla Infrastructure
Fund
Birla Infrastructure
Fund
S&P CNX NIFTY
S&P CNX NIFTY
Value Blend Growth Size
Large
Mid
Small
Investment Style
Since Inception 26000 30710 28967 15.61 9.96
Last 1 year 12000 11743 10624 -3.97 -20.66
Issuer % to NetAssets
Issuer % to NetAssets
Issuer % to NetAssets
% R
etu
rns
Birla Infrastructure Fund - Growth S&P CNX Nifty
Octav Investments Limited.** 0.00
Oil 3.85Oil & Natural Gas Corporation Ltd. 2.40Aban Offshore Ltd. 1.45
Gas 2.41Gujarat Gas Co. Ltd. 1.41GAIL (India) Ltd. 1.01
Transportation 2.20Gateway Distriparks Ltd. 1.40Arshiya International Ltd 0.80
Cement 1.58India Cements Ltd 1.58
Hotels 1.00Taj GVK Hotels & Resorts Ltd. 1.00
Consumer Non Durables 0.31Hindustan Sanitaryware & Industries Ltd. 0.31
Cash & Current Assets 17.30
Total Net Asset 100.00
J u n e 2 0 0 8
** Represents thinly traded/ non traded securities and illiquid securities.Total outstanding exposure in derivatives as on May 31, 2008 is Rs 36.62 Crores (Notional value).
&&CNBC TV-18 CRISIL AWARD 2007
Birla Infrastructure Fund – GrowthEmerging Equity Fund of the Year
1 yr performance ended 31 Dec, ‘07. Total Schemes in Category = 14(Past performance is no guarantee of future results.) for ranking methodology please refer page 4308
*For direct application: Entry Load is Nil. **Exit Load is NIL for units issued in Bonus & Dividend Reinvestment.
Load Structure :
Entry Load* (For SIP) : NilEntry Load* (Except SIP) : < Rs. 5 crores - 2.25%
³ Rs. 5 crores - Nil
Exit Load** (For SIP) : Redeemed / switched out within 24 months: 2.25%
Exit Load** (Except SIP) : < Rs. 5 crores - 1% if redeemed / switched out within 12 months ³ Rs. 5 crores - Nil
8.17
16.97
14.56
20.40
0
5
10
15
20
25
1 Year Since Inception
Cash & Currents Asset
2.20%
2.41%
2.89%
3.85%
5.41%
5.46%
5.85%
6.09%
6.16%
6.46%
11.05%
11.98%
12.88%
17.30%
Transportation
Gas
Other Equity
Oil
Finance
Industrial Products
Petroleum Products
Ferrous Metals
Telecom-Services
Banks
Construction
Power
Industrial Capital Goods
CRISIL~CPR 2^^Birla Infrastructure Fund
Diversified Equity Scheme 86 Yrs ended 31-Mar-08 ( Schemes), 2

Birla Sun Life Basic Industries Fund
As on May 31, 2008
Investment Performance
Past performance may or may not be sustained in future. Returns are in % and absolute returns for period less than 1 year & CAGR for period 1 year or more.
Portfolio
Petroleum Products 13.67Reliance Industries Ltd. 7.38Apar Industries Ltd. 3.29Indian Oil Corporation Ltd. 1.21Hindustan Petroleum Corporation Ltd. 0.91Bharat Petroleum Corporation Ltd. 0.88
Industrial Capital Goods 10.87Bharat Heavy Electricals Ltd. 2.79Bharati Shipyard Ltd. 2.76Crompton Greaves Ltd. 2.12Voltamp Transformers Ltd. 1.40Jyoti Structures Ltd. 1.18Thermax Ltd. 0.63
Banks 7.80ICICI Bank Ltd. 2.74Bank of Baroda 2.07Union Bank of India 1.61Indian Bank 0.78Kotak Mahindra Bank Ltd. 0.60
Oil 7.67Great Offshore Ltd. 3.75Oil & Natural Gas Corporation Ltd. 2.27Cairn India Ltd. 1.65
Ferrous Metals 7.64Jindal Steel & Power Ltd. 3.78
Jindal Saw Ltd. 1.99Tata Steel Ltd. 1.39Tata Sponge Iron Ltd. 0.48
Finance 7.48Housing Development Finance Corp. Ltd. 4.20Infrastructure Development Finance Co. Ltd. 1.58Indiabulls Securities Limited. 1.03Rural Electrification Corporation Ltd 0.42India Infoline Ltd. 0.25
Construction 6.06Nagarjuna Construction Co. Ltd. 1.79Larsen & Toubro Ltd. 1.60Patel Engineering Ltd. 1.26Jaiprakash Associates Ltd. 0.82IVRCL Infrastructures & Projects Ltd. 0.59
Industrial Products 4.51Sintex Industries Ltd. 3.24TRF Ltd. 0.84Carborundum Universal Ltd. 0.43
Power 3.25Tata Power Company Ltd. 1.88Reliance Infrastructure Ltd. 1.37
Gas 2.91BOC India Ltd. 2.91
Mining 2.74Gujarat NRE Coke Ltd 2.74
Chemicals 1.59Bombay Dyeing & Mfg. Co. Ltd. 1.59
Fertilisers 1.33Gujarat Narmada Valley Fertilisers Co. Ltd. 1.33
Auto Ancillaries 1.14Exide Industries Ltd. 1.14
Non - Ferrous Metals 1.01Sterlite Industries (India) Ltd. 1.01
Cement 0.87India Cements Ltd 0.87
Auto 0.75Mahindra & Mahindra Ltd. 0.75
Cash & Current Assets 18.71
Total Net Asset 100.00
SIP is a powerful tool that can help you create wealth over time. If you had invested in Birla Sun Life Basic Industries Fund...
Systematic Investment Plan (SIP)
Asset Allocation
Date of First Installment : March 01, 2000
The data assumes the investment of Rs.1,000/- on 1st day of every month or the subsequent working day. Load and Taxes
are not considered for computation of returns. Past performance may or may not be sustained in future.
*CAGR Returns are computed after accounting for the cash flow by using the XIRR method (investment internal rate
of return)
A multi-sector open-end growth scheme with the objective of long term growth capital, through a portfolio with a target allocation of 100% equity, focusing on investing in companies sensitive to economic cycles andcommodity pricing cycles. The investments will be in companies which are often referred to as cyclical companies.
Investment Objective
Date of inception / takeover : January 15, 2000
Fund Manager : Mr. Ankit Sancheti
NAV : Rs.
Growth : 83.38
Dividend : 32.32
Benchmark : BSE 200 Average AUM : Rs. 137.13 Crores
Investment Style Box
Investment Period
Total Investment
(Rs.)
Value (Rs.) of SIP in Returns (%)*
Birla Sun Life Basic Indus-
tries Fund
Birla Sun Life Basic Indus-
tries Fund
BSE200
BSE200
Value Blend Growth Size
Large
Mid
Small
Investment Style
Since Inception 99000 323823 475769 27.77 36.82
Last 5 years 60000 123022 124426 29.22 29.70
Last 3 years 36000 50008 47584 22.61 19.03
Last 1 year 12000 11709 10935 -4.50 -16.14
Issuer % to NetAssets
Issuer % to NetAssets
Issuer % to NetAssets
Birla Sun Life Basic Industries - Growth BSE 200
% R
etu
rns
Load Structure (Incl. for SIP)Entry Load*:< Rs. 5 crores - 2.25%
³ Rs. 5 crores - NilExit Load**:< Rs. 5 crores - 1% if redeemed
/ switched out within 12 months ³ Rs. 5 crores - Nil
CRISIL~CPR 2^^Birla Sun Life Basic Industries Fund
Diversified Equity Scheme 86 Yrs ended 31-Mar-08 ( Schemes), 2 for ranking methodology please refer page 43(Past performance is no guarantee of future results.)
J u n e 2 0 0 8
Total outstanding exposure in derivatives as on May 31, 2008 is Rs 13.10 Crores (Notional value).
09
*For direct application: Entry Load is Nil. **Exit Load is NIL for units issued in Bonus & Dividend Reinvestment.
14.95
30.90
40.95
28.81
16.40
32.19
37.97
15.38
0
5
10
15
20
25
30
35
40
45
1 Year 3 Years 5 Years Since Inception
2.74%
2.91%
3.25%
4.51%
6.06%
6.69%
7.48%
7.64%
7.67%
7.80%
10.87%
13.67%
18.71%
Mining
Gas
Power
Industrial Products
Construction
Other Equity
Finance
Ferrous Metals
Oil
Banks
Industrial Capital Goods
Petroleum Products
Cash & Current Assets

Birla India GenNext Fund
As on May 31, 2008
Investment Performance
Past performance may or may not be sustained in future. Returns are in % and absolute returns for period less than 1 year & CAGR for period 1 year or more.
Portfolio
Consumer Non Durables 25.54
ITC Ltd. 5.50
Glaxosmithkline Consumer Healthcare Ltd. 4.90
Asian Paints (India) Ltd. 3.20
Dabur India Ltd. 3.03
Hindustan Unilever Ltd. 2.61
Radico Khaitan Ltd 2.41
Titan Industries Ltd. 2.01
Godrej Consumer Products Ltd. 1.26
Colgate-Palmolive (India) Ltd. 0.63
Banks 13.28
Axis Bank Ltd. 5.53
Federal Bank Ltd. 4.45
ING Vysya Bank Ltd. 3.30
Pharmaceuticals 7.05
Sun Pharmaceutical Industries Ltd. 5.22
Glaxosmithkline Pharmaceuticals Ltd. 1.82
Media & Entertainment 5.70
Zee Entertainment Enterprises Ltd 2.96
Television Eighteen India Ltd. 2.74
Finance 5.03
Housing Development Finance Corp. Ltd. 5.03
Auto 4.56
Bajaj Auto Ltd. 2.56
Maruti Suzuki India Ltd. 2.00
Software 4.47
Educomp Solutions Ltd. 2.24
Everonn Systems India Ltd. 2.23
Consumer Durables 3.68
Bajaj Electricals Ltd. 3.68
Retailing 3.58
Pantaloon Retail (India) Ltd. 3.58
Hotels 3.50
Country Club India Ltd. 3.50
Textile Products 2.55
Raymond Ltd. 2.55
Telecom-Services 2.31
Reliance Communications Ltd. 2.31
Cement 1.93
Orient Paper & Industries Ltd. 1.93
Cash & Current Assets 16.83
Total Net Asset 100.00
Issuer % to NetAssets
Issuer % to NetAssets
Issuer % to NetAssets
SIP is a powerful tool that can help you create wealth over time. If you had invested in Birla India GenNext Fund...
Systematic Investment Plan (SIP)
Asset Allocation
Date of First Installment : September 1, 2005
The data assumes the investment of Rs.1,000/- on 1st day of every month or the subsequent working day. Load and Taxes are not considered for computation of returns. Past performance may or may not be sustained in future.
*CAGR Returns are computed after accounting for the cash flow by using the XIRR method (investment internal rate of return)
An Open-ended growth scheme with the objective to target growth of capital by investing in equity/equity related instruments of companies that are expected to benefit from the rising consumption patterns in India, which in turn is getting fuelled by high disposable incomes of the young generation (Generation Next). The scheme
will invest in companies that have the following characteristics: 1. Companies that seek growth in revenues arising out of demand from the younger generation (GenNext) for their products or services. 2. They should be engaged in manufacturing of products or rendering of services that go directly to the consumer. 3. The products and services should have distinct brand identity, thereby enabling choice.
Investment ObjectiveInvestment Style Box
Investment Period
Total Investment
(Rs.)
Value (Rs.) of SIP in Returns (%)*
Birla India GenNext
Fund
Birla India GenNext
Fund
S&P CNX NIFTY
S&P CNX NIFTY
Since Inception 33000 43319 40001 20.35 14.16
Last 1 year 12000 11743 11211 -3.97 -12.03Date of inception / takeover : August 05, 2005
Fund Manager : Mr. A. Balasubramaniam & Mr. Sanjay Chawla
NAV : Rs.
Growth : 17.96
Dividend : 14.88
Benchmark : S&P CNX NIFTY Average AUM : Rs. 118.08 Crores
Value Blend Growth Size
Large
Mid
Small
Investment Style
Load Structure (Incl. for SIP):Entry Load* :< Rs. 5 crores - 2.25%
³ Rs. 5 crores - NilExit Load**:< Rs. 5 crores - 1% if redeemed
/ switched out within 12 months ³ Rs. 5 crores - Nil
Birla India GenNext Fund - Growth S&P CNX Nifty
% R
etu
rns
J u n e 2 0 0 8
10
*For direct application: Entry Load is Nil. **Exit Load is NIL for units issued in Bonus & Dividend Reinvestment.
4.65
23.09
14.56
29.28
0
5
10
15
20
25
30
35
1 Year Since Inception
1.93%
2.31%
2.55%
3.50%
3.58%
3.68%
4.47%
4.56%
5.03%
5.70%
7.05%
13.28%
16.83%
25.54%
Other Equity
Telecom-Services
Textile Products
Hotels
Retailing
Consumer Durables
Software
Auto
Finance
Media & Entertainment
Pharmaceuticals
Banks
Cash & Current Assets
Consumer Non Durables

As on May 31, 2008
Birla Advantage Fund
Investment Performance
Past performance may or may not be sustained in future. Returns are in % and absolute returns for period less than 1 year & CAGR for period 1 year or more.
Portfolio
Banks 10.11
HDFC Bank Ltd. 2.26
State Bank of India 2.08
Axis Bank Ltd. 1.83
Kotak Mahindra Bank Ltd. 1.67
Bank of India 1.36
ICICI Bank Ltd. 0.91
Software 8.79
Satyam Computer Services Ltd. 3.62
Infosys Technologies Ltd. 3.33
Wipro Ltd. 1.22
Subex Ltd. 0.62
Consumer Non Durables 8.34
United Spirits Ltd. 3.48
Balrampur Chini Mills Ltd. 2.32
ITC Ltd. 1.96
Eveready Industries India Ltd. 0.58
Telecom-Services 8.19
Reliance Communications Ltd. 3.99
Bharti Airtel Ltd. 3.45
Idea Cellular Ltd. 0.75
Ferrous Metals 7.93
Jindal Steel & Power Ltd. 3.87
Welspun Gujarat Stahl Rohren Ltd. 3.12
JSW Steel Ltd. 0.95
Petroleum Products 7.65
Reliance Industries Ltd. 5.54
Indian Oil Corporation Ltd. 2.11
Industrial Capital Goods 7.38
Bharat Heavy Electricals Ltd. 2.63
Bharat Electronics Ltd. 2.28
Bharati Shipyard Ltd. 1.49
Thermax Ltd. 0.98
Finance 6.23
Housing Development Finance Corp. Ltd. 3.56
Reliance Capital Ltd. 1.66
ICRA Ltd. 1.01
Construction 5.85
Housing Development & Infrastructure Ltd 1.88
Jaiprakash Associates Ltd. 1.57
Larsen & Toubro Ltd. 1.44
Hindustan Construction Co. Ltd. 0.88
Dharti Dredging & Construction Ltd. ** 0.07
Pharmaceuticals 3.95
Glenmark Pharmaceuticals Ltd. 2.15
Cipla Ltd. 1.80
Diversified 3.90
Aditya Birla Nuvo Ltd. 2.64
United Breweries Holdings Ltd. 1.26
Cement 1.62
Century Textile & Industries Ltd. 1.62
Gas 1.52
GAIL (India) Ltd. 1.52
Media & Entertainment 1.24
Television Eighteen India Ltd. 1.24
Non - Ferrous Metals 1.03
Sterlite Industries (India) Ltd. 1.03
Auto 0.98
Tata Motors Ltd. 0.98
Hotels 0.19
Indian Hotels Co. Ltd.** 0.19
Cash & Current Assets 15.10
Total Net Asset 100.00
**Represents thinly traded/ non traded securities. Total outstanding exposure in derivatives as on May 31, 2008 is Rs 20.92 Crores (Notional value). Total Percentage of thinly/non traded securities is 0.26%.
Issuer % to NetAssets
Issuer % to NetAssets
Issuer % to NetAssets
SIP is a powerful tool that can help you create wealth over time. If you had invested in Birla Advantage Fund...
Systematic Investment Plan (SIP)
Asset Allocation
Date of First Installment : March 01, 1995
The data assumes the investment of Rs.1,000/- on 1st day of every month or the subsequent working day. Load and Taxes are not considered for computation of returns. Past performance may or may not be sustained in future.
*CAGR Returns are computed after accounting for the cash flow by using the XIRR method (investment internal rate of return)
An Open-ended growth scheme with the objective to achieve long-term growth of capital at relatively moderate levels of risk through a diversified research based investment approach.
Investment Objective
Date of inception / takeover : February 24, 1995
Fund Manager : Mr. A. Balasubramaniam
NAV : Rs.
Growth : 135.23
Dividend : 92.24
Benchmark : BSE Sensex Average AUM : Rs. 447.22 Crores
Investment Style Box
Investment Period
Total Investment
(Rs.)
Value (Rs.) of SIP in Returns (%)*
Birla Advantage
Fund
Birla Advantage
Fund
BSESensex
BSESensex
Since Inception 159000 583869 1071234 18.06 26.04
Last 5 years 60000 126280 114627 30.33 26.25
Last 3 years 36000 50046 44149 22.66 13.75
Last 1 year 12000 11702 10867 -4.60 -17.13
Value Blend Growth Size
Large
Mid
Small
Investment Style
Birla Advantage Fund - Growth BSE Sensex
% R
etu
rns
Load Structure (Incl. for SIP)Entry Load*:< Rs. 5 crores - 2.25%
³ Rs. 5 crores - NilExit Load**:< Rs. 5 crores - 1% if redeemed
/ switched out within 12 months ³ Rs. 5 crores - Nil
J u n e 2 0 0 8
11
*For direct application: Entry Load is Nil. **Exit Load is NIL for units issued in Bonus & Dividend Reinvestment.
3.83
26.85
37.63
23.41
13.87
35.02
38.80
12.46
0
5
10
15
20
25
30
35
40
45
1 Year 3 Years 5 Years Since Inception
3.90%
3.95%
5.85%
6.23%
6.58%
7.38%
7.65%
7.93%
8.19%
8.34%
8.79%
10.11%
15.10%
Diversified
Pharmaceuticals
Construction
Finance
Other Equity
Industrial Capital Goods
Petroleum Products
Ferrous Metals
Telecom-Services
Consumer Non Durables
Software
Banks
Cash & Current Assets

Birla Equity PlanAn Open-ended Equity Linked Savings Scheme (ELSS) with a lock-in of 3 years
As on May 31, 2008
Investment Performance
Past performance may or may not be sustained in future. Returns are in % and absolute returns for period less than 1 year & CAGR for period 1 year or more.
Portfolio
Banks 10.80Federal Bank Ltd. 3.16State Bank of India 2.28Indian Bank 1.96Indian Overseas Bank 1.15Punjab National Bank 1.13Centurion Bank of Punjab Ltd. 1.11
Ferrous Metals 6.75Welspun Gujarat Stahl Rohren Ltd. 3.51Tata Steel Ltd. 3.25
Consumer Non Durables 6.48ITC Ltd. 3.45Tata Tea Ltd. 1.86Ruchi Soya Industries Ltd. 1.17
Petroleum Products 6.03Reliance Industries Ltd. 3.46Bharat Petroleum Corporation Ltd. 2.57
Industrial Products 5.53TRF Ltd. 3.25Kirloskar Oil Engines Ltd. 2.28
Industrial Capital Goods 5.25Bharat Bijlee Ltd. 2.06Bharat Heavy Electricals Ltd. 1.84Siemens Ltd. 1.35
Power 5.15Tata Power Company Ltd. 3.42NTPC Ltd. 1.74
Chemicals 4.66Solar Explosives Ltd. 2.47Godrej Industries Ltd. 2.19
Auto 4.43Maruti Suzuki India Ltd. 2.75Bajaj Auto Ltd. 1.68
Auto Ancillaries 4.31Goodyear India Ltd. 2.19Automobile Corporation of Goa Ltd. 2.13
Pharmaceuticals 4.10Sun Pharmaceutical Industries Ltd. 4.10
Telecom-Services 3.53Reliance Communications Ltd. 3.53
Diversified Industries 3.09Aditya Birla Nuvo Ltd. 3.09
Hotels 2.99Taj GVK Hotels & Resorts Ltd. 2.99
Finance 2.75Infrastructure Development Finance Co. Ltd. 2.75
Media & Entertainment 2.69Zee Entertainment Enterprises Ltd 2.69
Construction 2.36JMC Projects India Ltd. 2.36
Retailing 2.28Pantaloon Retail (India) Ltd. 2.28
Oil 2.06Cairn India Ltd. 2.06
Gas 1.63Gujarat Gas Co. Ltd. 1.63
Transportation 1.13Mundra Port and Special Economic Zone Ltd. 1.13
Cement 0.14Madras Cements Ltd. 0.14
Cash & Current Assets 11.83
Total Net Asset 100.00
Issuer % to NetAssets
Issuer % to NetAssets
Issuer % to NetAssets
SIP is a powerful tool that can help you create wealth over time. If you had invested in Birla Equity Plan…
Systematic Investment Plan (SIP)
Asset Allocation
Date of First Installment : March 01,1999
The data assumes the investment of Rs.1,000/- on 1st day of every month or the subsequent working day. Load and Taxes are not considered for computation of returns. Past performance may or may not be sustained in future.
*CAGR Returns are computed after accounting for the cash flow by using the XIRR method (investment internal rate of return)
An Open-ended Equity Linked Savings Scheme (ELSS) with the objective to achieve long-term growth of capital along with income tax relief for investment.
Investment Objective
Date of inception / takeover : February 16, 1999
Fund Manager : Mr. Sanjay Chawla
NAV : Rs.
Growth* : 12.13
Dividend : 57.72
*Introduced with effect from 01/10/06
Load Structure :Entry Load* (Except SIP) : < Rs. 5 crores - 2.25%
³ Rs. 5 crores - NilEntry Load* (For SIP) : NILExit Load** (Incl. for SIP): NIL
Benchmark : BSE Sensex Average AUM : Rs. 144.36 Crores
Investment Style Box
Investment Period
Total Investment
(Rs.)
Value (Rs.) of SIP in Returns (%)*
Birla Equity Plan
Birla Equity Plan
BSESensex
BSESensex
Since Inception 111000 352691 512405 23.86 31.46
Last 5 years 60000 126279 123033 30.33 29.23
Last 3 years 36000 50046 44298 22.66 13.98
Last 1 year 12000 11702 10669 -4.60 -20.02
Value Blend Growth Size
Large
Mid
Small
Investment Style
Birla Equity Plan - Dividend BSE Sensex
for ranking methodology please refer page 43(Past performance is no guarantee of future results.)
% R
etu
rns
J u n e 2 0 0 8
12
*For direct application: Entry Load is Nil. **Exit Load is NIL for units issued in Bonus & Dividend Reinvestment.
0.83
27.96
43.20
29.47
13.87
35.02
38.80
18.68
0
5
10
15
20
25
30
35
40
45
50
1 Year 3 Years 5 Years Since Inception
2.06%
2.28%
2.36%
2.69%
2.75%
2.91%
2.99%
3.09%
3.53%
4.10%
4.31%
4.43%
4.66%
5.15%
5.25%
5.53%
6.03%
6.48%
6.75%
10.80%
11.83%
Oil
Retailing
Construction
Media & Entertainment
Finance
Other Equity
Hotels
Diversified
Telecom-Services
Pharmaceuticals
Auto Ancillaries
Auto
Chemicals
Power
Industrial Capital Goods
Industrial Products
Petroleum Products
Consumer Non Durables
Ferrous Metals
Banks
Cash & Current Assets

Birla Index Fund
As on May 31, 2008
Portfolio
Petroleum Products 11.19Reliance Industries Ltd. 8.87Reliance Petroleum Ltd. 2.00Bharat Petroleum Corporation Ltd. 0.33
Software 8.74Infosys Technologies Ltd. 2.85Tata Consultancy Services Ltd. 2.58Wipro Ltd. 1.89Satyam Computer Services Ltd. 0.89HCL Technologies Ltd. 0.53
Telecom-Services 8.34Bharti AirTel Ltd. 4.22Reliance Communications Ltd. 3.02Idea Cellular Ltd. 0.73Tata Communications Ltd. 0.37
Banks 6.17State Bank of India 2.32ICICI Bank Ltd. 2.23HDFC Bank Ltd. 1.23Punjab National Bank 0.39
Power 6.15NTPC Ltd. 3.61Power Grid Corporation of India Ltd. 1.05Tata Power Company Ltd. 0.75Reliance Energy Ltd. 0.74
Oil 5.99Oil and Natural Gas Corporation Ltd. 4.70Cairn India Ltd. 1.29
Construction 5.63DLF Ltd. 2.45Larsen & Toubro Ltd. 2.21Unitech Ltd. 0.96
Industrial Capital Goods 4.16Bharat Heavy Electricals Ltd. 2.07Suzlon Energy Ltd. 1.06ABB Ltd. 0.55Seimens Ltd. 0.48
Consumer Durables 3.40ITC Ltd. 2.08Hindustan Unilever Ltd. 1.32
Ferrous Metals 3.37Steel Authority of India Ltd. 1.70Tata Steel Ltd. 1.68
Non-Ferrous Metals 3.17Sterlite Industries (India) Ltd. 1.69National Aluminium Company Ltd. 0.88Hindalco Industries Ltd. 0.60
Pharmaceuticals 1.95Sun Pharmaceutical Industries Ltd. 0.71Ranbaxy Laboratories Ltd. 0.50Cipla Ltd. 0.42Dr. Reddys Laboratories Ltd. 0.31
Auto 1.87Tata Motors Ltd. 0.56Maruti Udyog Ltd. 0.56Hero Honda Motors Ltd. 0.38Mahindra & Mahindra Ltd. 0.37
Finance 1.84Housing Development Finance Corp. Ltd. 1.84
Cement 1.20Grasim Industries Ltd. 0.52Ambuja Cements Ltd. 0.37The Associated Cement Companies Ltd. 0.32
Gas 0.86GAIL India Ltd. 0.86
Media & Entertainment 0.25Zee Entertainment Enterprises Ltd. 0.25
Cash & Current Assets 29.25
Total Net Asset 100.00
Issuer % to NetAssets
Issuer % to NetAssets
Issuer % to NetAssets
Total outstanding exposure in derivatives as on May 31, 2008 is Rs 10.14 Crores (Notional value).
Asset AllocationInvestment Performance
Past performance may or may not be sustained in future. Returns are in % and absolute returns for period less than 1 year & CAGR for period 1 year or more.
Birla Index Fund - Growth S&P CNX Nifty
% R
etu
rns
An Open-ended index-linked growth scheme with the objective to generate returns commensurate with the performance of Nifty subject to tracking errors.
Investment Objective
Date of inception / takeover : September 18, 2002
Fund Manager : Mr. Ajay Garg
NAV : Rs.
Growth : 48.97
Dividend : 18.95
Load Structure (Incl. for SIP) Entry Load* : NILExit Load** : NIL
Benchmark : S & P CNX Nifty Average AUM : Rs. 36.10 Crores
Systematic Investment Plan (SIP)
SIP is a powerful tool that can help you create wealth over time. If you had invested in Birla Index Fund…
Date of First Installment : October 1, 2002
The data assumes the investment of Rs.1,000/- on 1st day of every month or the subsequent working day. Load and Taxes are not considered for computation of returns. Past performance may or may not be sustained in future.
*CAGR Returns are computed after accounting for the cash flow by using the XIRR method (investment internal rate of return)
Investment Period
Total Investment
(Rs.)
Value (Rs.) of SIP in Returns (%)*
Birla Index Fund
Birla Index Fund
S&P CNX NIFTY
S&P CNX NIFTY
Since Inception 68000 160177 156569 30.48 29.65
Last 5 years 60000 121621 118815 28.74 27.76
Last 3 years 36000 49955 49117 22.53 21.31
Last 1 year 12000 11743 11644 -3.97 -5.50
J u n e 2 0 0 8
Investment Style Box
Value Blend Growth Size
Large
Mid
Small
Investment Style
13
*For direct application: Entry Load is Nil. **Exit Load is NIL for units issued in Bonus & Dividend Reinvestment.
15.78
31.88
36.45
32.13
14.56
32.92
37.02
32.39
0
5
10
15
20
25
30
35
40
1 Year 3 Years 5 Years Since Inception
3.17%
3.17%
3.37%
3.40%
4.16%
5.10%
5.99%
6.17%
7.96%
8.34%
8.74%
11.19%
29.25%
Non-Ferrous Metals
Construction
Ferrous Metals
Consumer Durables
Industrial Capital Goods
Power
Oil
Banks
Other Equity
Telecom-Services
Software
Petroleum Products
Cash & Current Assets
Birla Sun Life New Millennium Fund
As on May 31, 2008
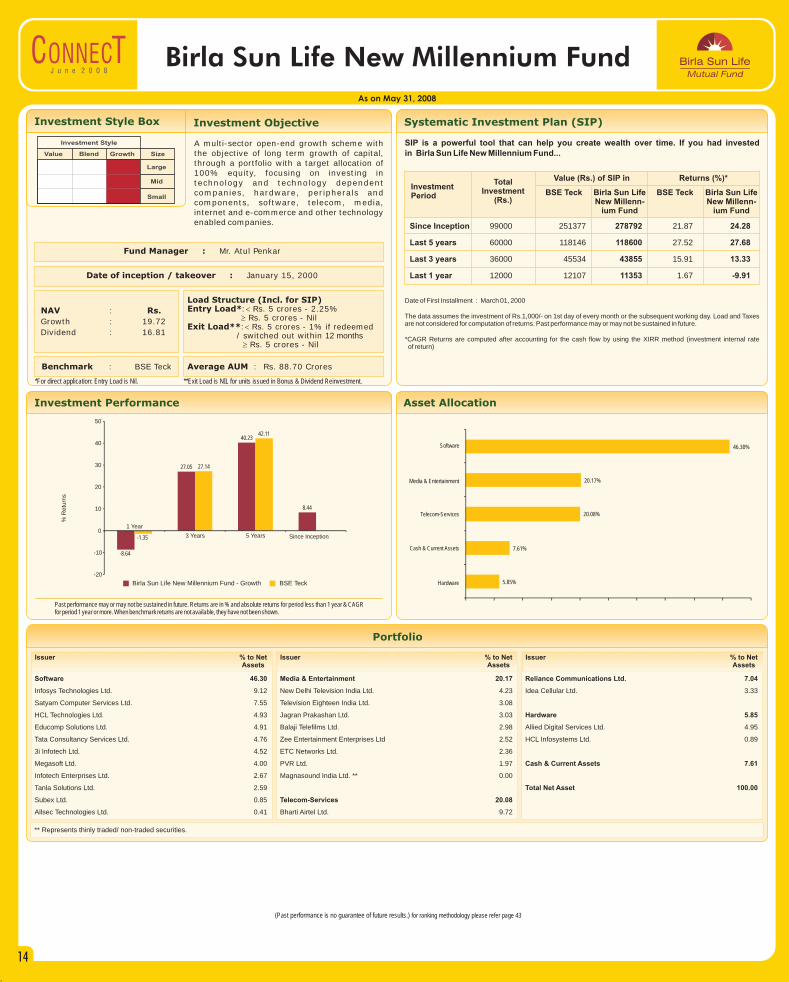
A multi-sector open-end growth scheme with the objective of long term growth of capital, through a portfolio with a target allocation of 100% equity, focusing on investing in technology and technology dependent companies, hardware, peripherals and components, software, telecom, media, internet and e-commerce and other technology enabled companies.
Investment Objective
Date of inception / takeover : January 15, 2000
Fund Manager : Mr. Atul Penkar
NAV : Rs.
Growth : 19.72
Dividend : 16.81
Load Structure (Incl. for SIP) Entry Load*:< Rs. 5 crores - 2.25%
³ Rs. 5 crores - NilExit Load**:< Rs. 5 crores - 1% if redeemed
/ switched out within 12 months ³ Rs. 5 crores - Nil
Benchmark : BSE Teck Average AUM : Rs. 88.70 Crores
Investment Style Box
Value Blend Growth Size
Large
Mid
Small
Investment Style SIP is a powerful tool that can help you create wealth over time. If you had invested in Birla Sun Life New Millennium Fund...
Systematic Investment Plan (SIP)
Date of First Installment : March 01, 2000
The data assumes the investment of Rs.1,000/- on 1st day of every month or the subsequent working day. Load and Taxes are not considered for computation of returns. Past performance may or may not be sustained in future.
*CAGR Returns are computed after accounting for the cash flow by using the XIRR method (investment internal rate of return)
Investment Period
Total Investment
(Rs.)
Value (Rs.) of SIP in Returns (%)*
Birla Sun Life New Millenn-
ium Fund
Birla Sun Life New Millenn-
ium Fund
BSE Teck BSE Teck
Since Inception 99000 251377 278792 21.87 24.28
Last 5 years 60000 118146 118600 27.52 27.68
Last 3 years 36000 45534 43855 15.91 13.33
Last 1 year 12000 12107 11353 1.67 -9.91
(Past performance is no guarantee of future results.) for ranking methodology please refer page 43
Portfolio
Software 46.30
Infosys Technologies Ltd. 9.12
Satyam Computer Services Ltd. 7.55
HCL Technologies Ltd. 4.93
Educomp Solutions Ltd. 4.91
Tata Consultancy Services Ltd. 4.76
3i Infotech Ltd. 4.52
Megasoft Ltd. 4.00
Infotech Enterprises Ltd. 2.67
Tanla Solutions Ltd. 2.59
Subex Ltd. 0.85
Allsec Technologies Ltd. 0.41
Media & Entertainment 20.17
New Delhi Television India Ltd. 4.23
Television Eighteen India Ltd. 3.08
Jagran Prakashan Ltd. 3.03
Balaji Telefilms Ltd. 2.98
Zee Entertainment Enterprises Ltd 2.52
ETC Networks Ltd. 2.36
PVR Ltd. 1.97
Magnasound India Ltd. ** 0.00
Telecom-Services 20.08
Bharti Airtel Ltd. 9.72
Reliance Communications Ltd. 7.04
Idea Cellular Ltd. 3.33
Hardware 5.85
Allied Digital Services Ltd. 4.95
HCL Infosystems Ltd. 0.89
Cash & Current Assets 7.61
Total Net Asset 100.00
Issuer % to NetAssets
Issuer % to NetAssets
Issuer % to NetAssets
Asset AllocationInvestment Performance
Past performance may or may not be sustained in future. Returns are in % and absolute returns for period less than 1 year & CAGR for period 1 year or more. When benchmark returns are not available, they have not been shown.
Birla Sun Life New Millennium Fund - Growth BSE Teck
% R
etu
rns
J u n e 2 0 0 8
** Represents thinly traded/ non-traded securities.
14
*For direct application: Entry Load is Nil. **Exit Load is NIL for units issued in Bonus & Dividend Reinvestment.
-8.64
27.05
40.23
8.44
-1.35
27.14
42.11
-20
-10
0
10
20
30
40
50
1 Year
3 Years 5 Years Since Inception
5.85%
7.61%
20.08%
20.17%
46.30%
Hardware
Cash & Current Assets
Telecom-Services
Media & Entertainment
Software

Birla Top 100 Fund
As on May 31, 2008
Investment Performance
Past performance may or may not be sustained in future. Returns are in % and absolute returns for period less than 1 year & CAGR for period 1 year or more.
Portfolio
Banks 9.73
ICICI Bank Ltd. 2.55
Axis Bank Ltd. 1.89
Oriental Bank of Commerce 1.53
Bank of India 1.46
Bank of Baroda 1.42
State Bank of India 0.88
Petroleum Products 8.72
Reliance Industries Ltd. 8.72
Software 8.55
Infosys Technologies Ltd. 3.69
Tata Consultancy Services Ltd. 2.42
HCL Technologies Ltd. 2.03
Subex Ltd. 0.41
Telecom-Services 8.18
Bharti Airtel Ltd. 4.60
Reliance Communications Ltd. 3.58
Consumer Non Durables 7.52
ITC Ltd. 4.10
United Spirits Ltd. 1.31
Balrampur Chini Mills Ltd. 1.07
Hindustan Unilever Ltd. 1.04
Industrial Capital Goods 5.18
Bharat Heavy Electricals Ltd. 3.63
Bharat Electronics Ltd. 1.55
Ferrous Metals 5.16
Tata Steel Ltd. 2.70
Welspun Gujarat Stahl Rohren Ltd. 1.36
Sesa Goa Ltd. 1.10
Construction 5.11
DLF Ltd. 1.76
IVRCL Infrastructures & Projects Ltd. 1.20
Larsen & Toubro Ltd. 1.10
Nagarjuna Construction Co. Ltd. 1.05
Oil 4.21
Oil & Natural Gas Corporation Ltd. 4.21
Power 4.10
CESC Ltd. 2.26
NTPC Ltd. 1.84
Auto 3.50
Maruti Suzuki India Ltd. 1.59
Bajaj Auto Ltd. 1.12
Hero Honda Motors Ltd. 0.78
Finance 3.11
Housing Development Finance Corp. Ltd. 3.11
Industrial Products 2.30
Sintex Industries Ltd. 2.30
Transportation 2.27
Great Eastern Shipping Company Ltd. 2.27
Auto Ancillaries 2.21
Bosch Limited. 2.21
Gas 2.15
GAIL (India) Ltd. 2.15
Pharmaceuticals 2.08
Sun Pharmaceutical Industries Ltd. 2.08
Media & Entertainment 1.42
Zee Entertainment Enterprises Ltd 1.42
Non - Ferrous Metals 1.09
Sterlite Industries (India) Ltd. 1.09
Cash & Current Assets 13.40
Total Net Asset 100.00
Issuer % to NetAssets
Issuer % to NetAssets
Issuer % to NetAssets
SIP is a powerful tool that can help you create wealth over time. If you had invested in Birla Top 100 Fund...
Systematic Investment Plan (SIP)
Asset Allocation
Date of First Installment : November 1, 2005
The data assumes the investment of Rs.1,000/- on 1st day of every month or the subsequent working day. Load and Taxes are not considered for computation of returns. Past performance may or may not be sustained in future.
*CAGR Returns are computed after accounting for the cash flow by using the XIRR method (investment internal rate of return)
An open-ended growth scheme with the objective to provide medium to longterm cap i t a l app rec i a t i on , by i nves t i ng predominantly in a diversified portfolio of equity and equity related securities of top 100 companies as measured by market capitalization.
Investment Objective
Date of inception / takeover : October 24, 2005
Fund Manager : Mr. Ajay Argal
NAV : Rs.
Growth : 17.52
Dividend : 15.89
Benchmark : S & P CNX Nifty Average AUM : Rs. 379.80 Crores
Investment Style Box
Investment Period
Total Investment
(Rs.)
Value (Rs.) of SIP in Returns (%)*
Birla Top 100
Fund
Birla Top 100
Fund
S&P CNX NIFTY
S&P CNX NIFTY
Since Inception 31000 39443 35793 19.13 11.18
Last 1 year 12000 11743 11152 -3.97 -12.92
Value Blend Growth Size
Large
Mid
Small
Investment Style
Load Structure (Incl. for SIP):Entry Load* :< Rs. 5 crores - 2.25%
³ Rs. 5 crores - NilExit Load**:< Rs. 5 crores - 1% if redeemed
/ switched out within 12 months ³ Rs. 5 crores - Nil
Birla Top 100 Fund - Growth S&P CNX Nifty
% R
etu
rns
J u n e 2 0 0 8
15
*For direct application: Entry Load is Nil. **Exit Load is NIL for units issued in Bonus & Dividend Reinvestment.
6.04
24.08
14.56
31.39
0
5
10
15
20
25
30
35
1 Year Since Inception
2.08%
2.15%
2.21%
2.27%
2.30%
2.51%
3.11%
3.50%
4.10%
4.21%
5.11%
5.16%
5.18%
7.52%
8.18%
8.55%
8.72%
9.73%
13.40%
Pharmaceuticals
Gas
Auto Ancillaries
Transportation
Industrial Products
Other Equity
Finance
Auto
Power
Oil
Construction
Ferrous Metals
Industrial Capital Goods
Consumer Non Durables
Telecom-Services
Software
Petroleum Products
Banks
Cash & Current Assets

Birla Sun Life Buy India Fund
As on May 31, 2008
Asset AllocationInvestment Performance
Past performance may or may not be sustained in future. Returns are in % and absolute returns for period less than 1 year & CAGR for period 1 year or more.
Birla Sun Life Buy India Fund - Growth BSE 200
% R
etu
rns
Portfolio
Consumer Non Durables 25.28Tata Tea Ltd. 5.66United Spirits Ltd. 4.47Shaw Wallace Company Ltd. 3.83ITC Ltd. 3.47Radico Khaitan Ltd 3.07E.I.D. Parry (India) Ltd. 2.98Marico Ltd. 1.81
Pharmaceuticals 13.78Sun Pharmaceutical Industries Ltd. 6.57Glaxosmithkline Pharmaceuticals Ltd. 3.77Aventis Pharma Ltd. 2.63Pfizer Ltd. 0.82
Media & Entertainment 9.67UTV Software Communications Ltd. 4.42Television Eighteen India Ltd. 2.94PVR Ltd. 2.31
Magnasound India Ltd. ** 0.00
Hotels 8.22Taj GVK Hotels & Resorts Ltd. 4.65Asian Hotels Ltd. 3.57
Finance 7.74Housing Development Finance Corp. Ltd. 3.61Reliance Capital Ltd. 3.03India Infoline Ltd. 1.10
Pesticides 6.11Rallis India Ltd. 6.11
Auto 5.73Maruti Suzuki India Ltd. 5.73
Banks 5.53ICICI Bank Ltd. 3.54
Kotak Mahindra Bank Ltd. 1.99
Diversified 5.44United Breweries Holdings Ltd. 5.44
Telecom-Services 4.04Bharti Airtel Ltd. 2.96Reliance Communications Ltd. 1.08
Gas 3.24Indraprastha Gas Ltd. 3.24
Retailing 0.43Trent Ltd. - Warrants 0.43
Cash & Current Assets 4.78
Total Net Asset 100.00
Issuer % to NetAssets
Issuer % to NetAssets
Issuer % to NetAssets
**Represents thinly traded/non traded securities.
A multi-sector open-end growth scheme with the objective of long term growth of capital, through a portfolio with a target allocation of 100% equity, focusing on investing in businesses that are driven by India's large population and inherent consumption patterns. The focus of the scheme will be in the consumer and healthcare sectors.
Investment Objective
Date of inception / takeover : January 15, 2000
Fund Manager : Mr. Ajay Garg
NAV : Rs.
Growth : 29.74
Dividend : 20.89
Load Structure (Incl. for SIP) Entry Load*:< Rs. 5 crores - 2.25%
³ Rs. 5 crores - NilExit Load**:< Rs. 5 crores - 1% if redeemed
/ switched out within 12 months ³ Rs. 5 crores - Nil
Benchmark : BSE 200 Average AUM : Rs. 54.10 Crores
Investment Style Box
Value Blend Growth Size
Large
Mid
Small
Investment Style SIP is a powerful tool that can help you create wealth over time. If you had invested in Birla Sun Life Buy India Fund...
Systematic Investment Plan (SIP)
Date of First Installment : March 01, 2000
The data assumes the investment of Rs.1,000/- on 1st day of every month or the subsequent working day. Load and Taxes are not considered for computation of returns. Past performance may or may not be sustained in future.
*CAGR Returns are computed after accounting for the cash flow by using the XIRR method (investment internal rate of return)
Investment Period
Total Investment
(Rs.)
Value (Rs.) of SIP in Returns (%)*
Birla Sun Life Buy India
Fund
Birla Sun Life Buy India
Fund
BSE 200 BSE 200
Since Inception 99000 323822 346448 27.77 29.35
Last 5 years 60000 123022 126372 29.22 30.36
Last 3 years 36000 50008 43276 22.61 12.36
Last 1 year 12000 11709 11640 -4.50 -5.55
J u n e 2 0 0 8
16
*For direct application: Entry Load is Nil. **Exit Load is NIL for units issued in Bonus & Dividend Reinvestment.
1.50
23.06
44.38
13.8916.40
32.19
37.97
15.38
0
5
10
15
20
25
30
35
40
45
50
1 Year 3 Years 5 Years Since Inception
0.43%
3.24%
4.04%
4.78%
5.44%
5.53%
5.73%
6.11%
7.74%
8.22%
9.67%
13.78%
25.28%
Other Equity
Gas
Telecom-Services
Cash & Current Assets
Diversified
Banks
Auto
Pesticides
Finance
Hotels
Media & Entertainment
Pharmaceuticals
Consumer Non Durables

Birla MNC Fund
As on May 31, 2008
Investment Performance
Past performance may or may not be sustained in future. Returns are in % and absolute returns for period less than 1 year & CAGR for period 1 year or more.
Portfolio
Consumer Non Durables 15.34
Glaxosmithkline Consumer Healthcare Ltd. 4.81
ITC Ltd. 4.27
Colgate-Palmolive (India) Ltd. 3.81
Kansai Nerolac Paints Ltd. 2.44
Pharmaceuticals 13.75
Pfizer Ltd. 5.01
Glaxosmithkline Pharmaceuticals Ltd. 3.35
Fulford (India) Ltd. 2.99
Wyeth Ltd. 2.40
Industrial Capital Goods 12.14
Areva T&D India Ltd. 3.47
ABB Ltd. 3.35
Honeywell Automation India Ltd. 3.08
Siemens Ltd. 2.23
Finae 10.37
CRISIL Ltd. 6.13
ICRA Ltd. 4.24
Banks 9.63
ING Vysya Bank Ltd. 7.62
Yes Bank Ltd. 2.01
Ferrous Metals 8.42
Sesa Goa Ltd. 8.42
Gas 5.92
Gujarat Gas Co. Ltd. 3.84
BOC India Ltd. 2.07
Industrial Products 5.72
Cummins India Ltd. 4.54
Fag Bearings India Ltd. 1.17
Telecom-Services 5.16
Bharti Airtel Ltd. 5.16
Auto 4.50
Maruti Suzuki India Ltd. 4.50
Auto Ancillaries 3.70
Sundaram-Clayton Ltd. ** 1.50
WABCO-TVS (India) Ltd. ** 1.25
Federal Mogul Goetze (India) Ltd. 0.94
Construction 2.26
ITD Cementation India Ltd. 2.26
Cash & Current Assets 3.10
Total Net Asset 100.00
SIP is a powerful tool that can help you create wealth over time. If you had invested in Birla MNC Fund…
Systematic Investment Plan (SIP)
Asset Allocation
Date of First Installment : January 01, 2000
The data assumes the investment of Rs.1,000/- on 1st day of every month or the subsequent working day. Load and Taxes are not considered for computation of returns. Past performance may or may not be sustained in future.
*CAGR Returns are computed after accounting for the cash flow by using the XIRR method (investment internal rate of return)
An Open-ended growth scheme with the objective to achieve long-term growth of capital at relatively moderate levels of risk by making investments in securities of multi-national companies through a research based investment approach.
Investment Objective
Date of inception / takeover : December 27, 1999
Fund Manager : Mr. A. Balasubramaniam
NAV : Rs.
Growth : 121.94
Dividend : 61.12
Benchmark : S & P CNX MNC Average AUM : Rs. 154.78 Crores
Investment Style Box
Investment Period
Total Investment
(Rs.)
Value (Rs.) of SIP in Returns (%)*
Birla MNCFund
Birla MNCFund
S&P CNX MNC
S&P CNX MNC
Since Inception 101000 209177 273484 16.76 22.85
Last 5 years 60000 98854 98975 20.10 20.15
Last 3 years 36000 42019 39993 10.33 6.97
Last 1 year 12000 11227 11109 -11.80 -13.55
Value Blend Growth Size
Large
Mid
Small
Investment Style
Issuer % to NetAssets
Issuer % to NetAssets
Issuer % to NetAssets
Birla MNC Fund - Growth S&P CNX MNC
% R
etu
rns
Load Structure (Incl. for SIP)Entry Load* : < Rs. 5 crores - 2.25%
³ Rs. 5 crores - NilExit Load** : < Rs. 5 crores - 1% if redeemed
/ switched out within 12 months ³ Rs. 5 crores - Nil
J u n e 2 0 0 8
17
*For direct application: Entry Load is Nil. **Exit Load is NIL for units issued in Bonus & Dividend Reinvestment.
**Represents thinly traded / non traded securities . Total Percentage of thinly/non traded securities is 2.75%.
-4.9
18.83
31.61
14.85
-0.24
24.1125.44
8.83
-10
-5
0
5
10
15
20
25
30
35
1 Year
3 Years 5 Years Since Inception
2.26%
3.10%
3.70%
4.50%
5.16%
5.72%
5.92%
8.42%
9.63%
10.37%
12.14%
13.75%
15.34%
Construction
Cash & Current Assets
Auto Ancillaries
Auto
Telecom-Services
Industrial Products
Gas
Ferrous Metals
Banks
Finance
Industrial Capital Goods
Pharmaceuticals
Consumer Non Durables

Birla India Opportunities Fund
As on May 31, 2008
Investment Performance
Past performance may or may not be sustained in future. Returns are in % and absolute returns for period less than 1 year & CAGR for period 1 year or more.
Portfolio
Software 24.01Satyam Computer Services Ltd. 7.453i Infotech Ltd. 3.71Tanla Solutions Ltd. 3.36HCL Technologies Ltd. 3.16Tata Consultancy Services Ltd. 2.44Infotech Enterprises Ltd. 2.25Infosys Technologies Ltd. 1.64
Industrial Capital Goods 13.46Honeywell Automation India Ltd. 3.76Crompton Greaves Ltd. 3.65ABB Ltd. 2.25Siemens Ltd. 2.01Areva T&D India Ltd. 1.79
Petroleum Products 6.17Reliance Industries Ltd. 6.17
Industrial Products 6.10Sintex Industries Ltd. 3.31Everest Kanto Cylinder Ltd. 1.63
Shree Ganesh Forgings Ltd. 1.16
Construction 5.30Punj Lloyd Ltd. 2.54Larsen & Toubro Ltd. 1.76Jaiprakash Associates Ltd. 1.01
Textile Products 5.13Raymond Ltd. 4.10Alok Industries Ltd. 1.03
Telecom-Services 4.62Reliance Communications Ltd. 3.24Bharti Airtel Ltd. 1.39
Diversified Industries 3.90United Breweries Holdings Ltd. 3.90
Consumer Non Durables 3.63Hanung Toys & Textiles Ltd. 3.63
Consumer Durables 3.30Voltas Ltd. 3.30
Finance 3.26CRISIL Ltd. 3.26
Non - Ferrous Metals 2.96Sterlite Industries (India) Ltd. 2.96
Ferrous Metals 2.92Jindal Steel & Power Ltd. 2.22Welspun Gujarat Stahl Rohren Ltd. 0.70
Oil 2.53Aban Offshore Ltd. 2.53
Cement 0.87Century Textile & Industries Ltd. 0.87
Cash & Current Assets 11.82
Total Net Asset 100.00
Issuer % to NetAssets
Issuer % to NetAssets
Issuer % to NetAssets
SIP is a powerful tool that can help you create wealth over time. If you had invested in Birla India Opportunities Fund...
Systematic Investment Plan (SIP)
Asset Allocation
Date of First Installment : January 01, 2000
The data assumes the investment of Rs.1,000/- on 1st day of every month or the subsequent working day. Load and Taxes are not considered for computation of returns. Past performance may or may not be sustained in future.
*CAGR Returns are computed after accounting for the cash flow by using the XIRR method (investment internal rate of return)
An Open-ended growth scheme with the objective to achieve superior long-term growth of capital by investing in shares of companies that do one or more of the following: Leverage India's intellectual capital for providing services, research and creative inputs; Seek to use current and impending changes in patent
laws / import tariffs / quotas to supply goods and services; Leverage India's lower labour costs for providing services and manufactured goods; Leverage India's large population of English speaking people for providing services.
Investment Objective
Date of inception / takeover : December 27, 1999
Fund Manager : Mr. Atul Penkar
NAV : Rs.
Growth : 48.50
Dividend : 20.83
Benchmark : S & P CNX 500 Average AUM : Rs. 64.09 Crores
Investment Style Box
Investment Period
Total Investment
(Rs.)
Value (Rs.) of SIP in Returns (%)*
Birla India Opportunities
Fund
Birla India Opportunities
Fund
S&P CNX 500
S&P CNX 500
Since Inception 101000 318252 262207 26.30 21.90
Last 5 years 60000 118751 96355 27.73 19.04
Last 3 years 36000 47883 39414 19.48 5.99
Last 1 year 12000 11453 10876 -8.39 -16.99
Value Blend Growth Size
Large
Mid
Small
Investment Style
Birla India Opportunities Fund - Growth S&P CNX 500
% R
etu
rns
Load Structure (Incl. for SIP) Entry Load*:< Rs. 5 crores - 2.25%
³ Rs. 5 crores - NilExit Load**:< Rs. 5 crores - 1% if redeemed
/ switched out within 12 months ³ Rs. 5 crores - Nil
J u n e 2 0 0 8
18
*For direct application: Entry Load is Nil. **Exit Load is NIL for units issued in Bonus & Dividend Reinvestment.
-6.91
18.84
32.63
8.87
12.02
29.57
37.40
15.77
-10
-5
0
5
10
15
20
25
30
35
40
1 Year 3 Years 5 Years Since Inception
0.87%
2.53%
2.92%
2.96%
3.26%
3.30%
3.63%
3.90%
4.62%
5.13%
5.30%
6.10%
6.17%
11.82%
13.46%
24.01%
Other Equity
Oil
Ferrous Metals
Non - Ferrous Metals
Finance
Consumer Durables
Consumer Non Durables
Diversified
Telecom-Services
Textile Products
Construction
Industrial Products
Petroleum Products
Cash & Current Assets
Industrial Capital Goods
Software

Birla Dividend Yield Plus
As on May 31, 2008
SIP is a powerful tool that can help you create wealth over time. If you had invested in Birla Dividend Yield Plus...
Systematic Investment Plan (SIP)
Date of First Installment : March 01, 2003
The data assumes the investment of Rs.1,000/- on 1st day of every month or the subsequent working day. Load and Taxes are not considered for computation of returns. Past performance may or may not be sustained in future.
*CAGR Returns are computed after accounting for the cash flow by using the XIRR method (investment internal rate of return)
An Open-ended growth scheme with the objective to provide capital growth and income by investing primarily in a well-diversified portfolio of dividend paying companies that have a relatively high dividend yield.
Investment Objective
Date of inception / takeover : February 26, 2003
Fund Manager : Mr. Ankit Sancheti
NAV : Rs.
Growth : 48.15
Dividend : 10.81
Benchmark : S & P CNX 500 Average AUM : Rs. 268.87 Crores
Investment Style Box
Investment Period
Total Investment
(Rs.)
Value (Rs.) of SIP in Returns (%)*
Birla Dividend Yield Plus
Birla Dividend Yield Plus
S&P CNX 500
S&P CNX 500
Since Inception 63000 135191 114024 29.49 22.74
Last 5 years 60000 118751 99632 27.73 20.42
Last 3 years 36000 47883 42059 19.48 10.39
Last 1 year 12000 11453 11366 -8.39 -9.71
Value Blend Growth Size
Large
Mid
Small
Investment Style
Portfolio
Consumer Non Durables 13.05Glaxosmithkline Consumer Healthcare Ltd. 2.60Kansai Nerolac Paints Ltd. 1.88Procter & Gamble Hygiene & Health Care Ltd. 1.71Shaw Wallace Company Ltd. 1.71Colgate-Palmolive (India) Ltd. 1.69Berger Paints India Ltd. 1.46Eveready Industries India Ltd. 1.18Hindustan Unilever Ltd. 0.82
Petroleum Products 12.33Hindustan Petroleum Corporation Ltd. 3.07Apar Industries Ltd. 2.82Indian Oil Corporation Ltd. 2.56Chennai Petroleum Corporation Ltd. 2.21Castrol (India) Ltd. 1.67
Banks 8.68Andhra Bank 3.05Union Bank of India 1.95Bank of Baroda 1.89Indian Overseas Bank 1.80
Pharmaceuticals 8.38Wyeth Ltd. 3.86Glaxosmithkline Pharmaceuticals Ltd. 3.26Pfizer Ltd. 1.25
Fertilisers 7.21Tata Chemicals Ltd. 3.12Rashtriya Chemicals & Fertilizers Ltd. 2.10Gujarat Narmada Valley Fertilisers Co. Ltd. 1.77DCM Shriram Consolidated Ltd. 0.22
Transportation 5.40Great Eastern Shipping Company Ltd. 2.71Gateway Distriparks Ltd. 1.55Varun Shipping Company Ltd. 1.14
Oil 4.56Oil & Natural Gas Corporation Ltd. 4.56
Power 4.38Neyveli Lignite Corporation Ltd. 2.59KEC International Ltd. 1.79
Paper 3.28Tamil Nadu Newsprint & Papers Ltd. 3.28
Chemicals 2.72Clariant Chemicals (India) Ltd. 2.72
Finance 2.36Indiabulls Securities Limited. 1.39Rural Electrification Corporation Ltd 0.39Bajaj Finserv Ltd 0.29Bajaj Holdings & Investment Ltd 0.29Octav Investments Limited.** 0.00
Gas 2.14GAIL (India) Ltd. 1.23Indraprastha Gas Ltd. 0.91
Hardware 2.13HCL Infosystems Ltd. 2.13
Ferrous Metals 1.89Tata Metaliks Ltd. 1.02Tata Steel Ltd. 0.87
Industrial Products 1.60Cosmo Films Ltd. 1.60
Auto Ancillaries 1.53Sundaram-Clayton Ltd. ** 0.58WABCO-TVS (India) Ltd. ** 0.48Goodyear India Ltd. 0.48
Media & Entertainment 1.16Balaji Telefilms Ltd. 1.16
Auto 0.98Hero Honda Motors Ltd. 0.72Bajaj Auto Ltd. 0.26
Diversified 0.72United Breweries Holdings Ltd. 0.72
Consumer Durables 0.63Salora International Ltd. 0.63
Software 0.59HCL Technologies Ltd. 0.59
Cash & Current Assets 14.28
Total Net Asset 100.00
Issuer % to NetAssets
Issuer % to NetAssets
Issuer % to NetAssets
Load Structure (Incl. for SIP) Entry Load*:< Rs. 5 crores - 2.25%
³ Rs. 5 crores - NilExit Load**:< Rs. 5 crores - 1% if redeemed
/ switched out within 12 months ³ Rs. 5 crores - Nil
Investment Performance
Past performance may or may not be sustained in future. Returns are in % and absolute returns for period less than 1 year & CAGR for period 1 year or more.
Asset Allocation
% R
etu
rns
Birla Dividend Yield Plus - Growth S&P CNX 500
J u n e 2 0 0 8
**Represents thinly traded/ non traded securities.
19
*For direct application: Entry Load is Nil. **Exit Load is NIL for units issued in Bonus & Dividend Reinvestment.
5.05
17.62
32.35
34.83
12.02
29.57
37.40 37.10
0
5
10
15
20
25
30
35
40
1 Year 3 Years 5 Years Since Inception
2.13%
2.14%
2.36%
2.72%
3.28%
4.38%
4.56%
5.40%
7.21%
8.38%
8.68%
9.09%
12.33%
13.05%
14.28%
Hardware
Gas
Finance
Chemicals
Paper
Power
Oil
Transportation
Fertilisers
Pharmaceuticals
Banks
Other Equity
Petroleum Products
Consumer Non Durables
Cash & Current Assets

As on May 31, 2008
SIP is a powerful tool that can help you create wealth over time. If you had invested in Birla Sun Life International Equity Fund - Plan A (BSLIEF - Plan A)...
Systematic Investment Plan (SIP)
Date of First Installment : December 01, 2007
The data assumes the investment of Rs. 1,000/- on 1st day of every month or the subsequent working day. Load and Taxes are not considered for computation of returns. Past performance may or may not be sustained in future.
*CAGR Returns are computed after accounting for the cash flow by using the XIRR method (investment internal rate of return)
An open-ended diversified equity scheme with an objective to generate long-term growth of capital, by investing predominantly in a diversified portfolio of equity and equity related securities in the international markets.
Investment Objective
Date of inception / takeover : October 31, 2007
Fund Manager : Mr. Mahesh Patil & Mr. Vineet Maloo
NAV : Rs.
Growth : 10.44
Dividend : 10.44
Benchmark : S&P Global 1200 Average AUM : Rs. 219.12 Crores
Investment Style Box
Value Blend Growth Size
Large
Mid
Small
Investment Style
Portfolio
Foreign Equity 82.18
Aetna Inc New 1.81
Airgas Inc 1.31
Akzo Nobel NV 2.46
Bayer AG 2.27
Bayerische Motoren 1.00
Bumiputra-Commerce 1.85
Cheung Kong Intl 2.35
China Construction 2.04
China Mobile (Hk) 1.65
China Oil Field 1.83
Chubb Corp 1.07
Coca Cola Co 2.17
Esprit Hldgs Ltd 1.97
Foxconn Intl Holding 1.34
Genting Bhd (Cds) 1.68
Groupe Danone 2.22
Ind & Comm Bank 2.30
L.G. Electronics 0.18
Manitowoc Co. Inc 1.03
Merck & Co Inc 1.67
Metso Corporation 1.25
Microsoft Corportion 1.61
Mtr Corp Ltd. 1.91
Nestle SA 2.50
Nobel Corp 2.60
Northrop Grumman Co 1.99
Oracle Corporation 1.35
Pride International 3.03
Procter & Gamble Co 2.23
Public Bank Bhd 2.06
Reckitt Benckiser Pl 2.32
Renewable Enrgy Corp 2.17
Schneider Elctric SA 2.11
Statoilhydro ASA 2.87
Taiwan Semiconductor-ADR 2.78
Telenor ASA 2.16
Teva Pharma Ind ADR 2.12
Unibanco Holding GDR 2.49
Venture Corporation 2.20
Vimpel Communication 1.97
Wharf Holdings Ltd. 2.11
Wimm Bill Dann - ADR 2.14
Cash & Current Assets 17.82
Total Net Asset 100.00
Issuer % to NetAssets
Issuer % to NetAssets
Issuer % to NetAssets
Load Structure (Incl. for SIP) Entry Load* : < Rs. 5 crores - 2.50%
³ Rs. 5 crores - NilExit Load** : < 5 Crores - 1% if redeemed /
switched out within 12 months ³ Rs. 5 crores - Nil
Investment Performance
Past performance may or may not be sustained in future. Returns are in % and absolute returns for period less than 1 year
Asset Allocation
% R
etu
rns
Birla Sun Life International Equity Fund - Plan A - Growth S&P Global 1200
J u n e 2 0 0 8
Birla Sun Life International Equity Fund - Plan A
Your Total Investment Rs. 6,000
Value of Your Investment Rs. 6,442
Value of Benchmark (S&P Global 1200) Rs. 6,388
Return on Investment (CAGR)* 27.99%
Benchmark (S&P Global 1200) Returns (CAGR)* 24.33%
20
*For direct application: Entry Load is Nil. **Exit Load is NIL for units issued in Bonus & Dividend Reinvestment.
17.82%
82.18%
Cash & Current Assets
Foreign Equity
5.53
10.98
8.43
4.414.89
12.24
10.63
-2.69-4
-2
0
2
4
6
8
10
12
14
1 Month 2 Months 3 Months Since Inception

As on May 31, 2008
SIP is a powerful tool that can help you create wealth over time. If you had invested in Birla Sun Life International Equity Fund - Plan B (BSLIEF - Plan B)...
Systematic Investment Plan (SIP)
Date of First Installment : December 01, 2007
The data assumes the investment of Rs. 1,000/- on 1st day of every month or the subsequent working day. Load and Taxes are not considered for computation of returns. Past performance may or may not be sustained in future.
*CAGR Returns are computed after accounting for the cash flow by using the XIRR method (investment internal rate of return)
An open-ended diversified equity scheme with an objective to generate long-term growth of capital, by investing predominantly in a diversified portfolio of equity and equity related securities in the domestic and international markets.
Investment Objective
Date of inception / takeover : October 31, 2007
Fund Manager : Mr. Mahesh Patil & Mr. Vineet Maloo
NAV : Rs.
Growth : 8.71
Dividend : 8.71
Benchmark:Customised Index† Average AUM : Rs. 746.18 Crores
Investment Style Box
Value Blend Growth Size
Large
Mid
Small
Investment Style
Portfolio
Foreign Equity 27.26Aetna Inc New 0.61Airgas Inc 0.39Akzo Nobel NV 0.81Bayer AG 0.74Bayerische Motoren 0.29Bumiputra-Commerce 0.60Cheung Kong Intl 0.79China Construction 0.66China Mobile (Hk) 0.57China Oil Field 0.61Chubb Corp 0.32Coca Cola Co 0.75Esprit Hldgs Ltd 0.70Foxconn Intl Holding 0.45Genting Bhd (Cds) 0.55Groupe Danone 0.73Ind & Comm Bank 0.77L.G. Electronics 0.06Manitowoc Co. Inc 0.31Merck & Co Inc 0.48Metso Corporation 0.41Microsoft Corportion 0.53Mtr Corp Ltd. 0.64Nestle Sa 0.80Nobel Corp 0.86Northrop Grumman Co 0.67Oracle Corporation 0.44Pride International 0.99Procter & Gamble Co 0.76Public Bank Bhd 0.71Reckitt Benckiser Pl 0.76Renewable Enrgy Corp 0.75Schneider Elctric SA 0.70Statoilhydro ASA 0.94Taiwan Semiconductor-ADR 0.98Telenor ASA 0.74Teva Pharma Ind Adr 0.77Unibanco Holding GDR 0.82Venture Corporation 0.76Vimpel Communication 0.64Wharf Holdings Ltd. 0.70
Wimm Bill Dann - ADR 0.71
Banks 8.12ICICI Bank Ltd. 2.14Kotak Mahindra Bank Ltd. 1.28Punjab National Bank 1.27ING Vysya Bank Ltd. 1.00Union Bank of India 0.82State Bank of India 0.77Indian Bank 0.57Centurion Bank of Punjab Ltd. 0.27
Software 5.60Tata Consultancy Services Ltd. 2.90Infosys Technologies Ltd. 2.70
Telecom-Services 5.58Bharti Airtel Ltd. 3.05Reliance Communications Ltd. 2.53
Industrial Capital Goods 5.53Bharat Heavy Electricals Ltd. 2.83Crompton Greaves Ltd. 1.59Bharat Electronics Ltd. 0.70Havells India Ltd. 0.41
Construction 4.62GMR Infrastructure Ltd. 1.10D.S. Kulkarni Developers Ltd. 1.04Nagarjuna Construction Co. Ltd. 1.02Hindustan Construction Co. Ltd. 0.67Madhucon Projects Ltd. 0.64Punj Lloyd Ltd. 0.15
Petroleum Products 4.58Reliance Industries Ltd. 4.58
Finance 3.92ICRA Ltd. 1.52Housing Development Finance Corp. Ltd. 1.41India Infoline Ltd. 0.99Octav Investments Limited.** 0.00
Consumer Non Durables 3.38Colgate-Palmolive (India) Ltd. 1.40ITC Ltd. 1.20United Spirits Ltd. 0.78
Ferrous Metals 3.37Tata Steel Ltd. 2.30Welspun Gujarat Stahl Rohren Ltd. 1.07
Power 2.45Tata Power Company Ltd. 1.34GVK Power & Infrastructure Ltd. 1.11
Media & Entertainment 2.09Zee Entertainment Enterprises Ltd 1.52New Delhi Television India Ltd. 0.57
Diversified 1.84United Breweries Holdings Ltd. 0.93Aditya Birla Nuvo Ltd. 0.91
Oil 1.49Oil & Natural Gas Corporation Ltd. 1.49
Non - Ferrous Metals 1.29Sterlite Industries (India) Ltd. 1.29
Gas 0.91GAIL (India) Ltd. 0.91
Auto 0.69Maruti Suzuki India Ltd. 0.69
Cement 0.24India Cements Ltd 0.24
Industrial Products 0.24Kirloskar Oil Engines Ltd. 0.24
Cash & Current Assets 16.80
Total Net Asset 100.00
Issuer % to NetAssets
Issuer % to NetAssets
Issuer % to NetAssets
Investment Performance
Past performance may or may not be sustained in future. Returns are in % and absolute returns for period less than 1 year & CAGR for period 1 year or more.
Asset Allocation
J u n e 2 0 0 8
Birla Sun Life International Equity Fund - Plan B
†A customized benchmark created using BSE 200 to the extent of 65% of portfolio and S&P Global 1200 to the extent of 35% of portfolio.
†A customized benchmark created using BSE 200 to the extent of 65% of portfolio and S&P Global 1200 to the extent of 35% of portfolio. †A customized benchmark created using BSE 200 to the extent of 65% of portfolio and S&P Global 1200 to the extent of 35% of portfolio.
** Represents thinly traded/ non traded securities and illiquid securities. Total outstanding exposure in derivatives as on May 31, 2008 is Rs 48.89 Crores.
Birla Sun Life International Equity Fund - Plan B - Growth Customised Index†
% R
etu
rns
21
*For direct application: Entry Load is Nil. **Exit Load is NIL for units issued in Bonus & Dividend Reinvestment.
Your Total Investment Rs. 6,000
Value of Your Investment Rs. 5,576
Value of Benchmark (Customised Index†) Rs. 5,773
Return on Investment (CAGR)* -22.85%
Benchmark (Customised Index†) Returns (CAGR)* -12.72%
Load Structure (Incl. for SIP) Entry Load* : < Rs. 5 crores - 2.50%
³ Rs. 5 crores - NilExit Load** : < 5 Crores - 1% if redeemed /
switched out within 12 months ³ Rs. 5 crores - Nil
2.09%
2.45%
3.37%
3.38%
3.92%
4.58%
4.62%
5.53%
5.58%
5.60%
6.70%
8.12%
16.80%
27.26%
Media & Entertainment
Power
Ferrous Metals
Consumer Non Durables
Finance
Petroleum Products
Construction
Industrial Capital Goods
Telecom-Services
Software
Other Equity
Banks
Cash & Current Assets
Foreign Equity
-1.58
4.73
-5.46
-12.9
-1.98
7.88
-1.65
-11.13
-15
-10
-5
0
5
10
1 Month
2 Months
3 Months Since Inception

Birla Sun Life Special Situations Fund
As on May 31, 2008
SIP is a powerful tool that can help you create wealth over time. If you had invested in Birla Sun Life Special Situations Fund...
Systematic Investment Plan (SIP)
Date of First Installment : March 01, 2008
The data assumes the investment of Rs.1,000/- on 1st day of every month or the subsequent working day. Load and Taxes are not considered for computation of returns. Past performance may or may not be sustained in future.
*CAGR Returns are computed after accounting for the cash flow by using the XIRR method (investment internal rate of return)
An Open-ended diversified equity scheme with an objective of the scheme is to generate long-term growth of capital by investing in a portfolio of equity and equity related securities. The Scheme would follow an investment strategy that would take advantage of Special Situations & Contrarian investment style.
Investment Objective
Date of inception / takeover : Jan 31, 2008
Fund Manager : Mr. A. Balasubramanian & Mr. Jignesh Shah
NAV : Rs.
Growth : 9.14
Dividend : 9.14
Benchmark : BSE 200
Average AUM : Rs. 771.46 Crs
Investment Style Box
Value Blend Growth Size
Large
Mid
Small
Investment Style
Portfolio
Construction 12.37Akruti City Ltd. 3.47Larsen & Toubro Ltd. 3.24Jaiprakash Associates Ltd. 2.60Patel Engineering Ltd. 1.88Hindustan Construction Co. Ltd. 1.02Nagarjuna Construction Co. Ltd. 0.16
Petroleum Products 10.56Reliance Industries Ltd. 9.19Indian Oil Corporation Ltd. 1.37
Ferrous Metals 8.34Jindal Steel & Power Ltd. 3.78Tata Steel Ltd. 2.63Welspun Gujarat Stahl Rohren Ltd. 1.94
Consumer Non Durables 7.53ITC Ltd. 3.32United Spirits Ltd. 2.19Bajaj Hindustan Ltd. 2.01
Software 7.16Satyam Computer Services Ltd. 3.76Infosys Technologies Ltd. 2.89Tata Consultancy Services Ltd. 0.51
Power 6.56NTPC Ltd. 4.26Reliance Infrastructure Ltd. 1.64
LANCO Infratech Ltd. 0.65
Fertilisers 5.35Tata Chemicals Ltd. 5.00Coromandalam Fertilizers Ltd. 0.35
Banks 5.30State Bank of India 2.37Bank of India 1.06Bank of Baroda 1.02Dena Bank 0.56Axis Bank Ltd. 0.30
Non - Ferrous Metals 3.75Sterlite Industries (India) Ltd. 3.75
Pharmaceuticals 3.27Divis Laboratories Ltd. 1.85Glaxosmithkline Pharmaceuticals Ltd. 1.21Glenmark Pharmaceuticals Ltd. 0.21
Diversified 2.51Aditya Birla Nuvo Ltd. 2.03United Breweries Holdings Ltd. 0.48
Cement 2.17Century Textile & Industries Ltd. 1.52ACC Ltd. 0.65
Gas Utilities 1.91Gujarat Fluorochemicals Ltd 1.91
Chemicals 1.81Gujarat Alkalies & Chemicals Ltd. 1.73BASF India Ltd. 0.08
Telecom-Services 1.72Reliance Communications Ltd. 1.72
Finance 1.42LIC Housing Finance Ltd. 0.64Housing Development Finance Corp. Ltd. 0.60Bajaj Finserv Ltd 0.19
Paper 0.76Ballarpur Industries Ltd. 0.76
Media & Entertainment 0.70Adlabs Films Ltd. 0.70
Auto 0.17Bajaj Auto Ltd. 0.17
Industrial Capital Goods 0.05Thermax Ltd. 0.05
Cash & Current Assets 16.59
Total Net Asset 100.00
Issuer % to NetAssets
Issuer % to NetAssets
Issuer % to NetAssets
Investment Performance
Past performance may or may not be sustained in future. Returns are in % and absolute returns for period less than 1 year
Asset Allocation
% R
etu
rns
Birla Sun Life Special Situations Fund - Growth BSE 200
J u n e 2 0 0 8
Total outstanding exposure in derivatives as on May 31, 2008 is Rs 4.68 Crores (Notional value).
22
*For direct application: Entry Load is Nil. **Exit Load is NIL for units issued in Bonus & Dividend Reinvestment.
Your Total Investment Rs. 2,000
Value of Your Investment Rs. 2,010
Value of Benchmark (BSE 200) Rs. 1,986
Return on Investment (CAGR)* 4.41%
Benchmark (BSE 200) Returns (CAGR)* -5.68%
Load Structure :
Entry Load* (For SIP) : NilEntry Load* (Except SIP) : < Rs. 5 crores - 2.25%
³ Rs. 5 crores - Nil
Exit Load** (For SIP) : Redeemed / switched out within 24 months: 2.25%
Exit Load** (Except SIP) : < Rs. 5 crores - 1% if redeemed / switched out within 12 months ³ Rs. 5 crores - Nil
2.17%
2.51%
3.27%
3.75%
5.30%
5.35%
6.56%
7.16%
7.53%
8.34%
8.55%
10.56%
12.37%
16.59%
Cement
Diversified
Pharmaceuticals
Non - Ferrous Metals
Banks
Fertilisers
Power
Software
Consumer Non Durables
Ferrous Metals
Other Equity
Petroleum Products
Construction
Cash & Current Assets
-3.98
3.26
-7.36
-8.58
-5.53
1.27
-8.08-8.62
-10
-8
-6
-4
-2
0
2
4
1 Month
2 Months
3 Months Since Inception

Birla Sun Life '95 Fund
As on May 31, 2008
Investment Performance
Past performance may or may not be sustained in future. Returns are in % and absolute returns for period less than 1 year & CAGR for period 1 year or more. When benchmark returns are not available, they have not been shown.
Portfolio
PSU/PFI Bonds/Banks 22.72LIC Housing Finance Ltd.** 5.87 AAAPower Finance Corporation Ltd.** 5.32 AAAICICI Bank Ltd.** 4.23 AAAPower Finance Corporation Ltd.** 2.86 AAANational Bank for Agriculture & Rural Development** 2.34 AAAState Bank of Indore** 2.11 AAA
Consumer Non Durables 7.13ITC Ltd. 3.84 Nestle India Ltd. 1.97 Colgate-Palmolive (India) Ltd. 1.32
Software 6.80Infosys Technologies Ltd. 4.60 Satyam Computer Services Ltd. 2.19
Construction 6.38DLF Ltd. 2.15 Housing Development & Infrastructure Ltd 1.70 Jaiprakash Associates Ltd. 1.65 Larsen & Toubro Ltd. 0.87
Banks 6.24Kotak Mahindra Bank Ltd. 2.84 ICICI Bank Ltd. 1.76 Punjab National Bank 1.29 Allahabad Bank 0.35
Pesticides 5.63Rallis India Ltd. 5.63
Petroleum Products 5.40Reliance Industries Ltd. 3.53 Indian Oil Corporation Ltd. 1.88
Diversified 4.50United Breweries Holdings Ltd. 3.12 Aditya Birla Nuvo Ltd. 0.72 Bombay Burmah Trading Corporation Ltd. 0.67
Industrial Capital Goods 4.25Bharati Shipyard Ltd. 1.72 Bharat Heavy Electricals Ltd. 1.07 Siemens Ltd. 1.05 Crompton Greaves Ltd. 0.41
Gas 3.83BOC India Ltd. 2.22 Gujarat Gas Co. Ltd. 1.61
Retailing 3.72Trent Ltd. 3.72
Finance 2.93Infrastructure Development Finance Co. Ltd. 1.51 Bajaj Finserv Ltd 0.48 Bajaj Holdings & Investment Ltd 0.48 Rural Electrification Corporation Ltd 0.24 Indiabulls Securities Limited. 0.22
Pharmaceuticals 2.90Glenmark Pharmaceuticals Ltd. 2.90
Telecom-Services 2.76Bharti Airtel Ltd. 2.76
Fertilisers 2.57Rashtriya Chemicals & Fertilizers Ltd. 2.57
Ferrous Metals 1.87Steel Authority of India Ltd. 1.87
Media & Entertainment 1.33ETC Networks Ltd. 1.33 Magnasound India Ltd. ** 0.00
Power 1.29GVK Power & Infrastructure Ltd. 1.29
Transportation 1.20Gateway Distriparks Ltd. 1.20
Oil 0.94Aban Offshore Ltd. 0.94
Auto 0.43Bajaj Auto Ltd. 0.43
Cash & Current Assets 5.17
Total Net Asset 100.00
** Represents thinly traded/ non traded securities. Total Percentage of thinly/non traded securities is 22.73%.
SIP is a powerful tool that can help you create wealth over time. If you had invested in Birla Sun Life '95 Fund...
Systematic Investment Plan (SIP)
Asset Allocation
Date of First Installment : April 1, 1995
The data assumes the investment of Rs.1,000/- on 1st day of every month or the subsequent working day. Load and Taxes are not considered for computation of returns. Past performance may or may not be sustained in future.
*CAGR Returns are computed after accounting for the cash flow by using the XIRR method (investment internal rate of return)
An open-end balanced scheme with the objective of long term growth of capital and current income, through a portfolio of equity and fixed income securities
Investment Objective
Date of inception / takeover : February 10, 1995
Fund Manager : Mr. A. Balasubramanian
NAV : Rs.
Growth : 211.56
Dividend : 97.74
Benchmark : CRISIL Balanced Fund Index
Average Maturity : 6.08 Years
Average AUM : CroresRs. 172.26
Investment Style Box
Investment Period
Total Investment
(Rs.)
Value (Rs.) of SIP in Returns (%)*
Birla Sun Life '95 Fund
Birla Sun Life '95 Fund
CRISIL Balanced
Fund Index
CRISIL Balanced
Fund Index
Rating Profile
Value Blend Growth Size
Large
Mid
Small
Investment Style
Since Inception 158000 383024 1203105 12.60 27.84
Last 5 years 60000 97040 111334 19.33 25.03
Last 3 years 36000 45818 46516 16.35 17.42
Last 1 year 12000 12012 11549 0.19 -6.93
Interest Rate Sensitivity: (Debt) Low
Issuer % to Net RatingAssets
Issuer % to Net RatingAssets
Birla Sun Life 95 Fund - Growth Crisil Balanced Fund Index
% R
etu
rns
J u n e 2 0 0 8
Best Fund - 10 yrs performance&Lipper Awards India 2008
Winner of
Mixed Asset INR Aggressive, (6 schemes) 10 Yrs ended 31-Dec-07
Birla Sun Life ‘95 Fund - Growth
(Past performance is no guarantee of future results.) for ranking methodology please refer page 43
(An open ended balanced Scheme)
23
*For direct application: Entry Load is Nil. **Exit Load is NIL for units issued in Bonus & Dividend Reinvestment.
Load Structure :
Entry Load* (For SIP) : NilEntry Load* (Except SIP) : < Rs. 5 crores - 2.25%
³ Rs. 5 crores - Nil
Exit Load** (For SIP) : Redeemed / switched out within 24 months: 2.25%
Exit Load** (Except SIP) : < Rs. 5 crores - 1% if redeemed / switched out within 12 months ³ Rs. 5 crores - Nil
6.89
25.52
32.83
25.76
13.41
22.16
24.15
0
5
10
15
20
25
30
35
1 Year 3 Years 5 Years Since Inception
2.57%
2.76%
2.90%
2.93%
3.72%
3.83%
4.25%
4.50%
5.17
5.40%
5.63%
6.24%
6.38%
6.80%
7.07%
7.13%
22.72%
Fertilisers
Telecom-Services
Pharmaceuticals
Finance
Retailing
Gas
Industrial Capital Goods
Diversified
Cash & Current Assets
Petroleum Products
Pesticides
Banks
Construction
Software
Other Equity
Consumer Non Durables
PSU/PFI Bonds/Banks
5.17%
22.72%
72.11%
Cash & Current Assets
AAA
Equity

Birla Balance
As on May 31, 2008
Investment Performance
Past performance may or may not be sustained in future. Returns are in % and absolute returns for period less than 1 year & CAGR for period 1 year or more. When benchmark returns are not available, they have not been shown.
Portfolio
Consumer Non Durables 17.76ITC Ltd. 5.63 E.I.D. Parry (India) Ltd. 4.85 Radico Khaitan Ltd 3.17 Shaw Wallace Company Ltd. 1.76 United Spirits Ltd. 1.59 Balrampur Chini Mills Ltd. 0.76
PSU/PFI Bonds/Banks 14.65Infrastructure Development Fin. Co. Ltd.** 7.42 AAACitibank N A** 6.83 AAAHDFC Bank Ltd.** 0.40 AAA
Pharmaceuticals 11.55Novartis India Ltd. 4.29 Pfizer Ltd. 3.71 Nicholas Piramal India Ltd. 1.71 Wyeth Ltd. 1.70 Piramal Life Sciences Limited. 0.14
Software 7.66Infosys Technologies Ltd. 3.68 Wipro Ltd. 2.15 HCL Technologies Ltd. 1.84
Auto 5.63Mahindra & Mahindra Ltd. 3.62 Tata Motors Ltd. 1.58 Bajaj Auto Ltd. 0.43
Gas 5.13BOC India Ltd. 2.98 Indraprastha Gas Ltd. 2.15
Petroleum Products 4.91Reliance Industries Ltd. 3.39 Indian Oil Corporation Ltd. 1.52
Fertilisers 3.10Tata Chemicals Ltd. 2.16 Gujarat Narmada Valley Fertilisers Co. Ltd. 0.93
Government Bond 2.62Govt Bond 7.61% Oil Company 2015 2.62 Sovereign
Pesticides 2.40United Phosphorus Ltd. 2.40
Telecom-Services 2.06Bharti Airtel Ltd. 2.06
Finance 1.87Infrastructure Development Finance Co. Ltd. 1.38 Bajaj Finserv Ltd. 0.48
Oil 1.62Oil & Natural Gas Corporation Ltd. 1.62
Banks 1.27Punjab National Bank 1.27
Construction 1.12Punj Lloyd Ltd. 1.12
Hotels 1.00Hotel Leelaventure Ltd. 1.00
Corporate Debt 0.47Housing Development Finance Corp Ltd.** 0.47 AAA
Industrial Capital Goods 0.33Bharat Electronics Ltd. 0.33
Cash & Current Assets 14.88
Total Net Asset 100.00
SIP is a powerful tool that can help you create wealth over time. If you had invested in Birla Balance...
Systematic Investment Plan (SIP)
Asset Allocation
Date of First Installment : November 1,1999
The data assumes the investment of Rs.1,000/- on 1st day of every month or the subsequent working day. Load and Taxes are not considered for computation of returns. Past performance may or may not be sustained in future.
*CAGR Returns are computed after accounting for the cash flow by using the XIRR method (investment internal rate of return)
An Open-ended balanced scheme with an objective to balance income requirements with growth of capital through a balance mix of investments in equity and debt at relatively moderate levels of risks through a diversifiedresearch based investment approach.
Investment Objective
Date of inception / takeover : October 12, 1999
Fund Manager : Mr. A. Balasubramanian
NAV : Rs.
Growth : 31.22
Dividend : 20.76
Benchmark : CRISIL Balanced Fund Index Average Maturity : 1.89 Years
Average AUM : Rs. 107.52 Crores
Investment Style Box
Investment Period
Total Investment
(Rs.)
Value (Rs.) of SIP in Returns (%)*
Birla Balance
Birla Balance
CRISIL Balanced
Fund Index
CRISIL Balanced
Fund Index
Rating Profile
Issuer % to Net RatingAssets
Issuer % to Net RatingAssets
Value Blend Growth Size
Large
Mid
Small
Investment Style
Since Inception 103000 223313 236823 17.43 18.74
Last 5 years 60000 97040 95846 19.33 18.82
Last 3 years 36000 45818 43722 16.35 13.07
Last 1 year 12000 12012 11689 0.19 -4.80
Interest Rate Sensitivity: (Debt) Medium
Birla Balance - Growth Crisil Balanced Fund Index
% R
etu
rns
Load Structure (Incl. for SIP) Entry Load*:< Rs. 5 crores - 2.25%
³ Rs. 5 crores - NilExit Load** :< Rs. 5 crores - 1% if redeemed
/ switched out within 12 months ³ Rs. 5 crores - Nil
J u n e 2 0 0 8 (An open ended balanced Scheme)
**Represents thinly traded / non traded securities. Total Percentage of thinly/non traded securities is 15.12%.
24
*For direct application: Entry Load is Nil. **Exit Load is NIL for units issued in Bonus & Dividend Reinvestment.
6.03
20.33
25.72
14.0913.41
22.16
24.15
0
5
10
15
20
25
30
1 Year 3 Years 5 Years Since Inception
0.47%
2.06%
2.40%
2.62%
3.10%
4.91%
5.13%
5.63%
7.20%
7.66%
11.55%
14.65%
14.88%
17.76%
Corporate Debt
Telecom-Services
Pesticides
Government Bond
Fertilisers
Petroleum Products
Gas
Auto
Other Equity
Software
Pharmaceuticals
PSU/PFI Bonds/Banks
Cash & Current Assets
Consumer Non Durables
2.62%
14.88%
15.11%
67.39%
Sovereign
Cash & Current Assets
AAA
Other

Birla Sun Life Monthly IncomeAn open- ended fund. Monthly income is not assured and is subject
to availability of distributable surplus
As on May 31, 2008
Investment Performance
Past performance may or may not be sustained in future. Returns are in % and absolute returns for period less than 1 year & CAGR for period 1 year or more. When benchmark returns are not available, they have not been shown.
Portfolio
** Represents thinly traded/ non traded securities and illiquid securities. Total Percentage of thinly/non traded securities is 49.62%.
An open-end income scheme with the primary objective to generate regular income so as to make monthly and quarterly distributions to Unitholders and the secondary objective as growth of capital. Monthly income is not assured and is subject to availability of distributable surplus.
Investment Objective
Fund Manager : Mr. A. BalasubramanianDate of inception/takeover : July 14, 1999
NAV : Rs.Growth : 27.9852Monthly Dividend : 10.3417Quarterly Dividend : 11.0075
Load Structure (Incl. for SIP):
Entry Load :
Exit Load** : For redemption / switch out of
units within 12 months from the
date of allotment: 1%
NIL
Benchmark : CRISIL MIP Blended
IndexAverage AUM : Rs. 177.08 Crores
Average Maturity : 2.25 Years
Investment Style Box
Asset Allocation
Rating Profile
Corporate Debt 26.59
GE Capital Services India Ltd. ** 9.16 AAA
Housing Development Finance Corporation Ltd. ** 8.34 AAA
Reliance Industries Ltd. ** 7.47 AAA
Sundaram Finance Ltd. ** 1.62 AA+
PSU/PFI Bonds/Banks 23.03
Power Finance Corporation Ltd. ** 10.76 AAA
LIC Housing Finance Ltd. ** 5.72 AAA
Power Finance Corporation Ltd. ** 3.99 AAA
National Bank for Agricultural & Rural Development. ** 1.45 AAA
Infrastructure Development Finance company Ltd. ** 1.11 AAA
EQUITY 12.93
Infosys Technologies Ltd. 1.34
BOC India Ltd. 1.08
Rallis India Ltd. 1.04
HCL Technologies Ltd. 0.99
Cipla Ltd. 0.98
Canara Bank 0.88
Mahindra & Mahindra Ltd. 0.78
Oriental Bank of Commerce 0.70
ETC Networks Ltd. 0.64
United Breweries Holdings Ltd. 0.60
Nestle India Ltd. 0.50
Hero Honda Motors Ltd. 0.41
Reliance Power Ltd. 0.40
McDowell Holdings Ltd. 0.38
United Phosphorus Ltd. 0.37
Rashtriya Chemicals & Fertilizers Ltd. 0.37
Pritish Nandy Communications Ltd. 0.37
Rural Electrification Corporation Ltd 0.32
Power Grid Corporation of (I) Ltd. 0.28
Gujarat Gas Co. Ltd. 0.27
Bharti Airtel Ltd. 0.17
United Breweries Ltd. 0.05
Magnasound India Ltd. ** 0.00
United Breweries Ltd. (Rights) ** 0.00
Government Bond 7.72
Govt. Bond 7.47% 2012 3.13 Sovereign
Govt Bond 7.99% 2017 2.70 Sovereign
Govt Bond 5.87%2010 1.88 Sovereign
Cash & Current Assets 29.73
Total Net Asset 100.00
Issuer % to Net RatingAssets
Issuer % to Net RatingAssets
Issuer % to Net RatingAssets
High Med LowInterest Rate
Sensivity
High
Mid
Low
Credit Quality
CRISIL~CPR 2^^Birla Sun Life Monthly Income
MIP Conservative Scheme ( Schemes) Yrs ended -Mar-089 , 2 31
Birla Sun Life Monthly Income - Growth Crisil MIP Blended Index
(Past performance is no guarantee of future results.) for ranking methodology please refer page 43
% R
etu
rns
J u n e 2 0 0 8
CNBC TV-18 CRISIL AWARD 2007Birla Sun Life Monthly Income
&&
Category: Monthly Income Plans – Conservative 1 yr performance ended 31 Dec, '07. Total Schemes in Category = 9
25
**Exit Load is NIL for units issued in Bonus & Dividend Reinvestment.
7.26
9.669.95
12.28
9.42 9.31 9.12
0
2
4
6
8
10
12
14
1 Year 3 Years 5 Years Since Inception
7.72%
12.93%
23.03%
26.59%
29.73%
Government Bond
Equity
PSU/PFI Bonds/Banks
Corporate Debt
Cash & Current Assets
1.62%
7.72%
12.93%
29.73%
48.00%
AA
Sovereign
Equity
Cash & Current Assets
AAA

Birla MIPAn open- ended fund. Monthly income is not assured and is subject to
availability of distributable surplus
As on May 31, 2008
Investment Performance
Past performance may or may not be sustained in future. Returns are in % and absolute returns for period less than 1 year & CAGR for period 1 year or more. When benchmark returns are not available, they have not been shown.
Portfolio
** Represents thinly traded/ non traded securities and illiquid securities.Total Percentage of thinly/non traded securities is 56.25 %..
An Open-ended income scheme with the objective to generate regular income so as to make monthly distribution to unit holders with the secondary objective being growth of capital. Monthly Income is not assured and is subject to availability of distributable surplus.
Investment Objective
Fund Manager : Mr. A. BalasubramanianDate of inception/takeover : November 20, 2000
NAV : Rs.
Payment / Growth : 20.8534
Dividend : 10.5170
Load Structure (Incl. for SIP):
Entry Load :
Exit Load** : £ Rs 10 lakhs: 0.60% if redeemed
/ switched out with in 90 days
from the date of allotment.
> 10 Lakhs: Nil
NIL
Benchmark : CRISIL MIP Blended
IndexAverage AUM : Rs. 123.83 Crores
Average Maturity : 3.23 Years
Investment Style Box
Asset Allocation
Rating Profile
PSU/PFI Bonds/Banks 37.38
Power Finance Corporation Ltd. ** 9.98 AAA
ICICI Bank Ltd. ** 7.58 AAA
Power Finance Corporation Ltd. ** 6.59 AAA
State Bank of Indore ** 5.87 AAA
LIC Housing Finance Ltd. ** 4.09 AAA
Power Grid Corporation of India Ltd. ** 3.09 AAA
State Bank of India. ** 0.17 AAA
Corporate Debt 18.87
Great Eastern Shipping Company Ltd. ** 7.59 AAA
Housing Development Finance Corporation Ltd. ** 5.62 AAA
GE Capital Services India Ltd. ** 4.04 AAA
Sundaram Finance Ltd. ** 1.62 AA+
EQUITY 14.42
ITC Ltd. 1.43
Rallis India Ltd. 1.10
Simplex Infrastructures Ltd. 1.09
Raymond Ltd. 0.96
Hanung Toys & Textiles Ltd. 0.94
Pfizer Ltd. 0.92
Satyam Computer Services Ltd. 0.84
Shaw Wallace Company Ltd. 0.81
Reliance Industries Ltd. 0.79
Mahindra & Mahindra Ltd. 0.73
Punjab National Bank 0.54
HCL Technologies Ltd. 0.51
Hero Honda Motors Ltd. 0.45
Union Bank of India 0.45
United Phosphorus Ltd. 0.43
Wipro Ltd. 0.42
Housing Development Finance Corp. Ltd. 0.40
Hindustan Petroleum Corporation Ltd. 0.38
Rural Electrification Corporation Ltd 0.36
Indian Bank 0.35
GAIL (India) Ltd. 0.33
Indiabulls Securities Ltd. 0.17
Mutual Fund Units 0.29
Birla Fixed Term Debt Fund Ser 3 -36 B 0.29
Cash & Current Assets 29.04
Total Net Asset 100.00
Issuer % to Net RatingAssets
Issuer % to Net RatingAssets
Issuer % to Net RatingAssets
High Med LowInterest Rate
Sensivity
High
Mid
Low
Credit Quality
Birla MIP - Growth Crisil MIP Blended Index
% R
etu
rns
J u n e 2 0 0 8
26
**Exit Load is NIL for units issued in Bonus & Dividend Reinvestment.
5.97
8.188.65
10.22
9.42 9.31 9.12
0
2
4
6
8
10
12
1 Year 3 Years 5 Years Since Inception
0.29%
14.42%
18.87%
29.04%
37.38%
Mutual Fund Units
Equity
Corporate Debt
Cash & Current Assets
PSU/PFI Bonds/Banks
0.29%
1.62%
14.42%
29.04%
54.63%
Mutual Fund Units
AA
Equity
Cash & Current Assets
AAA
(Past performance is no guarantee of future results.) for ranking methodology please refer page 43
CRISIL~CPR 2^^Birla MIP
MIP Conservative Scheme ( Schemes) Yrs ended - -089 , 2 31 Mar

As on May 31, 2008
Birla MIP II - Wealth 25 PlanAn open- ended fund. Monthly income is not assured and is subject
to availability of distributable surplus
Investment Performance
Past performance may or may not be sustained in future. Returns are in % and absolute returns for period less than 1 year & CAGR for period 1 year or more.
Portfolio
** Represents thinly traded/ non traded securities and illiquid securities.Total Percentage of thinly/non traded securities is 47.61 %
An Open-ended income scheme with the objective to generate regular income so as to make monthly payment or distribution to unit holders with the secondary objective being growth of capital. Monthly Income is not assured and is subject to availability of distributable surplus.
Investment Objective
Fund Manager : Mr. A. BalasubramanianDate of inception/takeover : May 22, 2004
NAV : Rs.
Payment / Growth : 14.1833
Dividend : 10.2477
Load Structure (Incl. for SIP):
Entry Load :
Exit Load** : For redemption / switch out of
units within 12 months from the
date of allotment: 1%
NIL
Benchmark : CRISIL MIP Blended
IndexAverage AUM : Rs. 97.60 Crores
Average Maturity : 4.54 Years
Investment Style Box
Asset Allocation
Rating Profile
PSU/PFI Bonds/Banks 37.39
ICICI Bank Ltd. ** 12.93 AAA
Power Finance Corporation Ltd. ** 10.21 AAA
Power Finance Corporation Ltd. ** 5.27 AAA
LIC Housing Finance Ltd. ** 5.23 AAA
State Bank of Indore. ** 3.75 AAA
EQUITY 25.67
Tata Chemicals Ltd. 2.89
Nava Bharat Ventures Ltd. 2.61
Rural Electrification Corporation Ltd 2.25
Housing Development Finance Corp. Ltd. 1.79
HDFC Bank Ltd. 1.78
Rallis India Ltd. 1.68
ITC Ltd. 1.60
Bharati Shipyard Ltd. 1.57
Simplex Infrastructures Ltd. 1.40
Infosys Technologies Ltd. 1.35
Novartis India Ltd. 1.08
Pfizer Ltd. 1.06
Jaiprakash Associates Ltd. 1.03
Grasim Industries Ltd. 0.81
Reliance Industries Ltd. 0.76
Aditya Birla Nuvo Ltd. 0.64
Madras Cements Ltd. 0.60
ZF Steering Gear (India) Ltd. 0.53
Radico Khaitan Ltd 0.22
Mphasis Ltd. 0.02
Corporate Debt 10.22
GE Capital Services India Ltd. ** 5.16 AAA
Great Eastern Shipping Company Ltd. ** 4.85 AAA
Housing Development Finance Corporation Ltd. ** 0.20 AAA
Government Bond 1.78
Govt Bond 7.61% Oil Company 2015 1.78 Sovereign
Mutual Fund Units 0.37
Birla Fixed Term Debt Fund Ser 3 -36 B 0.37
Cash & Current Assets 24.56
Total Net Asset 100.00
Issuer % to Net RatingAssets
Issuer % to Net RatingAssets
Issuer % to Net RatingAssets
High Med LowInterest Rate
Sensivity
High
Mid
Low
Credit Quality
Birla MIP - Wealth 25 - Growth Crisil MIP Blended Index
% R
etu
rns
J u n e 2 0 0 8
27
**Exit Load is NIL for units issued in Bonus & Dividend Reinvestment.
2.65
8.778.96
9.42 9.31
8.13
0
1
2
3
4
5
6
7
8
9
10
1 Year 3 Years Since Inception
Cash & Current Assets
0.37%
1.78%
10.22%
24.56%
25.67%
37.39%
Mutual Fund Units
Government Bond
Corporate Debt
Equity
PSU/PFI Bonds/Banks
0.37%
0.60%
1.78%
24.56%
47.61%
Mutual Fund Units
Equity
Sovereign
Cash & Current Assets
AAA
(Past performance is no guarantee of future results.) for ranking methodology please refer page 43
CRISIL~CPR 2^^Birla MIP II - Wealth 25
MIP Aggressive Scheme ( Schemes) Yrs ended - -0814 , 2 31 Mar
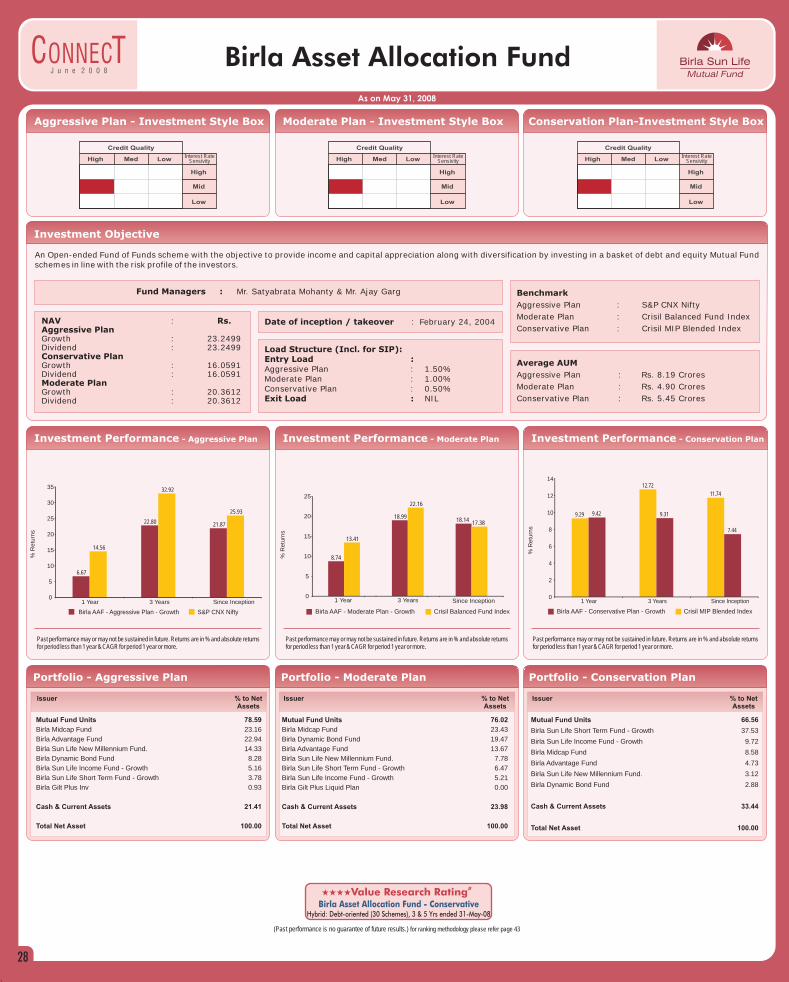
Birla Asset Allocation Fund
As on May 31, 2008
Portfolio - Aggressive Plan Portfolio - Moderate Plan Portfolio - Conservation Plan
An Open-ended Fund of Funds scheme with the objective to provide income and capital appreciation along with diversification by investing in a basket of debt and equity Mutual Fund schemes in line with the risk profile of the investors.
Investment Objective
Fund Managers : Mr. Satyabrata Mohanty & Mr. Ajay Garg
Date of inception / takeover : February 24, 2004NAV : Rs.Aggressive PlanGrowth : 23.2499Dividend : 23.2499Conservative PlanGrowth : 16.0591Dividend : 16.0591Moderate PlanGrowth : 20.3612Dividend : 20.3612
Load Structure (Incl. for SIP):Entry Load :Aggressive Plan : 1.50%Moderate Plan : 1.00%Conservative Plan : 0.50%Exit Load : NIL
Aggressive Plan - Investment Style Box Moderate Plan - Investment Style Box Conservation Plan-Investment Style Box
Investment Performance - Aggressive Plan
Past performance may or may not be sustained in future. Returns are in % and absolute returns for period less than 1 year & CAGR for period 1 year or more.
Investment Performance - Moderate Plan
Past performance may or may not be sustained in future. Returns are in % and absolute returns for period less than 1 year & CAGR for period 1 year or more.
Investment Performance - Conservation Plan
Past performance may or may not be sustained in future. Returns are in % and absolute returns for period less than 1 year & CAGR for period 1 year or more.
Issuer % to NetAssets
Issuer % to NetAssets
Issuer % to NetAssets
Mutual Fund Units 78.59
Birla Midcap Fund 23.16
Birla Advantage Fund 22.94
Birla Sun Life New Millennium Fund. 14.33
Birla Dynamic Bond Fund 8.28
Birla Sun Life Income Fund - Growth 5.16
Birla Sun Life Short Term Fund - Growth 3.78
Birla Gilt Plus Inv 0.93
Cash & Current Assets 21.41
Total Net Asset 100.00
Mutual Fund Units 66.56
Birla Sun Life Short Term Fund - Growth 37.53
Birla Sun Life Income Fund - Growth 9.72
Birla Midcap Fund 8.58
Birla Advantage Fund 4.73
Birla Sun Life New Millennium Fund. 3.12
Birla Dynamic Bond Fund 2.88
Cash & Current Assets 33.44
Total Net Asset 100.00
#iiiiValue Research Rating
Birla Asset Allocation Fund - ConservativeHybrid: Debt-oriented ( Schemes), 5 Yrs ended -30 3 & 31-May 08
Average AUM
Aggressive Plan : Rs. 8.19 Crores
Moderate Plan : Rs. 4.90 Crores
Conservative Plan : Rs. 5.45 Crores
Benchmark
Aggressive Plan : S&P CNX Nifty
Moderate Plan : Crisil Balanced Fund Index
Conservative Plan : Crisil MIP Blended Index
High Med LowInterest Rate
Sensivity
High
Mid
Low
High Med LowInterest Rate
Sensivity
High
Mid
Low
High Med LowInterest Rate
Sensivity
High
Mid
Low
Credit Quality Credit Quality Credit Quality
Birla AAF - Aggressive Plan - Growth S&P CNX Nifty Birla AAF - Moderate Plan - Growth Crisil Balanced Fund Index Birla AAF - Conservative Plan - Growth Crisil MIP Blended Index
(Past performance is no guarantee of future results.) for ranking methodology please refer page 43
% R
etu
rns
% R
etu
rns
% R
etu
rns
J u n e 2 0 0 8
Mutual Fund Units 76.02
Birla Midcap Fund 23.43
Birla Dynamic Bond Fund 19.47
Birla Advantage Fund 13.67
Birla Sun Life New Millennium Fund. 7.78
Birla Sun Life Short Term Fund - Growth 6.47
Birla Sun Life Income Fund - Growth 5.21
Birla Gilt Plus Liquid Plan 0.00
Cash & Current Assets 23.98
Total Net Asset 100.00
28
6.67
22.80 21.87
14.56
32.92
25.93
0
5
10
15
20
25
30
35
1 Year 3 Years Since Inception
8.74
18.9918.14
13.41
22.16
17.38
0
5
10
15
20
25
1 Year 3 Years Since Inception
9.29
12.72
11.74
9.42 9.31
7.44
0
2
4
6
8
10
12
14
1 Year 3 Years Since Inception

Birla Cash Plus
As on May 31, 2008
An Open-ended liquid scheme with the objective to provide reasonable returns at a high level of safety and liquidity through judicious investments in high quality debt and money market instruments.
Investment Objective
Fund Manager : Mr. Maneesh Dangi & Mr. Satyabrata Mohanty
Date of inception /takeover : June 16,1997
Load Structure
Entry Load :
Exit Load : NIL
NIL
Benchmark : Crisil Liquid Fund Index
Average AUM : Rs.10002.17 Crores
Average Maturity : 0.32 Years
Investment Style Box
Asset Allocation
Rating Profile
Investment Performance
Past performance may or may not be sustained in future. Returns are in % and absolute returns for period less than 1 year & CAGR for period 1 year or more. When benchmark returns are not available, they have not been shown.
NAV : Rs.Retail Growth : 22.0614Retail Dividend : 16.3732Institutional Growth : 22.2439Institutional Dividend : 10.8049Institutional Plan - Weekly Dividend Option : 10.8094Institutional Plan - Fortnightly Dividend Option : 10.8414Institutional Premium Plan - Growth : 13.0981Institutional Premium Plan - Dividend : 10.0219Institutional Premium Plan - Weekly Div. Option : 10.0249Institutional Premium Plan - Fortnightly Div. Option : 10.0000Institutional Premium Plan - Monthly Dividend : 10.0024
Portfolio
Money Market Instruments 54.05ICICI Bank Ltd. 8.83 A1+UCO Bank Ltd. 5.55 P1+IndusInd Bank Ltd. 5.52 A1+Housing Development Finance Corporation Ltd. 3.79 A1+IDBI Bank Ltd. 3.32 P1+Punjab National Bank 3.01 F1+State Bank of Indore 1.82 P1+State Bank of Travancore 1.57 P1+State Bank of Hyderabad 1.44 A1+Reliance Communication Ltd. 1.36 A1+Tata Capital Ltd. 1.33 A1+State Bank of Patiala 1.31 A1+Sundaram Finance Ltd. 1.30 P1+Kotak Mahindra Bank Ltd. 1.20 P1+Oriental Bank Of Commerce 1.11 P1+Adlabs Films Ltd. 1.10 A1+Indian Bank 1.04 F1+Reliance Capital Ltd. 1.01 A1+Karnataka Bank Ltd. 0.89 A1+State Bank of Mysore 0.83 A1+State Bank of Bikaner and Jaipur 0.60 P1+IDBI Home Finance Ltd. 0.55 A1+Citicorp Finance India Ltd. 0.55 P1+Larsen & Toubro Finance Ltd. 0.55 A1+AXIS Bank Ltd. 0.54 P1+ICICI Home Finance Company Ltd. 0.52 A1+Corporation Bank 0.52 P1+Karur Vysya Bank Ltd. 0.47 F1+National Bank for Agricultural & Rural Development 0.38 AAAL&T Infrastructure Finance Co. Ltd. 0.32 PR1+Indian Overseas Bank 0.28 A1+State Bank of Saurashtra 0.28 A1+ABN AMRO Bank 0.26 A1+Development Credit Bank Ltd. 0.26 P1+
ICICI Securities Ltd. 0.26 P1+Hindustan Construction Company Ltd. 0.22 PR1+Tata Sons Ltd. 0.20 P1+
Floating Rate Instruments 25.19Housing Development Finance Corporation Ltd. 6.98 AAACitiFinancial Consumer Finance India Ltd 3.11 AAATata Motors Ltd. 2.06 P1+Ultratech Cement Ltd. 1.67 AAATata Steel Ltd. 1.67 FAAALIC Housing Finance Ltd. 1.12 AAATata Sons Ltd. 0.83 AAAICICI Securities Ltd. 0.83 P1+Housing Development Finance Corporation Ltd. 0.73 LAAAGruh Finance Ltd 0.56 LAA+Berger Paints India Ltd 0.50 P1+Citicorp Finance India Ltd. 0.44 AAAAxis Bank Ltd. 0.43 LAA+ICICI Bank Ltd. 0.37 AAAIDBI Bank LTD. 0.34 CARE AA+Larsen & Toubro Finance Ltd. 0.33 PR1+Kotak Mahindra Bank Ltd. 0.33 P1+Power Finance Corporation Ltd. 0.32 AAAICICI Bank Ltd. 0.28 CARE AAARabo India Finance Private Ltd. 0.28 AAAHero Honda Finlease Ltd. 0.28 P1+Redington (India) Ltd. 0.28 P1+Indian Railway Finance Corporation Ltd. 0.26 AAAInfrastructure Development Finance Company Ltd. 0.22 AAANavneet Publications (India) Ltd. 0.22 P1+Indian Oil Tanking Ltd. 0.17 F1+Cholamandalam Investments & Finance Ltd. 0.17 LAA(SO)Blue Star Ltd. 0.17 PR1+IDBI Bank Ltd. 0.11 AA+DIC India Ltd. 0.09 P1+
Union Bank of India 0.05 AA+
Corporate Debt 5.69Indian Oil Corporation Ltd.** 3.33 A1+Chambal Fertilizers & Chemicals Ltd.** 1.11 P1+Canbank Factors Ltd.** 0.28 P1+Kotak Mahindra Prime Ltd.** 0.28 P1+Export-Import Bank of India** 0.28 AAAKotak Mahindra Prime Ltd.** 0.22 LAACitiFinancial Consumer Finance India Ltd** 0.12 AAADSP Merrill Lynch Capital Ltd. ** 0.06 P1+IL&FS Investsmart Limited** 0.01 F1+
Securitised Debt 5.24Credit Asset Trust Sr -XI Hutch 2008** 2.70 F1+(SO)Corporate Loan Sec Sr A2 LIC 06JUN08** 1.21 P1+(SO)Corporate Loan Sec Sr.29(A2) Trust 2008 ** 0.55 A1+(SO)Indian Corp Ln Sec Tr Sr V(A1) 29-MAR-08** 0.45 A1+(SO)Collateral Debt Tr Sr 20 Sr A1 27 Oct 08** 0.27 P1+(SO)Collateral Debt Tr Sr 20 Sr A2 27 Oct 08** 0.03 P1+(SO)Ind Cor Loan Sec Sr-Xlviii A2 11-SEPT-08** 0.02 A1+(SO)BHPC Auto Sec Trust 15 Oct 2008** 0.01 AAA(SO)Collateralised Debt Tr Sr.15(A2) LIC ** 0.01 P1+(SO)
PSU/PFI Bonds/Banks 2.39National Bank for Agricultural & Rural Development.** 2.11 AAAExport-Import Bank of India** 0.28 AAA
Treasury Bills 0.78364 Day T Bill 06 JUNE 2008 0.78 Sovereign
Cash & Current Assets 6.65
Total Net Asset 100.00
Issuer % to Net RatingAssets
Issuer % to Net RatingAssets
Issuer % to Net RatingAssets
High Med LowInterest Rate
Sensivity
High
Mid
Low
Credit Quality
#iiiiiValue Research Rating
Birla Cash Plus - Institutional PremiumDebt: Ultra Short-term Institutional (56 Schemes), 18 month ended 31-Mayr-08
#iiiiValue Research Rating
Birla Cash Plus - RetailDebt: Ultra Short-term ( Schemes), 18 month ended 53 31-May-08
CRISIL~CPR 2^^Birla Cash Plus - Institutional Premium Plan
Liquid Super Institutional Scheme (16 Schemes), 1 Yrs ended 31-Mar-08
CRISIL~CPR 2^^Birla Cash Plus - Institutional Plan
Liquid Institutional Scheme (9 Schemes), 1 Yrs ended 31-Mar-08
+The grading has been assigned by ICRA and indicates highest quality. The investment quality is similar to that of fixed income obligations of highest safety and with maturity corresponding upto 1 year. This grading should however, not be construed as an indication of the performance of the Mutual Fund scheme or of volatility in its returns.
Birla Cash Plus - Retail - Growth Crisil Liquid Fund Index
(Past performance is no guarantee of future results.) for ranking methodology please refer page 43
% R
etu
rns
J u n e 2 0 0 8
#iiiiValue Research Rating
Birla Cash Plus - Institutional Debt: Ultra Short-term Institutional (56 Schemes), 18 month ended 31-May-08
29
** Represents thinly traded/ non traded securities and illiquid securities.Total Percentage of thinly/non traded securities is 13.32%.
8.398.13 8.29
7.48
5.83
6.53
8.13
0
1
2
3
4
5
6
7
8
9
15 Days 1 Month 3 Months Since Inception
0.78%
2.39%
5.24%
5.69%
6.65%
25.19%
54.05%
Treasury Bills
PSU/PFI Bonds/Banks
Securitised Debt
Corporate Debt
Cash & Current Assets
Floating Rate Instruments
Money Market Instruments
0.78%
1.88%
6.65%
90.69%
Sovereign
AA
Cash & Current Assets
AAA

Birla Sun Life Liquid Plus
As on May 31, 2008
Investment Performance
Past performance may or may not be sustained in future. Returns are in % and absolute returns for period less than 1 year & CAGR for period 1 year or more. When benchmark returns are not available, they have not been shown.
An Open-ended short term income scheme with the objective to generate regular returns through investments in debt and money market securities.
Investment Objective
Fund Manager : Mr. Maneesh Dangi & Mr. Satyabrata Mohanty Date of inception / takeover
Retail Plan : November 27, 2001
Institutional Plan : April 16, 2003NAV : Rs.Insititutional Plan- Daily Dividend : 10.0091Insititutional Plan- Weekly Dividend : 10.0225Institution Plan- Monthly Dividend : 10.1364Institutional Growth : 15.4582Institutional Dividend : 10.6577Retail - Monthly Dividend : 10.1257Retail - Weekly Dividend : 10.0218Retail Fortnightly Dividend : 11.4381Retail Growth : 15.2498
Load Structure (Incl. for SIP):
Entry Load :
Exit Load : NIL
NIL
Benchmark : CRISIL Short-Term
Bond Fund Index
Average AUM : Rs. 10787.05 Crores
Average Maturity : 0.48 Years
Investment Style Box
Asset Allocation
Rating Profile
High Med LowInterest Rate
Sensivity
High
Mid
Low
Credit Quality
Portfolio
Money Market Instruments 60.97Punjab National Bank 10.04 F1+State Bank of Patiala 6.93 A1+ICICI Bank Ltd. 6.78 A1+Canara Bank 6.11 P1+Jammu & Kashmir Bank Ltd. 3.87 P1+Union Bank of India 3.81 A1+UCO Bank 2.82 P1+IDBI Bank Ltd. 2.73 P1+State Bank of Bikaner and Jaipur 2.70 P1+Housing Development Finance Corp Ltd. 2.65 A1+Allahabad Bank 2.07 A1+Oriental Bank of Commerce 2.03 P1+Reliance Capital 1.63 A1+Tata Sons Ltd. 1.30 A1+IDBI Bank Ltd. 1.01 A1+National Bank for Agri & Rural Devp 0.88 AAAKotak Mahindra Prime Ltd. 0.84 P1+Indiabulls Financial Services Ltd. 0.55 P1+State Bank of Hyderabad 0.53 A1+State Bank of Mysore 0.49 A1+Yes Bank Ltd. 0.37 A1+Cholamandalam DBS Finance Ltd. 0.32 A1+State Bank of Travancore 0.19 A1+L&T Infrastructure Finance Co. Ltd. 0.18 PR1+Tata Capital Ltd. 0.06 A1+Unitech Ltd. 0.05 PR1+
Corporate Debt 8.37Housing Development Finance Corp Ltd. ** 2.69 AAAK Raheja Corp. Private Ltd. ** 1.24Mahindra & Mahindra Financial Services Ltd. ** 1.23 P1+TRIL Infopark Ltd. ** 0.82 PR1+CitiFinancial Consumer Finance India Ltd. ** 0.75 AAAICICI Securities Ltd.. ** 0.66 P1+Kotak Securities Ltd. ** 0.20 A1+Dewan Housing Finance Corporation Ltd. ** 0.20 P1+Cholamandalam DBS Finance Ltd.. ** 0.18 LAAGE Capital Services India Ltd. ** 0.15 AAAMahindra & Mahindra Financial Services Ltd. ** 0.09 AA+Tata Sons Ltd. ** 0.05 AAAMahindra & Mahindra Financial Services Ltd. ** 0.04 AA+GE Money Financial Services Ltd. ** 0.03 AAASundaram Finance Ltd. ** 0.02 P1+
Securitised Debt 7.87RB Loan Trust Series X (A) (02-Mar-2009) ** 1.45 F1+(SO)Invest 1608 Sr A (India Bull)(27-Mar-09) ** 0.84 P1+(SO)BVL TRUST (Principal PTC) (20-Feb-2009) ** 0.77 A1+(SO)Cor Debt Tr 08 Sr 4 A1 (HPCL) (21 MAY09) ** 0.75 P1+(SO)Ge Capital Sev Kap Loan Tr Sr 26 June 08 ** 0.49 A1+(SO)Ge Cap Sev KRI Loan Tr Sr A2 14 JAN 09 ** 0.44 A1(SO)IML LOAN SE A1 FIXOPT(WOCKHAR) 29 MAY09 ** 0.43 F1+(SO)GE Cap Ser (I) KPU Loan Tr Sr A1 26JUN08 ** 0.41 A1(SO)GE Cap Ser (I) KPU Loan Tr Sr B1 2008 ** 0.41 A1(SO)Credit Asset TrustSr XLVIII(A3) 21MAY0 9 ** 0.38 F1+(SO)Corporate Loan Sec Sr A2 LIC 06JUN08 ** 0.34 P1+(SO)CLSS 89 TR A2 DLF 09 Feb 09 ** 0.31 A1+(SO)Collateralised Debt Trust SR. 15(A1) ** 0.20 P1+(SO)CLSS 87 TR A2 DLF 09 Feb 09 ** 0.19 A1+(SO)Loan Rec Tr Sep 07 Sr A1 19-Sep-2008 ** 0.12 P1+(SO)Corporate Loan Sec Sr 30 Tr 2008 L&T Fin ** 0.11 PR1+(SO)Loan Sec Trust Sr XVI NTPC (ICICI Bank) ** 0.07 AAA(SO)Cor Debt Tr 08 Sr 4 A2 (HPCL) (21 MAY09) ** 0.07 P1+(SO)Loan Sec Trust SrXII NTPC (ICICI) ** 0.03 AAA(SO)Ind Ret ABS Trust Ser 49(A4) 18 MAY 2010 ** 0.03 AAA(SO)RB Loan Tr SR III A4-IO Indiabull-2008 ** 0.03 A1+(SO)Corporate Loan Sec Sr.29(A1) Trust 2008 ** 0.01 A1+(SO)GE Cap Ser (I) KPU Loan Tr Sr B2 2008 ** 0.00 A1(SO)GE Cap Ser (I) KPU Loan Tr Sr A2 26JUN08 ** 0.00 A1(SO)Corporate Loan Sec Sr 30 A1 2008 L&T Fin ** 0.00 PR1+(SO)
Floating Rate Instruments 4.50Infrastructure Development Finance company Ltd. 1.64 LAAAHousing Development Finance Corporation Ltd. 0.83 LAAATata Motors Ltd. 0.82 P1+Kalpataru Ltd. 0.71Indian Railways Finance Corporation Ltd. 0.20 AAATata Sons Ltd. 0.12 AAAIndian Retail ABS Trust Series 50 0.09 AAA(SO)Kotak Mahindra Bank Ltd. 0.08 P1+
PSU/PFI Bonds/Banks 4.09National Bank for Agricultural & Rural Development. ** 3.94 AAAIDBI Bank Ltd. ** 0.09 AA+Oriental Bank of Commerce. ** 0.02 AA+IDBI Bank Ltd. ** 0.04 AA+
Cash & Current Assets 14.20
Total Net Asset 100.00
Issuer % to Net RatingAssets
Issuer % to Net RatingAssets
** Represents thinly traded/ non traded securities and illiquid securities.Total Percentage of thinly/non traded securities is 20.33 %.
Birla Sun Life Liquid Plus - Retail - Growth CRISIL Short-Term Bond Fund Index
(Past performance is no guarantee of future results.) for ranking methodology please refer page 43
% R
etu
rns
J u n e 2 0 0 8
30
8.28
7.01
6.236.69
8.26
6.26
5.39
0
1
2
3
4
5
6
7
8
9
1 Year 3 Years 5 Years Since Inception
4.09%
4.50%
7.87%
8.37%
14.20%
60.97%
PSU/PFI Bonds/Banks
Floating Rate Instruments
Securitised Debt
Corporate Debt
Cash & Current Assets
Money Market Instruments
1.30%
1.95%
14.20%
82.54%
AA
Unrated
Cash & Current Assets
AAA
CRISIL~CPR 1^^Birla Sun Life Liquid Plus
Liquid Plus Scheme (17 Schemes), 1 Yrs ended 31-Mar-08

Birla Sun Life Short Term Fund
As on May 31, 2008
Investment Performance
Past performance may or may not be sustained in future. Returns are in % and absolute returns for period less than 1 year & CAGR for period 1 year or more.
Portfolio
Asset Allocation
Rating Profile
An Open-ended short term income scheme with the objective to generate income and capital appreciation by investing 100% of the corpus in a diversified portfolio of debt and money market securities with relatively low levels of interest rate risk.
Investment Objective
Fund Manager : Mr. Maneesh Dangi & Mr. Satyabrata MohantyDate of inception/takeover : April 19, 2002
NAV (Retail Plan)* : Rs.Growth : 14.8730Monthly Dividend : 10.6377Fortnightly Dividend : 10.0707*Renamed with effect from 24/04/08
Load Structure (Incl. for SIP):
Entry Load :
Exit Load** : 0.15% for redemption / switch-out
of units within seven (7) days
from the date of allotment.
NIL
Benchmark : CRISIL Short-Term
Bond Fund IndexAverage AUM : Rs. 562.64 Crores
Average Maturity : 0.82 Years
Investment Style Box
High Med LowInterest Rate
Sensivity
High
Mid
Low
Credit Quality
Money Market Instruments 49.09
ICICI Bank Ltd. 28.56 A1+
State Bank of Patiala 10.41 A1+
Punjab National Bank 9.73 F1+
Tata Capital Ltd. 0.39 A1+
Corporate Debt 16.36
Tata Sons Ltd. ** 5.07 AAA
GE Money Financial Services Ltd. ** 4.47 AAA
Housing Development Finance Corporation Ltd. ** 4.24 AAA
Sundaram Finance Ltd. ** 1.02 LAA+
CitiFinancial Consumer Finance India Ltd. ** 0.93 AAA
Sundaram Finance Ltd. ** 0.64 AA+
Securitised Debt 12.83
Collateral Debt Tr Sr 20 Sr A1 27 Oct 08. ** 4.83 P1+(SO)
Corporate Loan Sec Sr 30 Tr 2008 L&T Fin. ** 2.24 PR1+(SO)
Credit Asset Tr Sr XI (Hutch) 2008. ** 2.03 F1+(SO)
** Represents thinly traded/ non traded securities and illiquid securities.Total Percentage of thinly/non traded securities is 37.15 %.
BVL TRUST (Interest PTC.) (20-Feb-2009). ** 1.79 A1+(SO)
Ind Ret ABS Trust Ser 49(A4) 18 MAY 2010. ** 1.53 AAA(SO)
BHPC AutoSec Trust Jun05-Sr. A3(15OCT08). ** 0.35 AAA(SO)
Auto Receivable Trust- Aug-2005 (Sundara).** 0.06 LAAA(SO)
PSU/PFI Bonds/Banks 7.96
Indian Railways Finance Corporation Ltd. ** 3.98 AAA
Infrastructure Development Finance company Ltd. ** 2.40 AAA
National Bank for Agricultural & Rural Development. ** 1.00 AAA
Power Finance Corporation Ltd. ** 0.58 AAA
Floating Rate Instruments 0.29
Indian Retail ABS Trust Series 50. 0.29 AAA(SO)
Cash & Current Assets 13.47
Total Net Asset 100.00
Issuer % to Net RatingAssets
Issuer % to Net RatingAssets
#iiiValue Research Ratingi
Birla Sun Life Short Term Fund - RetailDebt: Short-term (2 Schemes), 18 months & 3 4 Yrs ended 31-May-08
7-Star Gold Award by @
ICRABirla Sun Life Short Term Fund - Growth
Liquid Plus Schemes (2 Schemes), 1 year ended & 6 31-Dec-07
CRISIL~CPR 1^^Birla Sun Life Short Term Fund
Debt Short Term Scheme (18 Schemes), 1 Yrs ended 31-Mar-08
(Past performance is no guarantee of future results.) for ranking methodology please refer page 43
% R
etu
rns
Birla Sun Life Short Term Fund - Retail Plan - Growth CRISIL Short-Term Bond Fund Index
J u n e 2 0 0 8
CNBC TV-18 CRISIL AWARD 2007Birla Sun Life Short Term Fund
&&
Category: Income – Short Term Funds 1 yr performance ended 31 Dec, ‘07. Total Schemes in Category = 12
31
**Exit Load is NIL for units issued in Bonus & Dividend Reinvestment.
9.21
7.58
6.486.70
8.26
6.26
5.39
5.84
0
1
2
3
4
5
6
7
8
9
10
1 Year 3 Years 5 Years Since Inception
0.29%
7.96%
12.83%
13.47%
16.36%
49.09%
Floating Rate Instruments
PSU/PFI Bonds/Banks
Securitised Debt
Cash & Current Assets
Corporate Debt
Money Market Instruments
1.66%
13.47%
84.87%
AA
Cash & Current Assets
AAA

Birla Income Plus
As on May 31, 2008
Investment Performance
Past performance may or may not be sustained in future. Returns are in % and absolute returns for period less than 1 year & CAGR for period 1 year or more. When benchmark returns are not available, they have not been shown.
Portfolio
** Represents thinly traded/ non traded securities. Total Percentage of thinly/non traded securities is 32.57 %
An Open-ended income scheme with the objective to generate consistent income through superior yields on its investments at moderate levels of risk through a diversified investment approach.
Investment Objective
Fund Manager : Mr. Maneesh DangiDate of inception/takeover : October 21, 1995
NAV : Rs.
Growth : 34.8055
Dividend : 10.6243
Benchmark : CRISIL Composite
Bond Fund IndexAverage AUM : Rs. 967.62 Crores
Average Maturity : 2.82 Years
Investment Style Box
Asset Allocation
Rating Profile
PSU/PFI Bonds/Banks 25.62
Power Finance Corporation Ltd.** 13.90 AAA
Infrastructure Development Fin. Co. Ltd.** 4.32 AAA
Indian Railways Finance Corp. Ltd.** 3.48 AAA
Export-Import Bank of India** 1.33 AAA
Power Finance Corporation Ltd.** 1.24 AAA
State Bank of Indore** 0.72 AAA
LIC Housing Finance Ltd.** 0.59 AAA
Oriental Bank of Commerce** 0.05 AA+
Corporate Debt 6.95
Housing Development Finance Corp Ltd.** 5.61 AAA
Infrastructure Development Fin. Co. Ltd.** 1.13 AAA
IL&FS Investsmart Ltd.** 0.11 LAAA(SO)
Reliance Industries Ltd.** 0.08 AAA
Money Market Instruments 6.17
ABN Amro Bank 3.47 A1+
ICICI Bank Ltd. 2.70 A1+
Government Bond 5.98
Govt Bond 5.69% 2018 3.38 Sovereign
Govt Bond 8.35% 2022 1.17 Sovereign
Govt. Bond 7.47% 2012 1.01 Sovereign
Govt Bond 8.23% FCI SB 2027 0.41 Sovereign
Cash & Current Assets 55.28
Total Net Asset 100.00
Issuer % to Net RatingAssets
Issuer % to Net RatingAssets
Issuer % to Net RatingAssets
Load Structure (Incl. for SIP): w.e.f. 10/03/08
Entry Load : NIL
Exit Load** : £ Rs 1 Crore: 0.60% if redeemed /
switched out with in 180 days from
the date of allotment.
> Rs. 1 Crore: Nil
High Med LowInterest Rate
Sensivity
High
Mid
Low
Credit Quality
Birla Income Plus - Growth Crisil Composite Bond Fund Index
#iiValue Research Ratingii
Birla Income PlusDebt: Medium-term (52 Schemes), 3 yrs ended 31-May-08
(Past performance is no guarantee of future results.) for ranking methodology please refer page 43
% R
etu
rns
CRISIL~CPR 1^^Birla Income Plus
Income Scheme (20 Schemes), 1 Yrs ended 31-Mar-08
J u n e 2 0 0 8
@7-Star Gold Award by ICRA
Birla Income Plus - GrowthDebt: Long Term (18 Schemes), 1 year ended & 31-Dec-07
32
**Exit Load is NIL for units issued in Bonus & Dividend Reinvestment.
13.22
7.41
5.49
10.39
7.73
5.05
4.24
0
2
4
6
8
10
12
14
1 Year 3 Years 5 Years Since Inception
5.98%
6.17%
6.95%
25.62%
55.28%
Government Bond
Money Market Instruments
Corporate Debt
PSU/PFI Bonds/Banks
Cash & Current Assets
0.05%
5.98%
38.69%
55.28%
AA
Sovereign
AAA
Cash & Current Assets
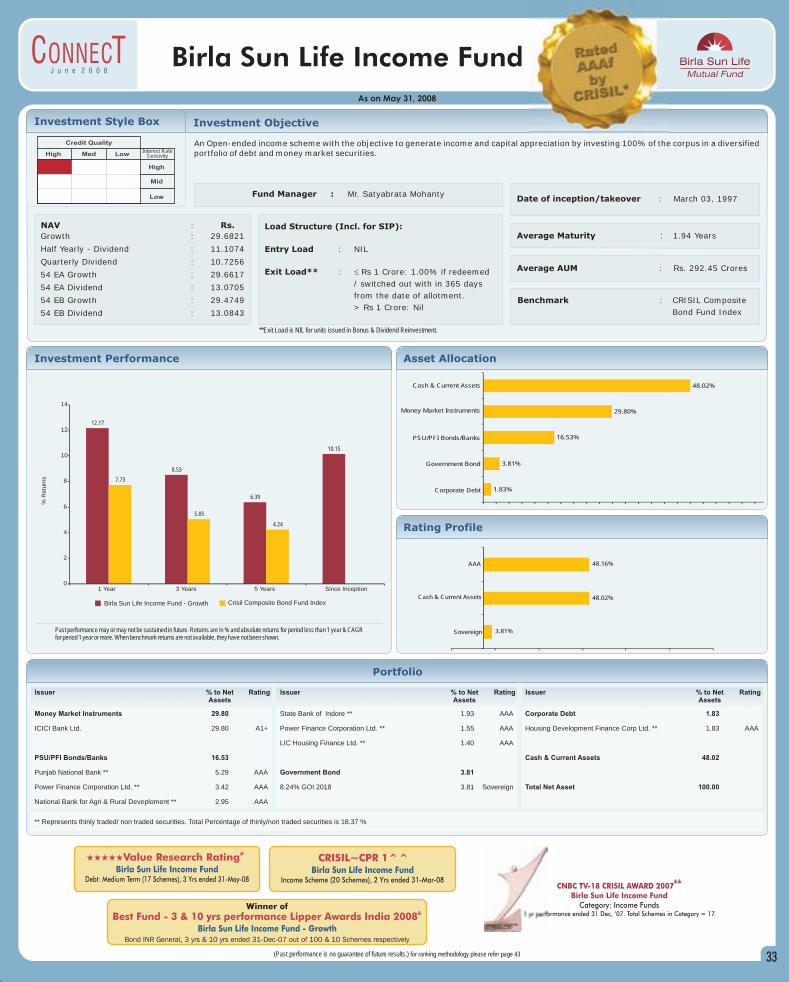
Birla Sun Life Income Fund
As on May 31, 2008
Investment Performance
Past performance may or may not be sustained in future. Returns are in % and absolute returns for period less than 1 year & CAGR for period 1 year or more. When benchmark returns are not available, they have not been shown.
Portfolio
** Represents thinly traded/ non traded securities. Total Percentage of thinly/non traded securities is 18.37 %
An Open-ended income scheme with the objective to generate income and capital appreciation by investing 100% of the corpus in a diversified portfolio of debt and money market securities.
Investment Objective
Fund Manager : Mr. Satyabrata MohantyDate of inception/takeover : March 03, 1997
NAV : Rs.
Growth : 29.6821
Half Yearly - Dividend : 11.1074
Quarterly Dividend : 10.7256
54 EA Growth : 29.6617
54 EA Dividend : 13.0705
54 EB Growth : 29.4749
54 EB Dividend : 13.0843
Average AUM : Rs. 292.45 Crores
Average Maturity : 1.94 Years
Investment Style Box
Asset Allocation
Rating Profile
Money Market Instruments 29.80
ICICI Bank Ltd. 29.80 A1+
PSU/PFI Bonds/Banks 16.53
Punjab National Bank ** 5.29 AAA
Power Finance Corporation Ltd. ** 3.42 AAA
National Bank for Agri & Rural Deveploment ** 2.95 AAA
State Bank of Indore ** 1.93 AAA
Power Finance Corporation Ltd. ** 1.55 AAA
LIC Housing Finance Ltd. ** 1.40 AAA
Government Bond 3.81
8.24% GOI 2018 3.81 Sovereign
Corporate Debt 1.83
Housing Development Finance Corp Ltd. ** 1.83 AAA
Cash & Current Assets 48.02
Total Net Asset 100.00
Issuer % to Net RatingAssets
Issuer % to Net RatingAssets
Issuer % to Net RatingAssets
Benchmark : CRISIL Composite
Bond Fund Index
Load Structure (Incl. for SIP):
Entry Load :
Exit Load** : £ Rs 1 Crore: 1.00% if redeemed
/ switched out with in 365 days
from the date of allotment.
> Rs 1 Crore: Nil
NIL
High Med LowInterest Rate
Sensivity
High
Mid
Low
Credit Quality
Birla Sun Life Income Fund - Growth Crisil Composite Bond Fund Index
CRISIL~CPR 1^^Birla Sun Life Income Fund
Income Scheme (20 Schemes), 2 Yrs ended 31-Mar-08
#iiiiValue Research Ratingi
Birla Sun Life Income FundDebt: Medium Term (17 Schemes), Yrs ended - -03 31 May 8
(Past performance is no guarantee of future results.) for ranking methodology please refer page 43
% R
etu
rns
J u n e 2 0 0 8
&Best Fund - 3 & 10 yrs performance Lipper Awards India 2008
Winner of
Bond INR General, 3 yrs & 10 yrs ended 31-Dec-07 out of 100 & 10 Schemes respectively
Birla Sun Life Income Fund - Growth
CNBC TV-18 CRISIL AWARD 2007Birla Sun Life Income Fund
&&
Category: Income Funds1 yr performance ended 31 Dec, ‘07. Total Schemes in Category = 17
33
**Exit Load is NIL for units issued in Bonus & Dividend Reinvestment.
12.17
8.53
6.39
10.15
7.73
5.05
4.24
0
2
4
6
8
10
12
14
1 Year 3 Years 5 Years Since Inception
1.83%
3.81%
16.53%
29.80%
48.02%
Corporate Debt
Government Bond
PSU/PFI Bonds/Banks
Money Market Instruments
Cash & Current Assets
3.81%
48.02%
48.16%
Sovereign
Cash & Current Assets
AAA

Birla Sun Life Cash Manager
As on May 31, 2008
Investment Performance
Past performance may or may not be sustained in future. Returns are in % and simple annualized for period less than 1 year & CAGR for period 1 year or more. When benchmark returns are not available, they have not been shown.
An Open-ended liquid scheme with the objective to provide current income which is consistent with a portfolio that offers investors superior liquidity by investing 100% in a diversified portfolio of debt (Fixed Income) and money market securities.
Investment Objective
Fund Manager : Mr. Maneesh Dangi & Mr. Satyabrata MohantyDate of inception/takeover : May 14, 1998
NAV : Rs.
Retail Growth : 20.1040
Daily Dividend : 10.0054
Institutional Premium Growth : 13.7006
Institutional Premium Weekly Dividend : 10.0094
Weekly Dividend : 10.0092
Load Structure
Entry Load :
Exit Load : NIL
NIL
Benchmark : Crisil Liquid Fund Index Average AUM : Rs. 261.26 Crores
Average Maturity : 0.07 Years
Investment Style Box
Asset Allocation
Rating Profile
Portfolio
Issuer % to Net RatingAssets
Issuer % to Net RatingAssets
Floating Rate Instruments 16.07
Kotak Mahindra Bank Ltd. 10.72 P1+
Kalpataru Ltd. 5.36
Cash & Current Assets 65.99
Total Net Asset 100.00
High Med LowInterest Rate
Sensivity
High
Mid
Low
Credit Quality
Birla Sun Life Cash Manager - Growth Crisil Liquid Fund Index
% R
etu
rns
Money Market Instruments 17.93
Reliance Capital 9.65 A1+
Unitech Ltd. 3.84 PR1+
Tata Sons Ltd. 3.23 A1+
UCO Bank 1.00 P1+
ICICI Bank Ltd. 0.21 A1+
(Past performance is no guarantee of future results.) for ranking methodology please refer page 43
J u n e 2 0 0 8
34
8.368.10 8.18
7.19
5.83
6.53
8.13
0
1
2
3
4
5
6
7
8
9
15 Days 1 Month 3 Months Since Inception
16.07%
17.93%
65.99%
Floating Rate Instruments
Money Market Instruments
Cash & Current Assets
5.36%
28.65%
65.99%
Unrated
AAA
Cash & Current Assets

As on May 31, 2008
Birla Floating Rate Fund
Portfolio - Short Term Plan
An Open-ended income scheme with the objective to generate regular income through investment in a portfolio comprising substantially of floating rate debt / money market instruments.
Investment Objective
Fund Manager : Mr. Satyabrata Mohanty Date of inception / takeover : June 05, 2003
NAV : Rs.Long Term:Growth : 13.6330Dividend : 10.4571Weekly Dividend : 10.0182Short Term:Growth : 13.4776Daily Dividend : 10.0040Weekly Dividend : 10.3772Institutional Plan-Growth : 10.8417Institutional Plan-Daily Dividend : 10.0111Institutional Plan-Weekly Dividend : 10.0102
BenchmarkLong Term : Crisil Liquid Fund IndexShort Term : Crisil Liquid Fund Index
Average AUMLong Term : Rs. 325.33 CroresShort Term : Rs. 127.27 Crores
Average MaturityLong Term : 0.12 YearsShort Term : 0.39 Years
Investment Style Box
Investment Performance - Long Term Plan
Past performance may or may not be sustained in future. Returns are in % and simple annualized for period less than 1 year & CAGR for period 1 year or more.
Investment Performance - Short Term Plan
Past performance may or may not be sustained in future. Returns are in % and simple annualized for period less than 1 year & CAGR for period 1 year or more.
Asset Allocation - Long Term Plan Rating Profile - Long Term Plan Asset Allocation - Short Term Plan Rating Profile - Short Term Plan
Portfolio - Long Term Plan
Money Market Instruments 68.15
ICICI Bank Ltd. 54.63 A1+
IDBI Bank Ltd. 5.15 A1+
Punjab National Bank 5.11 F1+
IDBI Bank Ltd. 1.64 P1+
DLF Ltd. 1.63 A1+
Floating Rate Instruments 11.63
Kotak Mahindra Bank Ltd. 3.52 P1+
Housing Development Finance Corp. Ltd. 3.52 AAA
Sundaram Finance Ltd. 2.82 LAA+
IDBI Bank Ltd. 1.76 AA+
Cash & Current Assets 20.22
Total Net Asset 100.00
Issuer % to Net RatingAssets
Issuer % to Net RatingAssets
Money Market Instruments 50.89
UCO Bank 18.13 P1+
ICICI Bank Ltd. 14.73 A1+
Karur Vysya Bank Ltd. 10.88 F1+
Indiabulls Financial Services Ltd. 7.14 P1+
Floating Rate Instruments 45.89
Housing Development Finance Corp Ltd. 13.22 AAA
LIC Housing Finance Ltd. 11.67 AAA
Citicorp Finance India Ltd. 11.67 AAA
IDBI Bank Ltd. 3.89 AA+
CitiFinancial Consumer Finance India Ltd 3.89 AAA
ICICI Bank Ltd. 1.56 AAA
Cash & Current Assets 3.21
Total Net Asset 100.00
Load Structure :
Long Term (Incl. for SIP)
Entry Load : Nil
Exit Load** : For any redemption / switch out of
units within 7 days from the date
of allotment :- 0.10%
Short Term
Entry Load : NIL
Exit Load : NIL
High Med LowInterest Rate
Sensivity
High
Mid
Low
Credit Quality
+The grading has been assigned by ICRA and indicates highest quality. The investment quality is similar to that of fixed income obligations of highest safety and with maturity corresponding upto 1 year. This grading should however, not be construed as an indication of the performance of the Mutual Fund scheme or of volatility in its returns.
Birla Floating Rate Fund - STP - Growth Crisil Liquid Fund IndexBirla Floating Rate Fund - LTP - Growth Crisil Liquid Fund Index
% R
etu
rns
% R
etu
rns
#iiiiValue Research Rating
Birla Floating Rate Fund - Long TermDebt: Term ( Schemes), Yrs ended - -Floating - Long 12 3 31 May 08
(Past performance is no guarantee of future results.) for ranking methodology please refer page 43
J u n e 2 0 0 8
35
**Exit Load is NIL for units issued in Bonus & Dividend Reinvestment.
8.74
7.22
6.406.83
6.43
5.53
0
1
2
3
4
5
6
7
8
9
10
1 Year 3 Years Since Inception
8.70 8.53 8.31
6.165.83
6.53
8.13
5.53
0
1
2
3
4
5
6
7
8
9
10
15 Days 1 Month 3 Months Since Inception
3.21%
3.89%
92.90%
Cash & Current Assets
AA
AAA
3.21%
45.89%
50.89%
Cash & Current Assets
Floating Rate Instruments
Money Market Instruments
11.63%
20.22%
68.15%
Floating Rate Instruments
Cash & Current Assets
Money Market Instruments
4.58%
20.22%
75.20%
AA
Cash & Current Assets
AAA

Birla Gilt Plus
As on May 31, 2008
An Open-ended government securities scheme with the objective to generate income and capital appreciation through investments exclusively in Government Securities.
Investment Objective
Fund Manager : Mr. Maneesh Dangi & Mr. Satyabrata Mohanty
Date of inception / takeover : October 12, 1999NAV : Rs.Liquid PlanGrowth : 19.5725Quarterly Dividend : 10.6231Annual Dividend Option : 10.1014PF PlanGrowth : 22.1893Quarterly Dividend : 10.3351Annual Dividend Option : 19.2533Regular PlanGrowth : 26.0662Quarterly Dividend : 11.2560Annual Dividend Option : 22.1407
Load Structure (Incl. for SIP):Liquid Plan, Regular Plan & PF Plan-Quarterly / Annual Dividend:Entry Load : NILExit Load : NILPF Plan - Growth:Entry Load : NILExit Load** : 1.00% if redeemed / switched out
within 365 days from date of allotment.
Average AUMLiquid Plan : Rs. 12.99 CroresPF Plan : Rs. 99.80 CroresRegular Plan : Rs. 118.83 Crores
Average MaturityLiquid Plan : 0.01 YearsPF Plan : 3.63 YearsRegular Plan : 0.25 Years
Investment Style Box
Asset Allocation - PF Plan Asset Allocation - Regular PlanAsset Allocation - Liquid Plan
Investment Performance - Liquid Plan
Past performance may or may not be sustained in future. Returns are in % and absolute returns for period less than 1 year & CAGR for period 1 year or more. When benchmark returns are not available, they have not been shown.
Investment Performance - PF Plan
Past performance may or may not be sustained in future. Returns are in % and absolute returns for period less than 1 year & CAGR for period 1 year or more. When benchmark returns are not available, they have not been shown.
Investment Performance - Regular Plan
Past performance may or may not be sustained in future. Returns are in % and absolute returns for period less than 1 year & CAGR for period 1 year or more. When benchmark returns are not available, they have not been shown.
Portfolio - Liquid Plan Portfolio - PF Plan Portfolio - Regular Plan
Treasury Bills 80.34
364 DayT Bill 06 JUNE 2008 80.34 Sovereign
Cash & Current Assets 19.66
Total Net Asset 100.00
Issuer % to Net RatingAssets
Issuer % to Net RatingAssets
Treasury Bills 18.77364 DayT Bill 06 JUNE 2008 18.77 Sovereign
Government Bond 4.54Govt Bond 7.27% 2013 4.54 Sovereign
Cash & Current Assets 76.69
Total Net Asset 100.00
Issuer % to Net RatingAssets
BenchmarkLiquid Plan : I-Sec Si-BEXPF Plan : I-Sec Li-BEXRegular Plan : I-Sec Li-BEX
High Med LowInterest Rate
Sensivity
High
Mid
Low
Credit Quality
#iiiValue Research Ratingi
Birla Gilt Plus - Liquid PlanGilt: Short-term (1 Schemes), 18 months & 3 7 Yrs ended 31-May-08
CRISIL~CPR 1^^Birla Gilt Plus - Regular Plan
Gilt Scheme (14 Schemes), 2 Yrs ended 31-Mar-08
#iiiiValue Research Ratingi
Birla Gilt Plus - Regular PlanGilt: Medium & Long-term ( Schemes), 18 months & 3 42 Yrs ended 31-May-08
Birla Gilt Plus Liquid Plan - Growth I-Sec Si-BEX Birla Gilt Plus PF Plan - Growth I-Sec Li-BEX Birla Gilt Plus Regular Plan - Growth I-Sec Li-BEX
(Past performance is no guarantee of future results.) for ranking methodology please refer page 43
% R
etu
rns
% R
etu
rns
% R
etu
rns
Government Bond 26.308.24% GOI 2018 10.70 SovereignGovt Bond 8.35% 2022 5.29 SovereignGovt Bond 8.33% CGL 2036 5.23 SovereignGovt Bond 7.38% 2015 5.08 Sovereign
Cash & Current Assets 73.70
Total Net Asset 100.00
J u n e 2 0 0 8
&Best Fund - 5 yrs Performance Lipper Awards India 2008
Winner of
Bond INR General (35 Schemes) 5 yrs ended 31-Dec-07
Birla Gilt Plus - Regular - Growth
36
**Exit Load is NIL for units issued in Bonus & Dividend Reinvestment.
10.06
7.36
5.75
11.73
6.826.08
4.94
0
2
4
6
8
10
12
14
1 Year 3 Years 5 Years Since Inception
6.44
5.24
4.35
9.66
6.82
6.08
4.94
0
2
4
6
8
10
12
1 Year 3 Years 5 Years Since Inception
6.376.00
5.48
8.088.05
6.74
5.87
0
1
2
3
4
5
6
7
8
9
1 Year 3 Years 5 Years Since Inception
19.66%
80.34%
Cash & Current Assets
Treasury Bills
26.30%
73.70%
Government Bond
Cash & Current Assets
4.54%
18.77%
76.69%
Government Bond
Treasury Bills
Cash & Current Assets

Birla Sun Life Government Securities Fund
As on May 31, 2008
Portfolio - Short Term PlanPortfolio - Long Term Plan
An Open-ended Gilt scheme with the objective to provide investors current income consistent with a portfolio invested 100% in securities issued by the Government of India or the State Governments, and the secondary objective is capital appreciation.
Investment Objective
Fund Manager : Mr. Maneesh Dangi
Date of inception / takeover : October 28, 1999NAV : Rs.
Long Term Plan
Growth : 19.9174
Dividend : 9.7768
Short Term Plan
Growth : 16.7017
Dividend : 10.1052
Load Structure (Incl. for SIP):
Entry Load :
Exit Load : NIL
NIL
Benchmark
Long Term Plan : I-Sec Li-BEX
Short Term Plan : I-Sec Si-BEX
Average AUMLong Term Plan : Rs. 1.33 CroresShort Term Plan : Rs. 0.27 Crores
Average MaturityLong Term Plan : 0.01 YearsShort Term Plan : 0.01 Years
Long Term - Investment Style Box
Long Term Plan - Investment Performance
Past performance may or may not be sustained in future. Returns are in % and absolute returns for period less than 1 year & CAGR for period 1 year or more. When benchmark returns are not available, they have not been shown.
Asset Allocation - Long Term Plan
Short Term Plan - Investment Performance
Past performance may or may not be sustained in future. Returns are in % and absolute returns for period less than 1 year & CAGR for period 1 year or more. When benchmark returns are not available, they have not been shown.
Asset Allocation - Short Term Plan
Cash & Current Assets 100.00
Total Net Asset 100.00
Issuer % to Net RatingAssets
Issuer % to Net RatingAssets
High Med LowInterest Rate
Sensivity
High
Mid
Low
Short Term - Investment Style Box
High Med LowInterest Rate
Sensivity
High
Mid
Low
Credit Quality Credit Quality
Birla SunLife G Sec Fund - LT - Growth I-Sec Li-BEX Birla SunLife G Sec Fund - STD - Growth I-Sec Si-BEX
% R
etu
rns
% R
etu
rns
100.00%Cash & Current Assets
J u n e 2 0 0 8
37
**Exit Load is NIL for units issued in Bonus & Dividend Reinvestment.
Cash & Current Assets 100.00
Total Net Asset 100.00
100.00%Cash & Current Assets
-0.72
2.652.90
8.34
6.82
6.08
4.94
-1
0
1
2
3
4
5
6
7
8
9
1 Year 3 Years 5 Years Since Inception
3.52
4.79
3.63
6.15
8.05
6.74
5.87
0
1
2
3
4
5
6
7
8
9
1 Year 3 Years 5 Years Since Inception

Birla Dynamic Bond Fund
As on May 31, 2008
An Open-ended income scheme with the objective to generate optimal returns with high liquidity through active management of the portfolio by investing in high quality debt and money market instruments.
Investment Objective
Date of inception / takeover : September 27, 2004
NAV : Rs.
Retail Growth : 12.8849
Retail Quarterly Dividend : 10.5319
Load Structure (Incl. for SIP):
Entry Load :Exit Load** : Redeemed/switched out
within 30 days - 0.20%
NIL
Benchmark : CRISIL Composite Bond Fund Index
Average AUM : Rs. 70.25 Crores
Average Maturity : 0.66 Years
Investment Style Box
Investment PerformancePortfolio
Money Market Instruments 86.13
UCO Bank 80.47 P1+
ICICI Bank Ltd. 5.67 A1+
Cash & Current Assets 13.87
Total Net Asset 100.00
Issuer % to Net RatingAssets
Past performance may or may not be sustained in future. Returns are in % and absolute returns for period less than 1 year & CAGR for period 1 year or more.
Fund Manager : Mr. Maneesh Dangi
High Med LowInterest Rate
Sensivity
High
Mid
Low
Credit Quality
Asset Allocation
Rating Profile
As on May 31, 2008
Birla Bond Index Fund
An Open-ended income scheme with the objective of tracking the CRISIL Composite Bond Fund Index which has been introduced by CRISIL to track the returns on a composite portfolio that includes call instruments, commercial papers, government securities, AAA & AA rated instruments.
Investment Objective
Fund Manager : Mr. Satyabrata Mohanty Date of inception / takeover : May 9, 2003
NAV : Rs.
Growth : 12.4832
Dividend : 10.1253
Load Structure (Incl. for SIP):Entry Load :Exit Load** : £ Rs 10 lakhs: 0.25% if redeemed
/ switched out with in 90 days from the date of allotment.> 10 Lakhs: Nil
NIL
Benchmark : CRISIL Composite Bond Fund Index
Average Aum : Rs. 0.35 Crores
Average Maturity : 0.61 Years
Investment Style Box
Investment Performance Asset Allocation
Rating Profile
Portfolio
PSU/PFI Bonds/Banks 27.63
Power Finance Corporation Ltd.** 27.63 AAA
Government Bond 5.77
Govt Bond 9.39% 2011 5.77 Sovereign
Cash & Current Assets 66.60
Total Net Asset 100.00
Issuer % to Net RatingAssets
Past performance may or may not be sustained in future. Returns are in % and absolute returns for period less than 1 year & CAGR for period 1 year or more.
High Med LowInterest Rate
Sensivity
High
Mid
Low
Credit Quality
Birla Bond Index Fund - Growth Crisil Composite Bond Fund Index
Birla Dynamic Bond Fund - Retail - Growth
Crisil Composite Bond Fund Index
% R
etu
rns
% R
etu
rns
#iiValue Research Ratingiii
Birla Dynamic Bond Fund - RetailDebt: Medium Term (52 Schemes), 18 months 3 Yrs ended -0 & 31-May 8
(Past performance is no guarantee of future results.) for ranking methodology please refer page 43
J u n e 2 0 0 8
J u n e 2 0 0 8
38
**Exit Load is NIL for units issued in Bonus & Dividend Reinvestment.
**Exit Load is NIL for units issued in Bonus & Dividend Reinvestment.
** Represents thinly traded/ non traded securities and illiquid securities.Total Percentage of thinly/non traded securities is 27.63%
10.70
7.617.14
7.73
5.05 4.80
0
2
4
6
8
10
12
1 Year 3 Years Since Inception
6.05
5.24
4.47
7.73
5.05
4.41
0
1
2
3
4
5
6
7
8
9
1 Year 3 Years Since Inception
13.87%
86.13%
Cash & Current Assets
Money Market Instruments
13.87%
86.13%
Cash & Current Assets
AAA
5.77%
27.63%
66.60%
Sovereign
AAA
Cash & Current Assets
5.77%
27.63%
66.60%
Government Bond
PSU/PFI Bonds/Banks
Cash & Current Assets

India Advantage Fund Ltd.(For Non-Resident Indians and Eligible Foreign Nationals)
As on May 31, 2008
Returns are in % and absolute returns for period less than 1 year & CAGR for period 1 year or more.The returns for BSE Sensex are in Indian Rupees while the returns for IAF & MSCI (India) are in US Dollars.
Portfolio
Investment via sub-fund, India Advantage (Offshore) Fund, are stated at market/fair value at the date of determination. Securities listed on a recognised stock exchange are valued at the last quoted closing price on the principal exchange on which the security istraded Non-traded securities are valued at amortised cost and/or fair value as determined in good faith by Birla Sun Life Asset Management Company Limited, India, Conversion Rate: 1 USD = INR 42.59
Asset Allocation
An Open-ended growth scheme with the objective of long-term appreciation through investment primarily in equity related securities of companies in India that are run by efficient management, have a sustainable and robust business model and are available at reasonablevaluations.
Investment Objective
Fund Manager : Mr. Ajay Argal Date of inception / takeover : August 8, 1996
NAV $ per Class C Share : 192.42 Benchmark : BSE Sensex and MSCI (India)
Bloomberg Ticker Code : INDADVC MPAUM : USD 147.81 MillionConversion Rate 1 USD : INR 42.59
Investment Style Box
Investment Performance CAGR Returns (%)
EQUITY INVESTMENTS :
Reliance Industries Ltd Petroleum Products 9.46
Bharti Airtel Ltd Telecom-Services 5.47
Infosys Technologies Ltd Software 4.46
ONGC Ltd Oil & Gas 3.87
BHEL Ltd Industrial Capital Goods 3.80
ITC Ltd Consumer Non Durables 3.58
ICICI Bank Ltd Banks & Financial 3.44
Reliance Communications Ltd Telecom-Services 3.39
HDFC Ltd Banks & Financial 3.26
Tata Iron & Steel Ltd Ferrous Metals 2.64
Great Eastern Shipping Company Ltd Transportation 2.37
CESC Ltd Power 2.21
Great Offshore Ltd Oil & Gas 2.09
Bank Of India Ltd Banks & Financial 2.08
GAIL Ltd Oil & Gas 2.08
Oriental Bank of Commerce Ltd Banks & Financial 1.95
Bharti Shipyard Ltd Industrial Capital Goods 1.68
Sintex Industries Ltd Industrial Capital Goods 1.66
Sun Pharmaceuticals Ltd Pharmaceuticals 1.66
Axis Bank Ltd Banks & Financial 1.65
United Phosphorus Ltd Pesticides 1.62
Bharat Electronics Ltd Industrial Capital Goods 1.62
Welspun Gujarat Stalon Ltd Ferrous Metals 1.55
Gujarat NRE Coke Ltd Mining 1.50
Hero Honda Ltd Auto 1.50
DLF Ltd Construction 1.47
Larsen & Toubro Ltd Construction 1.45
Balaji Telefilms Ltd Media & Entertainment 1.44
Name of the Security Sector Percentageof Portfolio
Name of the Security Sector Percentageof Portfolio
United Spirits Ltd Consumer Non Durables 1.37
Nagarjuna Construction Company Ltd Construction 1.32
State Bank Of India Ltd Banks & Financial 1.28
TCS Ltd Software 1.23
IVRCL Infrastructure Ltd Construction 1.19
Maharashtra Seamless Ltd Ferrous Metals 1.18
Balrampur Chini Ltd Consumer Non Durables 1.12
Sesa Goa Ltd Ferrous Metals 1.09
AIA Engineering Ltd Industrial Capital Goods 1.09
Zee Entertainment Ltd Media & Entertainment 1.08
Hindustan Unilever Ltd Consumer Non Durables 1.03
Engineers(India) Ltd Industrial Capital Goods 1.03
Thermax Ltd Industrial Capital Goods 0.91
Bajaj Auto Ltd Auto 0.85
Maruti Suzuki (I) Ltd Auto 0.61
Subex Ltd Software 0.58
CALL & CALL EQUIVALENTS :
CBLO 5.63
8.00% ICICI Bank FD 0.89
Mutual Fund Units 0.00
Non-Convertible Corporate Debt
Trent Ltd. 0.13
Cash 1.43
TOTAL 98.57
Value Blend Growth Size
Large
Mid
Small
Investment Style
India Advantage Fund BSE Sensex MSCI (India)
% R
etu
rns
Morningstar Rating™
iiii
J u n e 2 0 0 8
Ranked 11th among Top Performing Equity &Funds in the world by Lipper
India Advantage FundEquity Funds (6302 funds), 10 yrs ended 31 Dec 07
“Channel Islands Stock Exchange (CISX)”
Also listed on
39(Past performance is no guarantee of future results.) for ranking methodology please refer page 43
@@
26.88
45.11
28.48 28.55
34.71
38.82
16.1014.54
35.72
40.56
13.9
17.2
0
5
10
15
20
25
30
35
40
45
50
3 Year 5 Year 10 Year Since Inception
0.13
0.89
1.51
1.62
1.66
2.22
2.37
2.52
2.96
5.43
5.63
6.27
6.46
7.1
8.04
8.86
9.46
11.79
13.67
Non-Convertible Debt
Fixed Deposits
Mining
Pesticides
Pharmaceuticals
Power
Transportation
Media & Entertainment
Auto
Construction
Money Market Instruments
Software
Ferrous Metals
Consumer Non Durables
Oil & Gas
Telecom-Services
Petroleum Products
Industrial Capital Goods
Banks & Financial

Dividend History(For select Schemes)J u n e 2 0 0 8
# EQUITY SCHEMES Declared Dividend Dividend Face value Cum Dividend NAV on date (%) (Rs. per unit) (Rs.) (Rs. per unit)
EQUITY SCHEMES
Birla Advantage Fund 22-Mar-00 80 8.00 10.00 70.3728-Nov-03 30 3.00 10.00 44.8823-Jan-04 20 2.00 10.00 47.3312-Mar-04 25 2.50 10.00 46.1023-Mar-05 50 5.00 10.00 54.2516-Dec-05 50 5.00 10.00 65.8925-Apr-08 50 5.00 10.00 100.44
325 32.5
Birla Dividend Yield Plus 30-May-03 8 0.80 10.00 11.8413-Jun-03 5 0.50 10.00 10.8824-Jul-03 12 1.20 10.00 11.6219-Sept-03 18 1.80 10.00 12.0931-Oct-03 10 1.00 10.00 11.8726-Dec-03 15 1.50 10.00 13.9313-Feb-04 10 1.00 10.00 12.5828-Sep-04 8 0.80 10.00 11.5724-Dec-04 14 1.40 10.00 13.7511-Mar-05 10 1.00 10.00 12.851-July-05 8 0.80 10.00 11.2628-Oct-05 8 0.80 10.00 11.9413-Jan-06 16 1.60 10.00 11.8927-April-06 10 1.00 10.00 13.0710-Oct-06 8 0.80 10.00 11.6730-April-07 8 0.80 10.00 11.201-Nov-07 10 1.00 10.00 12.77
178 17.80
Birla Equity Plan 15-Feb-02 10 1.00 10.00 12.4517-Oct-03 15 1.50 10.00 24.8926-Mar-04 15 1.50 10.00 26.9021-Oct-05 40 4.00 10.00 42.1016-Dec-05 40 4.00 10.00 46.5017-Feb-06 40 4.00 10.00 44.5428-Mar-08 60 6.00 10.00 64.23
245 24.50
Birla Index Fund 17-Oct-03 56 5.60 10.00 16.1903-Feb-04 16.5 1.65 10.00 11.9923-Mar-07 65 6.50 10.00 21.83
137.5 13.75
Birla India GenNext Fund 25-Apr-08 10 1.00 10.00 16.14
Birla India Opportunities Fund 04-Feb-00 25 2.50 10.00 28.9714-Jan-03 10 1.00 10.00 12.1627-Feb-04 60 6.00 10.00 18.6926-Oct-04 12.5 1.25 10.00 14.1716-Sep-05 40 4.00 10.00 14.90
147.5 14.75
Birla Midcap Fund 24-Jan-03 5 0.50 10.00 10.5219-Jun-03 10 1.00 10.00 11.8322-Jul-03 10 1.00 10.00 11.8124-Dec-03 60 6.00 10.00 18.358-Oct-04 12.5 1.25 10.00 13.7228-Jan-05 10 1.00 10.00 14.753-Feb-06 20 2.00 10.00 22.5922-Dec-06 35 3.50 10.00 25.9428-Dec-07 60 6.00 10.00 40.50
222.5 22.25
Birla MNC Fund 5-Feb-00 25 2.50 10.00 0.0022-Feb-02 40 4.00 10.00 27.1629-Aug-03 50 5.00 10.00 30.5818-Jan-05 50 5.00 10.00 42.8026-Aug-05 75 7.50 10.00 41.05
240 24.00
Birla Sun Life Basic Industries Fund 31-Mar-04 25 2.50 10.00 25.7007-Oct-04 20 2.00 10.00 25.0224-Mar-06 100 10.00 10.00 35.0819-Jan-07 105 10.50 10.00 39.60 25-Apr-08 20 2.00 10.00 36.36
295 29.50
Birla Sun Life Buy India Fund 28-Mar-06 75 7.50 10.00 17.54
Birla Sun Life Equity Fund 30-Sept-99 30 3.00 10.00 25.8628-Mar-00 50 5.00 10.00 51.0829-Sept-00 25 2.50 10.00 28.6520-Mar-01 10 1.00 10.00 18.9728-Sept-01 10 1.00 10.00 12.7920-Mar-02 10 1.00 10.00 17.1321-Oct-02 5 0.50 10.00 14.0724-Mar-03 5 0.50 10.00 14.3730-Sept-03 10 1.00 10.00 22.9608-Mar-04 30 3.00 10.00 30.9120-Oct-04 10 1.00 10.00 30.0210-Feb-06 50 5.00 10.00 58.9423-Mar-07 100 10.00 10.00 74.4531-Aug-07 100 10.00 10.00 79.98
445 44.50
Birla Sun Life Frontline Equity Fund 29-Aug-03 10 1.00 10.00 14.4531-Mar-04 20 2.00 10.00 18.4814-Oct-04 10 1.00 10.00 16.8027-Feb-06 80 8.00 10.00 28.8828-Aug-06 60 6.00 10.00 23.5629-Jun-07 40 4.00 10.00 23.86
210 21.00
Birla Sun Life New Millennium Fund 27-Jan-06 20 2.00 10.00 11.67
Birla Sun Life Tax Relief ‘96 10-Mar-04 100 10.00 10.00 125.3727-Apr-06 500 50.00 10.00 224.518-Dec-06 250 25.00 10.00 193.9419-Jan-07 260 26.00 10.00 176.5416-Mar-07 500 50.00 10.00 134.27 25-Mar-08 200 20.00 10.00 106.74
2110 211.00
Birla Top 100 Fund 30-May-08 15 1.50 10.00 15.894
Total dividend declared
since inception (Feb 24, 1995) = 325%
Total dividend declared
since inception (Feb 16, 1999) = 245%
Total dividend declared
since inception (Aug 27, 1998) = 445%
Total dividend declared
since inception (Dec 27, 1999) = 147.50%
Total dividend declared
since inception (Dec 27, 1999) = 240%
Total dividend declared
since inception (Oct 3, 2002) = 222.50%
Total dividend declared
since inception (Feb 26, 2003) = 178%
Total dividend declared since inception (Sept 18, 2002) = 137.5%
Total dividend declared
since inception (Aug 30, 2002) = 210%
Total dividend declared
since inception (Jan 15, 2000) = 295%
Total dividend declared
since inception (Mar 29, 1996) = 2110%
After payment of dividend, NAV will fall to the extent of the payout and statutory levy, if any. Past performance is no guarantee of future results.40

Dividend History(For select Schemes)J u n e 2 0 0 8
HYBRID & MONTHLY INCOME SCHEMES
# DEBT SCHEMES Date Face Value Dividend Dividend Cum Dividend NAV (%) (Rs. per unit) (%) (Rs. per unit) (Rs. per unit)
#Dividend Dividend
Non Corporate Corporate
Birla Balance 17-Oct-03 10.00 15 1.50 - - 13.3220-Jan-06 10.00 50 5.00 - - 15.13
65 6.50
Birla MIP (Monthly Dividend Plan) 25-May-07 10.00 0.551 0.0551 0.513 0.0513 11.027629-Jun-07 10.00 0.672 0.0672 0.625 0.0625 10.221827-July-07 10.00 1.120 0.1120 1.043 0.1043 11.540331-Aug-07 10.00 0.958 0.0958 0.892 0.0892 11.406328-Sep-07 10.00 0.114 0.0114 0.106 0.0106 11.583326-Oct-07 10.00 0.120 0.0120 0.111 0.0111 11.684430-Nov-07 10.00 0.146 0.0146 0.135 0.0135 11.552628-Dec-07 10.00 1.147 0.1147 1.068 0.1068 11.6693 25-Jan-08 10.00 0.120 0.0120 0.112 0.0112 11.3399 29-Feb-08 10.00 0.085 0.0085 0.079 0.0079 10.9853 28-Mar-08 10.00 0.068 0.0068 0.064 0.0064 10.6837 25-Apr-08 10.00 0.064 0.0064 0.060 0.0060 10.6054
30-May-08 10.00 0.080 0.0080 0.074 0.0074 10.4906
Birla MIP II - Savings 5 Plan 25-May-07 10.00 0.458 0.0458 0.426 0.0426 10.1252(Monthly Dividend Plan) 26-Jun-07 10.00 0.777 0.0777 0.723 0.0723 10.1314
27-July-07 10.00 0.885 0.0885 0.823 0.0823 10.232031-Aug-07 10.00 0.852 0.0852 0.793 0.0793 10.216326-Sep-07 10.00 0.065 0.0065 0.060 0.0060 10.192626-Oct-07 10.00 0.077 0.0077 0.072 0.0072 10.199130-Nov-07 10.00 0.087 0.0087 0.081 0.0081 10.199328-Dec-07 10.00 0.696 0.0696 0.648 0.0648 10.1729 25-Jan-08 10.00 0.064 0.0064 0.060 0.0060 10.1664 29-Feb-08 10.00 0.062 0.0062 0.058 0.0058 10.1916 27-Mar-08 10.00 0.052 0.0052 0.048 0.0048 10.1802 25-Apr-08 10.00 0.053 0.0053 0.049 0.0049 10.1977
30-May-08 10.00 0.084 0.0084 0.078 0.0078 10.2327
Birla MIP II - Wealth 25 Plan 25-May-07 10.00 0.629 0.0629 0.585 0.0585 11.0915(Monthly Dividend Plan) 29-Jun-07 10.00 0.756 0.0756 0.704 0.0704 11.2535
27-July-07 10.00 1.126 0.1126 1.048 0.1048 11.565831-Aug-07 10.00 0.962 0.0962 0.895 0.0895 11.349328-Sep-07 10.00 0.113 0.0113 0.105 0.0105 11.554326-Oct-07 10.00 0.119 0.0119 0.111 0.0111 11.624130-Nov-07 10.00 0.145 0.0145 0.135 0.0135 11.525528-Dec-07 10.00 1.145 0.1145 1.066 0.1066 11.7620 25-Jan-08 10.00 0.121 0.0121 0.113 0.0113 11.2126 29-Feb-08 10.00 0.084 0.0084 0.078 0.0078 10.7279 28-Mar-08 10.00 0.067 0.0067 0.062 0.0062 10.3049 25-Apr-08 10.00 0.062 0.0062 0.058 0.0058 10.3476
30-May-08 10.00 0.078 0.0078 0.072 0.0072 10.2064
Birla Sun Life '95 Fund 30-Jun-99 10.00 20 2.00 - - 26.7828-Mar-00 10.00 50 5.00 - - 64.4413-Oct-00 10.00 30 3.00 - - 39.8509-Mar-01 10.00 20 2.00 - - 33.5015-Oct-01 10.00 20 2.00 - - 25.7026-Mar-02 10.00 20 2.00 - - 29.9930-Oct-02 10.00 10 1.00 - - 26.0128-Mar-03 10.00 10 1.00 - - 27.0010-Oct-03 10.00 10 1.00 - - 38.5922-Mar-04 10.00 30 3.00 - - 42.3125-Oct-04 10.00 20 2.00 - - 43.0210-Mar-06 10.00 25 2.50 - - 68.53 30-May-08 10.00 50 5.00 - - 97.61
325 32.50
Birla Sun Life Monthly Income - 31-May-07 10.00 0.673 0.0673 0.626 0.0626 10.8253Monthly Dividend 29-Jun-07 10.00 0.622 0.0622 0.579 0.0579 10.8480
31-July-07 10.00 1.152 0.1152 1.072 0.1072 11.156231-Aug-07 10.00 0.744 0.0744 0.692 0.0692 11.017728-Sep-07 10.00 0.135 0.0135 0.125 0.0125 11.182031-Oct-07 10.00 0.163 0.0163 0.152 0.0152 11.265730-Nov-07 10.00 0.140 0.0140 0.130 0.0130 11.099531-Dec-07 10.00 1.221 0.1221 1.136 0.1136 11.3372 31-Jan-08 10.00 0.075 0.0075 0.070 0.0070 10.8881 29-Feb-08 10.00 0.068 0.0068 0.063 0.0063 10.7070 31-Mar-08 10.00 0.071 0.0071 0.066 0.0066 10.3796 30-Apr-08 10.00 0.067 0.0067 0.062 0.0062 10.4731
30-May-08 10.00 0.079 0.0079 0.073 0.0073 10.3396
Birla Sun Life Monthly Income - 29-Dec-06 10.00 1.686 0.1686 1.571 0.1571 11.1776Quarterly Dividend 30-Mar-07 10.00 1.710 0.1710 1.593 0.1593 11.1777
29-Jun-07 10.00 0.622 0.0622 0.579 0.0579 10.848002-July-07 10.00 2.375 0.2375 2.210 0.2210 11.537828-Sep-07 10.00 0.286 0.0286 0.266 0.0266 11.831031-Dec-07 10.00 2.856 0.2856 2.658 0.2658 12.2011 31-Mar-08 10.00 0.259 0.0259 0.241 0.0241 11.1765
After payment of dividend, NAV will fall to the extent of the payout and statutory levy, if any. Past performance is no guarantee of future results.
Total dividend declared
since inception (Feb 10, 1995) = 325%
Total dividend declared since inception (Oct 12, 1999) = 65%
41

Dividend History(For select Schemes)J u n e 2 0 0 8
DEBT SCHEMES
Birla Bond Index Fund 15-Sep-06 10.00 1.093 0.1093 1.018 0.1018 10.374115-Dec-06 10.00 1.552 0.1552 1.446 0.1446 10.212015-Mar-07 10.00 1.546 0.1546 1.440 0.1440 10.285915-Jun-07 10.00 1.656 0.1656 1.541 0.1541 10.270617-Sep-07 10.00 0.171 0.0171 0.159 0.0159 10.247917-Dec-07 10.00 1.875 0.1875 1.745 0.1745 10.2193 17-Mar-08 10.00 0.116 0.0116 0.108 0.0108 10.1370
Birla Dynamic Bond Fund - Retail - 28-Sep-07 10.00 0.205 0.0205 0.191 0.0191 10.4452Quarterly Dividend 31-Dec-07 10.00 2.073 0.2073 1.930 0.1930 10.5212
04-Feb-08 10.00 0.042 0.0042 0.039 0.0039 10.4390 29-Apr-08 10.00 0.090 0.0090 0.083 0.0083 10.6277
28-May-08 10.00 0.063 0.0063 0.059 0.0059 10.5977
Birla Gilt Plus - Liquid Plan - 15-Dec-06 10.00 1.719 0.1719 1.601 0.1601 10.8382(Quarterly Dividend) 15-Sep-06 10.00 1.082 0.1082 1.008 0.1008 10.7193
15-Mar-07 10.00 1.725 0.1725 1.607 0.1607 10.793815-Jun-07 10.00 1.736 0.1736 1.616 0.1616 10.551117-Sep-07 10.00 0.180 0.0180 0.168 0.0168 10.703217-Dec-07 10.00 1.602 0.1602 1.491 0.1491 10.6626 17-Mar-08 10.00 0.160 0.0160 0.149 0.0149 10.6857
Birla Gilt Plus - PF Plan 15-Dec-06 10.00 1.590 0.1590 1.481 0.1481 10.8360(Quarterly Dividend) 15-Sep-06 10.00 1.228 0.1228 1.143 0.1143 10.6422
15-Mar-07 10.00 1.614 0.1614 1.503 0.1503 10.585315-Jun-07 10.00 1.677 0.1677 1.561 0.1561 10.305917-Sep-07 10.00 0.186 0.0186 0.173 0.0173 10.593017-Dec-07 10.00 1.817 0.1817 1.691 0.1691 10.6516 17-Mar-08 10.00 0.205 0.0205 0.191 0.0191 10.7912
Birla Gilt Plus - Regular Plan 15-Dec-06 10.00 1.886 0.1886 1.756 0.1756 11.1872(Quarterly Dividend) 15-Sep-06 10.00 1.377 0.1377 1.282 0.1282 11.0538
15-Mar-07 10.00 1.693 0.1693 1.576 0.1576 11.167915-Jun-07 10.00 1.990 0.1990 1.852 0.1852 10.907717-Sep-07 10.00 0.234 0.0234 0.218 0.0218 11.376217-Dec-07 10.00 2.180 0.2180 2.029 0.2029 11.4187 17-Mar-08 10.00 0.220 0.0220 0.204 0.0204 11.6530
Birla Income Plus 15-Sep-06 10.00 1.081 0.1081 1.007 0.1007 10.2751(Monthly Dividend) 15-Dec-06 10.00 1.537 0.1537 1.431 0.1431 10.3281
15-Mar-07 10.00 0.930 0.0930 0.866 0.0866 10.106415-Jun-07 10.00 1.529 0.1529 1.423 0.1423 10.221817-Sep-07 10.00 0.181 0.0181 0.169 0.0169 10.570417-Dec-07 10.00 2.031 0.2031 1.890 0.1890 10.7758 17-Mar-08 10.00 0.230 0.0230 0.214 0.0214 10.9445
Birla Sun Life Govt. Securities - 15-Mar-07 10.00 3.113 0.3113 2.899 0.2899 10.4817Long Term Dividend 17-Sep-07 10.00 0.316 0.0316 0.294 0.0294 10.3774
17-Mar-08 10.00 0.048 0.0048 0.045 0.0045 10.0548
Birla Sun Life Govt. Securities - 15-Dec-06 10.00 1.194 0.1194 0.112 0.0112 10.3763Short Term Dividend 15-Sep-06 10.00 0.978 0.0978 0.911 0.0911 10.1559
15-Mar-07 10.00 1.440 0.1440 1.341 0.1341 10.370215-Jun-07 10.00 1.352 0.1352 1.258 0.1258 10.176817-Sep-07 10.00 0.161 0.0161 0.150 0.0150 10.311017-Dec-07 10.00 1.546 0.1546 1.439 0.1439 10.2972 17-Mar-08 10.00 0.059 0.0059 0.055 0.0055 10.0734
Birla Sun Life Income Fund- 15-Mar-07 10.00 3.191 0.3191 2.971 0.2971 10.8886Half Yearly Dividend 17-Sep-07 10.00 0.376 0.0376 0.350 0.0350 11.2454
17-Mar-08 10.00 0.475 0.0475 0.442 0.0442 11.6359
Birla Sun Life Income Fund - 15-Dec-06 10.00 1.644 0.1644 0.153 0.0153 10.4492Quarterly Dividend 26-Jun-06 10.00 0.148 0.0148 0.137 0.0137 10.2581
15-Mar-07 10.00 1.552 0.1552 1.446 0.1446 10.344415-Jun-07 10.00 1.776 0.1776 1.653 0.1653 10.263217-Sep-07 10.00 0.197 0.0197 0.183 0.0183 10.653417-Dec-07 10.00 2.047 0.2047 1.905 0.1905 10.8291 17-Mar-08 10.00 0.231 0.0231 0.215 0.0215 10.9767
Birla Sun Life Liquid Plus - 28-Mar-08 10.00 0.055 0.0055 0.051 0.0051 10.1180Institutional Monthly Dividend 25-Apr-08 10.00 0.050 0.0050 0.046 0.0046 10.1111
30-May-08 10.00 0.065 0.0065 0.060 0.0060 10.1341
Birla Sun Life Liquid Plus - 28-Mar-08 10.00 0.052 0.0052 0.049 0.0049 10.1016Retail Monthly Dividend 25-Apr-08 10.00 0.046 0.0046 0.043 0.0043 10.0998
30-May-08 10.00 0.062 0.0062 0.058 0.0058 10.1234
Birla Sun Life Short Term Fund - 28-Mar-08 10.00 0.057 0.0057 0.053 0.0053 10.5994Monthly Dividend 25-Apr-08 10.00 0.042 0.0042 0.039 0.0039 10.5896
30-May-08 10.00 0.077 0.0077 0.071 0.0071 10.6352
Non Corporate Corporate
# DEBT SCHEMES Date Face Value Dividend Dividend Cum Dividend NAV
(%) (Rs. per unit) (%) (Rs. per unit) (Rs. per unit)
#Dividend Dividend
After payment of dividend, NAV will fall to the extent of the payout and statutory levy, if any. Past performance is no guarantee of future results.42

Methodology of RankingJ u n e 2 0 0 8
CRISIL~CPR 1 - indicates “Very Good" performance & ranks within top 10% of the respective category.CRISIL~CPR 2 - indicates “Good" performance & ranks within top 30% of the respective category. Ranking Source: Crisil FundServices, CRISIL Limited
Birla Sun Life ‘95 Fund – Growth (BSL‘95): Best Fund - 10 yr performance (1997 - 2007), Mixed Asset INR Aggressive, No. of schemes: 6Birla Sun Life Income Fund - Growth (BSLIF): Best Fund - 3yr (2004 - 2007) & 10 yr (1997 - 2007) performance, Bond INR - General, No. of schemes: 100Birla Gilt Plus - Regular Growth (BGP-Reg): Best Fund - 5 yr performance (2002 - 2007), Bind INR Govt, No. of Schemes: 35Birla Sun Life Tax Relief '96 (BSLTR'96): 3rd Rank (Top Performing Equity funds in the world) - 10 yr performance (1997 - 2007), Equity Funds, No. of Schemes: 6302BSL’95, BSLIF & BGP - Reg are awarded the Lipper Award 2008 and BSL TR96 has been ranked 3rd among the top 100 equity funds in the world on the basis of Consistent Return (Effective Return) value. Entry/Exit load not considered. Ranking source: Lipper - A Reuter Company
Standard & Poor’s A: The fund demonstrates high standards of quality based on its investment process, risk awareness and consistency of performance relative to its own objectives. Ranking Methodology: The Fund has provided consistent, above average, risk-adjusted returns relative to its peers over a three-year period ending December 31, 2006. The Fund is assessed by S&P on basis of quantitative factors viz. historical performance for consistency, discrete period performance comparisons and measurement over 3 discrete twelve-month periods, including 6 month moving average size, turnover, dealing, liquidity of portfolio, gearing, client base, cost, fees and on evaluation of qualitative factors viz. fund management group, portfolio manager and investment team that contributes to long term performance.
Birla Sun Life Mutual Fund - Mutual Fund of the Year: Birla Sun Life Mutual Fund won the CNBC TV18 - CRISIL Mutual Fund of the Year Award in the Category – Mutual Fund of the Year. In total 26 fund houses were eligible for the award universe. Fund Houses winning at least two awards for their schemes in the category level awards for 2007 were considered for the award. The award is based on consistency of fund house’s performance across various scheme categories in the four quarterly CRISIL CPR rankings released during the calendar year 2007. The individual CRISIL CPR ranks for their schemes were aggregated on a weighted average basis to arrive at the final ranks for fund houses.Birla Infrastructure Fund – Growth - Emerging Equity Fund of the Year: Birla Infrastructure Fund - Growth was the only scheme that won the CNBC TV18 - CRISIL Mutual Fund of the Year Award in the Emerging equity Fund of the year category. In total 14 schemes were eligible for the award universe. Open ended equity schemes having a one to two year track record as on December 31, 2007 and fulfilling CRISIL’s eligibility criteria on disclosure were considered for the award. The award is based on the scheme’s performance using the analytical approach of the CRISIL CPR rankings having the analysis period as the year 2007. Birla Sun Life Frontline Equity Fund - Growth(Large Cap Oriented Equity Fund), 22 Schemes: Among 2 winnersBirla Sun Life Income Fund (Income Funds), 17 schemes: Only winnerBirla Sun Life Monthly Income (Monthly Income Plans – Conservative), 9 schemes: Only winnerBirla Sun Life Short Term Fund (Income – Short Term Funds), 12 schemes: Only winnerSchemes present in all four quarter CRISIL CPRs were considered for the award. The award is based on consistency of scheme’s performance in the four quarterly CRISIL CPR rankings released during the calendar year 2007. The individual CRISIL CPR parameter scores averaged for the four quarters were further multiplied by the parameter weight as per the CRISIL CPR methodology to arrive at the final scores. A detailed methodology of the CRISIL CPR is available at www.crisil.com. Past performance is no guarantee of future results. Rankings and Award Source: CRISIL FundServices, CRISIL Ltd.
& Lipper Awards 2008 – Award Methodology & Disclaimer
@@ S & P Fund Management Rating
&&CNBC TV18 - CRISIL Mutual Fund of the Year Award for 2007 - Award Methodology & Disclaimer
Parameters Scheme CategorySuperior Return Score Large Cap Oriented Equity, Diversified Equity, ELSS, Sectoral-IT, Debt, Balance, Monthly Income
Plan (Aggressive & Conservative) and Gilt categories.Mean Return and Volatility Liquid Plans, Floating Rate and Debt- Short term schemesPortfolio Concentration Analysis All SchemesLiquidity Analysis All SchemesAsset Quality Debt SchemesAverage Maturity Debt SchemesDownside Risk Probability Debt- Short Term, Floating Rate Funds, Liquid, Liquid- Institutional & Super Institutional.Asset Size Debt- Short Term, Floating Rate Funds, Liquid, Liquid- Institutional & Super Institutional.
#Value Research Ratings
@ ICRA – Ranking Methodology and Disclaimer
+ ICRA mfAAA and mfA1+ Rating Methodology for Birla Floating Rate (Short Term & Long Term) and Birla Cash Plus Respectively
* AAAf: CRISIL AAAf Rating Methodology for Birla Sun Life Liquid Plus, Birla Income Plus and Birla Sun Life Cash Manager, Birla Sun Life Income Fund
^^Crisil CPR – Ranking Methodology & Disclaimer
The Ratings are a Composite Measure of historical Risk-Adjusted Returns. For Equity and Hybrid Funds, Ratings for the two time periods (3 and 5 years) are combined to give a single assessment of each fund’s risk rating vis-à-vis other funds in the category. For Debt funds and Long & Medium-term Gilt funds, the Ratings are arrived at by combining the assessment for 2 time periods (18 months and 3 years), based on weekly risk-adjusted performance. For Short-term and Ultra Short-term debt funds and Short-term Gilt funds, the Ratings are based on 18-month weekly risk-adjusted performance, relative to the other funds in category. Entry/Exit Loads not considered.5-stars indicate that fund is in top 10% of its category. 4-stars indicate that fund is in next 22.5% of its category. Following is the number of schemes in each category: Equity Diversified (214), Equity: Index (25), Equity Tax Planning (30), Hybrid: Equity Oriented (33), Hybrid: Debt Oriented (30), Hybrid: Monthly Income (38), Debt: MT (52), Debt: ST (24), Debt: Ultra ST (53), Debt: Ultra ST-Inst. (56), Debt: Floating Rate ST (13) Debt: Floating Rate LT (12), Gilt: Medium and LT (42), Gilt: ST (17). Fund Ratings are as on 31 May’08. Ranking Source: www.valueresearchonline.com
Birla Sun Life Short Term Fund - Growth (Category: Liquid Plus Scheme, No of Schemes = 26) & Birla Income Plus - Growth (Category: Debt Long Term, No of Schemes = 18) are ranked 7 - Star at ICRA Mutual Funds Awards 2007 for 1 yr performance for period ended 31 Dec. ’07. Ranks are based on in-depth analysis of critical parameters, including: risk-adjusted performance; portfolio concentration characteristics; liquidity; corpus size; average maturity; and portfolio turnover. Entry/Exit Loads not considered. Ranking Source & Publisher: ICRA Online.
Birla Floating Rate Fund – Short Term & Birla Floating Rate Fund – Long Term: The credit risk rating assigned to the schemes is mfAAA. The rating is the highest-credit-quality rating assigned by ICRA to debt funds. Birla Cash Plus: The credit risk rating assigned to the scheme is mfA1+. The highest-credit-quality short-term rating assigned by ICRA to debt funds.Rating methodology used by ICRA is based on evaluating the inherent credit quality of the funds portfolio. As a measure of the credit quality of a debt fund’s assets, ICRA uses the concept of ”credit scores”, based on ICRA’s assessment of credit risk associated with each exposure of the portfolio taking into account its maturity, investment objectives and policies, its management characteristics and the creditworthiness of its investment portfolio. ICRA reviews relevant fund information on an ongoing basis to support its published rating opinions. Source: ICRA Ltd.
AAAf The fund’s portfolio holdings provide very strong protection against losses from credit defaults.The credit quality ratings are based on an analysis of the fund’s investment philosophy, its management, investment strategies, operational policies and internal controls. Credit quality incorporates the credit risk of securities and the counter-party risk involved in transactions CRISIL has developed a Credit Quality Matrix to evaluate a bond fund’s overall level of protection against losses associated with credit default. The matrix is a set of credit factors & credit scores derived scientifically from CRISIL’s rating default and transition rates over past ten years. Ranking source: CRISIL FundServices, CRISIL Ltd.
Birla Sun Life Basic Industries Fund: CRISIL~CPR 2 - in Diversified Equity Scheme Category (86 schemes)Birla Sun Life Frontline Equity Fund - Growth: CRISIL~CPR 2 -In Diversified Equity Scheme Category (86 Schemes). Birla Sun Life Income Fund: CRISIL~CPR 1 - Income Scheme Category (20 Schemes).Birla Sun Life Monthly Income: CRISIL~CPR 2 - MIP Conservative Scheme Category (9 schemes)Birla Sun Life Short Term Fund: CRISIL~CPR 1 - Debt Short Term Scheme Category (18 Schemes).Birla Sun Life Tax Relief ‘96: CRISIL~CPR 2 - ELSS Category (21 schemes)Birla Cash Plus - Institutional: CRISIL~CPR 2 - Liquid Inst. Scheme Category (9 schemes)Birla Cash Plus: Institutional Premium: CRISIL~CPR 2 - Liquid Super Inst. Scheme Category (16 Schemes).Birla Gilt Plus – Regular Plan: CRISIL~CPR 1 - Gilt Scheme Category (14 schemes)Birla Income Plus: CRISIL~CPR1 - Income Scheme Category (20 schemes)Birla Midcap Fund: CRISIL~CPR 2 - Diversified Equity Scheme Category (86 schemes)Birla MIP: CRISIL~CPR2 - MIP Conservative Scheme Category (9 Schemes)Birla MIP II - Wealth 25 Plan: CRISIL~CPR2 - MIP Aggressive Scheme Category (14 Schemes)Birla Infrastructure Fund: CRISIL~CPR 2 - in Diversified Equity Scheme Category (86 schemes)Birla Sun life Equty Fund: CRISIL~CPR 2 - in Diversified Equity Scheme Category (86 schemes)Birla Sun Life Liquid Plus: CRISIL~CPR 1 - Liquid Plus Scheme Category (17 schemes)CRISIL~Composite Performance Ranking - (CRISIL~CPR) is the relative performance ranking of mutual fund schemes within the peer group. The criteria used for computing the ranking are AUM in excess of category cut-off limits & portfolio disclosure and performance in case of Liquid Plans, Floating Rate and Debt-Short Term – Last 1 years; All other Schemes – Last 2 years. Fund Ratings are as on 31 March ’08. Ranking is done on the following parameters depending on scheme category.
For further details on our Funds, please contact our Customers Service Centres at details given below.
BIRLA SUN LIFE ASSET MANAGEMENT COMPANY LTD. BRANCHES
Disclaimer: Any information contained in this publication does not constitute and shall be deemed not to constitute an advice, an ofits subsidiaries / affiliates / sponsors / trustee or their officers, employees, personnel, directors shall not be liable for any loss, damage, liability whatsoever for any direct or indirect loss arising from the use or access of any information that may be displayed in this publication from time to time. Recipients of the information contained herein should exercise due care and caution and read the offer documents (including if necessary, obtaining the advice of tax / legal / accounting / financial / other professionals) prior to taking of any decision, acting or omitting to act, on the basis of the information contained herein.Editorial opinions expressed in the 'Connect' are not necessarily those of Birla Sun Life AMC Ltd. or any of their officers, employees, personnel, directors and Birla Sun Life AMC Ltd. and its officers, employees, personnel, directors do not accept responsibility for the editorial content. Birla Sun Life AMC Ltd. or any of its officers, employees, personnel, directors make no representation as to the accuracy, completeness or reliability of the editorial content and hereby disclaim any liability with regard to the same.
fer to sell/ purchase or as an invitation or solicitation to do so for any securities of any entity, and further, Birla Sun Life AMC Ltd./
Statutory Details: Constitution: Birla Sun Life Mutual Fund (BSLMF) has been set up as a Trust under the Indian Trust Act, 1882. Sponsors: Aditya Birla Nuvo Limtied and Sun Life (India) AMC Investments Inc. (liability restricted to seed corpus of Rs. 1 Lac). Trustee: Birla Sun Life Trustee Company Pvt. Ltd. Investment Manager: Birla Sun Life Asset Management Company Ltd.Risk Factors: Mutual Funds and securities investments are subject to market risks and there can be no assurance or guarantee that the objectives of the Scheme will be achieved. As with any investment in securities, the NAV of the Units issued under the Scheme may go up or down depending on the various factors and forces affecting capital markets and money markets. Past performance of the Sponsor / Investment Manager / Mutual Fund does not indicate the future performance of the Schemes and may not necessarily provide a basis of comparison with other investments. The names of the Schemes do not, in any manner, indicate either the quality of the Schemes or their future prospects or returns. Unitholders in the schemes are not being offered any guaranteed/assured returns. Please refer to the Addendum / Offer Document for scheme specific risk factors before investing. The Group Life Insurance Cover will be governed by the terms, conditions & exclusion of the insurance policy with the relevant Insurance Company as determined by the AMC. Insurance is subject matter of solicitation. Investors should read the Offer Document/ Key Information Memorandum available at Investor Service Centers and with distributors carefully before investing.
The Material provided in the Connect cannot be reproduced or quoted anywhere without express permission from Birla Sun Life Asset Management Company Ltd.
AGRA : 0562-2524409
AHMEDABAD : 079-2640 3553 / 48
AJMER : 9983318002
ALLAHABAD : 0532-2427014 / 15 /3201661
AURANGABAD : 0240-6453599
BANGALORE : 080-2238 9991 / 2 / 3
BARODA : 0265-658 2984 / 2986
BHUBANESHWAR : 0674-253 5521 / 3413
CHANDIGARH : 0172-2783556-57
CHENNAI : 044-4204 5003 / 2819 1681 / 4204 5002/ 2811 6610
COCHIN : 0484-238 3969 / 236 6817
COIMBATORE : 0422-435 0262 / 64
DEHRADUN : 0135-3241324 / 9837431731
GOA : 0832-243 7628 / 29
GURGOAN : 0124-4235974 / 75
GUWAHATI : 0361-259 5020 / 259 9273
INDORE : 0731-504 0496 / 253 4502 / 504 6789
JAIPUR : 0141-238 9082 / 9115 / 511 6883
JAMSHEDPUR : 0657-6456127
JODHPUR : 9828992999
KANPUR : 0512-233 1116 / 21 / 324 6000
KOLKATA : 033-2288 2592 / 94 / 95 / 2288 2614 / 16
LUCKNOW : 0522-409 4110 / 11 / 323 6000
LUDHIANA : 0161-508 8847 / 277 1217
MADURAI : 0452-2382566 / 67
MUMBAI (FORT) : 022-6637 9999
MUMBAI (GHATKOPAR) : 022-3268 1373
MUMBAI (HEAD OFFICE) : 022-6692 8000
MUMBAI (PRABHADEVI) : 022-6666 1035 / 36
MYSORE : 0821-4244400 / 1 / 2
NAGPUR : 0712-663 0899 / 4300
NASHIK : 0253-657 3474 / 320 1125
NEW DELHI : 011-2332 3070
PATNA : 0612-220 7022 / 23 / 389 0873
PUNE : 020-66011865 / 66 / 67
RAIPUR : 0771-4266894
SECUNDARABAD : 040-6531 1052 / 3580 / 2772 1818
SURAT : 0261-658 1707 / 1708
UDAIPUR : 9828215143
VARANASI : 0542-222 7755 / 56
43