From Occupations to Embedded Skills: A Cross Country...
26
1 BACKGROUND PAPER FOR THE WORLD DEVELOPMENT REPORT 2013 Cristian Aedo, World Bank Jesko Hentschel, World Bank Javier Luque, Inter-American Development Bank Martín Moreno, Inter-American Development Bank From Occupations to Embedded Skills: A Cross-Country Comparison
Transcript of From Occupations to Embedded Skills: A Cross Country...
1
BACKGROUND PAPER FOR THE
WORLD DEVELOPMENT REPORT 2013
Cristian Aedo, World Bank
Jesko Hentschel, World Bank
Javier Luque, Inter-American Development Bank
Martín Moreno, Inter-American Development Bank
From Occupations to Embedded Skills: A Cross-Country Comparison

2
From Occupations to Embedded Skills:
A Cross-Country Comparison
Cristian Aedo, World Bank*
Jesko Hentschel, World Bank
Javier Luque, Inter-American Development Bank
Martín Moreno, Inter-American Development Bank
June 10, 2013
Abstract:
We derive the skill content of thirty countries, ranging from low to high income ones,
from the occupational structure of their economies. Five different skills are defined, as proposed
initially for the United States by Autor, Levy and Murnane (2003), and later updated by
Acemoglu and Autor (2010). Cross country measures of skill content show that the intensity of
national production of manual skills declines with per capita income in a monotonic way, while
it increases for non-routine cognitive and interpersonal skills. For some countries, we are able to
trace the development of skill intensities of aggregate production over time. We find that while
the increasing intensity of non-routine skills is uniform across countries, patterns of skill
intensities with respect to different forms of routine skills differ markedly.
* Corresponding author: Cristian Aedo ([email protected]). This paper was prepared as a background
paper for the World Development Report 2013 on ‘Jobs. The authors would like to thank Omar Arias, Beth
King, Martin Rama, Dena Ringold, and Alexandria Valerio for helpful suggestions and comments. We
would like to especially thank our colleague Jee-Peng Tan for her substantive contributions to the paper.
All remaining errors are those of the authors. The views reflected in this paper should be strictly attributed
to those of the authors rather than presenting those of the Inter-American Development or the World Bank,
including their respective Executive Boards.
3
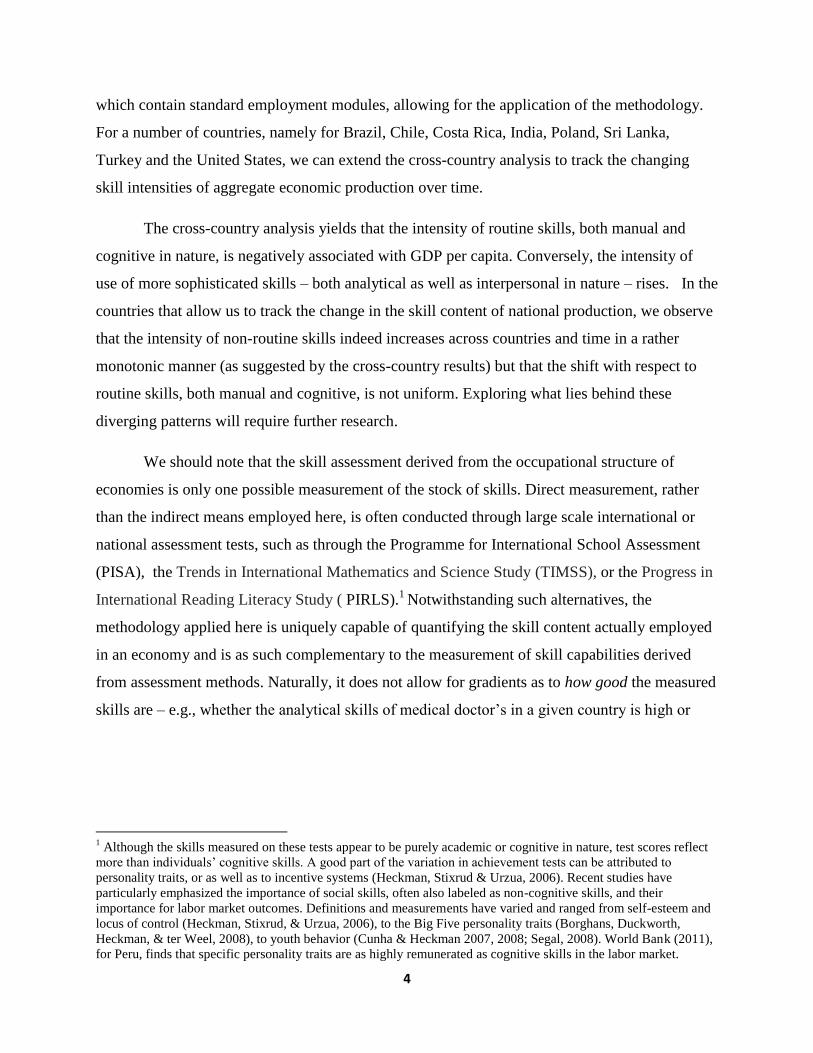
1. Introduction
A central feature of development is the changing nature of the production process of
goods and services. Typically, as countries become richer, production and trade patterns change
with a higher share of domestic value added being generated through more sophisticated
processes – both within agriculture, services and industries as well as due to a shift away from
agriculture, accompanied by increasing production taking place in cities. The technology
revolution, witnessed over the past two to three decades, has only accelerated this process and
impacted on the technology content of modern service and industrial production significantly.
Production in industrial countries itself has undergone unprecedented changes within mature
industries while some developing economies have been able to make inroads into high-
technology intensive service sectors – with the Indian success in developing its indigenous
information technology industry one, often cited, example.
The mirror image of such shifting economic production is a change in occupations and,
embedded, a transformation of the types of human skills used in an economy. Occupations which
require intensively manual skills, associated with many jobs in low-machine intensity farming
but also with specific trades as well as mass-manufacturing, give way to occupations requiring
more cognitive skills. Such cognitive skills include verbal ability, working memory, numeracy,
and problem solving abilities – teachers will need these intensively as well as computer
operators. The more modern the economy and the more sophisticated the division of labor in
production processes, the more important are also interpersonal skills which underlie behaviors
such as teamwork, reliability, discipline, and work effort.
This paper derives the embedded human skill content of aggregate economic production
for thirty countries, ranging from low-income to high income ones. We follow the methodology
proposed by Autor, Levy and Murnane (2003) and updated by Acemoglu and Autor (2010). The
approach conceptualizes and measures skills by assessing the specific tasks associated with
different occupations rather than measuring the educational credentials of workers (e.g., years of
education, diploma) performing those tasks. Five different skills are assessed: routine manual,
non-routine manual physical, routine cognitive, non-routine cognitive analytical, and non-routine
cognitive interpersonal skills. We then apply the occupation-skill grid to household labor force
surveys contained in the World Bank’s International Database on Income Distribution (I2D2)
4
which contain standard employment modules, allowing for the application of the methodology.
For a number of countries, namely for Brazil, Chile, Costa Rica, India, Poland, Sri Lanka,
Turkey and the United States, we can extend the cross-country analysis to track the changing
skill intensities of aggregate economic production over time.
The cross-country analysis yields that the intensity of routine skills, both manual and
cognitive in nature, is negatively associated with GDP per capita. Conversely, the intensity of
use of more sophisticated skills – both analytical as well as interpersonal in nature – rises. In the
countries that allow us to track the change in the skill content of national production, we observe
that the intensity of non-routine skills indeed increases across countries and time in a rather
monotonic manner (as suggested by the cross-country results) but that the shift with respect to
routine skills, both manual and cognitive, is not uniform. Exploring what lies behind these
diverging patterns will require further research.
We should note that the skill assessment derived from the occupational structure of
economies is only one possible measurement of the stock of skills. Direct measurement, rather
than the indirect means employed here, is often conducted through large scale international or
national assessment tests, such as through the Programme for International School Assessment
(PISA), the Trends in International Mathematics and Science Study (TIMSS), or the Progress in
International Reading Literacy Study ( PIRLS).1
Notwithstanding such alternatives, the
methodology applied here is uniquely capable of quantifying the skill content actually employed
in an economy and is as such complementary to the measurement of skill capabilities derived
from assessment methods. Naturally, it does not allow for gradients as to how good the measured
skills are – e.g., whether the analytical skills of medical doctor’s in a given country is high or
1 Although the skills measured on these tests appear to be purely academic or cognitive in nature, test scores reflect
more than individuals’ cognitive skills. A good part of the variation in achievement tests can be attributed to
personality traits, or as well as to incentive systems (Heckman, Stixrud & Urzua, 2006). Recent studies have
particularly emphasized the importance of social skills, often also labeled as non-cognitive skills, and their
importance for labor market outcomes. Definitions and measurements have varied and ranged from self-esteem and
locus of control (Heckman, Stixrud, & Urzua, 2006), to the Big Five personality traits (Borghans, Duckworth,
Heckman, & ter Weel, 2008), to youth behavior (Cunha & Heckman 2007, 2008; Segal, 2008). World Bank (2011),
for Peru, finds that specific personality traits are as highly remunerated as cognitive skills in the labor market.

5
low. For the latter, new forms of skill measurement are currently being pioneered, including with
the PIAC study of the OECD and the STEP skill measurement study at the World Bank.2
This paper is structured as follows. The next section recaps the main features of the
methodology, including a description of the mechanism employed to map the occupational
structure of economies into measures of skill intensity. The third section provides information on
the household surveys being used in our analyses while the fourth section presents results, both
for the cross-country comparison of different ‘stocks’ of skills as well for several countries for
which we are able to track skill developments over time. The final section concludes.
2. Methodology
We build here on the pioneering work of Autor et al (2003) followed by Acemoglu and
Autor (2010), which provides an objective measure of the evolution of the skill content
embedded in the employed US labor force. Measuring the human capital stock of nations
through such assessment is a significant innovation compared to cruder measures such as the
average years of schooling of a population.3 The analysis relies on information on the skill
content per occupation which is generated based on the Occupational Information Network
(O*NET), a database constructed with support from the US Department of Labor/Employment
and Training Administration. The O*NET characterizes different occupations in the US
economy in terms of two types of factors. First, worker-oriented factors which include worker
characteristics, worker requirements, and experience requirements. Second, job-oriented factors
which are comprised of occupational requirements, workforce characteristic and occupation-
specific information. O*NET hence records various requirements for each individual occupation,
derived from evaluations by peers and measured on a scale of 1 to 5. 4
2 The Skills Toward Employment and Productivity (STEP) Skills Measurement Study is an initiative of the World
Bank to help countries measure levels and distributions of cognitive, technical and non-cognitive skills among
adults; quantify the mismatch between the skills of the adult population and employers’ needs; and assess how skills
of individuals affect labor market outcomes. STEP skill measurement instruments collect information from
participant countries through harmonized individual and employer surveys and by using comparable implementation
protocols and technical standards. 3 In addition to Autor, Levy and Murnane (2003) and Acemoglu and Autor (2010), see Handel (2007) for an
application and discussion of the embedded-skill measurement method.. 4 Occupations in this scheme are then collapsed into the Standard Occupational Classification (SOC) used by the
Census Bureau resulting in information for 974 different SOC occupations.

6
From the O*NET’s detailed description of task requirements, Acemoglu and Autor
(2010) – following Autor et al (2003) – construct five aggregate skill measures. They select and
extract a subset of sixteen task requirements and classify these as routine-manual, non-routine
manual physical, routine cognitive, non-routine cognitive/interpersonal and non-routine
cognitive analytical skills. Importantly, each occupation is assigned a skill intensity value for
each of the five skills – they are hence not exclusive. Each occupation i, is then defined by a
vector of skills, , which is composed of five skill aggregates:
[
]
The skills aggregates are defined in the following way. First, routine-manual skills
characterize repetitive movements requiring physical abilities such as used in labor-intensive
agricultural production (manual harvesting), specific trades (brick-layers), construction workers,
for specific machine operators (e.g., textile workers), or for assembly lines (e.g., electronic
equipment). The underlying O*NET skills/tasks included in this category are: ability to adapt to
a pace determined by the speed of equipment (SPEED), to control machines and processes
(CONTROL), spend time making repetitive motions (REPETITIVE).
(
)
Second, non-routine manual physical characterize the ability to vary and react to
changing circumstances on a continuous basis – operators of heavy equipment in agriculture,
industry or construction come to mind as well as trades such as electricians. The underlying
O*NET skills/tasks included in this category are the ability to operate vehicles, mechanized
devices, or equipment (OPERATE), to spend time using hands to handle, control or feel objects,
tools or controls (HANDLE), manual dexterity (MANUAL), and spatial orientation (SPATIAL).
(
)
Third, routine cognitive skills characterize the ability to carry-out repetitive, non-physical
tasks – call center operators or bookkeepers would use these intensively. The underlying
O*NET skills/tasks included in this category are the ability to repeat the same task (REPEAT), to

7
be exact or accurate (ACCURATE), and to handle structured vs. unstructured work
(STRUCTURED).
(
)
Fourth, non-routine cognitive/analytical consisting of thought processes requiring the
absorption, processing and decision-making of abstract information. Computer programmers,
teachers, lawyers, doctors and nurses, and many other professional occupations will need such
abilities intensively. The underlying O*NET skills/tasks included in this category are the ability
to analyze data/information (ANALYZE), to think creatively (THINK), to interpret information
form others (INTERPRET).
(
)
Lastly, non-routine cognitive/interpersonal5 characterize personality traits that underlie
behaviors such as teamwork, reliability, discipline, and work effort. These are important for
professional occupations as well as for all team-based work environments as well as services
which establish direct client contact. The underlying O*NET skills/tasks included in this
category are the capacity to establish and maintain personal relationships (RELATIONSHIPS),
to guide, direct and motivate subordinates (GUIDE), and to coach/develop others (COACH).
(
)
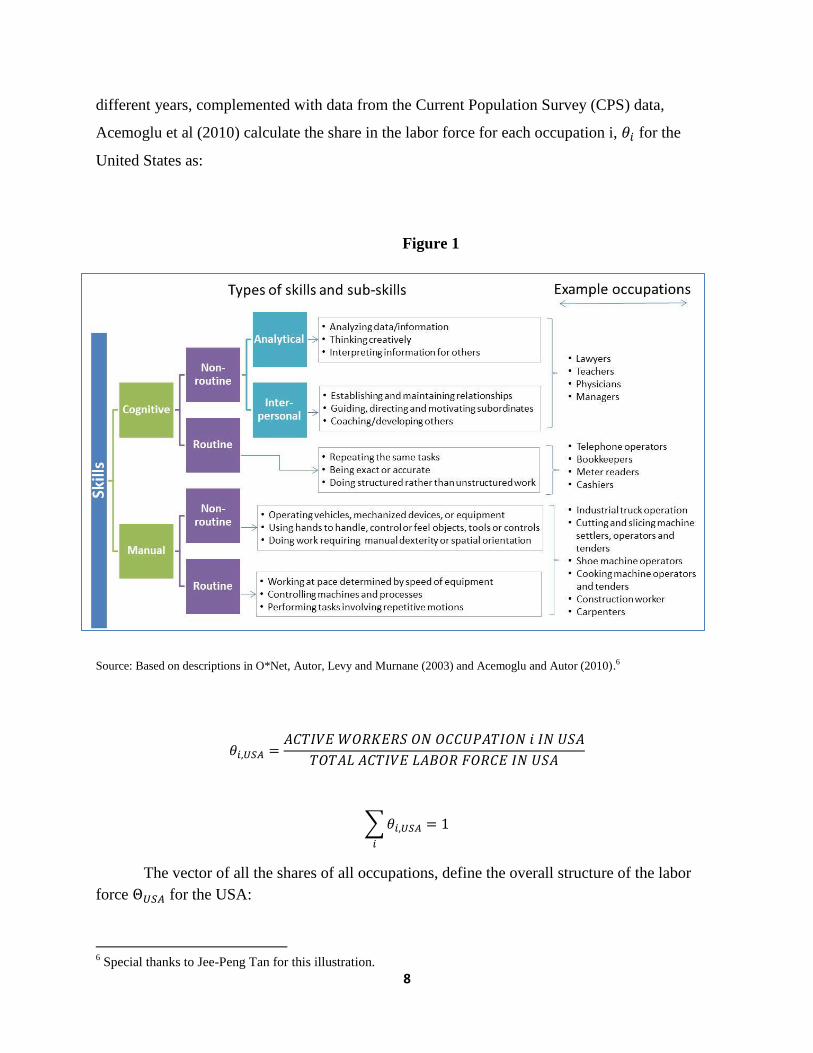
Figure 1 summarizes the different characteristics of the five skill measures and provides
occupational examples.
A vector X with skill information for all the 974 occupations that have information on the
O*NET database is constructed:
[
]
After the vector X is constructed, it needs to be linked to the occupational structure so
that weighted skills measures for economies can be computed. Employing Census data for
5 These skills have obtained much attention in the more recent literature E.g., Blom and Saeki (2011), World Bank
(2011, 2012), Heckman, J. J., Stixrud, J., & Urzua, J. (2005), Cunha, F., & Heckman, J. J. (2008), Borghans, L,
Duckworth, A. L., Heckman, J. J., & ter Weel, B. (2008).
8
different years, complemented with data from the Current Population Survey (CPS) data,
Acemoglu et al (2010) calculate the share in the labor force for each occupation i, for the
United States as:
Figure 1
Source: Based on descriptions in O*Net, Autor, Levy and Murnane (2003) and Acemoglu and Autor (2010).6
∑
The vector of all the shares of all occupations, define the overall structure of the labor
force for the USA:
6 Special thanks to Jee-Peng Tan for this illustration.

9
[ ]
Finally, to construct the skill structure of the USA, the information on the skill content by
occupation as defined in X and the labor force structure is combined (Acemoglu and Autor
2010). The skill structure will be a vector with five elements, one per skill aggregate:
[ ∑
∑
∑
∑
∑
]
We apply the above methodology to data from thirty countries, ranging from low-income
countries to higher middle-income ones, for which nationally representative household surveys
were available in the required form. Based on the household data, we characterize the occupation
structure by estimating the shares of all occupations i in country j included :
∑
Therefore, the labor market structure for country j will be defined by:
[ ]
To assess the skill structure for country j, we employ the skill intensities for each
occupation as presented in the O*NET for the United States. This is an important assumption.7
No country-specific applications of the O*NET equivalence table exist so that we are applying
the Unites States skill equivalence to all countries in our sample. By applying the O*NET to
7 Some of the limitations of O*NET were documented by Haendel (2007).

10
countries around the world, we hence assume that the skill content of a given occupation is
comparable internationally.
This assumption might hold for some occupations but not for others – hence it is
important to understand the potential bias in the computations which we are introducing.
Countries differ in technology and regulatory contexts which may imply different skill profiles
for specific occupations. For example, teachers in low-income settings are more likely to lack the
tools (especially ICT tools) that support innovative teaching than teachers in developed
countries. Similarly, doctors or nurses might have access to equipment as well as medical
knowledge which impacts on the skill content and mix they can bring to bear in different
settings. Generally, we can postulate that especially those occupations which use less routine
type of skills are likely to be more skill intensive in more advanced economic settings than in
lower-income ones. This would, hence, signal a possible upward bias in the measured skill
intensity of non-routine cognitive analytical and interpersonal skills in our sample, especially so
for the lower-income countries included.
The matching and adjustment process allows for the computation of average intensity
scores for all the five skills considered. As each occupation is matched with a specific value for
all skills, the average across all occupations for each skill represents a measure of the, composite
and normalized, intensity of skills.8 We then use the skill intensity computations for the United
States as a benchmark value when presenting the results.9
To assess the shift in skill structure through time we follow Autor et al (2003) and use the
complete distribution per type of skill and focus on the behavior of the median of the base
distribution. Skills per occupation are held constant so that changes in skill structure will reflect
changes in the occupation structure.10
Autor et al (2003) find that, over four decades, a remarkable shift in the skill intensity of
the US labor force took place with a significant increase in analytical and interpersonal skills and
a sharp decline in the use of routine cognitive skills. Over this time period, the United States
8 The ONET equivalency scale includes values for all five skills, ranging from 1 to 5, for each occupation.
9 We followed Acemoglu and Autor (2010) in building the composite scores with the exception of the skill category
‘offshore ability’ which we did not include in our analysis. 10
The procedure can be summarized in three steps. First, the distribution of a given skill on the labor force in a base
year is constructed and its median is recorded. Second, the distribution of the comparator year for the same skill is
obtained and its median calculated. Third, the median of the comparator year is projected into the base year
distribution. The difference between the median of the base distribution and the projected median from the
comparator year corresponds to the percentile change. This allows for comparisons across an arbitrary scale.

11
experienced a dramatic structural change, witnessing a significant decline of its manufacturing
output which has shifted to other parts of the world, especially East Asia. The occupational
structure has shifted, in parallel, to white color jobs which more intensively use interpersonal and
analytical skills.
3. Data
We use labor force surveys and households income and expenditure datasets with
national representation. A large part the surveys come from the International Income Distribution
Database (I2D2), developed by the Development Economics Groups at the World Bank. The
I2D2 is a harmonized database that represents 158 economies from developed and developing
countries and it covers a long period in time (1970-2012). It includes a set of standardized
variables on employment, education and income. An additional set of surveys used in this study
corresponds to the new member states in the European Union and comes from the Labor Force
Surveys harmonized by EuroStat.
All surveys include an employment module which classifies occupations according to the
International Standard Classification of Occupations version 1988 (ISCO88) developed by the
International Labor Office. We also included the United States, using the American Community
Survey, to obtain benchmark values.11
For the thirty countries, we match all occupations
contained in the household surveys with their respective skill content from the O*NET database.
To achieve this, we apply an equivalency between the ISCO88 and the United States Bureau of
Labor Standard Occupational Classification System in its 2000 version (SOC 2000) on which
ONET is based. Whenever possible, we matched the occupations and their content at the three-
digit level but for most countries, a two-digit match was used.12
In the countries that had national
variations of the ISCO88, we identified those changes manually, and established proper
equivalencies.13
In most of the countries, we were able to obtain the skill structure for
approximately 90 percent of the employed labor force.
11
Annex 1 includes the list of countries and surveys used. 12
A four-digit match was possible for some countries but it was not considered because some occupations lacked
scores in the ONET dataset. 13
In case a country did not use the ISCO88 scheme we analyzed whether a national adaptation of ISCO88 or even
an older version scheme as ISCO68 was available to construct a crosswalk table. If no mapping codebook was
available, we explored the distribution of the occupational groups at two and three digits to identify if it was possible
12
We made two adjustments to the available data to reflect the different meaning and job
contents of labor markets in developing countries compared to the United States: First, for the
category of ‘general manager’, O*NET assigns high values for both analytical and interpersonal
skills. However, in many developing countries in our sample, this category of occupation
includes self-employment in small and informal businesses in the industrial and manufacturing
economic sectors. We therefore replaced the skill content of the work of those individuals with
less than 12 years of education (in the industrial sector) with the average skill score of all other
individuals with a similar level of education and occupied in the same economic sector. After
this adjustment, composite scores in higher income countries were barely affected; scores in
lower income countries which had a significant share of ‘general manager’ classifications (e.g.
Pakistan) showed a downward adjustment in their average scores for interpersonal and analytical
skills.
The second adjustment concerns the classification of the work force in the agricultural
sector. In various countries in our sample, low-education agricultural workers were reported as
one single group without further distinction between those working in subsistence agriculture or
modern agriculture and whether they work as farmers, farm managers or farm laborers. We
reclassified all agricultural workers based on the type of employment reported. If a worker is
classified in an agriculture-related occupation and is self-employed or is a non-remunerated
family worker, we assumed that he/she worked as a traditional agriculture sector subsistence
worker. This adjustment lowered the average cognitive skills scores in economies dominated
mostly by the agriculture sector.
For the cross-section analysis, we arrived at a sample of thirty countries with all world
regions being represented. For the time trend analysis, we were able to assemble comparable
data sources for Brazil, Chile, Costa Rica, India, Poland, Sri Lanka, Turkey and the USA.
to produce a manual mapping table. Due to this methodology, we excluded from the analysis countries where
occupations were coded at the most aggregated level (1 digit occupational code).
13
4. Results
Cross-Country Analysis
The occupation-based skill-measurement returns five skill scores for thirty countries (see
Annex Table 1 for the list of countries and the data sources used). In Figure 2, these intensity
scores are plotted against real GDP per capita for each of the five different skills we are
considering in this analysis. The skill scores are normalized by the value of the United States
(see Annex Table 2 for the raw data per skill type). A measure of 1, hence, implies that the
intensity of use of a particular skill in national production of a given country is equivalent to that
obtained for the United States. The plotted line shows the correlation between the variables; the
grey area visualizes the two standard deviation confidence interval around the line.
We observe that countries with higher incomes tend to use more non-routine cognitive
(analytical and interpersonal) as well as more routine cognitive skills in their overall economic
production as shown in Figure 2 (panels A, B and C). While these are cross-section plots only
and hence the interpretation of the relationship between skills and economic activities needs to
be made with care (as technologies and production possibilities differ across countries and time),
it appears that the correlation with economic development is particularly strong for non-routine
skills (+ 0.85 for non-routine cognitive analytical, +0.79 for non-routine cognitive interpersonal)
as well as routine cognitive skills (+0.85). Interestingly, we find that both Estonia and Lithuania
use non-routing cognitive skills more intensively that the USA, our benchmark country. The
USA leads with respect to its intensity of non-routine cognitive interpersonal and routine
cognitive skills embedded in its occupational structure. The Baltic States and also Slovenia and
Costa Rica (for routine cognitive skills) show high skill intensity values for these advanced skills
as well.
Some countries have an occupational structure that favors jobs requiring more intensive
use of non-routine analytical and interpersonal than predicted by their income levels. Identifying
country plots distant from the confidence interval plotted in Figure 2 (two standard deviations),
we find that Bangladesh, Estonia, India, Latvia, Lithuania and Pakistan present a higher than
expected intensity of non-routine cognitive analytical skills; while Chile, Mexico, Peru,
Slovenia, Tanzania and Turkey present a lower than predicted intensity.

14
Figure 2: Relation between skill usage and income by type of skill
Panel (a) Non-routine Cognitive Analytical (relative to the USA)*
Panel (b) Non-routine Cognitive Interpersonal (relative to the USA)*

15
Panel (c) Routine Cognitive (relative to the USA)*
Panel (d) Routine Manual (relative to the USA)*

16
Fig. 2: Panel (e) Non-routine Manual Physical (relative to the USA)*
* BGD: Bangladesh, BRA: Brazil, BGR: Bulgaria, CHL: Chile, CRI: Costa Rica, CZE: Czech Republic, EGY:
Egypt, SLV: El Salvador, EST: Estonia, HUN: Hungary, IND: India, IDN: Indonesia, LVA: Latvia, LTU: Lithuania,
MEX: Mexico, NPL: Nepal, NIC: Nicaragua, PAK: Pakistan, PER: Peru, PHL: Philippines, POL: Poland, ROU:
Romania, RWA: Rwanda, SVK: Slovak Republic, SVN: Slovenia, LKA: Sri Lanka, TZA: Tanzania, TUN: Tunisia,
TUR: Turkey.
In parallel, we find that the intensity of manual skills, both routine and non-routine,
decreases with the level of economic development as shown in Figure 2 (panels D and E). As
agriculture and low-skilled manufacturing tends to contribute less to economic activity with
incomes rising, so do the skills used intensively in their production processes. The negative
cross-country correlation between economic activity and the intensity of manual skill use is
strong (-0.82 for routine manual and -0.86 for non-routine manual physical). While all countries
in our sample show manual skill intensity measures higher than the United States (=1.0), several
of them are approaching that value, namely Lithuania, Latvia, Estonia and Hungary in terms of
both routine and non-routine manual skills . Again, using the cross-country relationship as a
baseline, some countries countries present relatively less routine manual skill intensity than
would be predicted. This is the case of Bangladesh, Indonesia, Latvia, Lithuania and Nicaragua
17
while India, Nepal, Pakistan, Romania, Sri Lanka, Tunisia and Turkey return higher than
predicted routine manual skill intensity values.
Timeline Analysis
The cross-section analysis above presents the current structure of the skill content in the
selected countries at one point in time but it does not allow for tracking dynamic developments.
To assess such evolution, we conduct a time comparison of skill intensities for all those countries
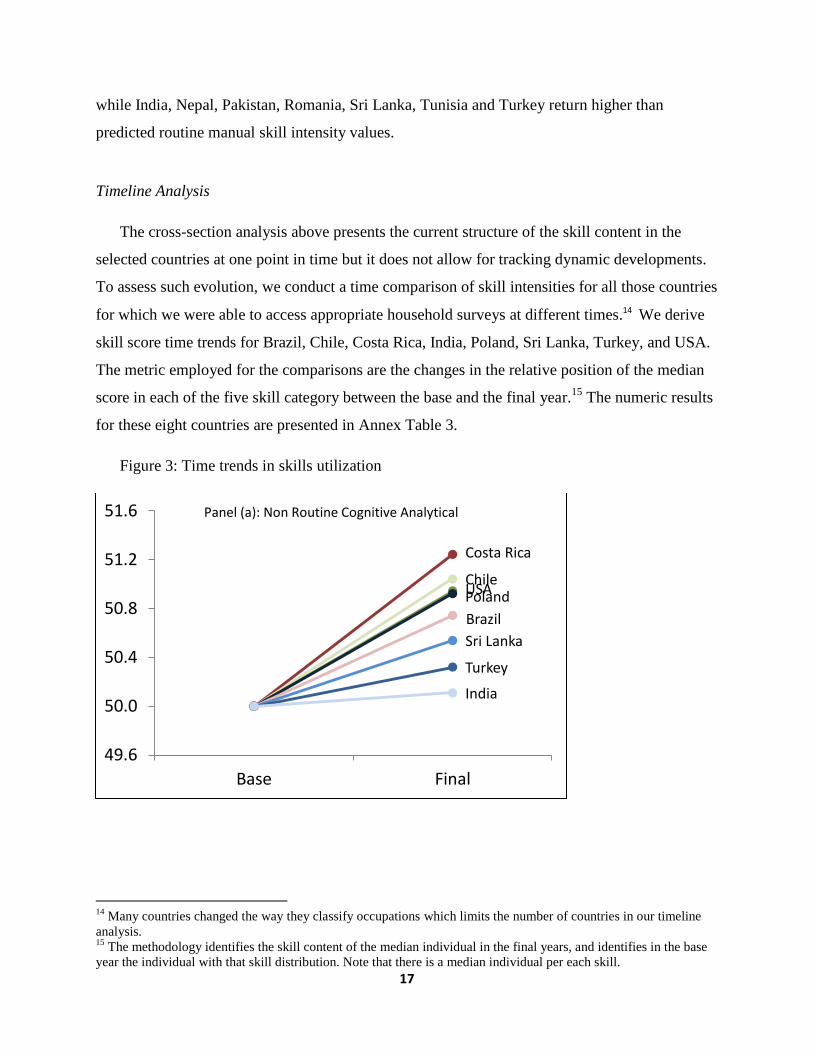
for which we were able to access appropriate household surveys at different times.14 We derive
skill score time trends for Brazil, Chile, Costa Rica, India, Poland, Sri Lanka, Turkey, and USA.
The metric employed for the comparisons are the changes in the relative position of the median
score in each of the five skill category between the base and the final year.15
The numeric results
for these eight countries are presented in Annex Table 3.
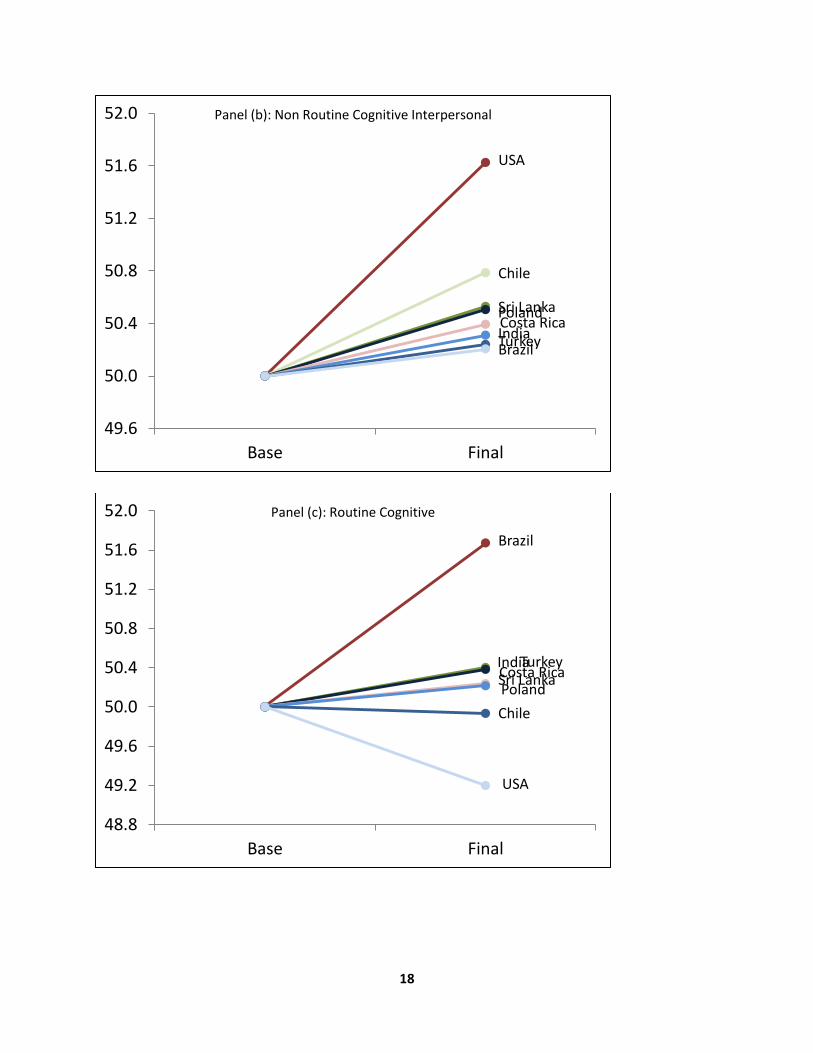
Figure 3: Time trends in skills utilization
14
Many countries changed the way they classify occupations which limits the number of countries in our timeline
analysis. 15
The methodology identifies the skill content of the median individual in the final years, and identifies in the base
year the individual with that skill distribution. Note that there is a median individual per each skill.
Costa Rica
Chile USA Poland
Brazil
Sri Lanka
Turkey
India
49.6
50.0
50.4
50.8
51.2
51.6
Base Final
Panel (a): Non Routine Cognitive Analytical
18
USA
Chile
Sri Lanka Poland Costa Rica India Turkey Brazil
49.6
50.0
50.4
50.8
51.2
51.6
52.0
Base Final
Panel (b): Non Routine Cognitive Interpersonal
Brazil
Turkey India Costa Rica Sri Lanka Poland
Chile
USA
48.8
49.2
49.6
50.0
50.4
50.8
51.2
51.6
52.0
Base Final
Panel (c): Routine Cognitive

19
Note: See Annex 3 to see base and final years for the countries in Figure 3.
The country-specific dynamic analysis reveals more divergence in skill development
patterns than the cross-section analysis above might have suggested. First, we observe a rather
uniform pattern with regards to a more intensive use of non-routine cognitive as well, to a
somewhat lesser extent, non-routine interpersonal skills. The Costa Rica, Chile, the USA,
Poland and Brazil (in that order) present a strong increase in non-routine cognitive analytical
Costa Rica Sri Lanka
Brazil India Turkey Poland
Chile
USA
47.2
47.6
48.0
48.4
48.8
49.2
49.6
50.0
50.4
Base Final
Panel (d): Routine Manual
Sri Lanka
Costa Rica
India
Brazil
Turkey Poland
Chile USA
48.0
48.4
48.8
49.2
49.6
50.0
50.4
Base Final
Panel (e): Non Routine Manual Physical

20
skills over time while the increase is somewhat more moderate in Sri Lanka, Turkey and India.
For non-routine cognitive interpersonal skills, the increase is strongest in the USA, somewhat
slower in Chile, and moderate in all the other countries.
Second, we similarly observe a uniform decline in the use of non-routine manual skills;
strongest in the United States and Chile, less so in Sri Lanka and Costa Rica. As illustrated in
Annex Table 4, between 1992 and 2008, Chile underwent a significant structural change which
reduced the share of its working population engaged in elementary occupations as well as craft
and related trade workers. Such fall is not so pronounced in either Costa Rica or Sri Lanka.
Third, patterns start diverging when we look at the use of routine manual skills (panel d):
overall, the intensity of use is decreasing in many of the sampled countries, most pronounced so
in the United States and Chile – but they increase (even if marginally) for Sri Lanka and Costa
Rica. In Sri Lanka, this is due to an increasing share the labor force working as plant and
machine operators and assemblers between 2000 and 2008 while there was a rise in Costa Ricans
employed as clerks between 2001 and 2009.
Lastly, we observe a higher divergence for the change in the intensity of routine cognitive
skills. Here, Brazil shows a significant increase. A second group of countries shows more
moderate increases (India, Turkey, Costa Rica, Sri Lanka and Poland) while Chile records a mild
decline (1992 to 2009) and the USA shows a strong and significant decline (1980 to 2008).
Brazil, between 1981 and 2009, shows a significant increase in the share of workers in
occupations with a higher use of routine cognitive skills such as technicians and associate
professionals, plant machine operators and service workers, and shop and market sales workers
(Annex 4), explaining the rather remarkable increase in the use of routine cognitive skills at a
time when income levels of the country increased threefold.
While a number of caveats exist, not least due to varying time periods we were able to
look at, we do find that there is some merit to establish a classical skill transition pattern which
matches the correlations we had established when examining the cross-country relationships
above: this would be one in which, alongside economic development, the intensity of non-
routing cognitive skills (analytical and inter-personal) increase alongside with routine cognitive
skills while manual skills (routine and non-routine) become less important. Brazil, India, Poland
and Turkey would serve as this ‘benchmark’ here. But we do find quite some variations given
the analyses we conducted: one in which routine cognitive skills are also used less intensively
(Chile and the USA); as well as one in which the intensity of routine manual and routine

21
cognitive skills keeps increasing (Costa Rica and Sri Lanka) alongside the non-routine skills.
Understanding such different patterns of occupational developments – and with it the measured
skill intensities – would be an important task for further research.
Concluding Remarks
In this paper, we employed labor force and household surveys to compute skill intensities
for thirty countries in the developing world at one point in time and for eight countries over time.
Using the occupational structure derived from such surveys and matching them with a detailed
skill mapping which had been developed for the United States, we derived such intensity
measures for five different skills. Our cross section results indicate strong positive correlations
between economic development and the skill intensity of non-routine cognitive analytical and
interpersonal skills as well as routine cognitive skills while strong negative correlations with
both routine and non-routine manual skills resulted. The dynamic analysis confirms this general
pattern but showed significant variation, especially for the changing intensity of routine
cognitive skills.
We pointed out a number of caveats related to this analysis which need to be taken into
account when interpreting the results. First, and most important, is the application of the US-
specific skill intensity per occupation to the entire sample of countries studied in this paper.
While we were able to make some adjustments for individual categories to reflect labor market
realities in developing and emerging economies, the use of the US skill intensities will most
likely have led to an upward bias in the measured skill intensities for advanced skills – both non-
routine analytical as well as interpersonal skills. Second, while the skill intensity measures are an
important data point, they cannot substitute for a proper measure of the quality of such available
skills. For that, direct measurement techniques – as they are currently being developed – are
necessary.
The observed skill intensity patterns are the result of the interaction between skill supply
(i.e., the output of the education and skill building system, both in schools and workplaces alike)
and demand (i.e., derived from public and private investment decisions as well as the business
opportunities for self-employment in agriculture and urban areas). As such, they represent the

22
equilibrium outcome of the dynamic development of comparative advantage (with all its
determinants) and the cumulative impact of public policies in various spheres of the economy.
Understanding the origins of varying skill patterns and, especially, their diverging developments
through time, would be an area of fruitful future research. One core, but most likely also
difficult, question to answer is to what degree skill supply has (endogenously) shaped innovation
and economic growth opportunities and has thereby contributed to the observed changes in skill
intensities of economies.
23
References
Autor, David H., Frank Levy, and Richard J. Murnane. 2003. “The Skill Content of Recent
Technological Change: An Empirical Exploration.” The Quarterly Journal of Economics
118(4):1279 –1333.
Acemoglu, Daron, and David H. Autor. n.d. 2010. “Skills, Tasks and Technologies: Implications
for Employment and Earnings.” Retrieved June 18, 2012 (http://economics.mit.edu/files/5571).
Blom, Andreas, and Hiroshi. Saeki. 2011. Employability and Skill Set of Newly Graduated
Engineers in India. Washington, D.C.: World Bank, Working Paper Series 5640.
Borghans, L., Duckworth, A. L., Heckman, J. J., & ter Weel, B. (2008). The economics and
psychology of personality traits. The Journal of Human Resources, 43, 973-1059.
Cunha, F., & Heckman, J. J. (2007). The technology of skill formation. American Economic
Review, 97, 31-47.
Cunha, F., & Heckman, J. J. (2008). Formulating, identifying, and estimating the technology of
noncognitive skill formation. The Journal of Human Resources, 34, 738-782.
Handel, Michael. 2007. “A new survey of workplace skills, technology, and management
practices (STAMP): Background and descriptive statistics.”
Heckman, J. J., Stixrud, J., & Urzua, J. (2006). The effects of cognitive and non-cognitive
abilities on labor market outcomes and social behavior. Journal of Labor Economics, 2006,
v24(3,Jul), 411-482.
Segal, C. (2008). Classroom behavior. The Journal of Human Resources, 43, 783-814.Simon, H.
A. (1979a). Models of thought, Vol. 1. New Haven: Yale University Press.
World Bank (2011). Strengthening Skills and Employability in Peru, Report 61699. Washington
D.C.: World Bank.
24
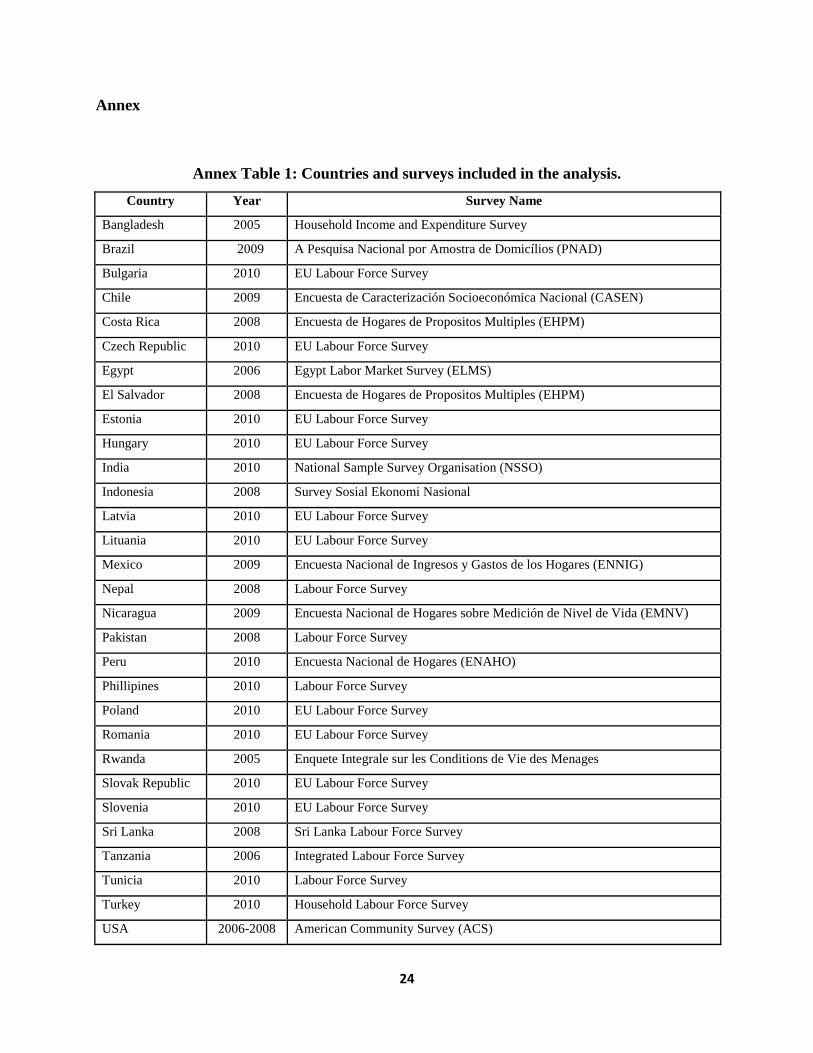
Annex
Annex Table 1: Countries and surveys included in the analysis.
Country Year Survey Name
Bangladesh 2005 Household Income and Expenditure Survey
Brazil 2009 A Pesquisa Nacional por Amostra de Domicílios (PNAD)
Bulgaria 2010 EU Labour Force Survey
Chile 2009 Encuesta de Caracterización Socioeconómica Nacional (CASEN)
Costa Rica 2008 Encuesta de Hogares de Propositos Multiples (EHPM)
Czech Republic 2010 EU Labour Force Survey
Egypt 2006 Egypt Labor Market Survey (ELMS)
El Salvador 2008 Encuesta de Hogares de Propositos Multiples (EHPM)
Estonia 2010 EU Labour Force Survey
Hungary 2010 EU Labour Force Survey
India 2010 National Sample Survey Organisation (NSSO)
Indonesia 2008 Survey Sosial Ekonomi Nasional
Latvia 2010 EU Labour Force Survey
Lituania 2010 EU Labour Force Survey
Mexico 2009 Encuesta Nacional de Ingresos y Gastos de los Hogares (ENNIG)
Nepal 2008 Labour Force Survey
Nicaragua 2009 Encuesta Nacional de Hogares sobre Medición de Nivel de Vida (EMNV)
Pakistan 2008 Labour Force Survey
Peru 2010 Encuesta Nacional de Hogares (ENAHO)
Phillipines 2010 Labour Force Survey
Poland 2010 EU Labour Force Survey
Romania 2010 EU Labour Force Survey
Rwanda 2005 Enquete Integrale sur les Conditions de Vie des Menages
Slovak Republic 2010 EU Labour Force Survey
Slovenia 2010 EU Labour Force Survey
Sri Lanka 2008 Sri Lanka Labour Force Survey
Tanzania 2006 Integrated Labour Force Survey
Tunicia 2010 Labour Force Survey
Turkey 2010 Household Labour Force Survey
USA 2006-2008 American Community Survey (ACS)

25
Annex Table 2: Raw Skills Scores for Selected Countries.
YEAR
Non Routine cognitive: Analytical
Non Routine cognitive: Interpersonal
Routine cognitive
Routine manual
Non routine manual physical
Brazil 2009 2.798 2.921 3.06 2.646 2.554
Bangladesh 2005 2.813 2.936 2.929 2.737 2.751
Bulgaria 2010 2.909 2.969 3.04 2.644 2.571
Chile 2009 2.79 2.904 3.031 2.626 2.624
Costa Rica 2008 2.803 2.943 3.023 2.716 2.587
Czech Republic
2010 3.002 2.985 3.114 2.652 2.57
Egypt 2006 2.817 2.92 2.913 2.742 2.811
El Salvador
2.647 2.859 2.988 2.701 2.614
Estonia 2010 3.039 3.052 3.053 2.574 2.49
Hungary 2010 2.975 2.995 3.062 2.59 2.509
India 2010 2.772 2.907 2.889 2.875 2.966
Indonesia 2008 2.735 2.986 2.766 2.662 2.724
Latvia 2010 3.005 3.035 3.029 2.548 2.508
Lituania 2010 3.045 3.066 3.01 2.523 2.477
Mexico
2.759 2.941 2.926 2.628 2.598
Nepal 2008 2.544 2.763 2.807 2.985 3.18
Nicaragua 2009 2.674 2.901 2.93 2.734 2.677
Pakistan 2008 2.759 2.886 2.93 2.904 2.909
Peru 2010 2.699 2.876 2.924 2.683 2.718
Phillipines 2010 2.683 2.878 2.897 2.735 2.807
Poland 2010 2.983 2.999 3.018 2.615 2.568
Romania 2010 2.887 2.936 2.968 2.766 2.776
Rwanda 2005 2.493 2.738 2.744 2.955 3.196
Slovak Republic
2010 2.964 2.985 3.08 2.643 2.56
Slovenia 2010 3.012 3.018 3.055 2.606 2.512
Sri Lanka 2008 2.723 2.86 2.973 2.852 2.936
Tanzania 2006 2.444 2.675 2.72 2.868 3.064
Tunicia 2010 2.859 2.98 2.98 2.757 2.694
Turkey 2010 2.827 2.927 2.986 2.771 2.738
USA 2008 3.023 3.08 3.13 2.497 2.335

26
Annex Table 3: Skills Trends Summary (expressed as percentiles)
Country
Non Routine
cognitive: Analytical
Non Routine cognitive:
Interpersonal
Routine cognitive
Routine manual
Non routine manual physical
Non Routine
cognitive: Analytical
Non Routine cognitive:
Interpersonal
Routine cognitive
Routine manual
Non routine manual physical
USA 1980 2.967 2.983 3.181 2.621 2.426 2008 3.023 3.080 3.130 2.497 2.335
Chile 1992 2.733 2.859 3.035 2.732 2.720 2009 2.790 2.904 3.031 2.626 2.624 Costa Rica 2001 2.735 2.920 3.000 2.707 2.611 2008 2.803 2.943 3.023 2.716 2.587
Brazil 1981 2.757 2.909 2.961 2.692 2.610 2009 2.798 2.921 3.060 2.646 2.554
Poland 2002 2.929 2.969 3.005 2.669 2.639 2010 2.983 2.999 3.018 2.615 2.568
Turkey 2004 2.809 2.913 2.962 2.826 2.813 2008 2.827 2.927 2.986 2.771 2.738 Sri Lanka 2000 2.694 2.830 2.959 2.846 2.953 2008 2.723 2.860 2.973 2.852 2.936
India 1994 2.766 2.889 2.866 2.928 3.017 2010 2.772 2.907 2.889 2.875 2.966 a. Source: Own calculations.
Annex Table 4: Share of Occupations (ISCO-88, 1 digit)
2004 2008 1992 2009 2000 2008 2002 2010 2001 2009 1981 2009 1994 2010
1 Legislators, senior officials and managers 8.6 8.8 5.3 2.6 1.2 8.2 6.4 7.3 2.5 3.5 5.1 6.1 2.1 5.7
2 Professionals 6.2 6.4 7.4 11.0 5.6 6.0 10.5 16.1 9.7 10.9 6.8 10.7 2.0 3.9
3 Technicians and associate professionals 5.0 7.3 5.7 10.0 5.0 5.7 12.7 11.7 12.0 13.8 5.1 7.8 4.2 3.1
4 Clerks 5.3 6.8 7.9 8.0 4.3 4.2 8.0 7.3 7.5 9.1 9.7 9.8 1.9 2.0
5 Service workers and shop and market sales workers 10.4 12.3 13.8 17.7 12.0 7.8 11.4 12.2 15.4 15.9 13.8 16.8 8.0 7.4
6 Skilled agricultural and fishery workers 27.9 17.9 5.8 3.7 25.5 21.5 18.7 12.0 4.5 3.4 20.4 5.1 39.1 31.0
7 Craft and related trade workers 14.2 14.6 18.6 14.0 16.8 16.9 16.1 15.8 11.8 10.1 17.8 14.2 10.0 12.0
8 Plant and machine operators and assemblers 10.0 11.0 8.1 9.3 5.7 7.5 8.9 10.1 9.9 8.9 4.6 9.2 5.0 3.9
9 Elementary occupations 12.5 14.9 27.4 23.8 24.0 22.2 7.4 7.6 26.8 24.5 16.7 20.4 27.8 31.0
Poland Costa Rica Brazil India
15-64 years old15-64 years old 15-64 years old 15-64 years old
Turkey Chile
15-64 years old 15-64 years old 15-64 years old
Sri Lanka