From malnutrition to optimal nutrition or Nutrient Security · •Indicators of malnutrition •The...
82
From malnutrition to optimal nutrition or Nutrient Security Martin W. Bloem, MD, PhD World Food Program May 2012
Transcript of From malnutrition to optimal nutrition or Nutrient Security · •Indicators of malnutrition •The...
From malnutrition to optimal nutrition or Nutrient Security
Martin W. Bloem, MD, PhD
World Food Program
May 2012
Contents
• Definitions
• Indicators of malnutrition
• The role of food security and malnutrition
• The importance of animal products/nutrient dense foods in the first 1000 days.
• Recommendations and other issues
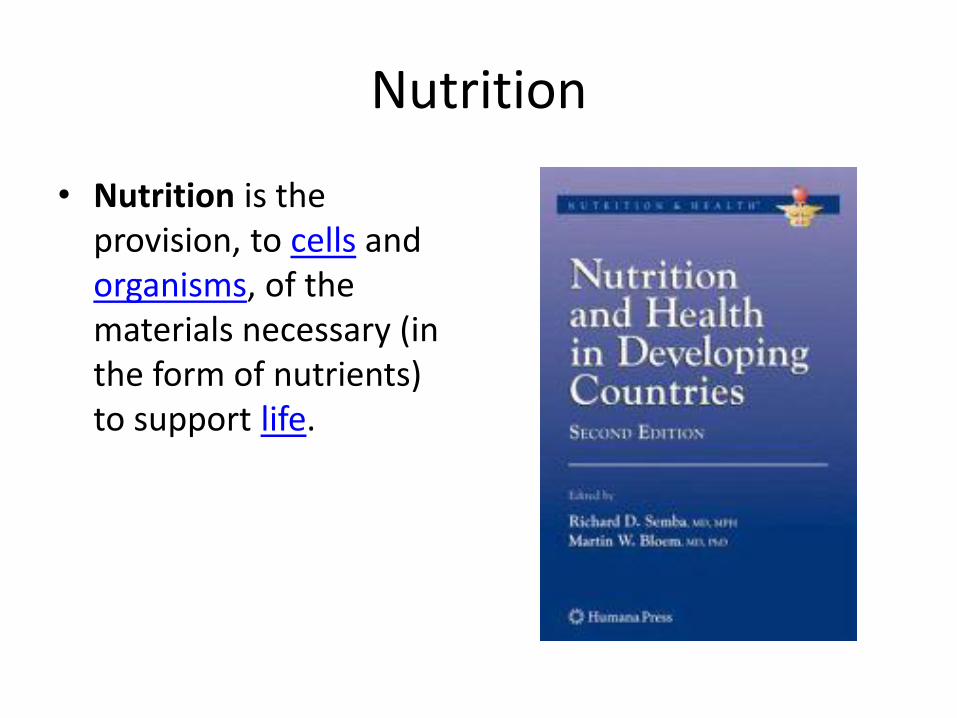
Nutrition
• Nutrition is the provision, to cells and organisms, of the materials necessary (in the form of nutrients) to support life.
Nutrients
• are chemicals that an organism needs to live and grow or a substance used in an organism's metabolism which must be taken in from its environment.
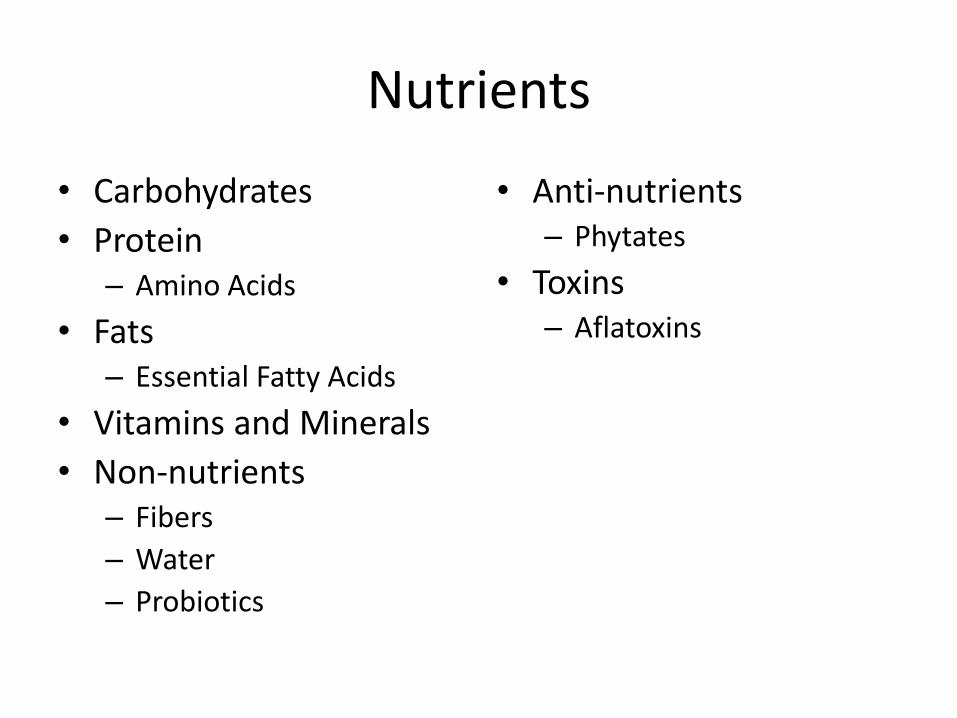
Nutrients
• Carbohydrates
• Protein – Amino Acids
• Fats – Essential Fatty Acids
• Vitamins and Minerals
• Non-nutrients – Fibers
– Water
– Probiotics
• Anti-nutrients – Phytates
• Toxins – Aflatoxins
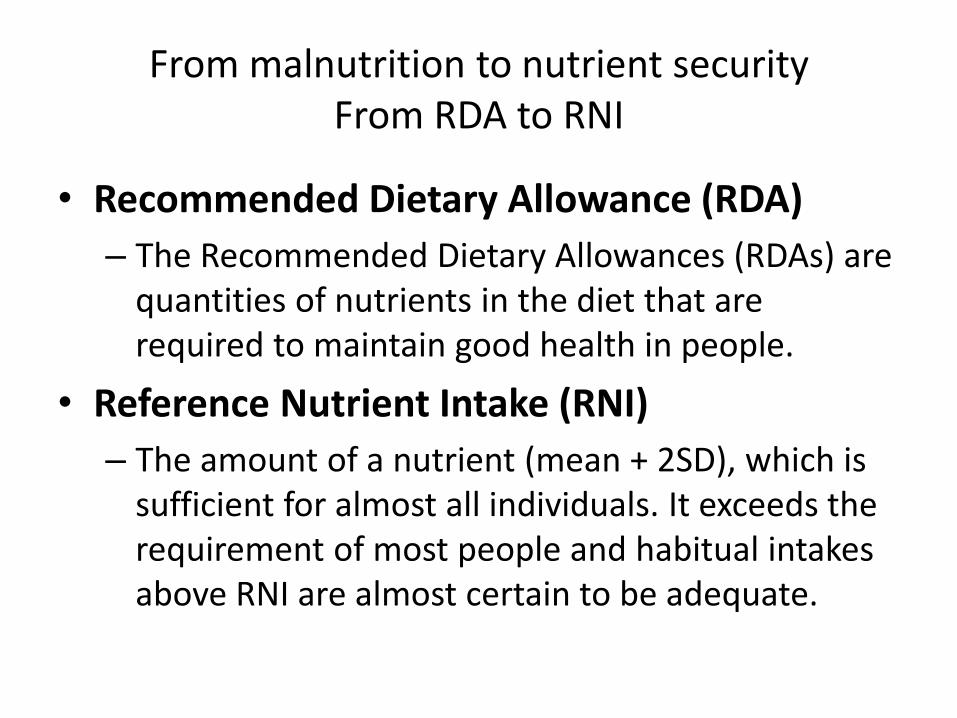
From malnutrition to nutrient security From RDA to RNI
• Recommended Dietary Allowance (RDA)
– The Recommended Dietary Allowances (RDAs) are quantities of nutrients in the diet that are required to maintain good health in people.
• Reference Nutrient Intake (RNI)
– The amount of a nutrient (mean + 2SD), which is sufficient for almost all individuals. It exceeds the requirement of most people and habitual intakes above RNI are almost certain to be adequate.
Why do we have so many nutrition indicators?
• Clinical Malnutrition • Clinical Signs
• Anthropometric malnutrition
• Biochemical Indicators
• Economic/Demographic indicators
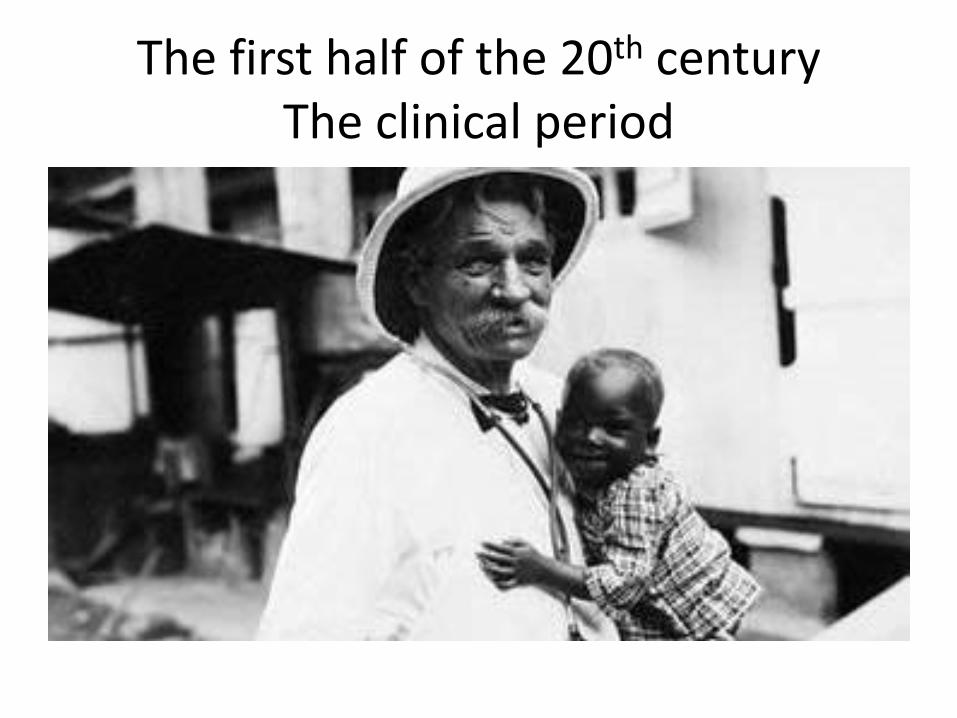
The first half of the 20th century The clinical period
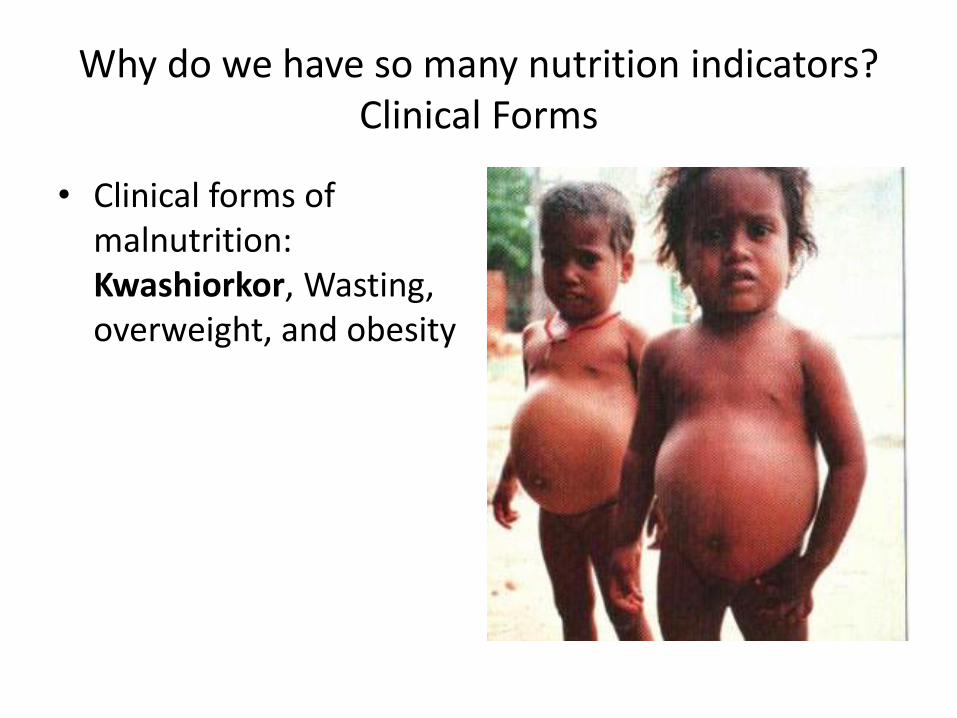
Why do we have so many nutrition indicators? Clinical Forms
• Clinical forms of malnutrition: Kwashiorkor, Wasting, overweight, and obesity
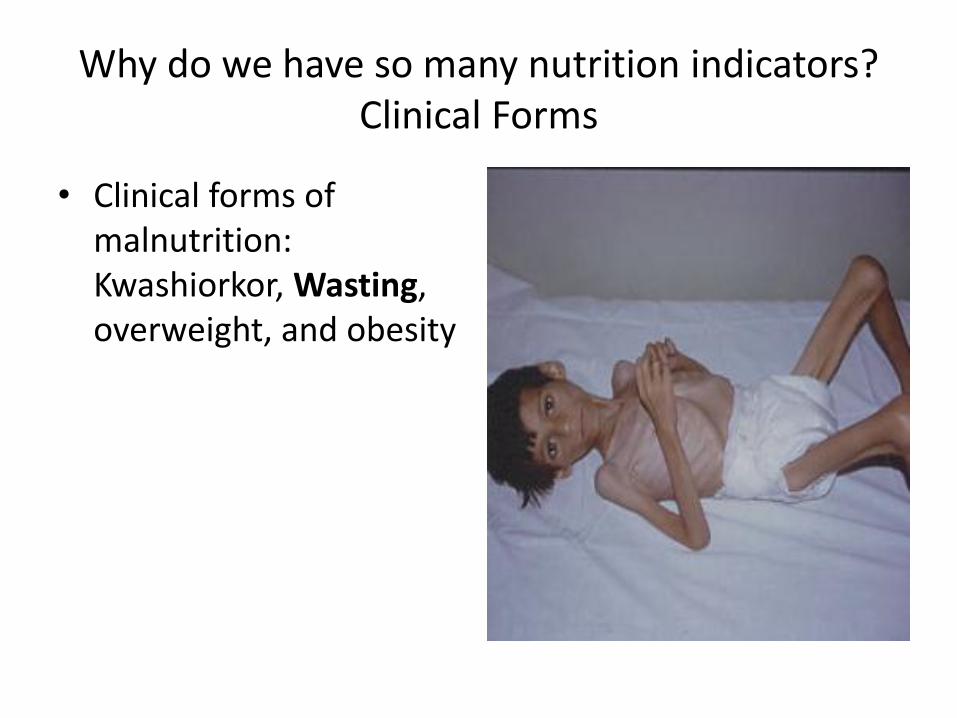
Why do we have so many nutrition indicators? Clinical Forms
• Clinical forms of malnutrition: Kwashiorkor, Wasting, overweight, and obesity
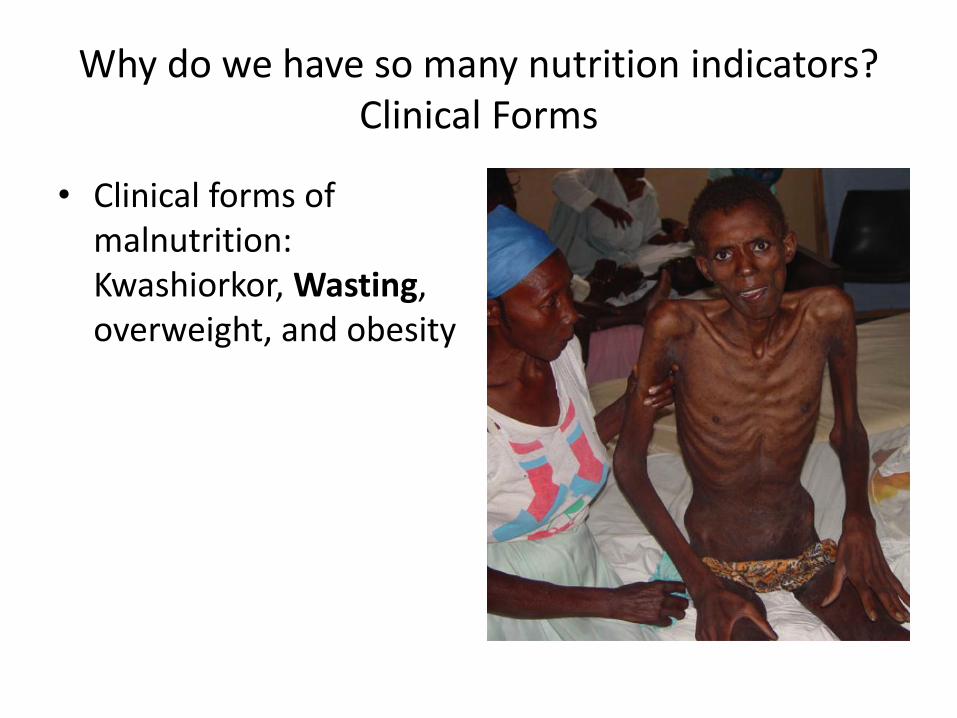
Why do we have so many nutrition indicators? Clinical Forms
• Clinical forms of malnutrition: Kwashiorkor, Wasting, overweight, and obesity
Why do we have so many nutrition indicators? Clinical Forms
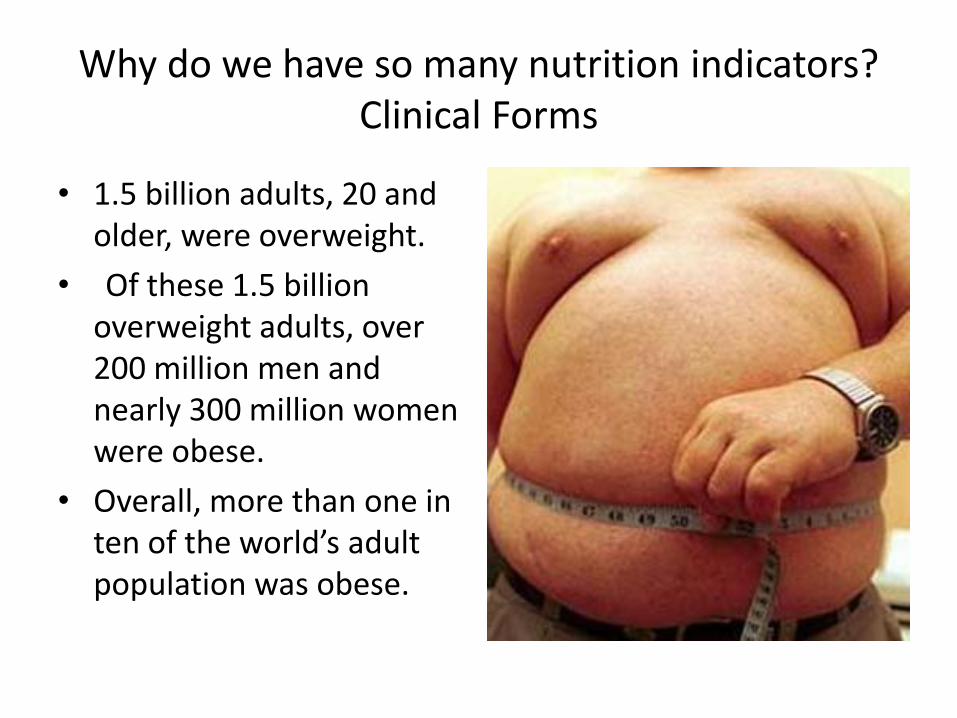
• 1.5 billion adults, 20 and older, were overweight.
• Of these 1.5 billion overweight adults, over 200 million men and nearly 300 million women were obese.
• Overall, more than one in ten of the world’s adult population was obese.
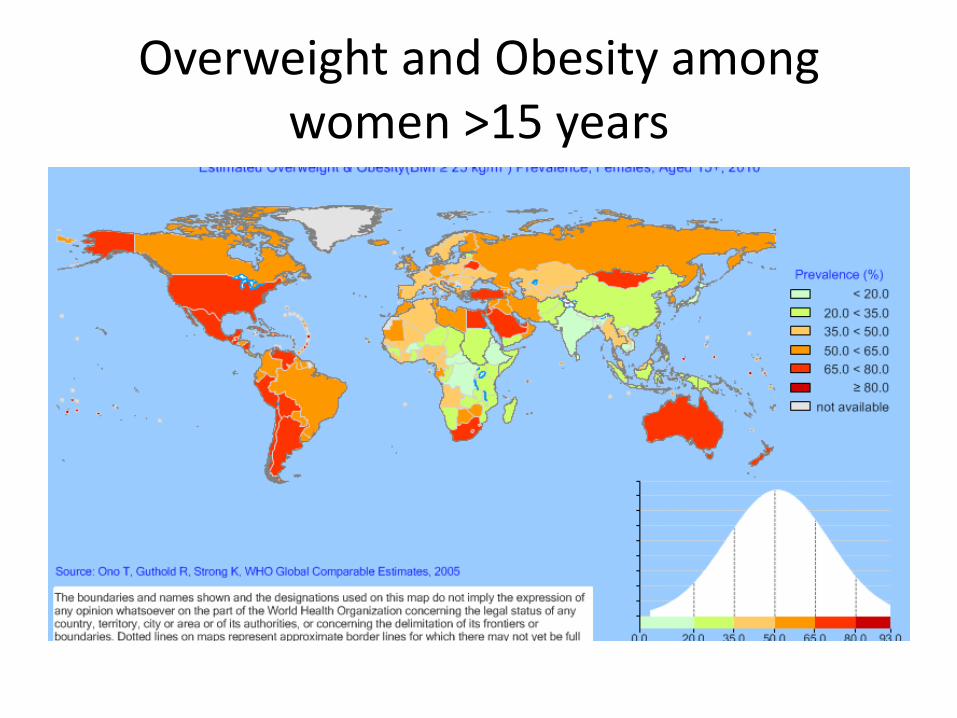
Overweight and Obesity among women >15 years
Why do we have so many nutrition indicators?
• Clinical Malnutrition
• Clinical Signs • Anthropometric malnutrition
• Biochemical Indicators
• Economic/Demographic indicators
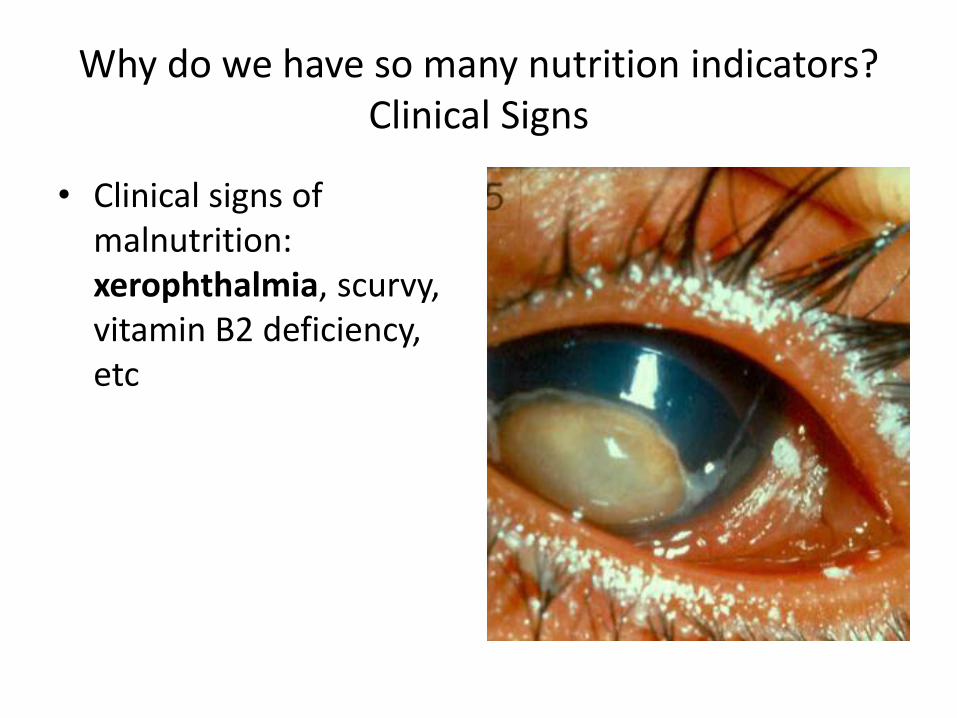
Why do we have so many nutrition indicators? Clinical Signs
• Clinical signs of malnutrition: xerophthalmia, scurvy, vitamin B2 deficiency, etc
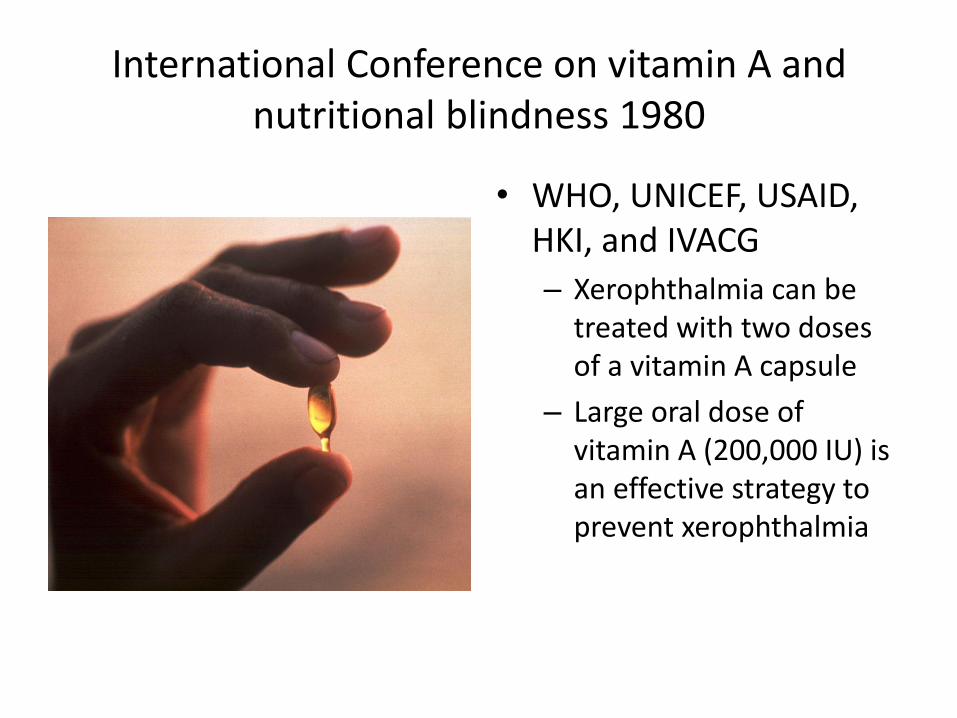
International Conference on vitamin A and nutritional blindness 1980
• WHO, UNICEF, USAID, HKI, and IVACG
– Xerophthalmia can be treated with two doses of a vitamin A capsule
– Large oral dose of vitamin A (200,000 IU) is an effective strategy to prevent xerophthalmia
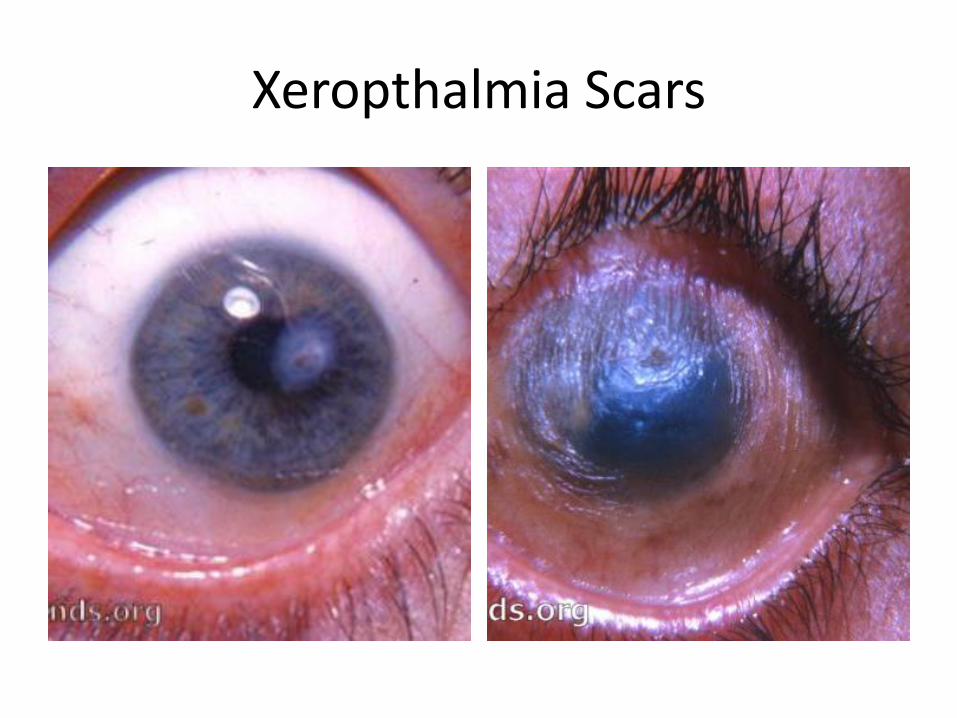
Xeropthalmia Scars
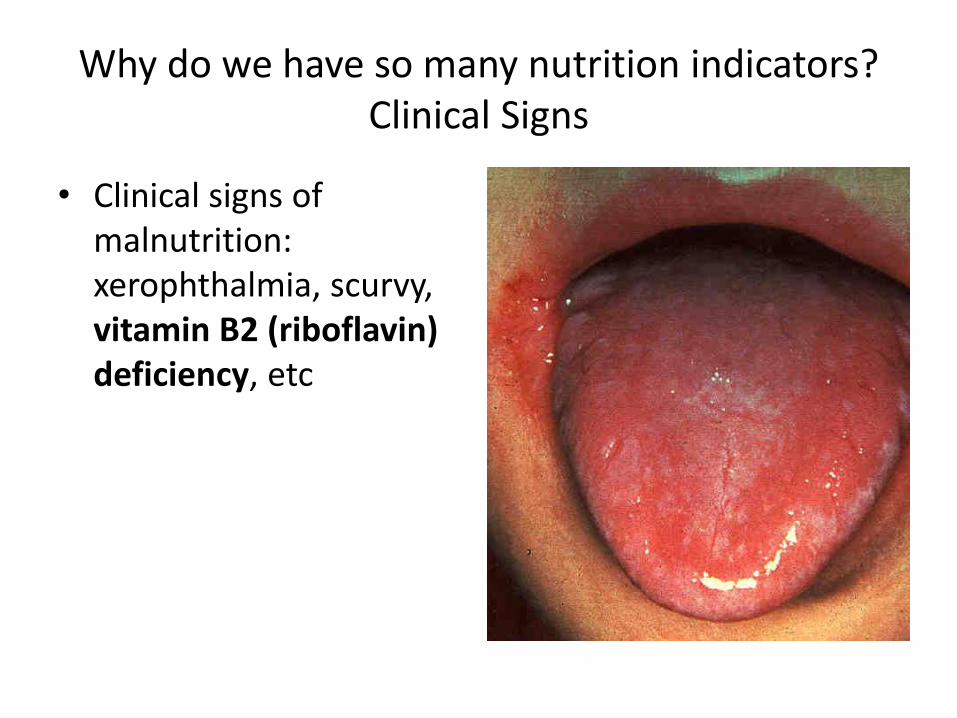
Why do we have so many nutrition indicators? Clinical Signs
• Clinical signs of malnutrition: xerophthalmia, scurvy, vitamin B2 (riboflavin) deficiency, etc
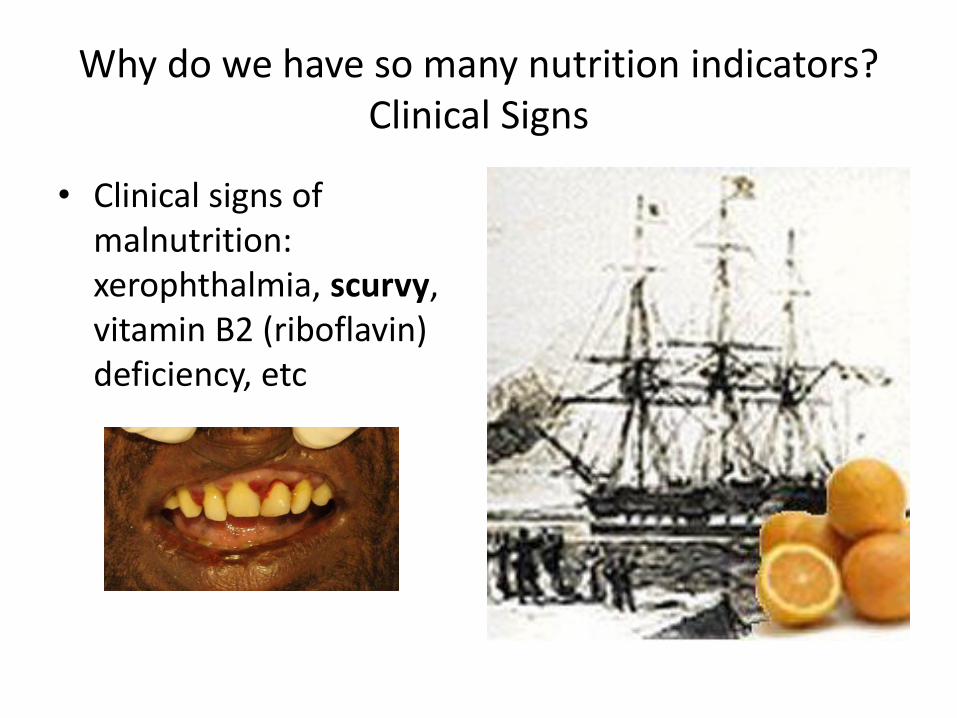
Why do we have so many nutrition indicators? Clinical Signs
• Clinical signs of malnutrition: xerophthalmia, scurvy, vitamin B2 (riboflavin) deficiency, etc
Why do we have so many nutrition indicators? Clinical Signs
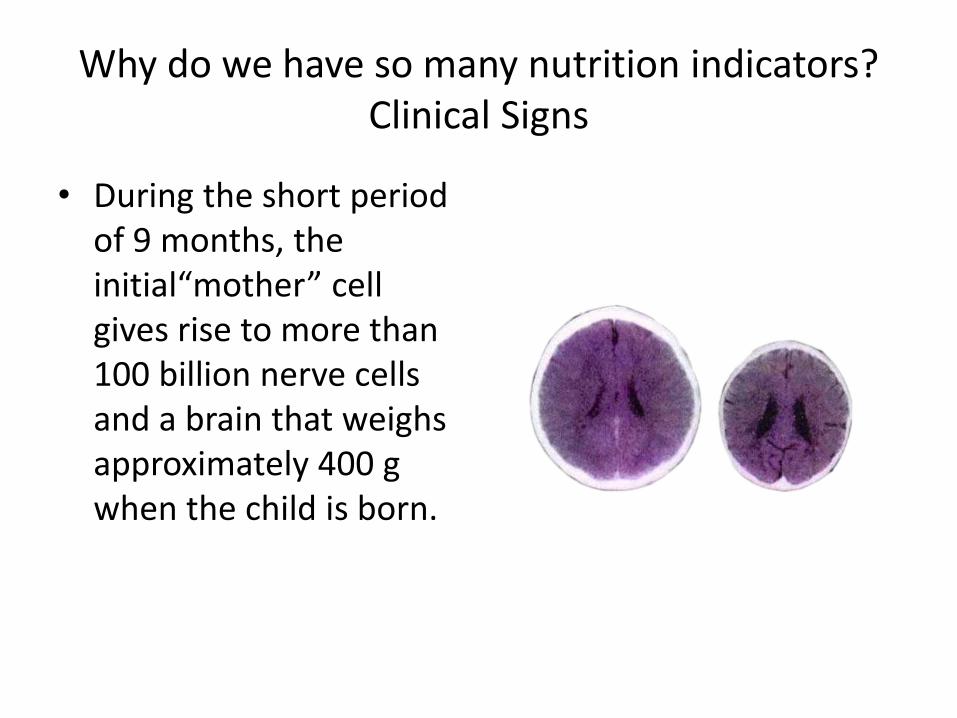
• During the short period of 9 months, the initial“mother” cell gives rise to more than 100 billion nerve cells and a brain that weighs approximately 400 g when the child is born.
Why do we have so many nutrition indicators? Clinical Signs
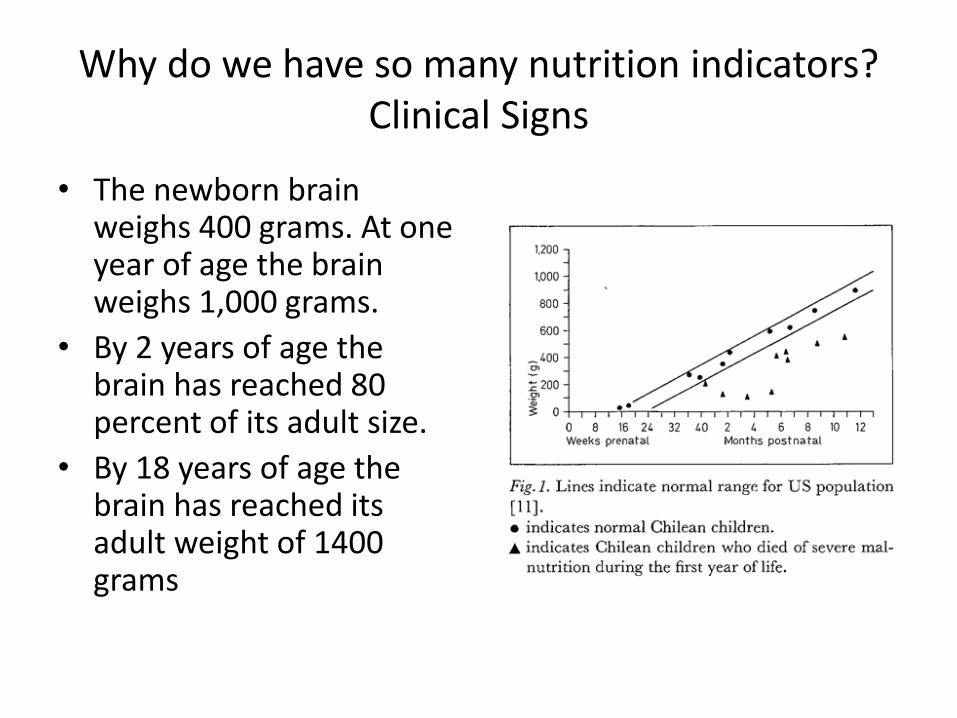
• The newborn brain weighs 400 grams. At one year of age the brain weighs 1,000 grams.
• By 2 years of age the brain has reached 80 percent of its adult size.
• By 18 years of age the brain has reached its adult weight of 1400 grams
Why do we have so many nutrition indicators?
• Clinical Malnutrition
• Clinical Signs
• Anthropometric malnutrition • Biochemical Indicators
• Economic/Demographic indicators
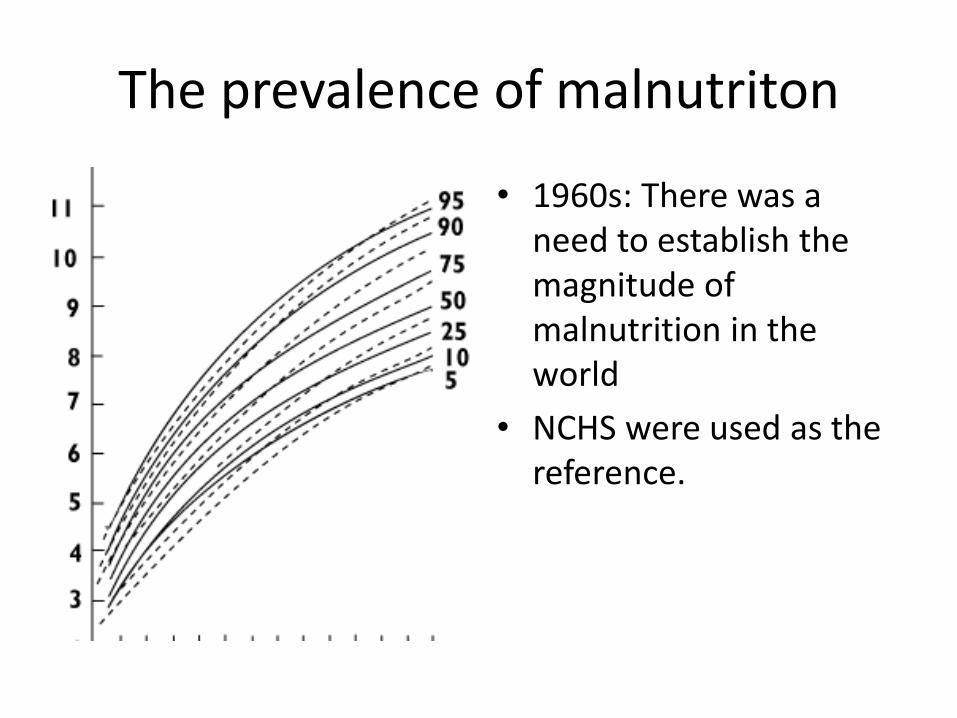
The prevalence of malnutriton
• 1960s: There was a need to establish the magnitude of malnutrition in the world
• NCHS were used as the reference.
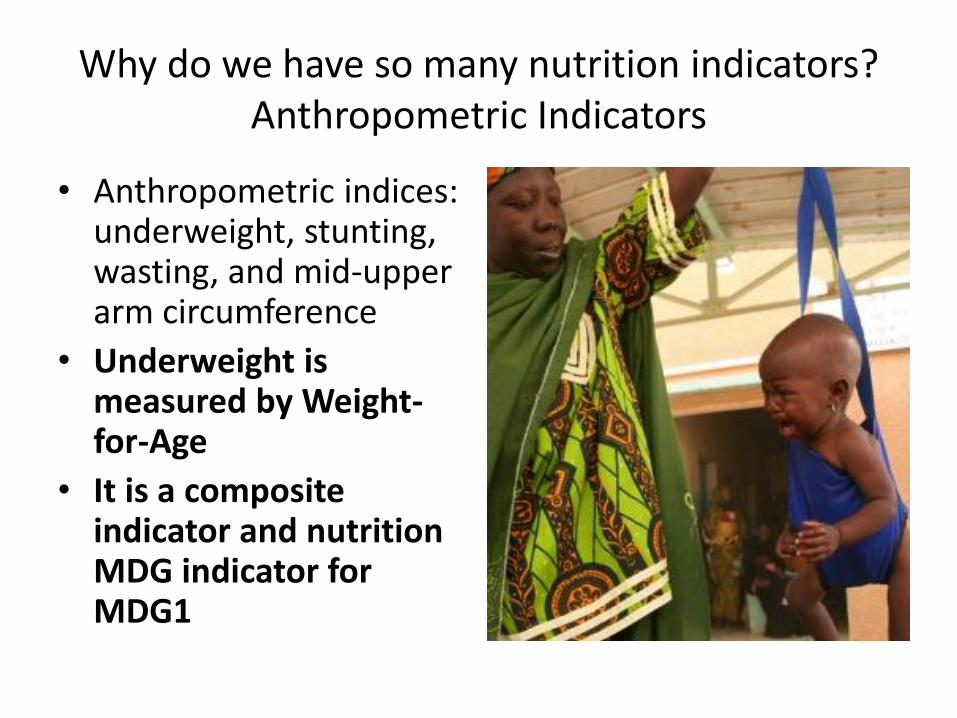
Why do we have so many nutrition indicators? Anthropometric Indicators
• Anthropometric indices: underweight, stunting, wasting, and mid-upper arm circumference
• Underweight is measured by Weight-for-Age
• It is a composite indicator and nutrition MDG indicator for MDG1
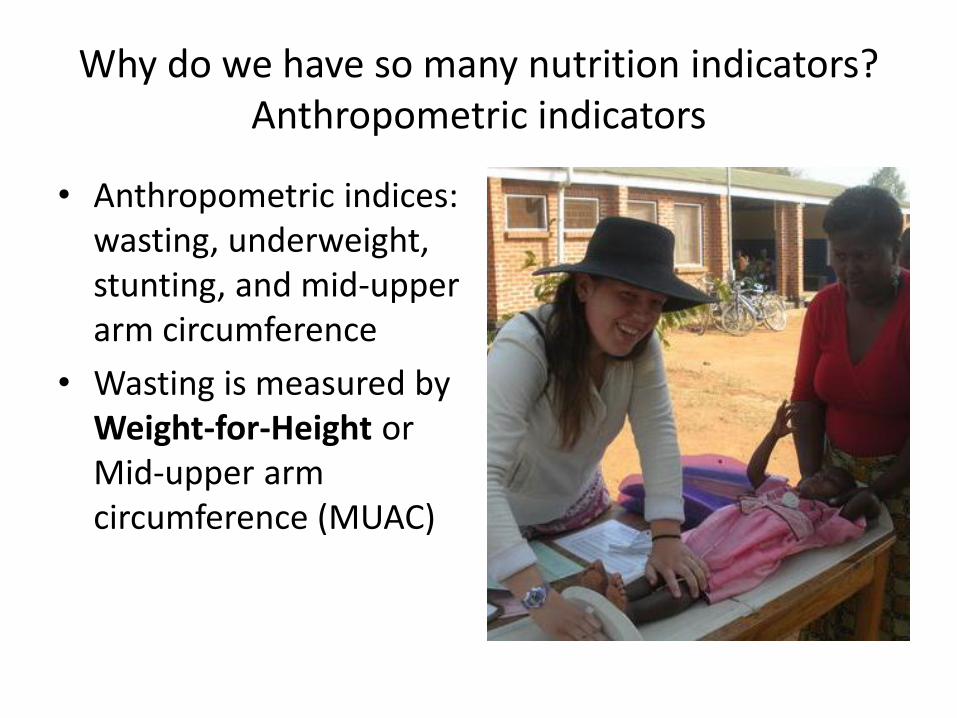
Why do we have so many nutrition indicators? Anthropometric indicators
• Anthropometric indices: wasting, underweight, stunting, and mid-upper arm circumference
• Wasting is measured by Weight-for-Height or Mid-upper arm circumference (MUAC)
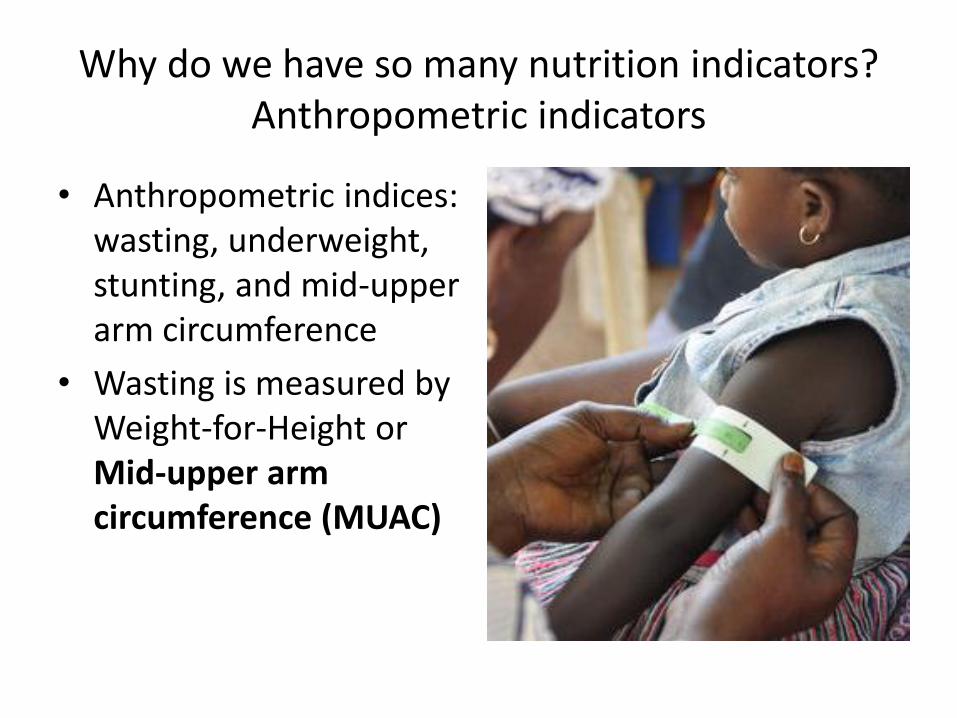
Why do we have so many nutrition indicators? Anthropometric indicators
• Anthropometric indices: wasting, underweight, stunting, and mid-upper arm circumference
• Wasting is measured by Weight-for-Height or Mid-upper arm circumference (MUAC)
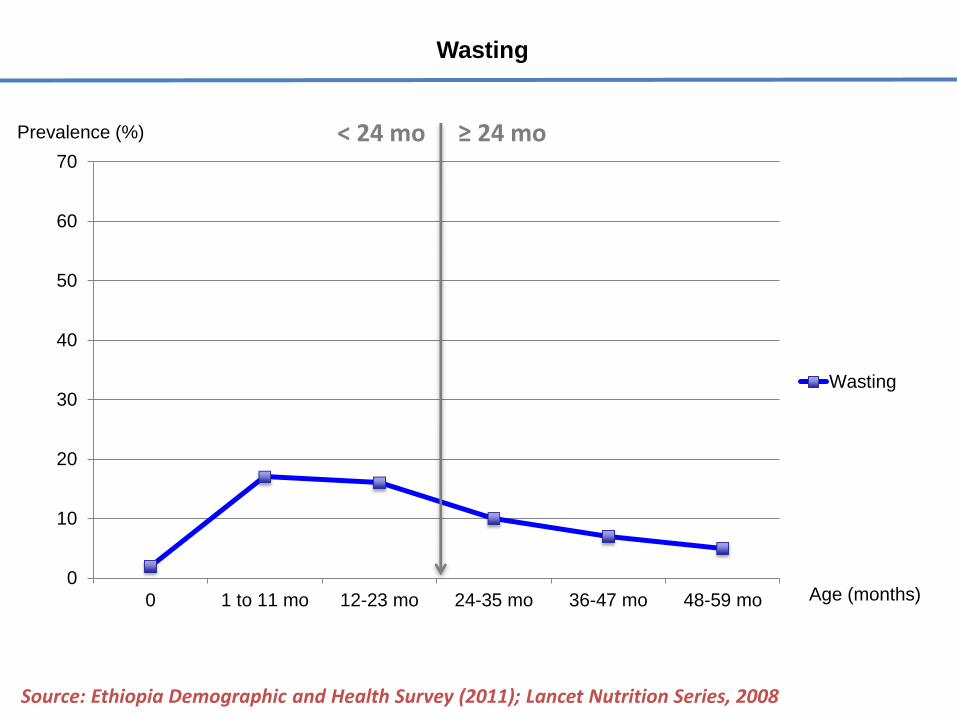
Wasting
0
10
20
30
40
50
60
70
0 1 to 11 mo 12-23 mo 24-35 mo 36-47 mo 48-59 mo
Wasting
Source: Ethiopia Demographic and Health Survey (2011); Lancet Nutrition Series, 2008
Age (months)
≥ 24 mo < 24 mo Prevalence (%)
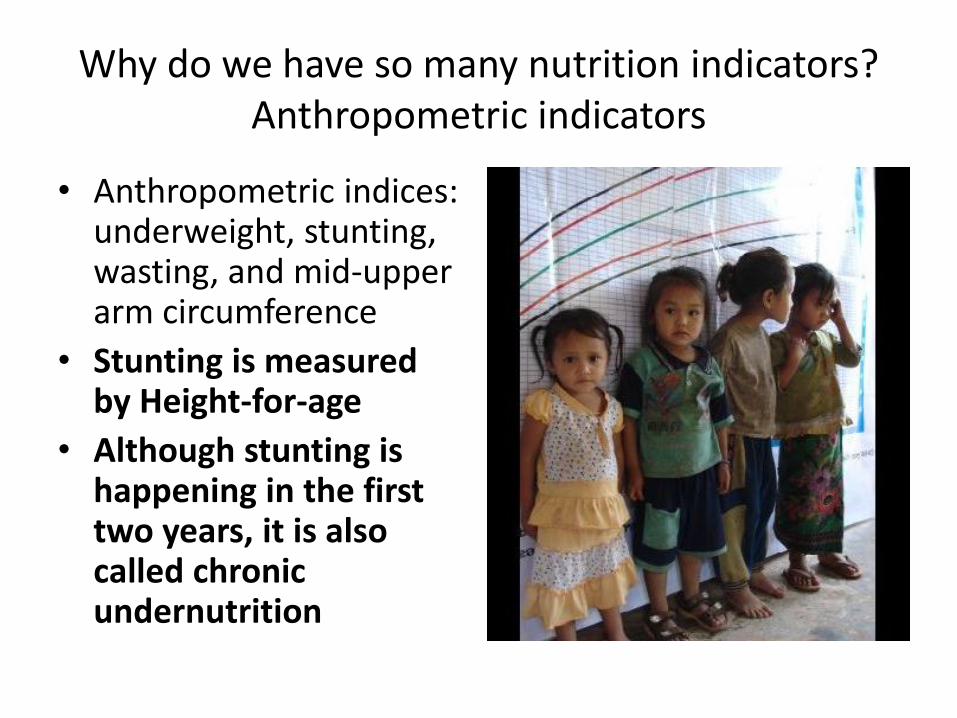
Why do we have so many nutrition indicators? Anthropometric indicators
• Anthropometric indices: underweight, stunting, wasting, and mid-upper arm circumference
• Stunting is measured by Height-for-age
• Although stunting is happening in the first two years, it is also called chronic undernutrition
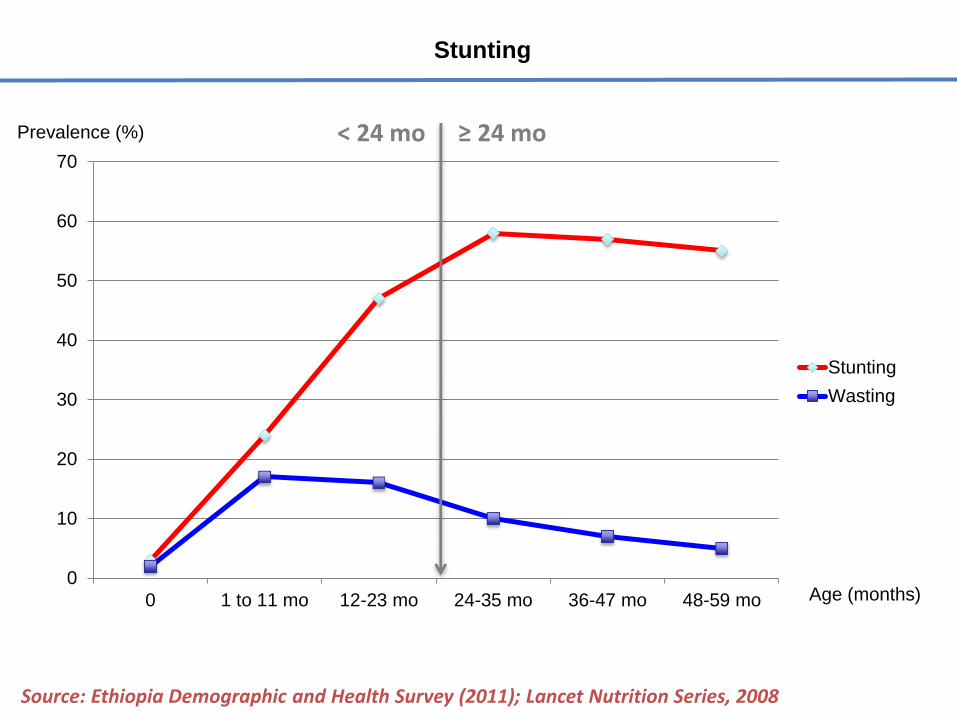
Stunting
0
10
20
30
40
50
60
70
0 1 to 11 mo 12-23 mo 24-35 mo 36-47 mo 48-59 mo
Stunting
Wasting
Source: Ethiopia Demographic and Health Survey (2011); Lancet Nutrition Series, 2008
Age (months)
≥ 24 mo < 24 mo Prevalence (%)
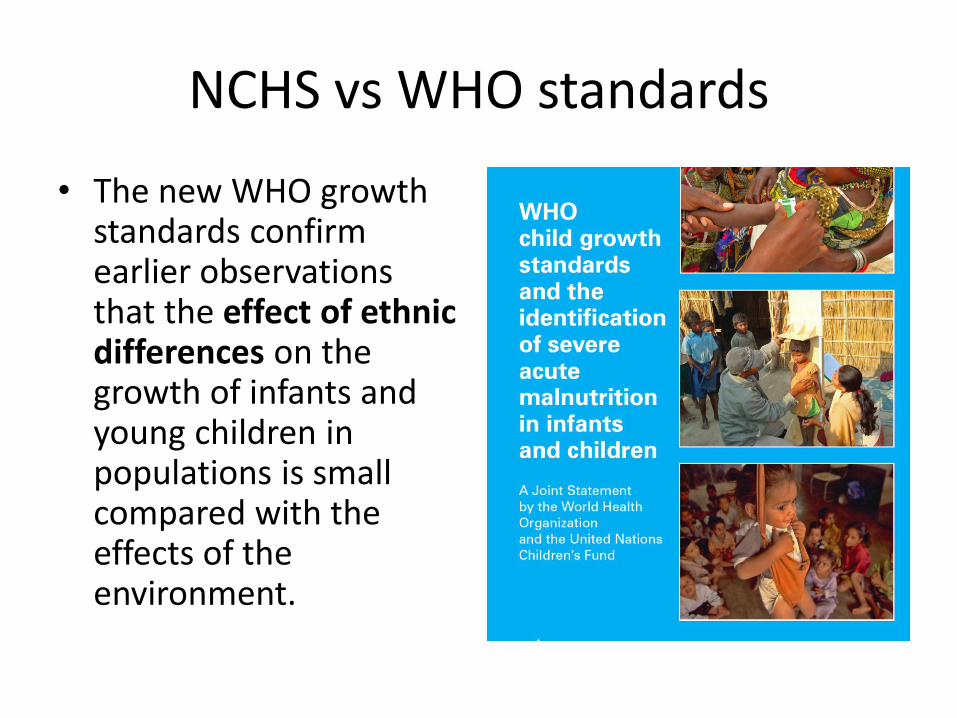
NCHS vs WHO standards
• The new WHO growth standards confirm earlier observations that the effect of ethnic differences on the growth of infants and young children in populations is small compared with the effects of the environment.
Why do we have so many nutrition indicators?
• Clinical Malnutrition
• Clinical Signs
• Anthropometric malnutrition
• Biochemical Indicators • Economic/Demographic indicators
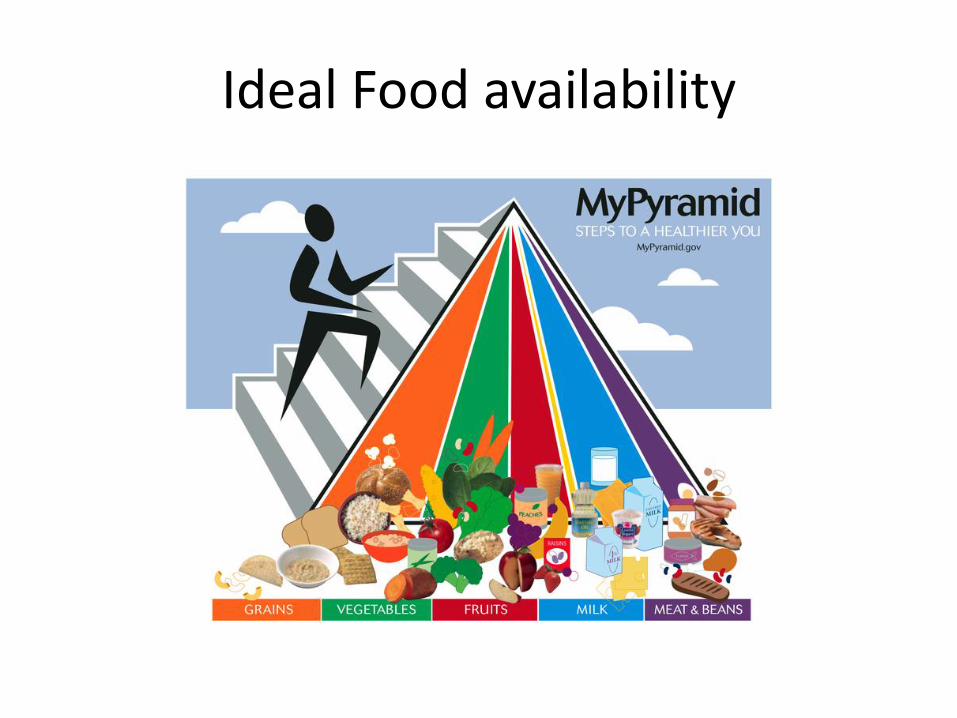
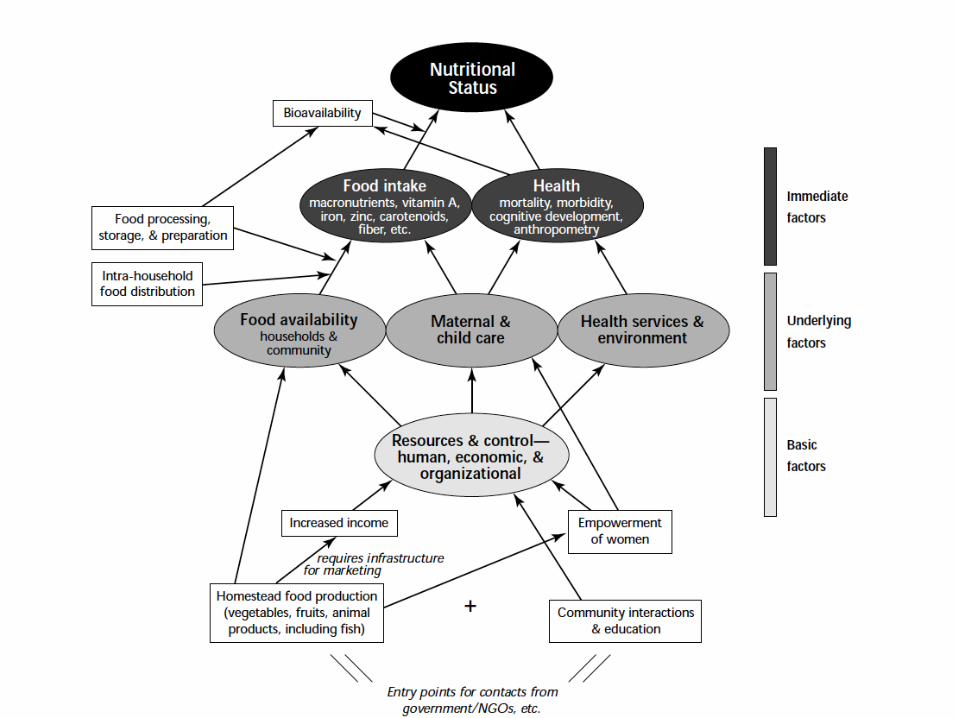
Ideal Food availability
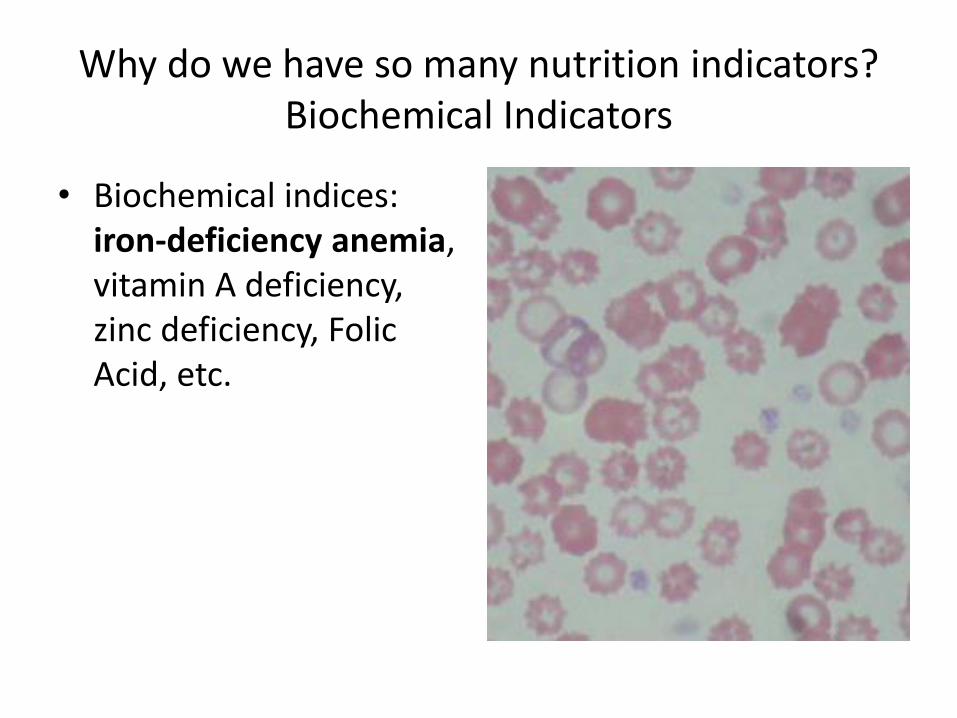
Why do we have so many nutrition indicators? Biochemical Indicators
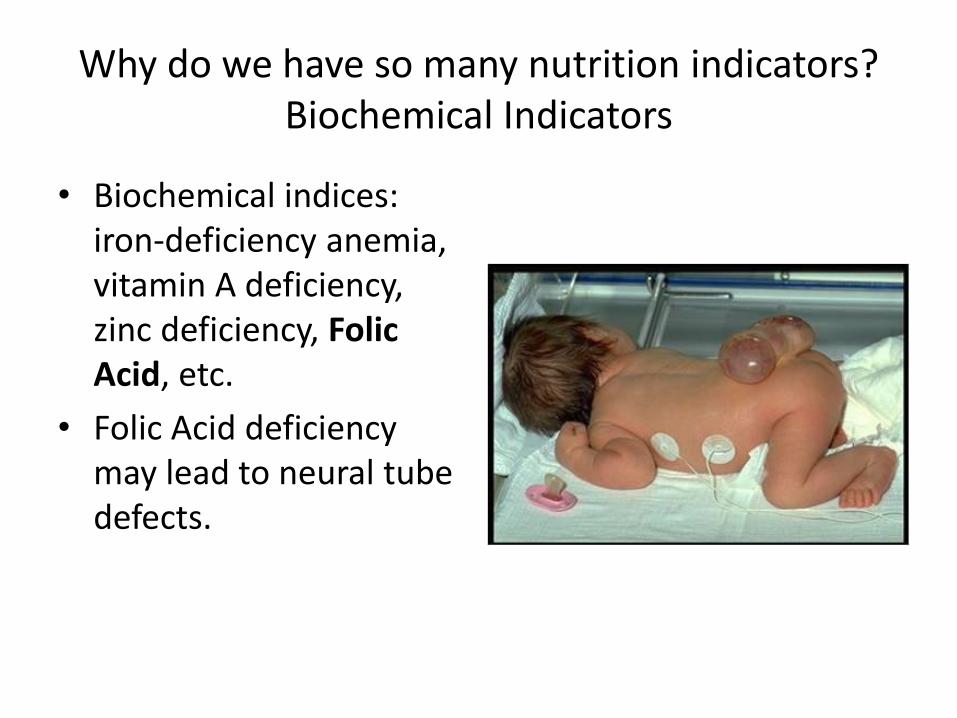
• Biochemical indices: iron-deficiency anemia, vitamin A deficiency, zinc deficiency, Folic Acid, etc.
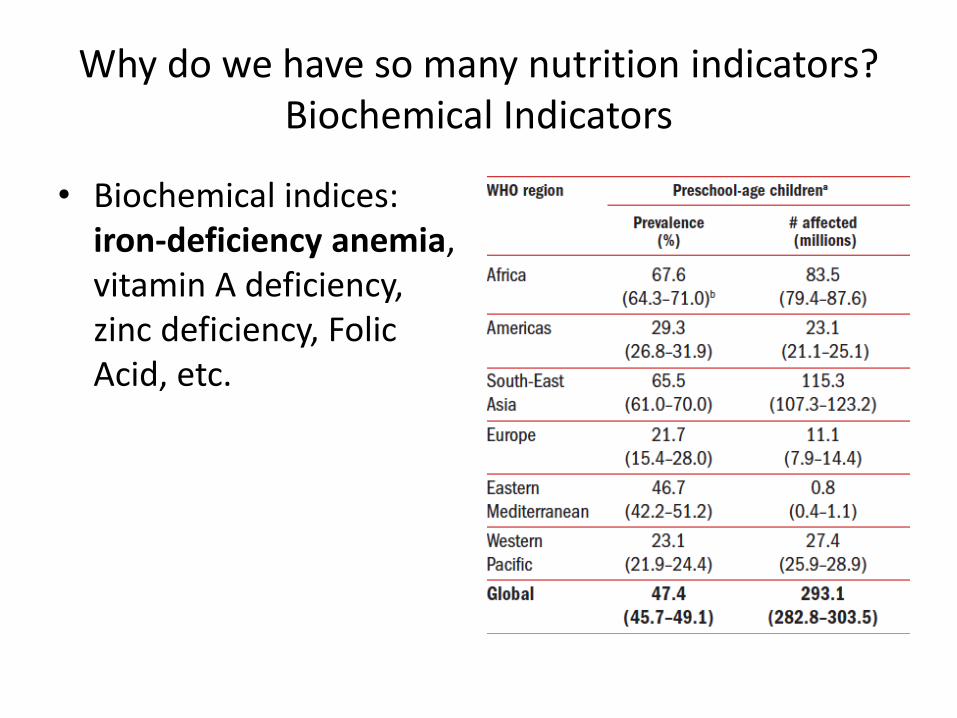
Why do we have so many nutrition indicators? Biochemical Indicators
• Biochemical indices: iron-deficiency anemia, vitamin A deficiency, zinc deficiency, Folic Acid, etc.
Why do we have so many nutrition indicators? Biochemical Indicators
• Biochemical indices: iron-deficiency anemia, vitamin A deficiency, zinc deficiency, Folic Acid, etc.
• Folic Acid deficiency may lead to neural tube defects.
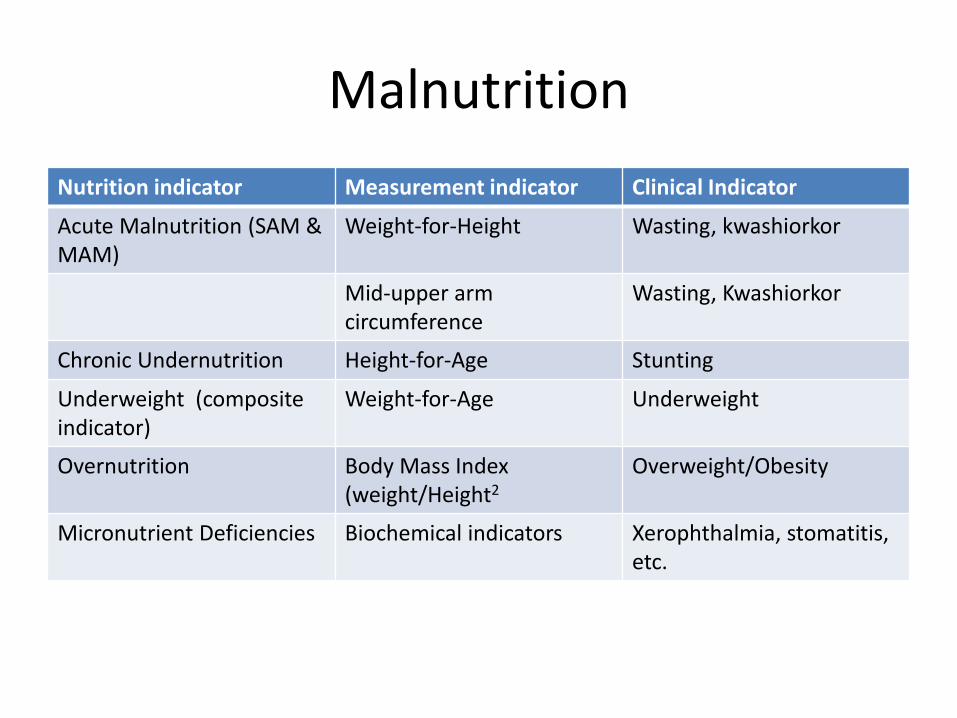
Malnutrition
Nutrition indicator Measurement indicator Clinical Indicator
Acute Malnutrition (SAM & MAM)
Weight-for-Height Wasting, kwashiorkor
Mid-upper arm circumference
Wasting, Kwashiorkor
Chronic Undernutrition Height-for-Age Stunting
Underweight (composite indicator)
Weight-for-Age Underweight
Overnutrition Body Mass Index (weight/Height2
Overweight/Obesity
Micronutrient Deficiencies Biochemical indicators Xerophthalmia, stomatitis, etc.
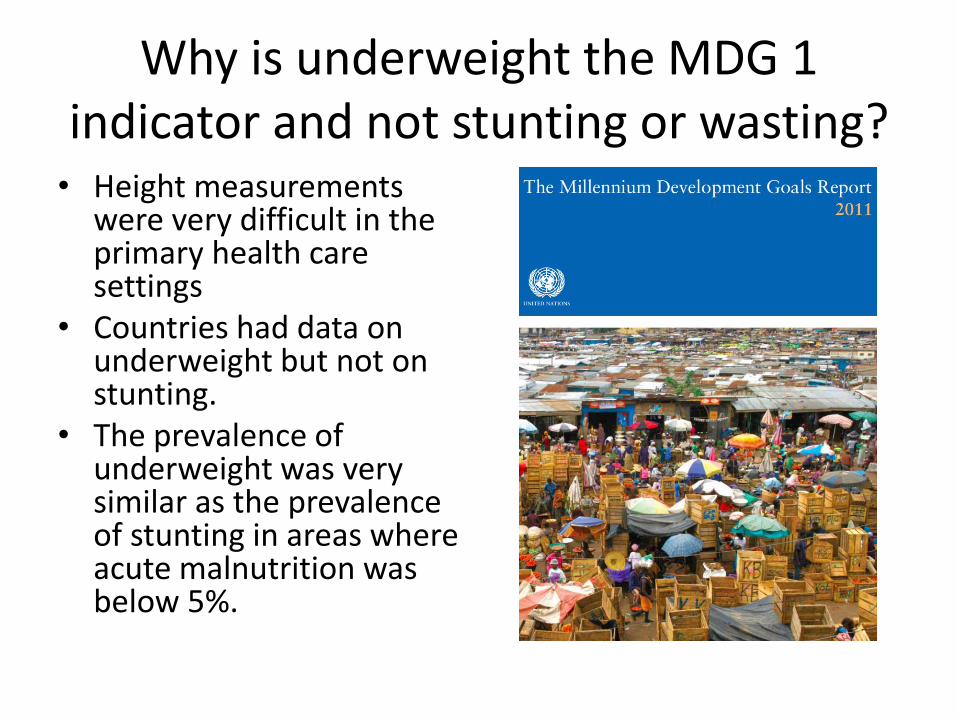
Why is underweight the MDG 1 indicator and not stunting or wasting? • Height measurements
were very difficult in the primary health care settings
• Countries had data on underweight but not on stunting.
• The prevalence of underweight was very similar as the prevalence of stunting in areas where acute malnutrition was below 5%.
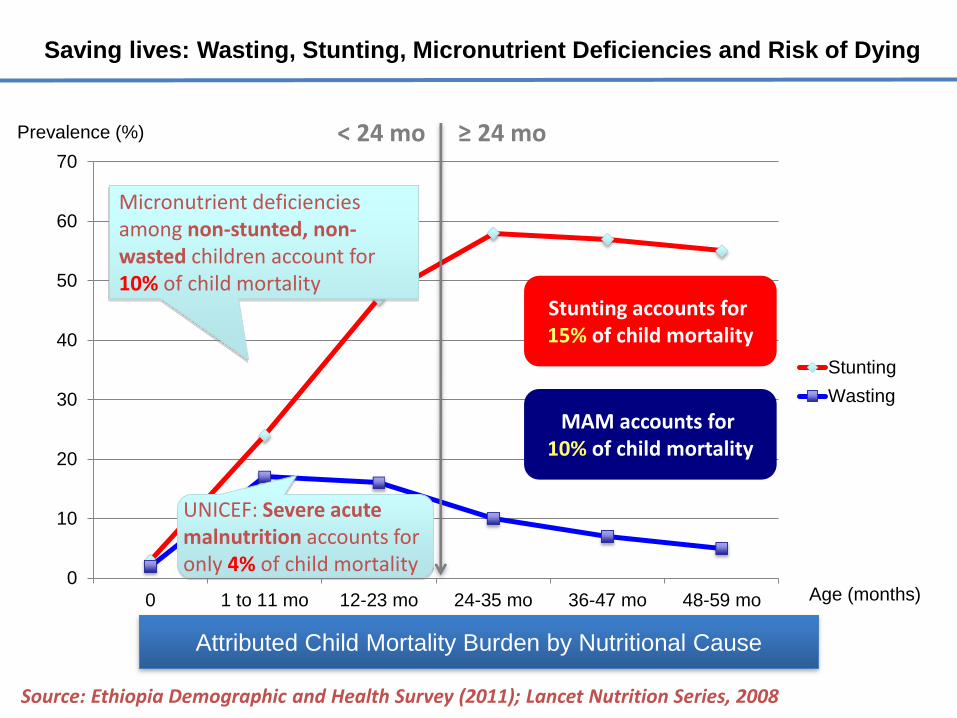
Saving lives: Wasting, Stunting, Micronutrient Deficiencies and Risk of Dying
0
10
20
30
40
50
60
70
0 1 to 11 mo 12-23 mo 24-35 mo 36-47 mo 48-59 mo
Stunting
Wasting
Source: Ethiopia Demographic and Health Survey (2011); Lancet Nutrition Series, 2008
Age (months)
Stunting accounts for 15% of child mortality
MAM accounts for 10% of child mortality
Micronutrient deficiencies among non-stunted, non-wasted children account for 10% of child mortality
UNICEF: Severe acute malnutrition accounts for only 4% of child mortality
≥ 24 mo < 24 mo Prevalence (%)
Attributed Child Mortality Burden by Nutritional Cause
The chronic malnutrition misconception
• Chronic Malnutrition or stunting (height-for-age) develops in a very short time frame (from conception to 24 months = first 1000 days) but is called chronic because you can’t treat stunting effectively after 2 years!;
• Prevention of stunting does not have to take a long time if the right interventions are used in the window of children’s first 1000 days.
The Consequences of Stunting (Lancet 2008)
- 42 -
• Chronic Diseases: Children who are undernourished in the first 2 years of life and who put on weight rapidly later in childhood and in adolescence are at high risk of chronic diseases related to nutrition
• The window of prevention = the first 1000 days = from conception to 24 months
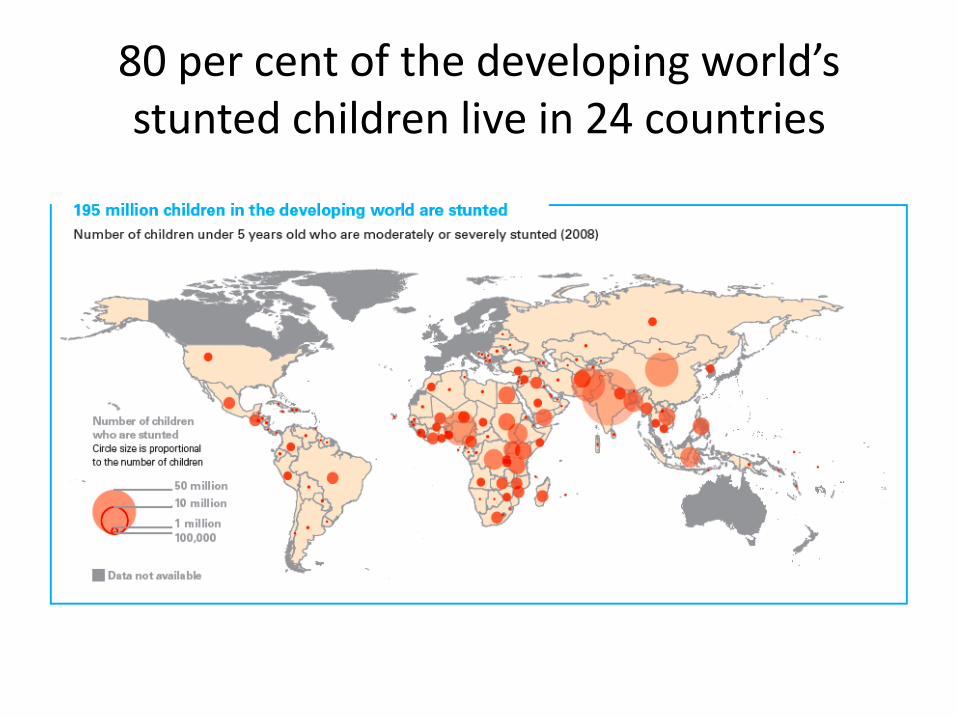
80 per cent of the developing world’s stunted children live in 24 countries
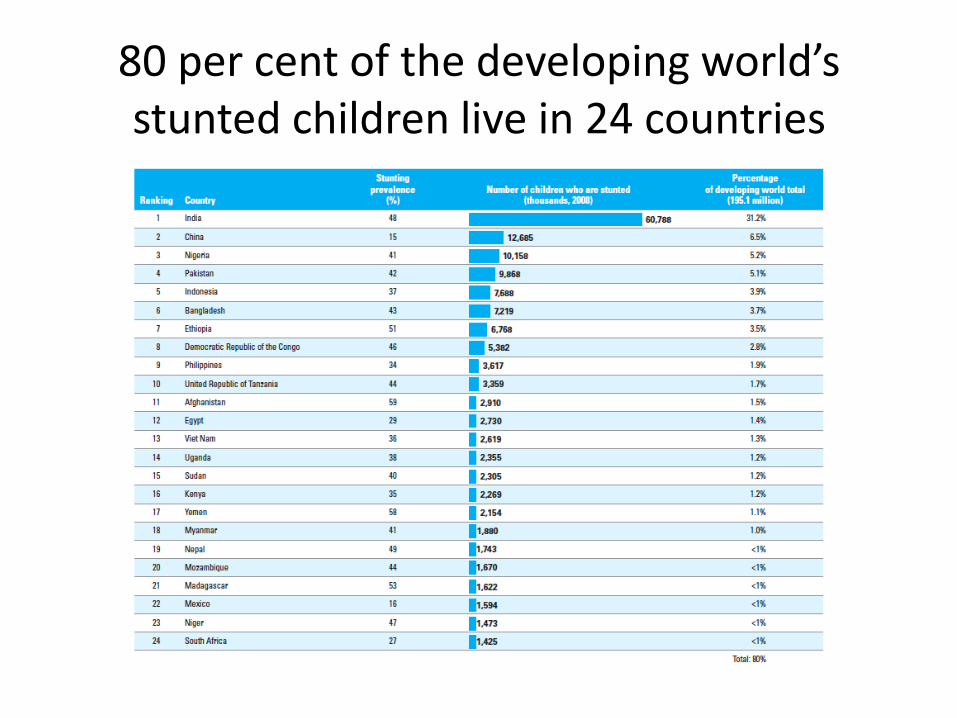
80 per cent of the developing world’s stunted children live in 24 countries
Why do we have so many nutrition indicators?
• Clinical Malnutrition
• Clinical Signs
• Anthropometric malnutrition
• Biochemical Indicators
• Economic/Demographic indicators
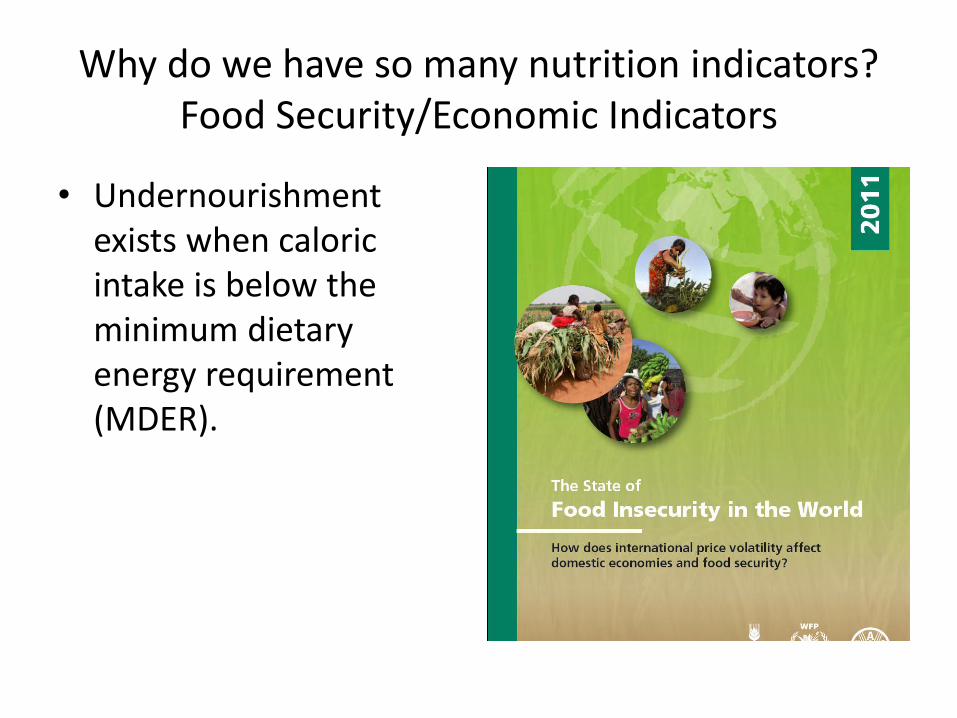
Why do we have so many nutrition indicators? Food Security/Economic Indicators
• Undernourishment exists when caloric intake is below the minimum dietary energy requirement (MDER).
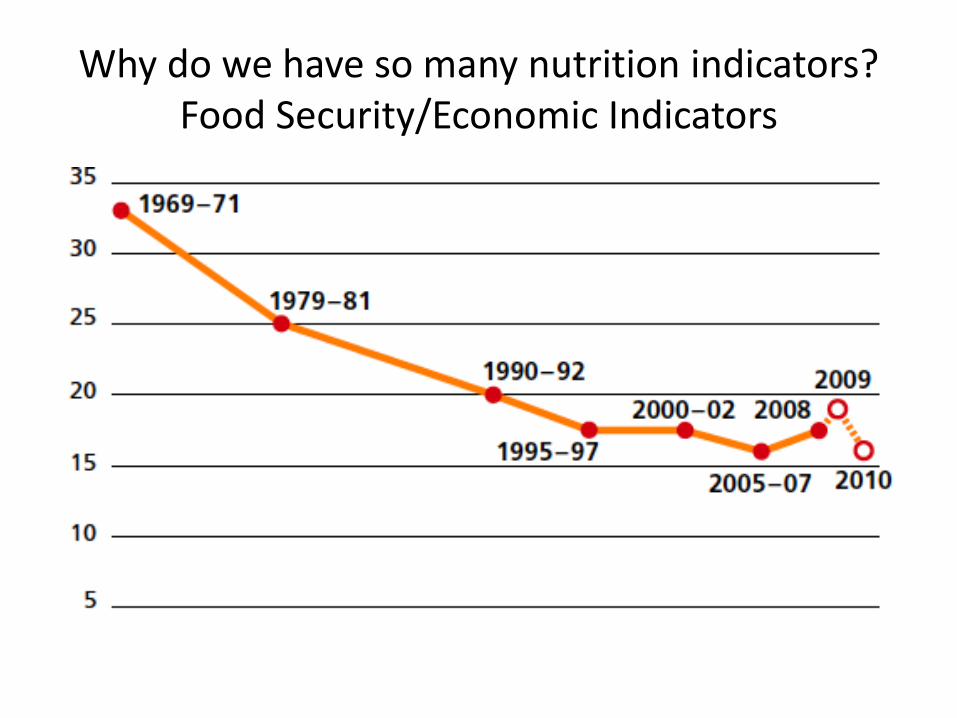
Why do we have so many nutrition indicators? Food Security/Economic Indicators
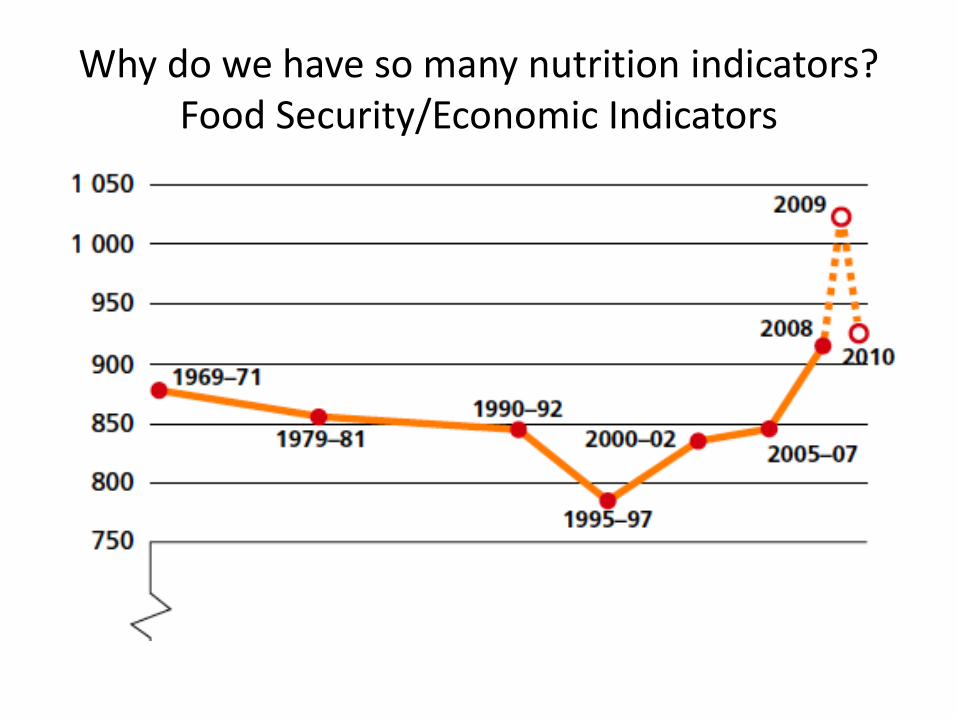
Why do we have so many nutrition indicators? Food Security/Economic Indicators
What is the link between food security and nutrition security?
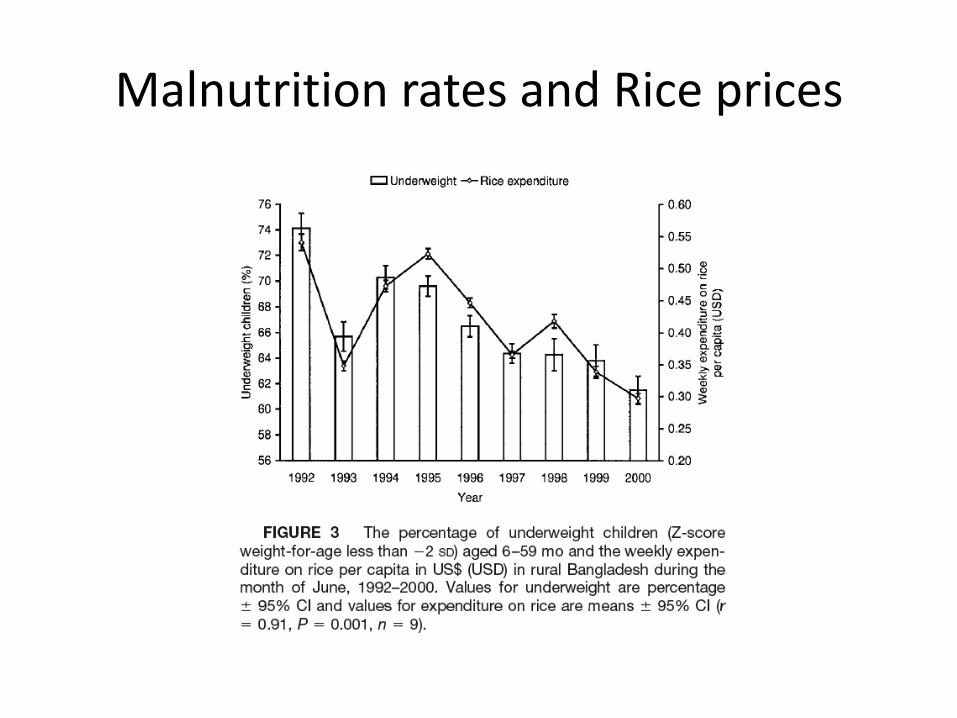
Malnutrition rates and Rice prices
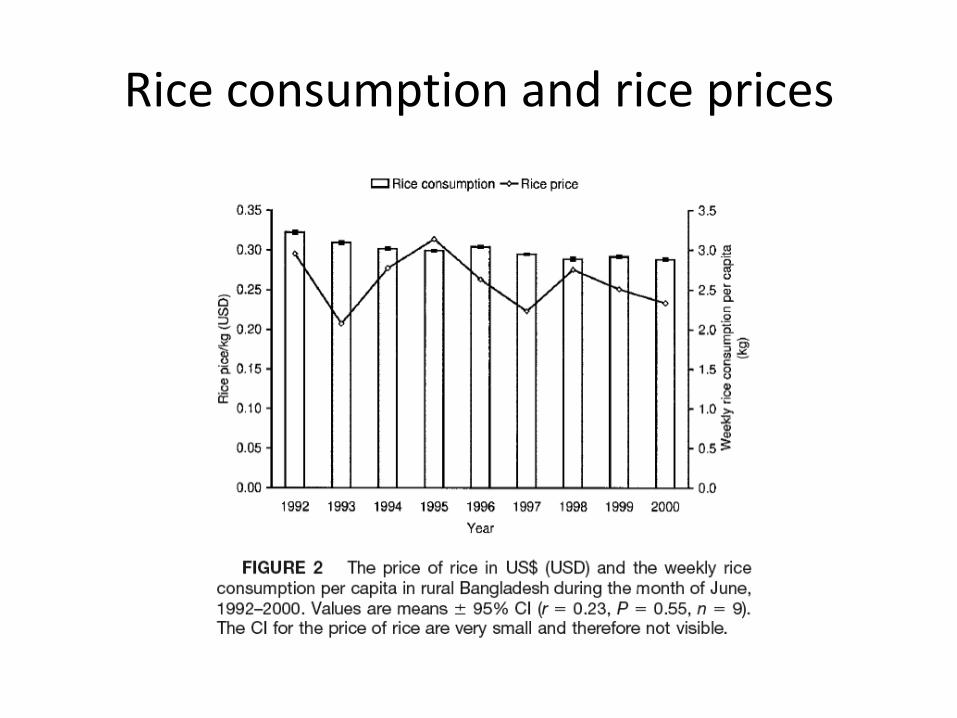
Rice consumption and rice prices
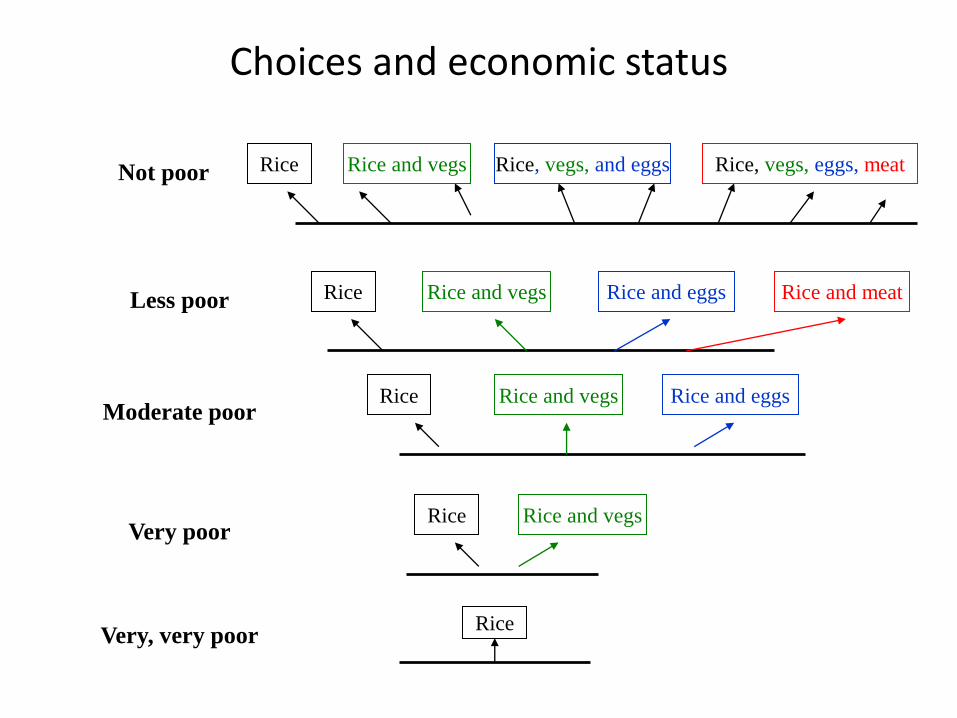
Choices and economic status
Very, very poor
Less poor
Not poor
Moderate poor
Very poor
Rice
Rice Rice and vegs
Rice
Rice
Rice and vegs Rice and eggs
Rice and vegs Rice and eggs Rice and meat
Rice Rice and vegs Rice, vegs, and eggs Rice, vegs, eggs, meat
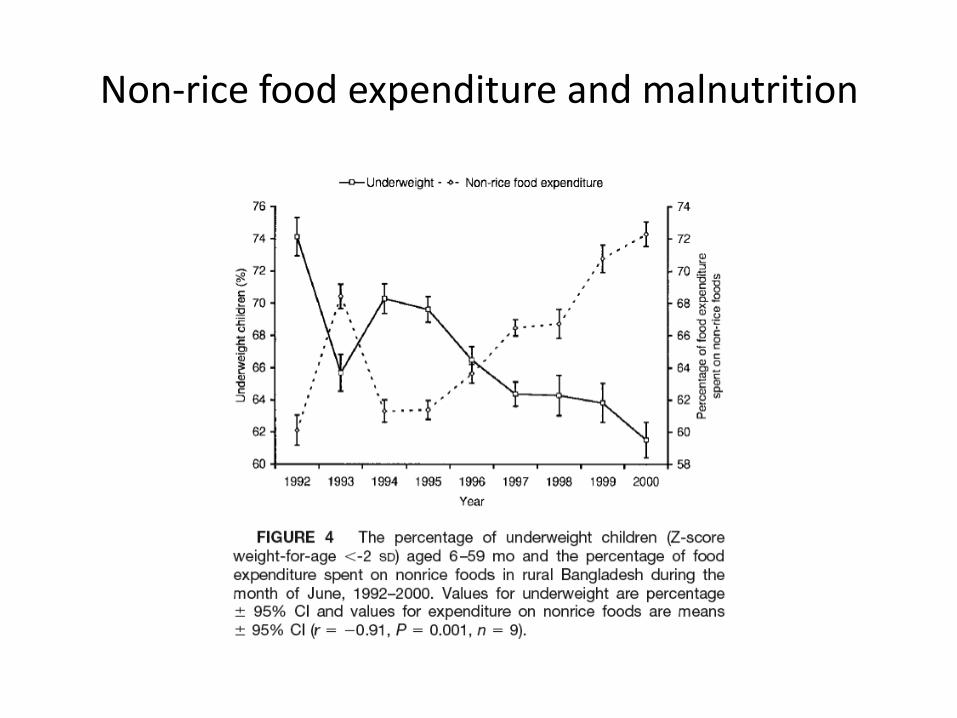
Non-rice food expenditure and malnutrition
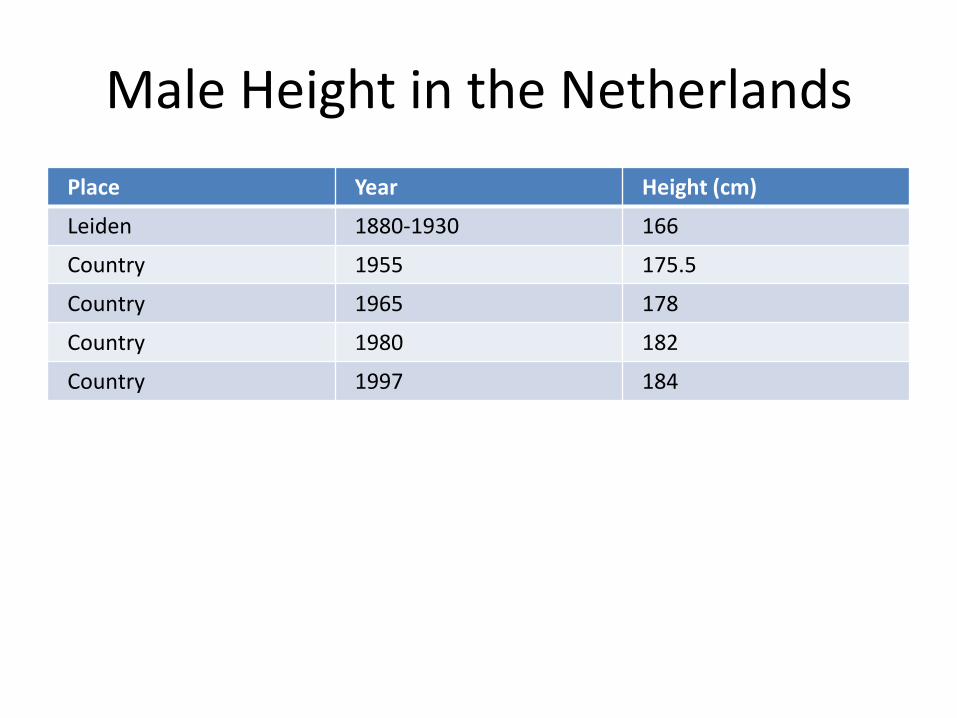
Male Height in the Netherlands
Place Year Height (cm)
Leiden 1880-1930 166
Country 1955 175.5
Country 1965 178
Country 1980 182
Country 1997 184
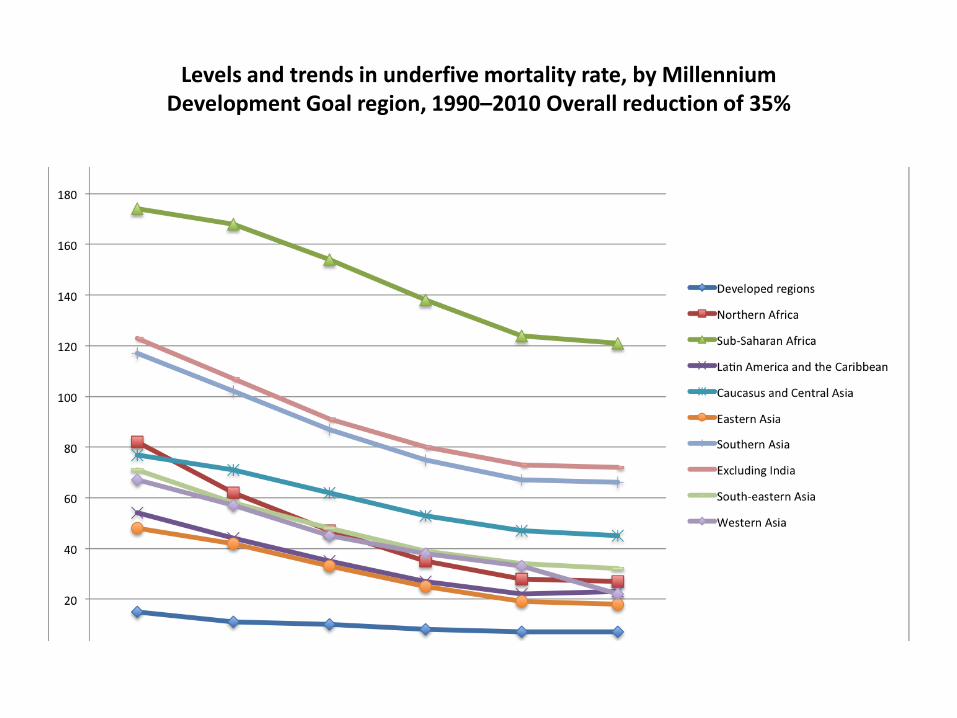
Levels and trends in underfive mortality rate, by Millennium Development Goal region, 1990–2010 Overall reduction of 35%
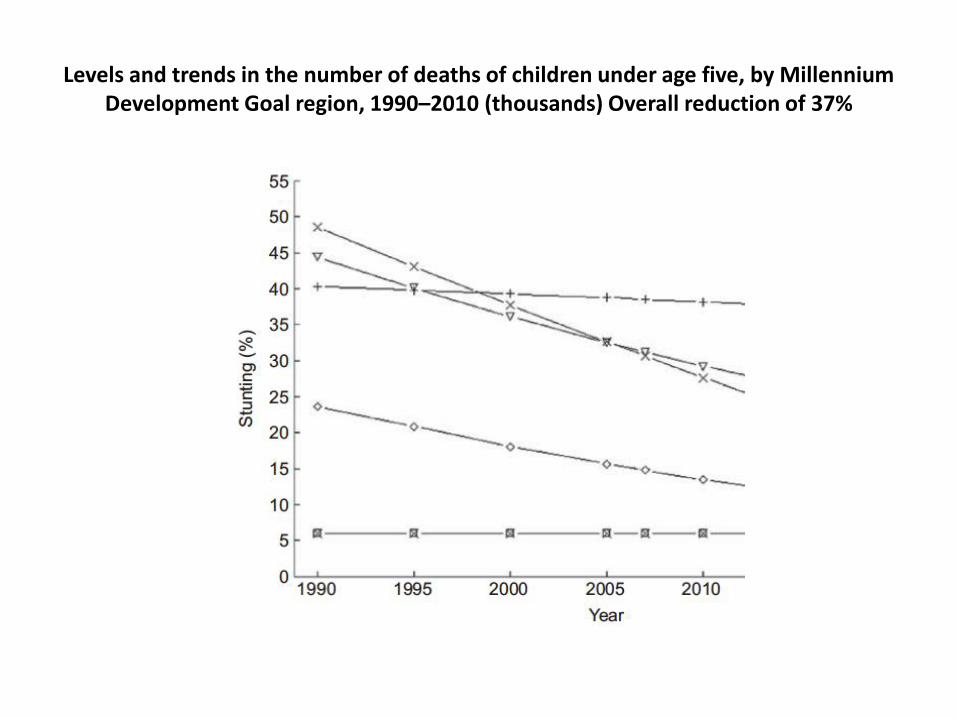
Levels and trends in the number of deaths of children under age five, by Millennium Development Goal region, 1990–2010 (thousands) Overall reduction of 37%
The nutritional needs of infants
• The right food at the right time
• Nutrient Dense
• Micronutrients
• Fatty Acids
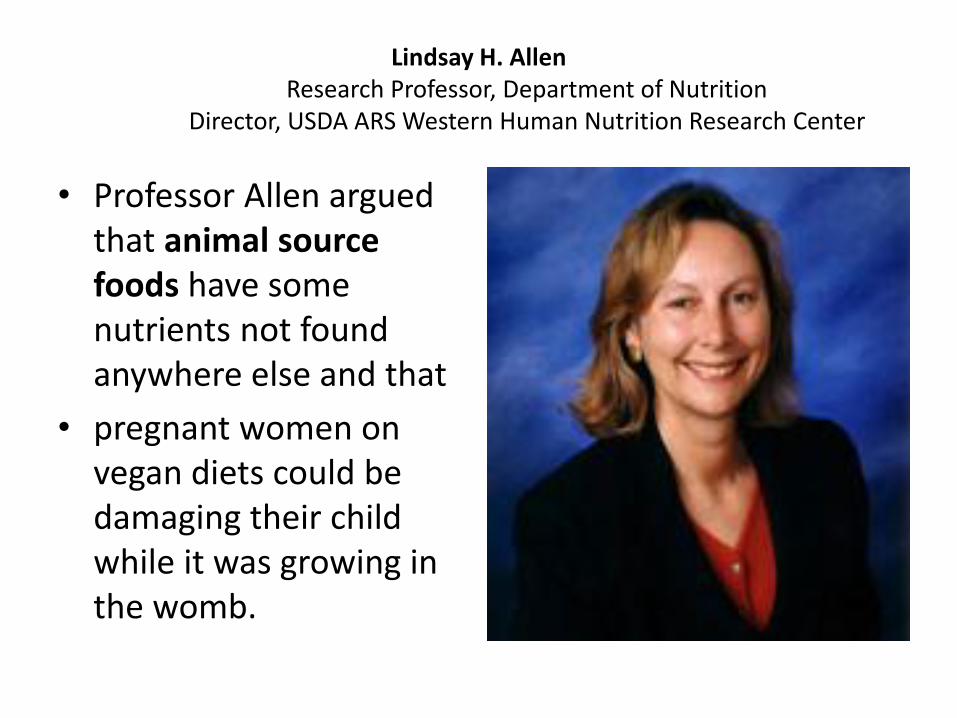
Lindsay H. Allen Research Professor, Department of Nutrition
Director, USDA ARS Western Human Nutrition Research Center
• Professor Allen argued that animal source foods have some nutrients not found anywhere else and that
• pregnant women on vegan diets could be damaging their child while it was growing in the womb.
Ancient Egyptians
The ancient Egyptians
described the symptoms of
nightblindness and used liver
as therapy
Sources of vitamin A
• Plant foods: fruits and vegetables (carotenoids)
• Animal foods (retinol)
• Carotenoids need to be converted to retinol to be effective as vitamin A; The scientific world always assumed a 1:6 conversion rate.
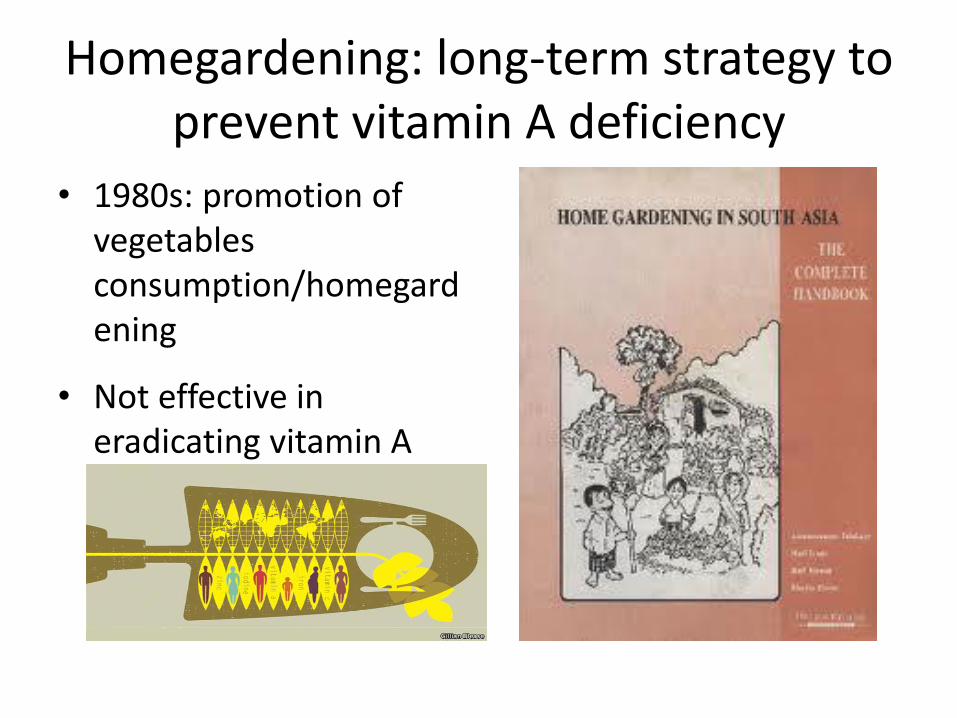
Homegardening: long-term strategy to prevent vitamin A deficiency
• 1980s: promotion of vegetables consumption/homegardening
• Not effective in eradicating vitamin A deficiency.
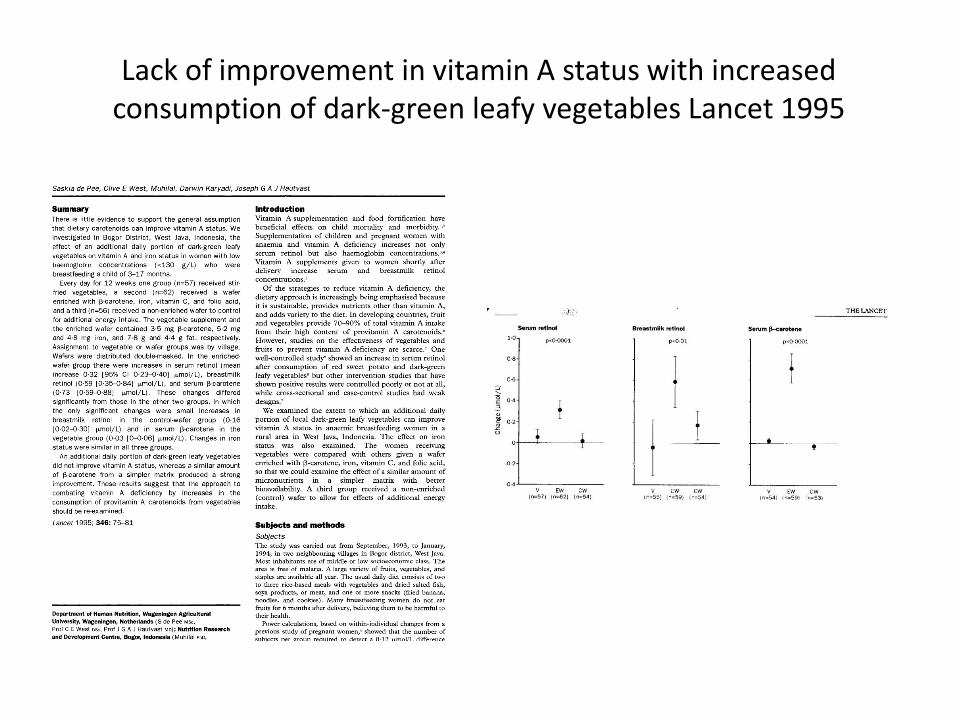
Lack of improvement in vitamin A status with increased consumption of dark-green leafy vegetables Lancet 1995
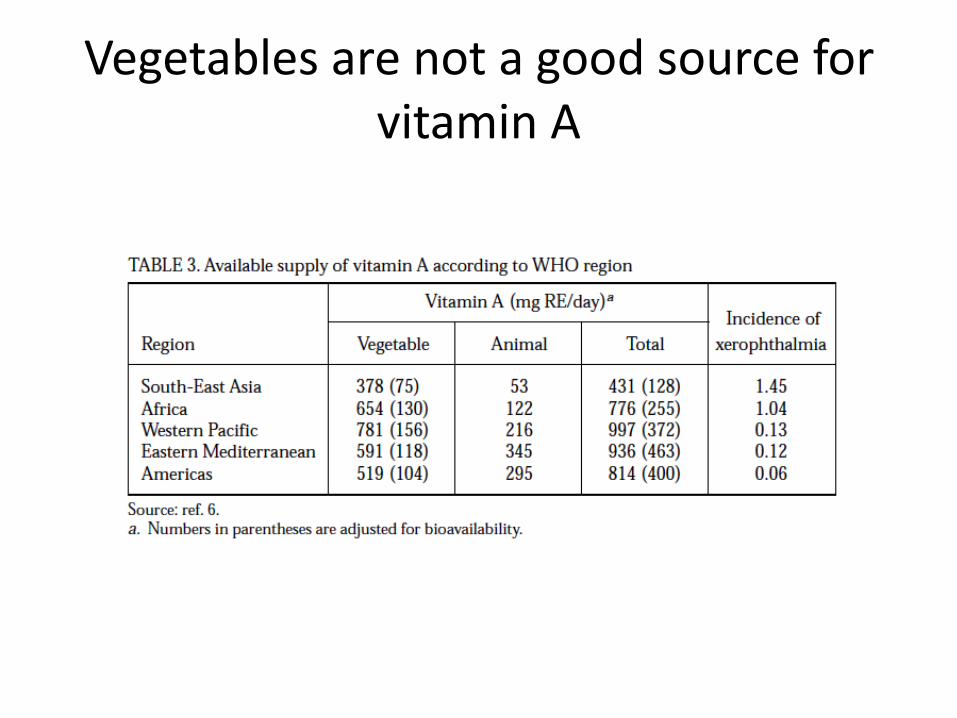
Vegetables are not a good source for vitamin A
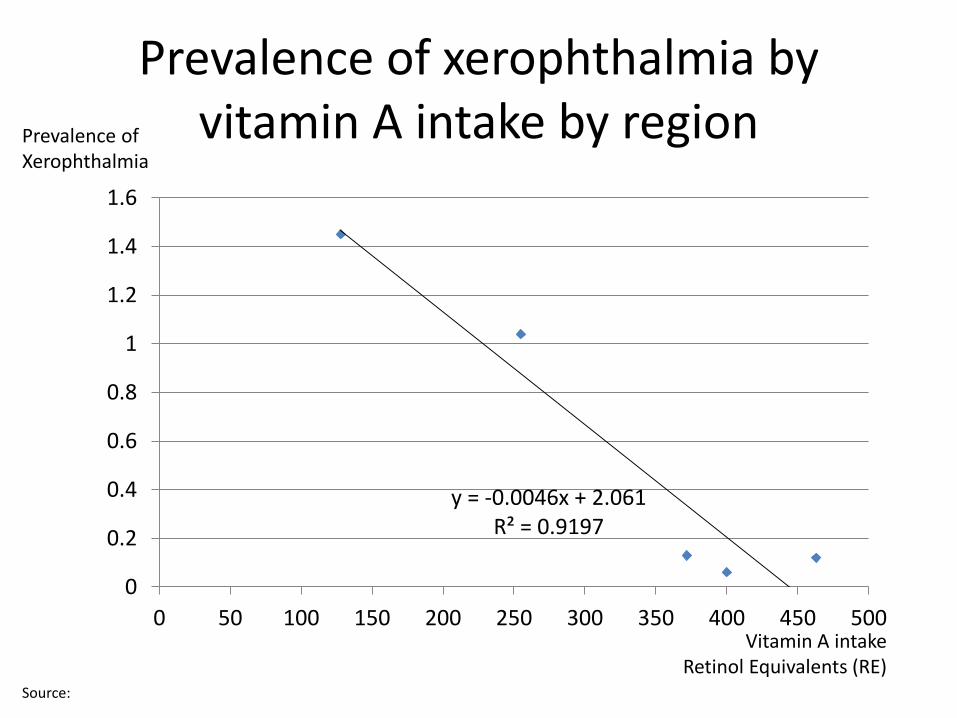
y = -0.0046x + 2.061 R² = 0.9197
0
0.2
0.4
0.6
0.8
1
1.2
1.4
1.6
0 50 100 150 200 250 300 350 400 450 500
Prevalence of xerophthalmia by vitamin A intake by region
Vitamin A intake Retinol Equivalents (RE)
Prevalence of Xerophthalmia
Source:
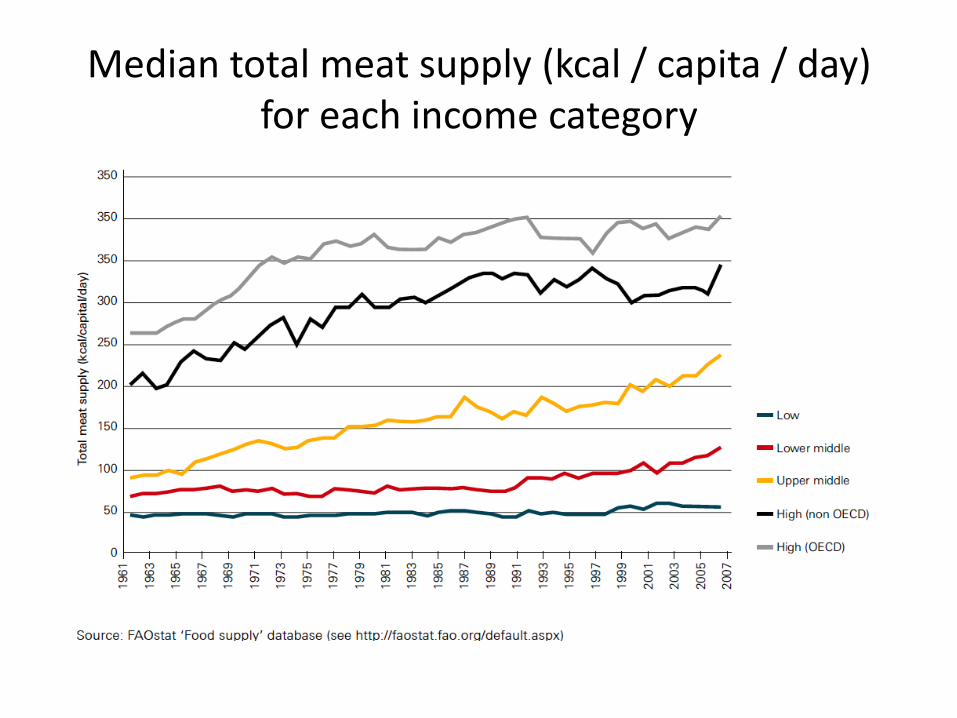
Median total meat supply (kcal / capita / day) for each income category
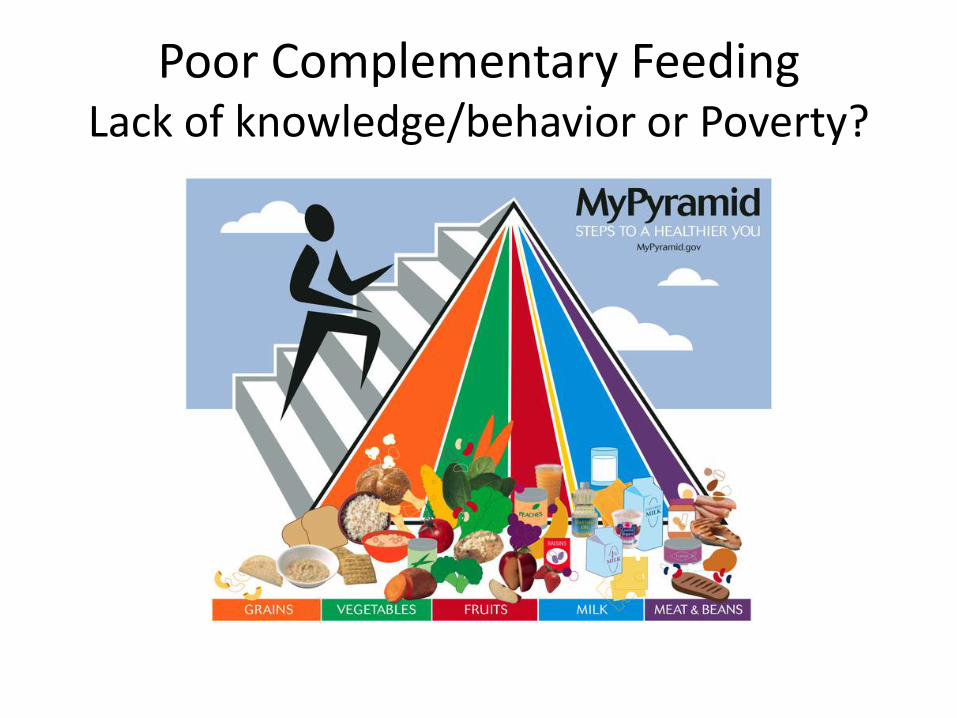
Poor Complementary Feeding Lack of knowledge/behavior or Poverty?
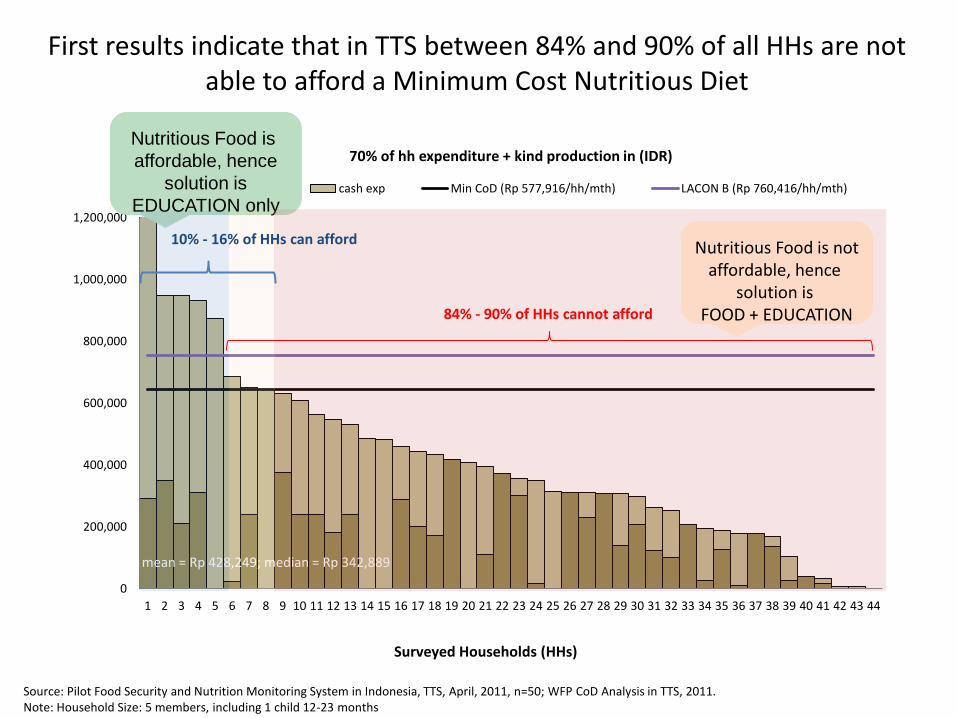
First results indicate that in TTS between 84% and 90% of all HHs are not able to afford a Minimum Cost Nutritious Diet
0
200,000
400,000
600,000
800,000
1,000,000
1,200,000
1 2 3 4 5 6 7 8 9 10 11 12 13 14 15 16 17 18 19 20 21 22 23 24 25 26 27 28 29 30 31 32 33 34 35 36 37 38 39 40 41 42 43 44
70% of hh expenditure + kind production in (IDR)
own exp cash exp Min CoD (Rp 577,916/hh/mth) LACON B (Rp 760,416/hh/mth)
mean = Rp 428,249; median = Rp 342,889
Nutritious Food is
affordable, hence
solution is
EDUCATION only
84% - 90% of HHs cannot afford
10% - 16% of HHs can afford
Source: Pilot Food Security and Nutrition Monitoring System in Indonesia, TTS, April, 2011, n=50; WFP CoD Analysis in TTS, 2011. Note: Household Size: 5 members, including 1 child 12-23 months
Surveyed Households (HHs)
Nutritious Food is not affordable, hence
solution is FOOD + EDUCATION
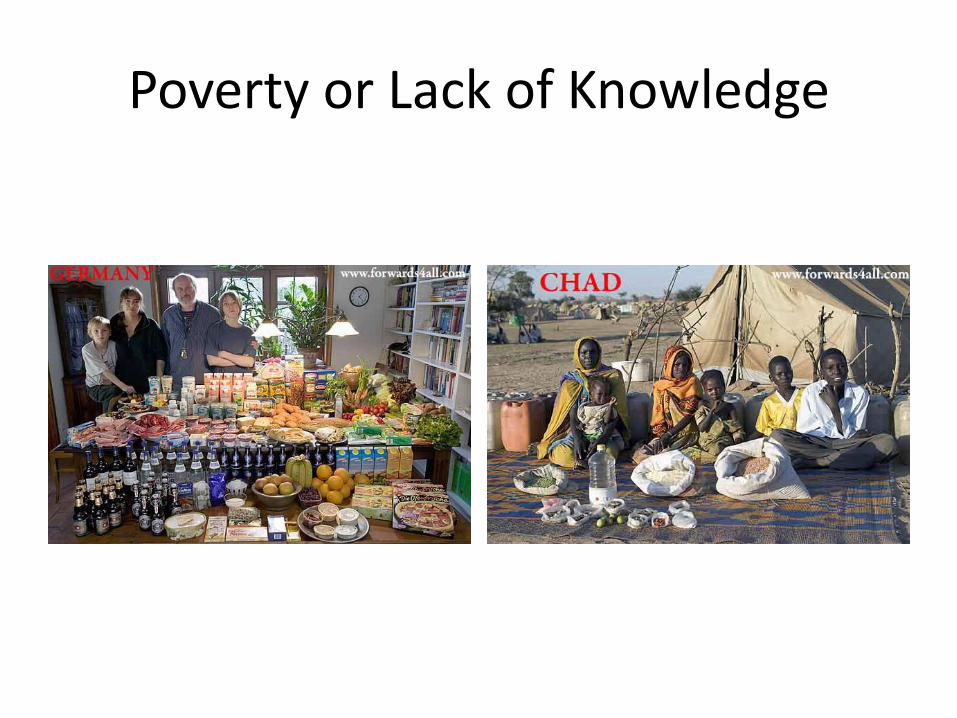
Poverty or Lack of Knowledge

Andre Briend & Michael Golden Treatment of SAM based on nutrient needs
Plumpy nut: community based F100: clinics
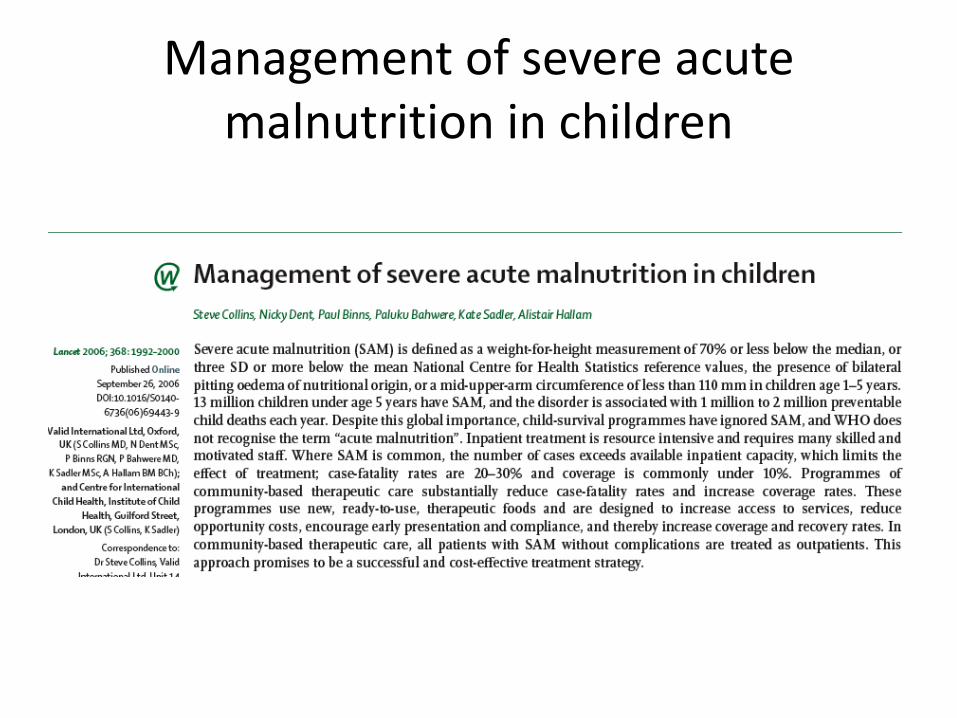
Management of severe acute malnutrition in children

Joint Statement WHO/UNICEF/WFP: From Clinics to Community-based management of SAM

Recommendations other issues
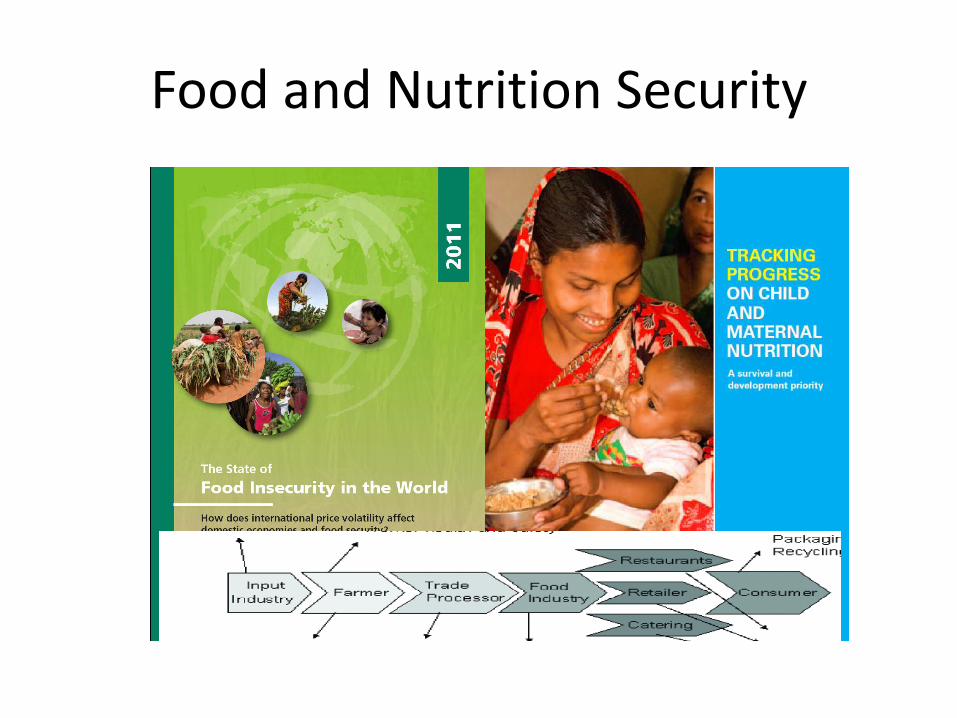
Food and Nutrition Security
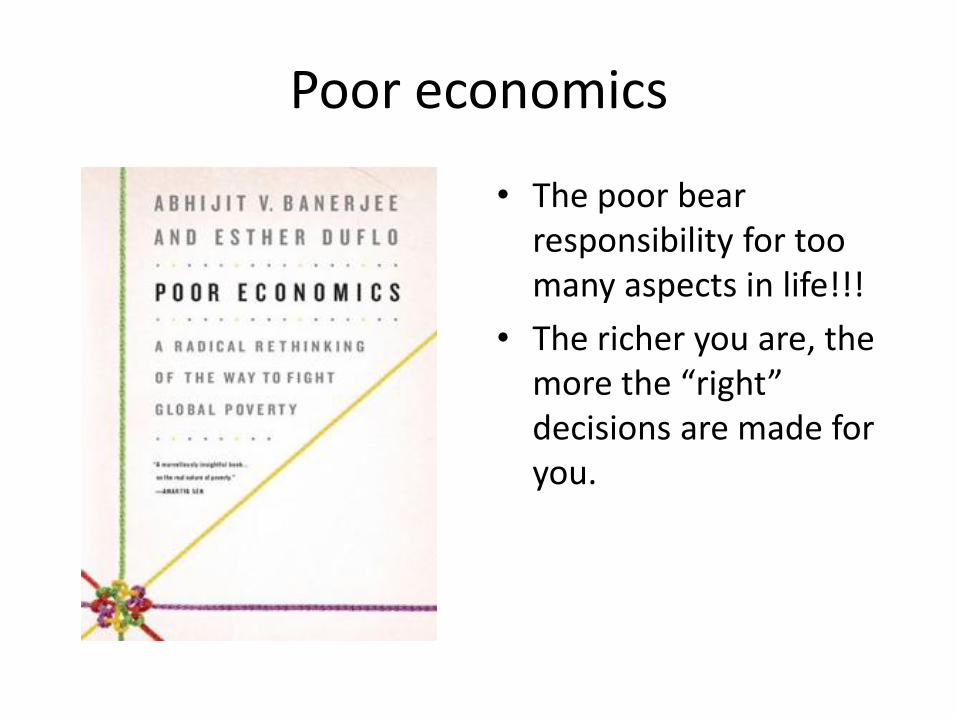
Poor economics
• The poor bear responsibility for too many aspects in life!!!
• The richer you are, the more the “right” decisions are made for you.
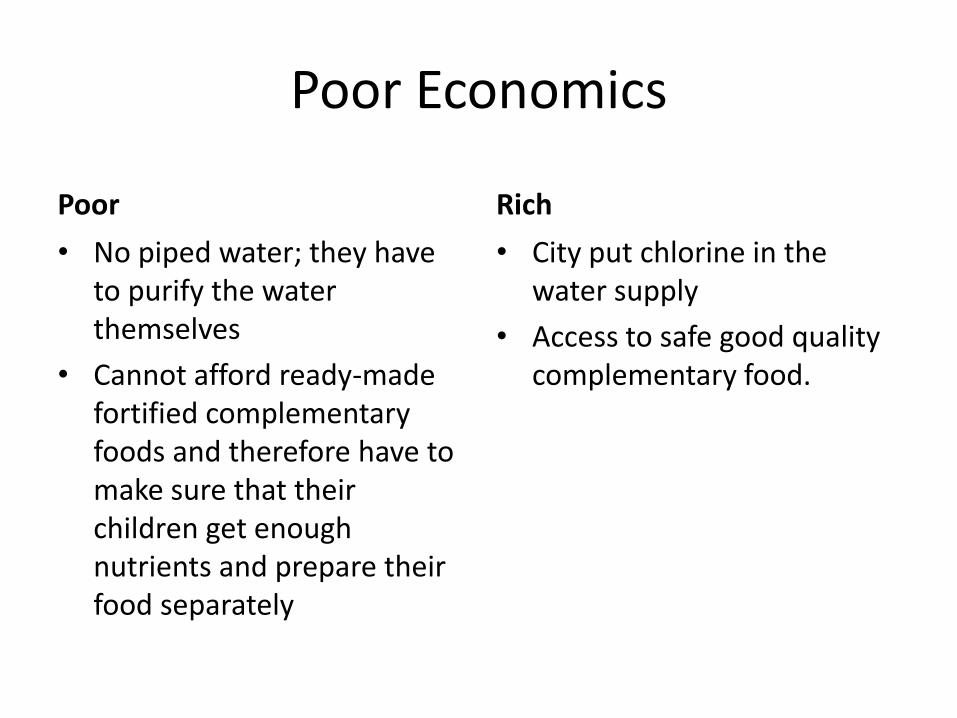
Poor Economics
Poor
• No piped water; they have to purify the water themselves
• Cannot afford ready-made fortified complementary foods and therefore have to make sure that their children get enough nutrients and prepare their food separately
Rich
• City put chlorine in the water supply
• Access to safe good quality complementary food.
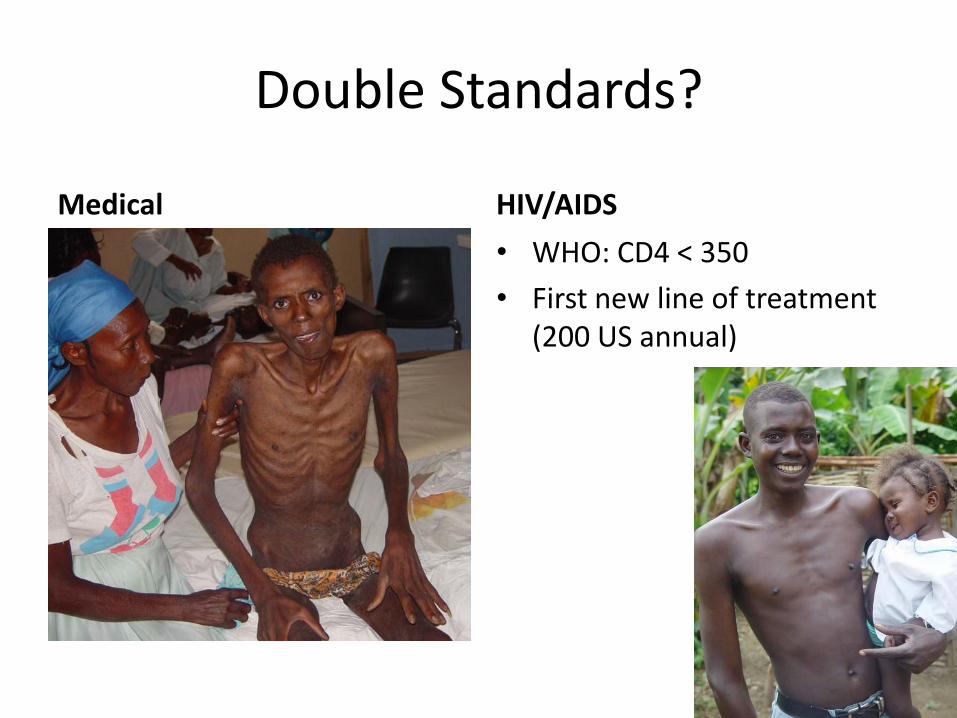
Double Standards?
Medical HIV/AIDS
• WHO: CD4 < 350
• First new line of treatment (200 US annual)
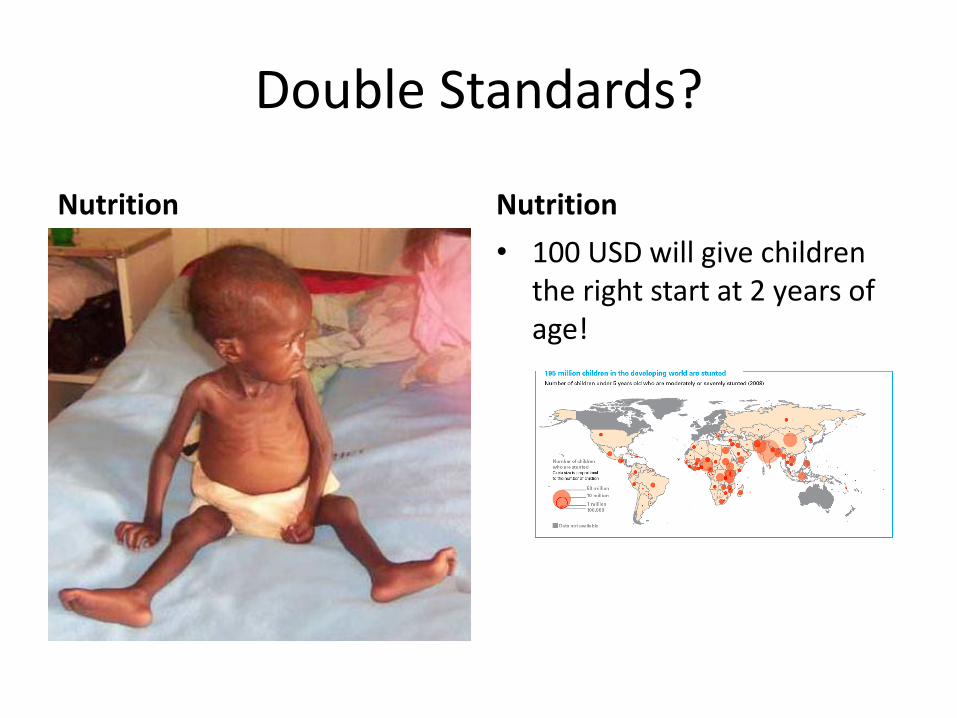
Double Standards?
Nutrition Nutrition
• 100 USD will give children the right start at 2 years of age!
WFP’s vision on nutrition
• A world in which all human beings have access to
adequate nutrition, enabling them to develop their full
potential and live healthy and fulfilled lives.
- 81 -
Thank you