
From Lau to Unz: An Anatomy of the Policy Debate over Bilingual Education. Kenji Hakuta Stanford...
59
From Lau to Unz: An Anatomy of the Policy Debate over Bilingual Education. Kenji Hakuta Stanford University http://www.stanford.edu/~hakuta National Association for Bilingual Education Philadelphia March 22, 2002
-
date post
21-Dec-2015 -
Category
Documents
-
view
215 -
download
0
Transcript of From Lau to Unz: An Anatomy of the Policy Debate over Bilingual Education. Kenji Hakuta Stanford...

From Lau to Unz:
An Anatomy of the Policy Debate over Bilingual Education.
Kenji HakutaStanford University
http://www.stanford.edu/~hakuta
National Association for Bilingual EducationPhiladelphia
March 22, 2002
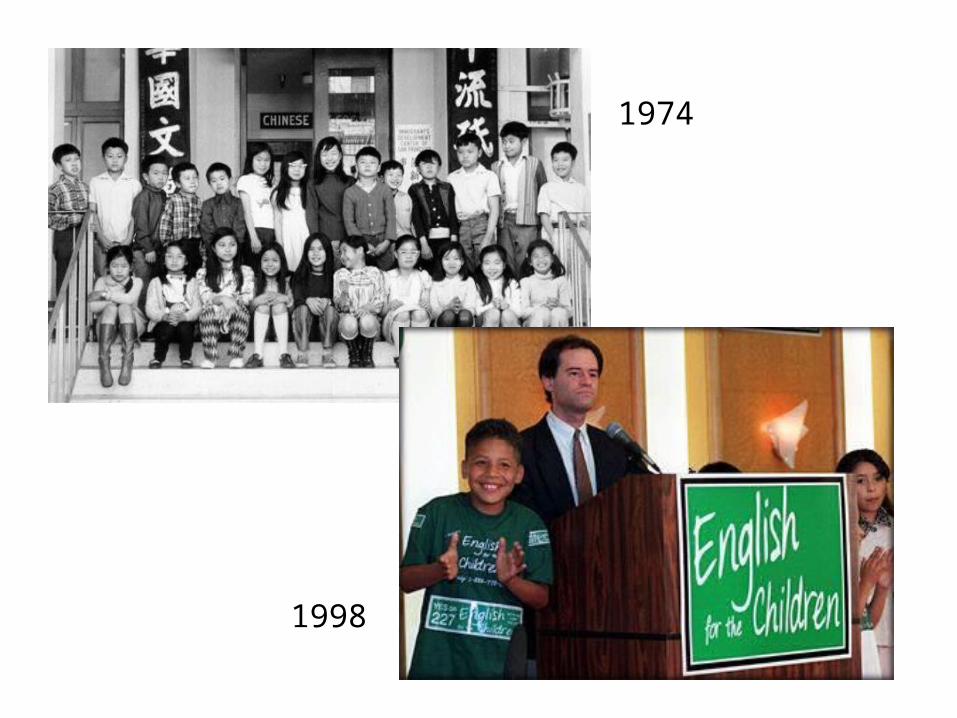
1974
1998

U. S. Supreme CourtLau v. Nichols 1974
Basic English skills are at the very core of what these public schools teach. Imposition of a requirement that, before a child can effectively participate in the educational program, he must already have acquired those basic skills is to make a mockery of public education. We know that those who do not understand English are certain to find their classroom experiences wholly incomprehensible and in no way meaningful.

Lau v. Nichols 1974
There is no equality of treatment merely by providing students with the same facilities, textbooks, teachers and curriculum; for students who do not understand English are effectively foreclosed from any meaningful education.

Lau v. Nichols 1974
There is no equality of treatment merely by providing students with the same facilities, textbooks, teachers and curriculum; for students who do not understand English are effectively foreclosed from any meaningful education.
No specific remedy is urged upon us. Teaching English to students of Chinese ancestry who do not speak the language is one choice. Giving instructions to this group in Chinese is another. There may be others. Petitioners ask only that the Board of Education be directed to apply its expertise to the problem and rectify the situation.

1975 Lau Remedies
Terrence Bell, the United States Commissioner of Education issued the “Lau Remedies”. These remedies went beyond the Lau decision and required that bilingual education be provided.
“Because an ESL program does not consider the affective or cognitive development of students [in the elementary and intermediate grades], an ESL program is not appropriate.”

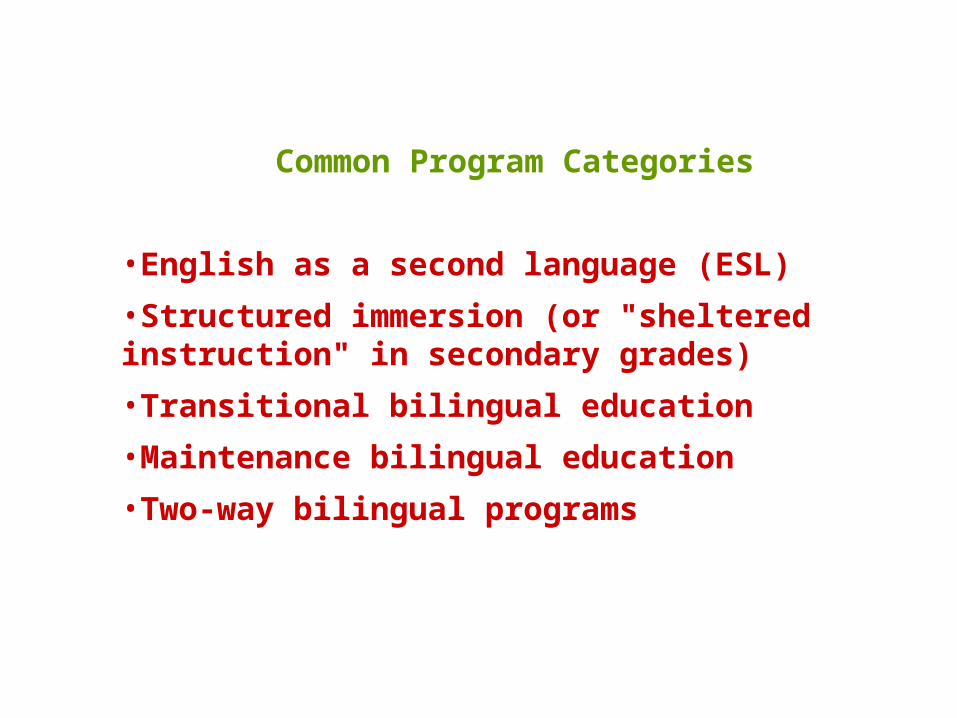
Common Program Categories
•English as a second language (ESL)
•Structured immersion (or "sheltered instruction" in secondary grades)
•Transitional bilingual education
•Maintenance bilingual education
•Two-way bilingual programs


EVALUATIONS1978 AIR Study, "Evaluation of the Impact of ESEA Title VII Spanish/English Bilingual Education Program” released in January.
1981 Circulation of Baker & De Kanter internal OPBE document "Effectiveness of Bilingual Education: A Review of the Literature", September.
1983 "Longitudinal Study of Immersion and Dual Language Instructional Programs for Language Minority Children"
1983 "National Longitudinal Evaluation of the Effectiveness of Services to Language Minority, LEP Students”
1985Willig meta-analysis
1987 Rossell & Ross review.
1998 Greene meta-analysis.

Reading Comprehension
0 1 2 3 4 5 6GRADE
3
4
5
6
7
8
9
10
11
12
Age
Eq
uiv
ale
nt S
core
English-OnlyBilingual
Program
0 1 2 3 4 5 63
6
9
12

Castañeda v. Pickard, 1981
The U.S. 5th Circuit Court of Appeals ruling interpreted the Equal Education Opportunities Act of 1974 statement of "appropriate action" as requiring the meeting of three criteria:
(1) programs must be based on "sound educational theory";
(2) they must be "implemented effectively" with adequate resources and personnel, and
(3) after a trial period, the program must be evaluated as effective in overcoming language handicaps.

Theory Implementation Learning
modify
Castañeda Model

What is sound theory?
Reading Comprehension
0 1 2 3 4 5 6GRADE
3
4
5
6
7
8
9
10
11
12
Age
Eq
uiv
ale
nt S
core
English-OnlyBilingual
Program
0 1 2 3 4 5 63
6
9
12

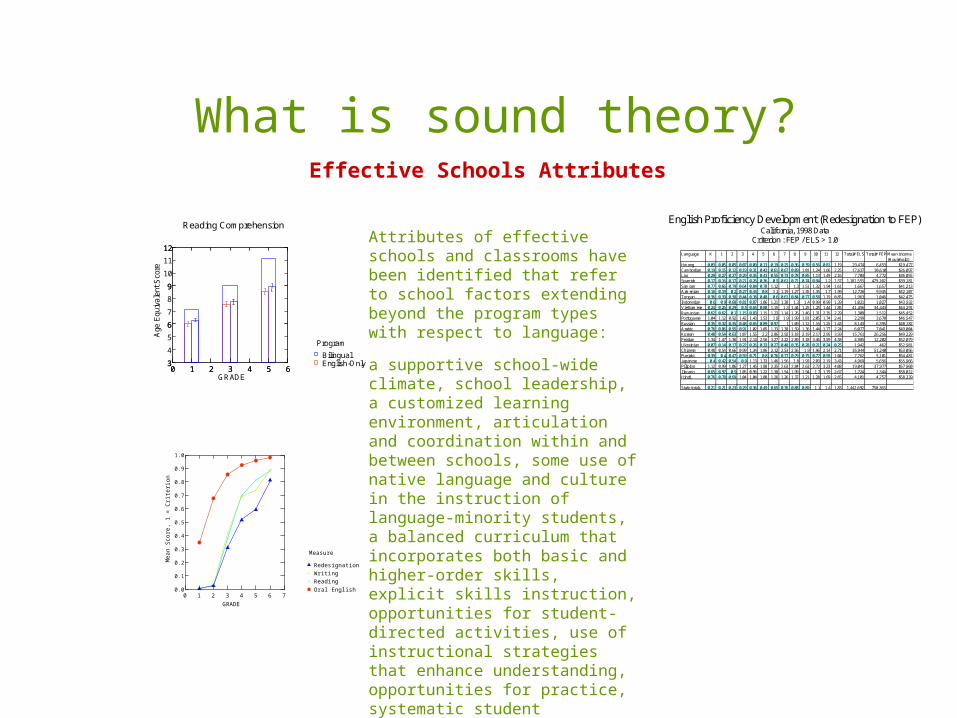
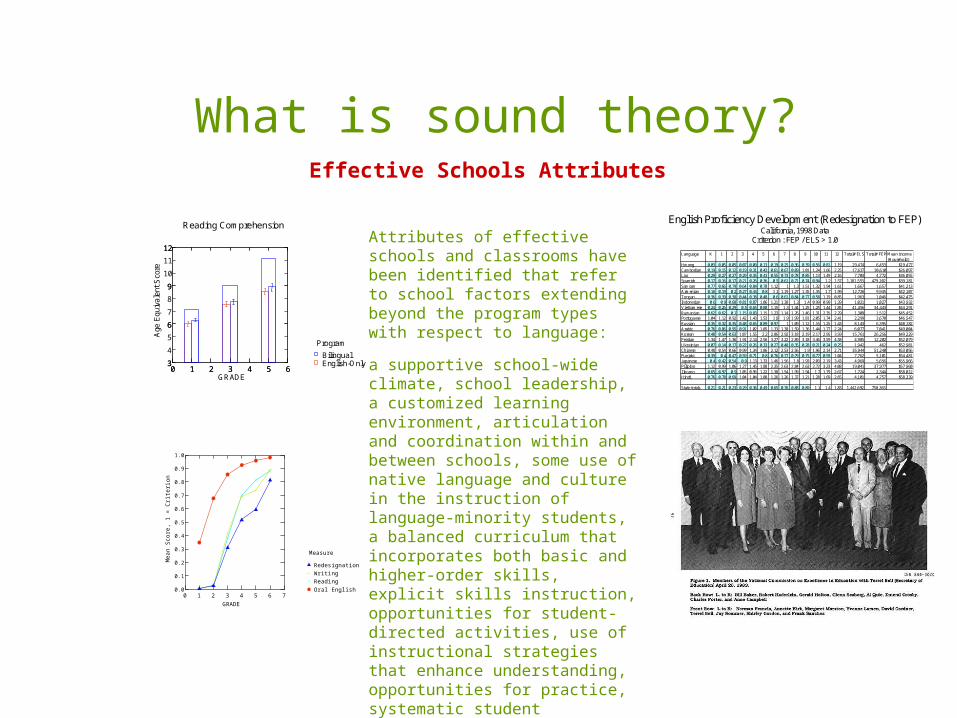
Attributes of effective schools and classrooms have been identified that refer to school factors extending beyond the program types with respect to language:
a supportive school-wide climate, school leadership, a customized learning environment, articulation and coordination within and between schools, some use of native language and culture in the instruction of language-minority students, a balanced curriculum that incorporates both basic and higher-order skills, explicit skills instruction, opportunities for student-directed activities, use of instructional strategies that enhance understanding, opportunities for practice, systematic student assessment, staff development, and home and parent involvement.
Effective Schools Attributes

What is sound theory?
Reading Comprehension
0 1 2 3 4 5 6GRADE
3
4
5
6
7
8
9
10
11
12
Age
Eq
uiv
ale
nt S
core
English-OnlyBilingual
Program
0 1 2 3 4 5 63
6
9
12Attributes of effective schools and classrooms have been identified that refer to school factors extending beyond the program types with respect to language:
a supportive school-wide climate, school leadership, a customized learning environment, articulation and coordination within and between schools, some use of native language and culture in the instruction of language-minority students, a balanced curriculum that incorporates both basic and higher-order skills, explicit skills instruction, opportunities for student-directed activities, use of instructional strategies that enhance understanding, opportunities for practice, systematic student assessment, staff development, and home and parent involvement.
Effective Schools Attributes

Language Proficiency
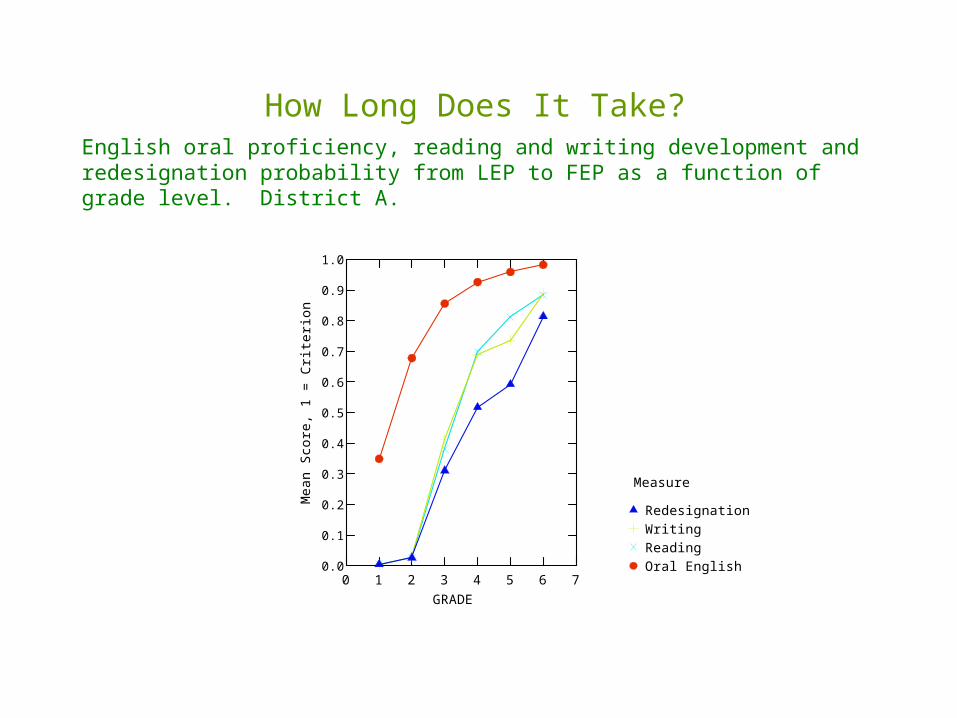
English oral proficiency, reading and writing development and redesignation probability from LEP to FEP as a function of grade level. District A.
0 1 2 3 4 5 6 7GRADE
0.0
0.1
0.2
0.3
0.4
0.5
0.6
0.7
0.8
0.9
1.0
Me
an
Sco
r e,
1 =
Cr i
ter i
on
Oral EnglishReadingWritingRedesignation
Measure
How Long Does It Take?

Cummins’ Common Underlying Proficiency

1
60 70 80 90 100 110 120 130 140Spanish Proficiency
0
50
100
150E
n gli s
h P
r of ic
i enc
y
Relationship between Native Language (Spanish) and Second Language (English) Proficiencies, r = .51.

Assessments that showed difference between strong and weak readers
-1.5
-1
-0.5
0
0.5
1
1.5
L1S L1W L2S L2W
Group
Ave
rage
Z-s
core
BPST
spell_total
spell_feature
Raven
Assessments that showed difference between L1 and L2 readers as well
-1.5
-1
-0.5
0
0.5
1
1.5
L1S L1W L2S L2W
GroupA
vera
ge Z
-sco
re
PPVT
voc_definition
voc_metacognition
read_accuracy
Performance differences between strong and weak L1 and L2 readers.

Lily Wong Fillmore and Catherine SnowWhat Teachers Need to Know about LanguageERIC Clearinghouse on Languages and Linguistics
http://www.cal.org/ericcll/teachers/teachers.pdf

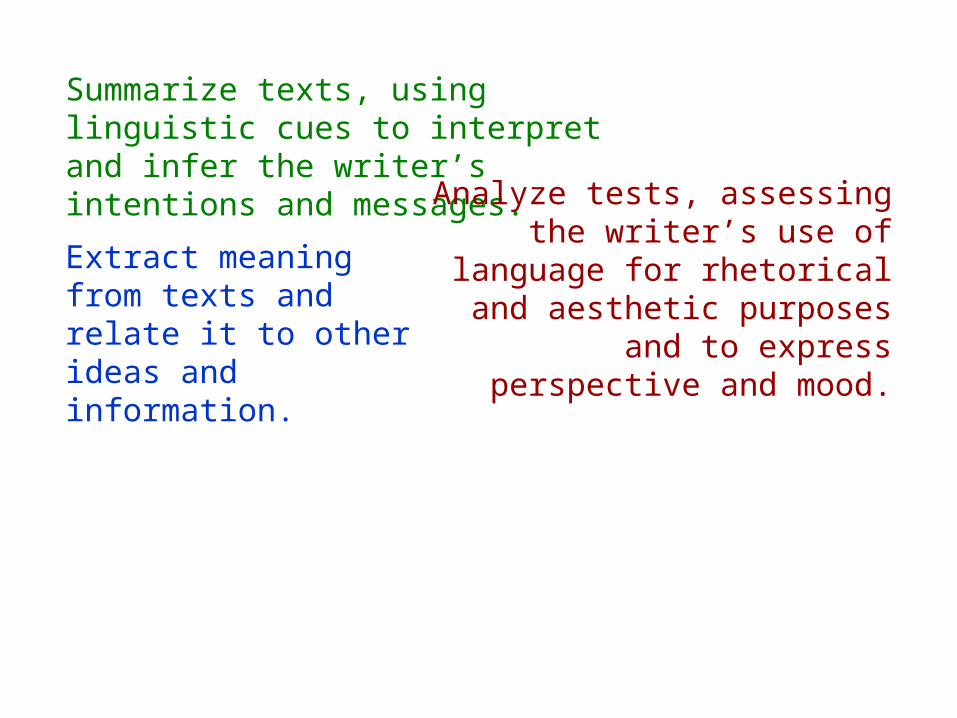
Summarize texts, using linguistic cues to interpret and infer the writer’s intentions and messages.

Summarize texts, using linguistic cues to interpret and infer the writer’s intentions and messages.
Analyze tests, assessing the writer’s use of language for rhetorical and aesthetic purposes and to express
perspective and mood.
Summarize texts, using linguistic cues to interpret and infer the writer’s intentions and messages.
Analyze tests, assessing the writer’s use of language for rhetorical and aesthetic purposes and to express
perspective and mood.
Extract meaning from texts and relate it to other ideas and information.
Evaluate evidence and arguments presented in texts and critique the logic of arguments made in them.
Recognize and analyze textual conventions used in various genres for special effect to trigger background knowledge or for perlocutionary effect.
Compose and write an extended, reasoned text that
is well developed and supported with evidence and
details.

What is sound theory?
Reading Comprehension
0 1 2 3 4 5 6GRADE
3
4
5
6
7
8
9
10
11
12
Age
Eq
uiv
ale
nt S
core
English-OnlyBilingual
Program
0 1 2 3 4 5 63
6
9
12Attributes of effective schools and classrooms have been identified that refer to school factors extending beyond the program types with respect to language:
a supportive school-wide climate, school leadership, a customized learning environment, articulation and coordination within and between schools, some use of native language and culture in the instruction of language-minority students, a balanced curriculum that incorporates both basic and higher-order skills, explicit skills instruction, opportunities for student-directed activities, use of instructional strategies that enhance understanding, opportunities for practice, systematic student assessment, staff development, and home and parent involvement.
Effective Schools Attributes
0 1 2 3 4 5 6 7GRADE
0.0
0.1
0.2
0.3
0.4
0.5
0.6
0.7
0.8
0.9
1.0
Me
an
Sco
r e,
1 =
Cri
teri
on
Oral EnglishReadingWritingRedesignation
Measure
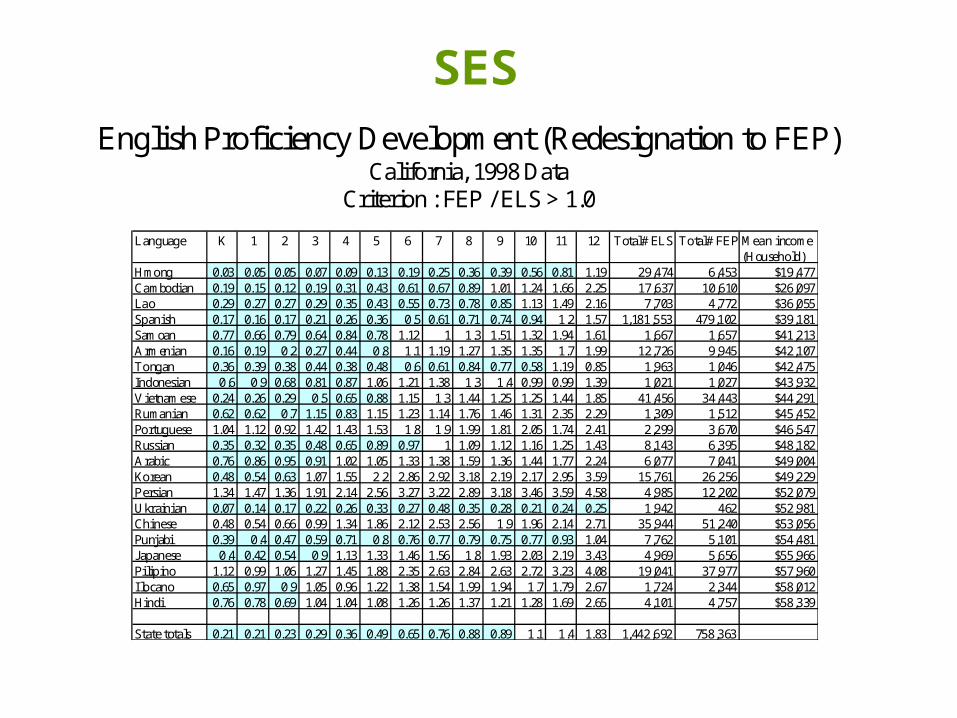
English Proficiency Development (Redesignation to FEP)California, 1998 Data
Criterion : FEP / ELS > 1.0
Language K 1 2 3 4 5 6 7 8 9 10 11 12 Total# ELS Total# FEP Mean income(Household)
Hmong 0.03 0.05 0.05 0.07 0.09 0.13 0.19 0.25 0.36 0.39 0.56 0.81 1.19 29,474 6,453 $19,477Cambodian 0.19 0.15 0.12 0.19 0.31 0.43 0.61 0.67 0.89 1.01 1.24 1.66 2.25 17,637 10,610 $26,097Lao 0.29 0.27 0.27 0.29 0.35 0.43 0.55 0.73 0.78 0.85 1.13 1.49 2.16 7,703 4,772 $36,055Spanish 0.17 0.16 0.17 0.21 0.26 0.36 0.5 0.61 0.71 0.74 0.94 1.2 1.57 1,181,553 479,102 $39,181Samoan 0.77 0.66 0.79 0.64 0.84 0.78 1.12 1 1.3 1.51 1.32 1.94 1.61 1,667 1,657 $41,213Armenian 0.16 0.19 0.2 0.27 0.44 0.8 1.1 1.19 1.27 1.35 1.35 1.7 1.99 12,726 9,945 $42,107Tongan 0.36 0.39 0.38 0.44 0.38 0.48 0.6 0.61 0.84 0.77 0.58 1.19 0.85 1,963 1,046 $42,475Indonesian 0.6 0.9 0.68 0.81 0.87 1.06 1.21 1.38 1.3 1.4 0.99 0.99 1.39 1,021 1,027 $43,932Vietnamese 0.24 0.26 0.29 0.5 0.65 0.88 1.15 1.3 1.44 1.25 1.25 1.44 1.85 41,456 34,443 $44,291Rumanian 0.62 0.62 0.7 1.15 0.83 1.15 1.23 1.14 1.76 1.46 1.31 2.35 2.29 1,309 1,512 $45,452Portuguese 1.04 1.12 0.92 1.42 1.43 1.53 1.8 1.9 1.99 1.81 2.05 1.74 2.41 2,299 3,670 $46,547Russian 0.35 0.32 0.35 0.48 0.65 0.89 0.97 1 1.09 1.12 1.16 1.25 1.43 8,143 6,395 $48,182Arabic 0.76 0.86 0.95 0.91 1.02 1.05 1.33 1.38 1.59 1.36 1.44 1.77 2.24 6,077 7,041 $49,004Korean 0.48 0.54 0.63 1.07 1.55 2.2 2.86 2.92 3.18 2.19 2.17 2.95 3.59 15,761 26,256 $49,229Persian 1.34 1.47 1.36 1.91 2.14 2.56 3.27 3.22 2.89 3.18 3.46 3.59 4.58 4,985 12,202 $52,079Ukrainian 0.07 0.14 0.17 0.22 0.26 0.33 0.27 0.48 0.35 0.28 0.21 0.24 0.25 1,942 462 $52,981Chinese 0.48 0.54 0.66 0.99 1.34 1.86 2.12 2.53 2.56 1.9 1.96 2.14 2.71 35,944 51,240 $53,056Punjabi 0.39 0.4 0.47 0.59 0.71 0.8 0.76 0.77 0.79 0.75 0.77 0.93 1.04 7,762 5,101 $54,481Japanese 0.4 0.42 0.54 0.9 1.13 1.33 1.46 1.56 1.8 1.93 2.03 2.19 3.43 4,969 5,656 $55,966Pilipino 1.12 0.99 1.06 1.27 1.45 1.88 2.35 2.63 2.84 2.63 2.72 3.23 4.08 19,041 37,977 $57,960Ilocano 0.65 0.97 0.9 1.05 0.96 1.22 1.38 1.54 1.99 1.94 1.7 1.79 2.67 1,724 2,344 $58,012Hindi 0.76 0.78 0.69 1.04 1.04 1.08 1.26 1.26 1.37 1.21 1.28 1.69 2.65 4,101 4,757 $58,339
State totals 0.21 0.21 0.23 0.29 0.36 0.49 0.65 0.76 0.88 0.89 1.1 1.4 1.83 1,442,692 758,363
SES

Household Income by Language Group (Source: 1990 Census of Population and Housing)
0
0.1
0.2
0.3
0.4
0.5
0.6
0.7
0.8
0.9
1
0 20000 40000 60000 80000 100000 120000 140000 160000 180000 200000
Household Income
Per
cent
age
Hmong
Cambodian
Lao
Spanish
Samoan
Armenian
Tongan
Indonesian
Vietnamese
Rumanian
Portuguese
Russian
Arabic
Korean
Persian
Ukrainian
Chinese
Punjabi
Japanese
Pilipino
Ilocano
Hindi

Norm-referenced English writing scores by parent educational level, District B.
< High SchoolSome High SchoolHigh School or GEDBeyond High School
Parent Education
Written Expression
0 1 2 3 4 5 6GRADE
3
4
5
6
7
8
9
10
11
12
Ag
e E
qui
vale
nt
Sco
r e
0 1 2 3 4 5 63
6
9
12
Basic Writing Skills
0 1 2 3 4 5 6GRADE
3
4
5
6
7
8
9
10
11
12
Ag
e E
qui
vale
nt
Sco
r e
0 1 2 3 4 5 63
6
9
12
Broad Written Language
0 1 2 3 4 5 6GRADE
3
4
5
6
7
8
9
10
11
12
Ag
e E
qu
ival
ent
Sco
r e
0 1 2 3 4 5 63
6
9
12
What is sound theory?
Reading Comprehension
0 1 2 3 4 5 6GRADE
3
4
5
6
7
8
9
10
11
12
Age
Eq
uiv
ale
nt S
core
English-OnlyBilingual
Program
0 1 2 3 4 5 63
6
9
12Attributes of effective schools and classrooms have been identified that refer to school factors extending beyond the program types with respect to language:
a supportive school-wide climate, school leadership, a customized learning environment, articulation and coordination within and between schools, some use of native language and culture in the instruction of language-minority students, a balanced curriculum that incorporates both basic and higher-order skills, explicit skills instruction, opportunities for student-directed activities, use of instructional strategies that enhance understanding, opportunities for practice, systematic student assessment, staff development, and home and parent involvement.
Effective Schools Attributes
0 1 2 3 4 5 6 7GRADE
0.0
0.1
0.2
0.3
0.4
0.5
0.6
0.7
0.8
0.9
1.0
Me
an
Sco
r e,
1 =
Cri
teri
on
Oral EnglishReadingWritingRedesignation
Measure
English Proficiency Development (Redesignation to FEP)California, 1998 Data
Criterion : FEP / ELS > 1.0
Language K 1 2 3 4 5 6 7 8 9 10 11 12 Total# ELS Total# FEP Mean income(Household)
Hmong 0.03 0.05 0.05 0.07 0.09 0.13 0.19 0.25 0.36 0.39 0.56 0.81 1.19 29,474 6,453 $19,477Cambodian 0.19 0.15 0.12 0.19 0.31 0.43 0.61 0.67 0.89 1.01 1.24 1.66 2.25 17,637 10,610 $26,097Lao 0.29 0.27 0.27 0.29 0.35 0.43 0.55 0.73 0.78 0.85 1.13 1.49 2.16 7,703 4,772 $36,055Spanish 0.17 0.16 0.17 0.21 0.26 0.36 0.5 0.61 0.71 0.74 0.94 1.2 1.57 1,181,553 479,102 $39,181Samoan 0.77 0.66 0.79 0.64 0.84 0.78 1.12 1 1.3 1.51 1.32 1.94 1.61 1,667 1,657 $41,213Armenian 0.16 0.19 0.2 0.27 0.44 0.8 1.1 1.19 1.27 1.35 1.35 1.7 1.99 12,726 9,945 $42,107Tongan 0.36 0.39 0.38 0.44 0.38 0.48 0.6 0.61 0.84 0.77 0.58 1.19 0.85 1,963 1,046 $42,475Indonesian 0.6 0.9 0.68 0.81 0.87 1.06 1.21 1.38 1.3 1.4 0.99 0.99 1.39 1,021 1,027 $43,932Vietnamese 0.24 0.26 0.29 0.5 0.65 0.88 1.15 1.3 1.44 1.25 1.25 1.44 1.85 41,456 34,443 $44,291Rumanian 0.62 0.62 0.7 1.15 0.83 1.15 1.23 1.14 1.76 1.46 1.31 2.35 2.29 1,309 1,512 $45,452Portuguese 1.04 1.12 0.92 1.42 1.43 1.53 1.8 1.9 1.99 1.81 2.05 1.74 2.41 2,299 3,670 $46,547Russian 0.35 0.32 0.35 0.48 0.65 0.89 0.97 1 1.09 1.12 1.16 1.25 1.43 8,143 6,395 $48,182Arabic 0.76 0.86 0.95 0.91 1.02 1.05 1.33 1.38 1.59 1.36 1.44 1.77 2.24 6,077 7,041 $49,004Korean 0.48 0.54 0.63 1.07 1.55 2.2 2.86 2.92 3.18 2.19 2.17 2.95 3.59 15,761 26,256 $49,229Persian 1.34 1.47 1.36 1.91 2.14 2.56 3.27 3.22 2.89 3.18 3.46 3.59 4.58 4,985 12,202 $52,079Ukrainian 0.07 0.14 0.17 0.22 0.26 0.33 0.27 0.48 0.35 0.28 0.21 0.24 0.25 1,942 462 $52,981Chinese 0.48 0.54 0.66 0.99 1.34 1.86 2.12 2.53 2.56 1.9 1.96 2.14 2.71 35,944 51,240 $53,056Punjabi 0.39 0.4 0.47 0.59 0.71 0.8 0.76 0.77 0.79 0.75 0.77 0.93 1.04 7,762 5,101 $54,481Japanese 0.4 0.42 0.54 0.9 1.13 1.33 1.46 1.56 1.8 1.93 2.03 2.19 3.43 4,969 5,656 $55,966Pilipino 1.12 0.99 1.06 1.27 1.45 1.88 2.35 2.63 2.84 2.63 2.72 3.23 4.08 19,041 37,977 $57,960Ilocano 0.65 0.97 0.9 1.05 0.96 1.22 1.38 1.54 1.99 1.94 1.7 1.79 2.67 1,724 2,344 $58,012Hindi 0.76 0.78 0.69 1.04 1.04 1.08 1.26 1.26 1.37 1.21 1.28 1.69 2.65 4,101 4,757 $58,339
State totals 0.21 0.21 0.23 0.29 0.36 0.49 0.65 0.76 0.88 0.89 1.1 1.4 1.83 1,442,692 758,363


Elements of Standards-Based Reform
•clearly articulated, publicly accepted standards for academic content, student performance, school capacity
•alignment of educational components around the standards
•assessment, accountability, and improvement system built on standards
•important condition: fairness in testing (assessment in a language and form most likely to yield valid and reliable results)

Figure 11
What is sound theory?
Reading Comprehension
0 1 2 3 4 5 6GRADE
3
4
5
6
7
8
9
10
11
12
Age
Eq
uiv
ale
nt S
core
English-OnlyBilingual
Program
0 1 2 3 4 5 63
6
9
12Attributes of effective schools and classrooms have been identified that refer to school factors extending beyond the program types with respect to language:
a supportive school-wide climate, school leadership, a customized learning environment, articulation and coordination within and between schools, some use of native language and culture in the instruction of language-minority students, a balanced curriculum that incorporates both basic and higher-order skills, explicit skills instruction, opportunities for student-directed activities, use of instructional strategies that enhance understanding, opportunities for practice, systematic student assessment, staff development, and home and parent involvement.
Effective Schools Attributes
0 1 2 3 4 5 6 7GRADE
0.0
0.1
0.2
0.3
0.4
0.5
0.6
0.7
0.8
0.9
1.0
Me
an
Sco
r e,
1 =
Cri
teri
on
Oral EnglishReadingWritingRedesignation
Measure
English Proficiency Development (Redesignation to FEP)California, 1998 Data
Criterion : FEP / ELS > 1.0
Language K 1 2 3 4 5 6 7 8 9 10 11 12 Total# ELS Total# FEP Mean income(Household)
Hmong 0.03 0.05 0.05 0.07 0.09 0.13 0.19 0.25 0.36 0.39 0.56 0.81 1.19 29,474 6,453 $19,477Cambodian 0.19 0.15 0.12 0.19 0.31 0.43 0.61 0.67 0.89 1.01 1.24 1.66 2.25 17,637 10,610 $26,097Lao 0.29 0.27 0.27 0.29 0.35 0.43 0.55 0.73 0.78 0.85 1.13 1.49 2.16 7,703 4,772 $36,055Spanish 0.17 0.16 0.17 0.21 0.26 0.36 0.5 0.61 0.71 0.74 0.94 1.2 1.57 1,181,553 479,102 $39,181Samoan 0.77 0.66 0.79 0.64 0.84 0.78 1.12 1 1.3 1.51 1.32 1.94 1.61 1,667 1,657 $41,213Armenian 0.16 0.19 0.2 0.27 0.44 0.8 1.1 1.19 1.27 1.35 1.35 1.7 1.99 12,726 9,945 $42,107Tongan 0.36 0.39 0.38 0.44 0.38 0.48 0.6 0.61 0.84 0.77 0.58 1.19 0.85 1,963 1,046 $42,475Indonesian 0.6 0.9 0.68 0.81 0.87 1.06 1.21 1.38 1.3 1.4 0.99 0.99 1.39 1,021 1,027 $43,932Vietnamese 0.24 0.26 0.29 0.5 0.65 0.88 1.15 1.3 1.44 1.25 1.25 1.44 1.85 41,456 34,443 $44,291Rumanian 0.62 0.62 0.7 1.15 0.83 1.15 1.23 1.14 1.76 1.46 1.31 2.35 2.29 1,309 1,512 $45,452Portuguese 1.04 1.12 0.92 1.42 1.43 1.53 1.8 1.9 1.99 1.81 2.05 1.74 2.41 2,299 3,670 $46,547Russian 0.35 0.32 0.35 0.48 0.65 0.89 0.97 1 1.09 1.12 1.16 1.25 1.43 8,143 6,395 $48,182Arabic 0.76 0.86 0.95 0.91 1.02 1.05 1.33 1.38 1.59 1.36 1.44 1.77 2.24 6,077 7,041 $49,004Korean 0.48 0.54 0.63 1.07 1.55 2.2 2.86 2.92 3.18 2.19 2.17 2.95 3.59 15,761 26,256 $49,229Persian 1.34 1.47 1.36 1.91 2.14 2.56 3.27 3.22 2.89 3.18 3.46 3.59 4.58 4,985 12,202 $52,079Ukrainian 0.07 0.14 0.17 0.22 0.26 0.33 0.27 0.48 0.35 0.28 0.21 0.24 0.25 1,942 462 $52,981Chinese 0.48 0.54 0.66 0.99 1.34 1.86 2.12 2.53 2.56 1.9 1.96 2.14 2.71 35,944 51,240 $53,056Punjabi 0.39 0.4 0.47 0.59 0.71 0.8 0.76 0.77 0.79 0.75 0.77 0.93 1.04 7,762 5,101 $54,481Japanese 0.4 0.42 0.54 0.9 1.13 1.33 1.46 1.56 1.8 1.93 2.03 2.19 3.43 4,969 5,656 $55,966Pilipino 1.12 0.99 1.06 1.27 1.45 1.88 2.35 2.63 2.84 2.63 2.72 3.23 4.08 19,041 37,977 $57,960Ilocano 0.65 0.97 0.9 1.05 0.96 1.22 1.38 1.54 1.99 1.94 1.7 1.79 2.67 1,724 2,344 $58,012Hindi 0.76 0.78 0.69 1.04 1.04 1.08 1.26 1.26 1.37 1.21 1.28 1.69 2.65 4,101 4,757 $58,339
State totals 0.21 0.21 0.23 0.29 0.36 0.49 0.65 0.76 0.88 0.89 1.1 1.4 1.83 1,442,692 758,363

Figure 9

Proposition 227
All minority language children will be placed in English language classrooms. Children who are limited English proficient will be taught through sheltered English immersion for a period not normally to exceed one year.

“-- learning subject matter content in a second language can begin to occur in a matter of weeks, starting with the subjects that can be partially understood through symbols (mathematics), active experiments and demonstrations (science), and progressing to the social science.”
Rosalie PorterDirector, READ Institute

English Learning Students (2nd Grade, SAT9 2000 Reading)
Schools providing bilingual instruction
Schools using only English immersion
Oceanside USD
0
10
20
30
40
50
1998 1999 2000
Year
SA
T9
%

Schools providing bilingual instruction
Schools using only English immersion
Oceanside USD
English Learning Students (3rd Grade, SAT9 2000 Reading)
0
10
20
30
40
50
1998 1999 2000
Year
SA
T9
%

Reading, Grade 2
1997 1998 1999 2000 2001 2002Year of Testing
0
25
50
75
Per
c en t
il e R
a nk
of M
ean
Sc o
reReading, Grade 3
1997 1998 1999 2000 2001 2002Year of Testing
0
25
50
75
Per
c en t
il e R
a nk
of M
ean
Sc o
re
All Students
English Learners
Oceanside
Statewide
All Students
English Learners
Figure 1. SAT-9 reading scores for Oceanside and Statewide for 1998 thru 2000. Blue lines represent data for all students; red lines represent data for English Learners (LEP).

What are the components of “sound educational theory”?

Carnine and Meeder Principles• Random assignment of students and teachers to
conditions
• Representative and unbiased sample
• Minimum N=12 per condition
• Valid, reliable measures
• Confounding variables controlled
• Valid statistics
• Educationally significant

National Reading Panel Standards
• True or quasi-experiment;
• Study participants must be carefully described (age, demographic, cognitive, academic, and behavioral characteristics);
• Study interventions must be described in sufficient detail to allow for replicability, including how long the interventions lasted and how long the effects lasted;
• Study methods must allow judgments about how instruction fidelity was insured; and
• Studies must include a full description of outcome measures.
Research Reform Proposal
• A new, independent “Education Audit Agency”
• Dedicated to the canons of scientific inquiry and the pursuit of truth, without fear or favor
• In its conduct of education research, the Education Audit Agency should strive for scientific rigor, including, to the maximum degree possible, randomized field trials.
William Bennett, Chester Finn, Tom Loveless, Diane RavitchSeven Principles for Reauthorizing OERI, NAEP and NAGB
May 4, 2000

A Definition of Research
…is evaluated using randomized experimentsin which individuals, entities, programs, or activitiesare randomly assigned to different variations (including a control condition) to compare the relative effects of the variations.
Amendment offered by Mr. Schaffer to the Amendmentin the nature of a substitute offered by Mr. Goodling (ESEA)
Document dated April 5, 2000, courtesy of Gerald Sroufe, AERA

NERPPB Policy Statement
The power of science comes from a combination of strong theory and data that bear on the theory. This implies endorsement of explicit ideas and agreed-upon methods for exploring and testing these ideas based on observation that has internal and external consistency. Experiments, as a classification of research, should not be scattershot or universal. Rather, they should be justified by a cumulative record of rigorous naturalistic observation and piloting. This requires knowledge of context in addition to adherence to scientific canons. While experiments in education may not be used as frequently as they should as a preferred means for investigation … “science” should not be equated with “experiments.”

National Academy of Sciences
Scientific Research in Education Lisa Towne andRichard Shavelson, Eds.
Methodology appropriate to the question being asked.

Benefits of Bilingualism

English
0 1 2 3 4 5GROUP
30
40
50
60
70
80
90
100
110
120
130
140
EP
VT
_ST
D
EPVT_STDEPVT2_S

English
0 1 2 3 4 5GROUP
30
40
50
60
70
80
90
100
110
120
130
140
EP
VT
_ST
D
EPVT_STDEPVT2_S
Born in Mexico

English
0 1 2 3 4 5GROUP
30
40
50
60
70
80
90
100
110
120
130
140
EP
VT
_ST
D
EPVT_STDEPVT2_S
Born in Mexico Born in US, parents immigrated as adult

English
0 1 2 3 4 5GROUP
30
40
50
60
70
80
90
100
110
120
130
140
EP
VT
_ST
D
EPVT_STDEPVT2_S
Born in Mexico Born in US, parents immigrated as adult
Born in US, parentimmigrated as child

English
0 1 2 3 4 5GROUP
30
40
50
60
70
80
90
100
110
120
130
140
EP
VT
_ST
D
EPVT_STDEPVT2_S
Born in Mexico Born in US, parents immigrated as adult
Born in US, parentimmigrated as child
Parent born in US

Spanish
0 1 2 3 4 5GROUP
30
40
50
60
70
80
90
100
110
120
130
140
SP
VT
_ST
D
SPVT_STDSPVT2_S
Catastrophic language loss

Basic English skills are at the very core of what these public schools teach. Imposition of a requirement that, before a child can effectively participate in the educational program, he must already have acquired those basic skills is to make a mockery of public education. We know that those who do not understand English are certain to find their classroom experiences wholly incomprehensible and in no way meaningful.
U. S. Supreme CourtLau v. Nichols 1974

Overall Assessment of the Period
•Justice
•Fairness
•Benefits


![[Kenji Miyazawa] Miyazawa Kenji Selections](https://static.fdocuments.in/doc/165x107/55cf8eb1550346703b949f78/kenji-miyazawa-miyazawa-kenji-selections.jpg)


