From ideas to growth
125
October 2021 From ideas to growth Understanding the drivers of innovation and productivity across firms, regions and industries in the UK BEIS Research Paper Number: 2021/041
Transcript of From ideas to growth

October 2021
From ideas to growth Understanding the drivers of innovation and productivity across firms, regions and industries in the UK
BEIS Research Paper Number: 2021/041

Acknowledgements
The analysis in this report was carried out by a team at the National Institute for Economic and Social Research (NIESR), including Andrew Aitken, Francesca Foliano, Larissa S Marioni, David Nguyen, Ana Rincon-Aznar, and Enrico Vanino.
© Crown copyright 2021
This publication is licensed under the terms of the Open Government Licence v3.0 except where otherwise stated. To view this licence, visit nationalarchives.gov.uk/doc/open-government-licence/version/3 or write to the Information Policy Team, The National Archives, Kew, London TW9 4DU, or email: [email protected].
Where we have identified any third-party copyright information you will need to obtain permission from the copyright holders concerned.
Any enquiries regarding this publication should be sent to us at: [email protected]

3
Contents Executive summary _________________________________________________________ 5
Background _____________________________________________________________ 5
Methodology _____________________________________________________________ 6
Key findings _____________________________________________________________ 7
Main drivers of innovation _________________________________________________ 7
Impact of innovation on productivity growth ___________________________________ 7
Innovation and inclusive growth ____________________________________________ 8
Conclusions and policy implications ___________________________________________ 8
1 Introduction _____________________________________________________________ 10
Introduction to this report __________________________________________________ 10
2 Literature Review ________________________________________________________ 14
Introduction _____________________________________________________________ 14
The relationship between R&D, innovation and productivity ________________________ 15
Differences in drivers of productivity across firms and sectors ______________________ 19
Knowledge transfers and spillovers __________________________________________ 21
The role of public R&D for private R&D _______________________________________ 24
Links between innovation and inequality ______________________________________ 26
3 Data and Methodology ____________________________________________________ 29
Introduction _____________________________________________________________ 29
Data __________________________________________________________________ 29
Methodology ____________________________________________________________ 31
Main drivers of innovation ________________________________________________ 32
Impact of innovation on productivity growth __________________________________ 33
Innovation and inclusive growth ___________________________________________ 34
4 Results ________________________________________________________________ 35
Main drivers of innovation __________________________________________________ 35
Descriptive statistics ____________________________________________________ 36
Region-industry level analysis _____________________________________________ 38
Regional distribution ____________________________________________________ 41
Industrial distribution ____________________________________________________ 44

4
Public R&D and knowledge spillovers _______________________________________ 45
Firm-level analysis _____________________________________________________ 50
Local spillovers from universities’ research ___________________________________ 51
Impact of innovation on productivity growth ____________________________________ 58
Descriptive statistics ____________________________________________________ 58
Region-industry level analysis _____________________________________________ 59
Firm-level analysis _____________________________________________________ 64
Productivity returns to R&D capital _________________________________________ 65
Industry heterogeneity __________________________________________________ 67
Regional heterogeneity __________________________________________________ 68
Effect of innovation on inclusive growth _______________________________________ 71
5 Conclusions _____________________________________________________________ 74
6 References _____________________________________________________________ 78
Appendix A _______________________________________________________________ 86
A1. Data sources and matching _____________________________________________ 86
A1.1 UK Innovation Survey (UKIS) / Community and Innovation Survey (CIS) _______ 86
A1.2 Annual Business Survey (ABS) _______________________________________ 87
A1.3 Business Structure Database (BSD)____________________________________ 88
A1.4 Business Enterprise Research & Development (BERD) _____________________ 88
A1.5 PATSTAT ________________________________________________________ 89
A1.6 EU funding data from CORDIS ________________________________________ 90
A1.7 Gateway to Research (GtR) __________________________________________ 90
A1.8 Data on inclusive growth _____________________________________________ 90
A2 Main drivers of innovation _______________________________________________ 91
A2.1 Methodology ______________________________________________________ 91
A2.2 Results __________________________________________________________ 96
A3. Impact of innovation on productivity growth ________________________________ 109
A3.1 Methodology _____________________________________________________ 109
A3.2 Results _________________________________________________________ 111
A4. Innovation and inclusive growth _________________________________________ 120
A4.1 Methodology _____________________________________________________ 120
A4.2 Results _________________________________________________________ 123

5
Executive summary
Background
Technological development, which occurs through the discovery and adoption of innovations, is one of the key drivers of long-term productivity growth. In the process of creating commercially viable innovations, Research and Development (R&D) is one fundamental pillar, as it has a direct effect on innovators’ productivity, and it can also enhance the transfer of technology throughout the economy. However, R&D activities are highly costly, risky and volatile, and tend to be concentrated in very few firms and locations. This has raised concerns about the uneven distribution of innovation and economic gains across the UK, with potential to widen inequalities in terms of productivity and economic growth.
The UK Government is committed to levelling up the whole country. For R&D, this will mean ensuring that no region is left behind in terms of business engagement in R&D, public support to universities and firms’ innovative activities, upskilling and increasing productivity, in order to propel truly inclusive growth. R&D investment in the UK can be critical to increase productivity and prosperity through the adoption of new products and services, and the creation of higher-wage jobs. This also has the potential to tackle very important challenges in terms of environmental, health and wellbeing outcomes, and improve overall living standards across the UK. This process requires a detailed understanding of what are the main drivers of innovation, of the role of both private and public investment in R&D, and of the implications of an uneven distribution of innovation. More evidence is thus needed on how different innovations can translate into better productivity and inclusive growth outcomes, and crucially on how knowledge propagates, to design policies that can secure wider economic and social benefits for many.
Innovation and productivity growth are at the heart of economic policy in the UK. This is becoming clear from their prominent role in the 2021 Plan for Growth, which sets out the importance of innovation to UK prosperity, and highlights the importance of the regional balance of R&D and innovation activity. The UK 2020 Research and Development Roadmap established a Government commitment to increase R&D investment to 2.4% of GDP by 2027, and increase public funding for R&D to £22 billion per year by 2024/25. R&D will become even more critical for the post-COVID economic and social recovery, as shown by the success of the vaccine “moonshot project” and by the launch of the “high-risk high-reward” research-funding agency ARIA, with the objective of building a greener and more resilient UK economy, based on technological development and innovation.

6
UK firms, which are in a continuous battle to improve their levels of productivity and compete in an increasingly fierce global market, need to build on the UK’s comparative advantage in science and innovation. The UK has the opportunity to become a science superpower, building on strong partnerships between universities and businesses, which can support a “Global Britain” vision, in particular in high-growth sectors such as aerospace, the creative industries, financial services, and in emerging industries such as AI and fintech.
Methodology
This report contributes to the existing knowledge base by providing a comprehensive analysis of the factors explaining innovative performance across UK regions, as well as its relationship with productivity and other key measures of the degree of inclusiveness of economic growth. We review the academic literature on these topics, summarising prior contributions and identifying gaps. This report addresses these evidence gaps with several novel contributions.
A first key contribution of this research is the compilation of a comprehensive dataset of innovation activities of UK firms. This was possible by carefully matching different micro-level datasets made available by the Office for National Statistics (ONS), UK Research and Innovation (UKRI), and the Worldwide Patent Statistical Database (PATSTAT)1. We exploit firm level information, and also aggregate the data at the regional and industrial level. Several econometric techniques are applied to undertake a robust empirical investigation of the three main research questions which represent the main contributions of this report:
1. First, we investigate what are the most significant drivers of innovation in the UK, considering different measures of innovation activity and success, distinguishing between the role of private and public investment in R&D. We analyse differences across UK regions and industries.
2. Second, we investigate what are the types of innovations that most enhance productivity growth, identifying the most successful regions and industries in translating innovation into productivity benefits.
3. Third, we investigate the relationship between innovation and the inclusiveness of growth across UK regions, exploring whether an uneven distribution of innovation can help to explain some of the persistent and rising inequalities across the country.
1 The construction of the database relies on access to confidential data through the ONS Secure Research Service.
7
Key findings
Main drivers of innovation
Our analysis suggests that private R&D investment successfully fosters innovation in firms, especially in terms of process innovation and the introduction of new-to-business and new-to-market innovative products. We find that these effects are not evenly distributed across UK regions and industries. R&D investment has stronger effects when considering the most advanced and radical type of innovations, but only in those regions that are the most R&D intensive and more specialised in high-tech industries. In contrast, the effect of R&D investment in more gradual and incremental types of innovations appears to be more evenly distributed across regions and industries in the UK.
We do not find evidence to suggest that public R&D crowds out private R&D. Instead, public R&D seems beneficial as it supports new-to-market innovative products, especially in the Midlands and the North of England. Further findings suggest that this can help smaller and less productive firms, as they might not have enough internal resources to perform R&D fully on their own.
However, firms’ innovation success is not nurtured just by the amount of private or public-funded investment they invest. They also benefit from knowledge and ideas that spill over from geographically and technologically proximate firms, universities or other research organisations undertaking R&D. This analysis shows that these knowledge spillovers do boost firms’ innovation, especially in terms of new patents, and are particularly relevant in the North and in the Midlands, and across all manufacturing and service industries. Private and public R&D investment can additionally stimulate technological improvements and foster idea creation in other firms located in neighbouring areas and across the chains of integrated industries. Firms can then derive new innovations by combining the external knowledge and learning with their own internal resources, ideas and expertise.
Impact of innovation on productivity growth
In turn, both R&D investment and innovation significantly boost productivity growth. On average, our research suggests that an increase in R&D investment by £1 would yield an economic return of up to £0.20. However, this relationship is highly varied across UK industries and regions, and it also depends on the specific estimation method used.
R&D investment has a strong positive effect on productivity, especially in high-tech manufacturing industries and knowledge-intensive services sectors. Positive smaller returns are also found for firms in industries at the lower end of the technology

8
spectrum. From a regional perspective, although R&D investment and productivity levels are higher in the South East, we find that strong effects of innovation on productivity growth can be found in other regions, such as the West Midlands, the North East and Scotland. Productivity growth is mainly driven by patented inventions and the introduction of new-to-market innovative products, while there is limited evidence for the role played by process innovation in improving productivity.
Innovation and inclusive growth
The analysis finds little evidence that innovation and productivity growth translate into more inclusive growth at the regional level. There are no significant differences in the distribution of income, for example, between regions with higher or lower levels of innovation and technological intensity. This finding is particularly relevant to understanding whether public support for R&D could play a role in levelling-up the economy beyond productivity catch-up.
Conclusions and policy implications
The results of this report highlight the importance of R&D investment and broader innovation activities for stimulating the rate of productivity growth. Private R&D investment is the most relevant, but public R&D support plays an essential role, especially in fostering innovation in the least productive firms and peripheral areas. Overall, the distribution of innovation and its effect on productivity differ across regions and industries in the UK. Innovation and productivity growth remain increasingly clustered in a few specific areas and industries, mainly the South East and higher-tech sectors, potentially widening the interregional inequality within the UK.
Crucially, we also find that R&D investment and innovation could effectively foster productivity growth in peripheral regions and in lower-tech sectors. These results mean government policy needs to be informed by place-based considerations, in order to effectively contribute to the “levelling up” agenda aimed at a fairer and more inclusive economy. This could be achieved not only by increasing the resources available to support R&D activities, but also by fostering greater collaboration and partnerships, including the creation of networks between private companies, universities and research institutes across regions and industries. It could also be achieved by investing in research infrastructures that can contribute to the realisation of spillovers through the generation and propagation of knowledge. In addition, ring-fenced R&D funding for smaller and less productive firms operating in low-tech industries and peripheral regions could help propelling higher returns to innovation and promote innovation-led economic growth in left-behind regions. This requires significant investment and institutional support, and the consideration of other

9
regional elements that can deliver stronger and more resilient local economic benefits from R&D and innovation.

10
1 Introduction
Introduction to this report
Productivity growth is important not only for achieving long-term economic prosperity, but to ensure sustainable wage growth and wellbeing, and a more equal distribution of resources in the economy. One of the main drivers of productivity growth is technological development that is achieved through the adoption of innovations. Success in innovation is often considered crucial to maintain a competitive advantage in high-quality and high value‐added productions.
Research and development (R&D) is fundamental to the process of economic growth through the increase in the stock of knowledge, and ultimately the creation of commercially viable innovations. While R&D stimulates innovation, resulting in a direct impact on innovators’ productivity, it also has other indirect benefits, as it can enhance technological transfer more broadly across the economy. Moreover, the view of R&D and innovation as a public good can justify the intervention of public support for private R&D, with the aim of reducing potential market failures and achieving other strategic objectives such as building capacity in specific sectors, technologies or localities.
Innovation and economic growth are at the heart of industrial policy in the UK. This is evidenced by their prominent role in the Plan for Growth, and by the UK government commitment to increase R&D investment up to 2.4% of GDP by 2027, increasing public funding in R&D to £22 billion per year by 2025. R&D will become even more critical for the post COVID-19 economic and social recovery, with the objective of building a greener and more resilient UK economy, based on technological development and innovations.
R&D investment in the UK could lead to an increase in economic productivity and prosperity through the adoption of new products and services and the creation of new high-wage jobs, tackling some of the big societal challenges in improving health, the environment, and living standards overall. However, there are increasing concerns about the uneven distribution of innovation and economic gains, with some evidence suggesting a link between the rising geographical concentration of innovation activity and increasing inequality across regions. R&D activities, as a key input to the innovation process, are highly costly, risky and volatile, and as a consequence, R&D investment tends to be concentrated in very few firms and locations, widening inequalities in terms of productivity and economic growth.
A growing theoretical and empirical literature acknowledges that technological development, which implies the discovery and adoption of innovations, is one of the

11
main drivers of productivity and economic growth. Several studies emphasize the existence of a positive relationship between innovation activities and productivity outcomes (for example Griffith et al., 2006; Hall, 2010; 2011). Firms apply new ideas and technologies to improve the range and quality of products and services offered, and their productive efficiency, leading to a greater output being generated by given amounts of input.
A number of studies have established a link between innovations and productivity, also identifying the main factors that stimulate the process of innovation (for example Ortega-Argilés et al., 2010, 2014, 2015; Castellani et al., 2018). However, many empirical studies have been plagued with several limitations and caveats, as measuring innovation is not straightforward and the identification of a causal link not always possible. The literature has provided evidence that the strength of the relationship between innovation and productivity depends on the measure of innovation considered. Innovation is a multi-dimensional concept as there is not a single way in which firms introduce new products and processes. While spending in R&D is one of the most frequently used proxy measures for innovation, other studies emphasize the need to look at measures of actual innovations that are brought into the market, as all are relevant and can have different implications for growth and productivity prospects.
More investigation is needed to better understand the main drivers of innovation, the role of both private and public investment in R&D, and the implications of an uneven distribution of innovation for inclusive growth. In particular, more evidence is needed on how different innovations translate into better productivity and inclusive growth outcomes, and crucially how knowledge propagates, which is necessary to design policies that can secure wider economic and social benefits for all.
This report provides a comprehensive analysis of the factors explaining innovative performance across UK regions and industries, as well as its relationship with productivity and other key economic measures indicative of the degree of inclusiveness of the growth process. While the main focus of the report is on regional innovation outcomes, and its effectiveness in closing long-standing income gap across regions, it explores more broadly the evidence drawing from a range of research designs and methodologies and data developments. A key contribution of this research project is the compilation of the most comprehensive dataset on innovation activities of UK firms, matching different micro-level datasets provided by the Office for National Statistics (ONS) and UK Research Councils.
A range of advanced econometric techniques are applied to undertake a robust empirical investigation of firms, regions and industries R&D activities and productivity growth. First, the most significant drivers of innovation in the UK are investigated, considering different measures of innovation activity and success, distinguishing between the role of private and public investment in R&D, and analysing differences

12
across UK regions and industries. Second, the report analyses how innovation affects productivity growth, identifying the most relevant innovations that enhance productivity growth. The most successful regions and industries in translating innovation effort into better productivity are identified. Finally, this analysis investigates the extent to which innovation and inclusive growth are related across UK regions, and explores if the uneven distribution of innovation can help explain some of the persistent and rising inequalities across the country.
The main findings suggest that private R&D investment successfully fosters firms’ innovations, but these effects are not evenly distributed across UK regions and industries. R&D investment has stronger effects when considering the most advanced and radical type of innovations, but only in those regions that are most intensive in R&D and more specialised in high-tech industries. In contrast the effect of R&D investment in more gradual and incremental types of innovations appears to be more evenly distributed across regions and industries in the UK.
Public R&D seems beneficial in fostering new-to-market innovative products in particular in the Midlands and the North of England. Firms’ innovativeness is not nurtured just by the amount of private or public investment, but also through the spread of knowledge and ideas that are known to spill over from geographically and technologically proximate firms, universities or other research organisations undertaking R&D. Firms can derive new innovations through a process of combining external knowledge and learning, and with their own internal resources and experience.
In turn, both R&D investment and innovations significantly boost productivity growth. On average, estimates suggest that an increase in R&D investment by £1 would yield an economic return of over £0.20. However, this relationship is highly varied across UK industries and regions, where R&D investments have a strong positive effect on productivity especially in the high-tech manufacturing industries and in knowledge intensive services sectors. From a regional perspective, despite R&D investment and productivity levels are higher in the South-East, strong effects of innovation on productivity growth can be found in other regions such as the West Midlands, the North East and Scotland. Finally, this analysis finds little evidence that innovation and productivity growth translate into more inclusive growth at the regional level, finding no significant differences in income distribution, for example, between regions with different levels of innovation and technological intensity.
The results of this report clearly highlight the importance of R&D investment and broader innovation activities for productivity growth. Overall, the distribution of innovation is radically different across regions and industries in the UK, and with it its effect on productivity. Innovation and productivity growth remain increasingly clustered in a few specific areas and industries, mainly in the South East and in higher-tech sectors, potentially leading to a larger inter-regional divergence within

13
the UK. However, these findings show that R&D investment and innovation could also effectively foster productivity growth in peripheral regions and in lower-tech sectors. Thus, government policy needs to be informed by place-based considerations, in order to contribute to the “levelling up” agenda for fairer and more inclusive growth. This could be achieved not only by increasing the overall resources available to support own R&D activities, but also by fostering greater collaborations and partnerships, including the creation of networks between private companies, universities and research institutes across regions and industries and invest in research infrastructures that can contribute to generate and propagate knowledge spillovers. This requires significant investment and institutional support, and the consideration of other regional elements that can deliver stronger and more resilient local economic benefits from R&D and innovation.
The report is structured as follows. Section 2 provides a brief but comprehensive review of the existing academic literature on this topic, summarising the existing knowledge and identifying the most relevant gaps that motivate this research. Section 3 briefly describes the methodological approach and the data sources used to answer each of the research questions identified. Section 4 reports an in-depth analysis of the main findings of this report, focusing first on the most significant drivers of innovation in the UK, considering then how innovation affects productivity growth, and investigating the extent to which innovation and inclusive growth are related, both at the firm and at the region-industry level. Section 5 concludes by discussing the policy implications of this analysis and identifying the main limitations of this study and the possible options for future work.
14
2 Literature Review
Introduction
A growing theoretical and empirical literature acknowledges that wide diffusion and adoption of technological innovation is one of the main sources of productivity and economic growth.2 A range of studies at the national, regional and sectoral level emphasize the existence of a positive relationship between innovation activities and productivity outcomes (Griffith et al., 2006; Rogers, 2010; Hall, 2010; 2011; Mairesse and Mohnen, 2010; Mohnen and Hall, 2013; Alvarez and Crespi, 2015; Baumann and Kritikos, 2016; Ugur et al., 2016; Morris, 2018).3 Firms apply new ideas and technologies to improve the range and quality of products and services offered, as well as their overall productive efficiency. In other words, more output for a given amount of inputs.
This section summarises the existing evidence and identifies the most relevant gaps in the current understanding that motivate the current research project. It focuses on those findings that establish a link between innovation and productivity, while identifying and highlighting the main factors that stimulate the process of innovation in the first place. This review considers a comprehensive range of studies in an attempt to provide a complete overview of the findings based on different methodologies, empirical measures of the innovation, and levels of data aggregation.
2 This idea is rooted in the endogenous growth literature, which considers that economic growth is positively correlated with investments in research (see
Romer, 1986; 1990).
3 Please refer to Hall et al. (2010) for a comprehensive review of the econometric literature on the relationship between R&D spending and productivity;
Mohnen and Hall (2013) for a review of existing evidence on the effects of innovation on productivity; and to Ugur et al. (2016) for a meta regression analysis
on the relation between R&D and productivity.
15
The relationship between R&D, innovation and productivity
Key points:
Studies find a positive and significant effect of R&D investment on measures of innovation output.
There are many measures of innovation and the literature highlights that it matters how exactly ‘innovation’ is measured, while the ‘type’ of innovation influences the size and significance of findings on productivity.
It is important to distinguish between innovation input measures (e.g., R&D investment) and different indicators of the innovation ‘success’ or output measures (e.g., new-to-the-market or new-to-the-business product innovation, process innovation, patents).
Both innovation input and output measures matter for productivity growth, with product innovation being particularly relevant.
As well as modelling an effect on productivity effect directly, a number of studies recognise that R&D may also have other indirect effects on productivity as it enhances technology transfer, absorption and diffusion more broadly.
From a theoretical perspective, R&D stimulates innovation, resulting in a direct impact on an innovator’s productivity. Many studies consider R&D investments as fundamental to the innovation process of generating new stock of knowledge, with the ultimate goal of creating commercially viable innovative applications of this knowledge (Baumann and Kritikos, 2016). Several studies conclude that there exists a positive relationship between R&D and the likelihood to report an innovation (Baumann and Kritikos, 2016). While investment in R&D is undertaken with a view to innovate, it is not usually a perfectly linear relationship. For example, not all R&D will lead to innovation and will be equally effective, as R&D can be risky as well as costly. Moreover, a number of studies highlight the existence of a time lag between when the actual R&D spending takes place and when it produces revenues (Griliches, 1979; Guellec and van Pottelsberghe, 2004; Van Elk et al 2019). It seems intuitive that R&D is unlikely to become productive immediately, as there is a delay between expenditure and the resulting innovation, as well as from the discovery of the innovation to its actual commercialisation. This is particularly important for forms of basic or breakthrough R&D because it takes longer to go from the scientific invention to the innovation.
16
Both R&D investment and innovations are usually positively associated with better productivity outcomes, although this relationship is likely to be a complex one (Griffith, 2006; Rogers, 2010; Hall, 2010, 2011; Mairesse and Mohnen, 2010; Mohnen and Hall, 2013; Alvarez and Crespi, 2015; Baumann and Kritikos, 2016; Ugur et al., 2016; Morris, 2018). For instance, R&D could lead to an increase in productivity both by improving the quality and by reducing the average production costs of existing goods, or simply by widening the choice of final goods or intermediate inputs available. A seminal study by Griliches (1979) was one of the first to investigate the complex relationship between R&D and productivity using a knowledge production function setting, where the role of R&D is investigated along with other factors of production, such as physical capital and labour. Since then, a number of studies have developed analyses of R&D and productivity based on a similar approach.
While most of the early literature focused on the relationship between R&D, innovation and productivity at the country-level, usually focused on the manufacturing sector, the advent of micro-level datasets saw a rise in firm-level analyses that allowed to investigate the influence of a range of firms’ activities and characteristics on the firms’ innovative behaviour (Hall, 2011). The study of Crépon et al. (1998) represents a pioneering approach to analysing the links between R&D, innovation and productivity at the firm level, as it focusses on different stages in the innovation process. Using survey data for firms in France, Crépon et al. (1998) find a positive correlation between firm productivity and innovation, after controlling for other factors such as the skill composition of the workforce and the capital endowments of firms. Nevertheless, one of the main limitations of these types of approaches is that they are developed as a static model, and mainly applied to cross-sectional data (e.g., within a particular year). This limits the potential of identifying a causal relationship between R&D investment, innovation, and productivity growth, which usually occurs in different stages, generally over a long period of time.
Several studies built on the approach taken by Crepon et al. (1998) estimating the relationship between R&D expenditure and productivity across different countries and industries (e.g., Lööf and Heshmati, 2002; Griffith et al., 2006; Parisi et al., 2006; Hall, 2011; Conte and Vivarelli, 2014; García-Quevedo et al., 2014; Baumann and Kritikos, 2016; Hall and Sena, 2017, Lööf et al., 2017). Despite a variation in the estimated magnitude of the effect of innovation on productivity, mainly due to differences in data sources and methodologies, the vast majority of these studies identifies a positive relation between a firm’s R&D investment and the introduction of innovations and productivity growth. More recent contributions use administrative data from dedicated innovation surveys, providing more comprehensive and timely data, allowing researchers to track the behaviour of innovators over time. This also enables the use of more advanced econometric techniques to analyse the impact of R&D and innovation in more dynamic and causal settings. Notably, Peters et al.
17
(2017) estimate a model of discrete R&D investment and calculate the cost and long-run payoffs for German manufacturing firms. The authors show that R&D investments increase the likelihood of obtaining both product and process innovations, finding evidence of a particularly large positive effect of R&D investment especially for high-tech firms.
Moreover, these later approaches also allow researchers to explore different types of innovation activities, not only R&D investment, but also considering the development of product and process innovations. Drawing on data from the internationally harmonised Community Innovation Survey (CIS), Griffith et al. (2006) explore the drivers of innovation and how they feed into productivity across four main European countries. They find that broadly comparable processes drive firms’ decisions to engage in R&D across major European countries, with government funding playing an important role. In line with expectations, they conclude that the amount of R&D spent per employee is positively associated with a firm’s ability to become a process innovator. The results on productivity are more mixed, with the link between product and process innovation on labour productivity being more evident in some countries than in others. The authors find a stronger positive impact of product innovation on productivity, relative to measures of process innovation. Hall and Sena (2017) extend previous studies by looking at a broader definition of innovation beyond R&D spending. Comparing their results with existing literature, the authors show that R&D spending is part of the total innovation effort of a firm, and the relationship between R&D, innovation and productivity is very similar.
In this regard, two of the main advances in the literature are:
1. the recognition that innovation is not a homogeneous event, and
2. that considering different types of innovation, and how these are measured, matters in order to explain the differences in size and statistical and economic significance of estimates across empirical studies.
For instance, a fundamental distinction has been made between R&D investment as an input to the innovation process, and the output measures of innovation, such as the number and type of product and process innovations, trademarks or patents. The latter are considered to capture the successful part of the innovation process, providing a direct channel through which the commercial adoption of a particular innovation affects performance (Kleinknecht et al., 2002). Crucially, the introduction of new products and processes can also be a disruptive process of transformation for firms.
Hall (2011) argues that the positive association between innovation and productivity is mainly channelled through product innovation, rather than through process innovation which often has a negative association. The observed differences in the effects of product and process innovations on productivity may also be due to
18
measurement error in the innovation variables, which would lead to an upward bias in the estimation of the effect of product innovation, and to a downward bias for process innovation. However, these two types of innovation are sometimes difficult to disentangle, and also often complementary. The effects of product innovation can be particularly difficult to measure because of the difficulties of reflecting quality improvements in the data (as opposed to entirely new products). New products also imply adjustment costs that could also lower productivity in the short run. In fact, Isogawa et al. (2012) point out that the development of new processes or products may temporarily reduce the value of sales as a result of the costs of adaptation, cannibalisation of sales of older varieties of a product, or changes to the production process. Likewise, if a product is only new to a firm but not to the market, then the company may have to lower prices (and thus profit margins) in the short term to gain market shares. Another drawback of using indicators of product and process innovations is that this involves a certain degree of subjectivity or bias as they are usually self-reported by companies when participating in innovation surveys. Some argue that more codifiable measures like number of patented innovations, or even the amount spent in R&D are more likely to offer an accurate measure of innovation effort or success (Kleinknecht et al., 2002). In addition, not accounting for the total R&D expenditure may underestimate the overall effect of innovation on productivity, as R&D expenditure generally improves a firms’ stock of knowledge and human capital even if it does not result in the introduction of a new innovation (Mohnen and Hall, 2013). Thus, it becomes clear that different measures of innovation should be considered in order to properly analyse the importance of R&D activities for productivity growth.
19
Differences in drivers of productivity across firms and sectors
Key points:
The relationship between R&D, innovation and productivity differs across firms and industries, and importantly, it is not confined to high-technology sectors and large firms only.
On average, innovation occurs more frequently in firms that are larger, more productive, export intensive, and foreign-owned, but it is also important for SMEs, particularly in terms of process innovation.
SMEs often lack the resources needed to invest in risky R&D activities, which makes them more reliant on external sources of knowledge and R&D capabilities.
The returns to R&D investment in terms of innovation and productivity are generally much larger in high-tech sectors. However, it is also important in lower-tech sectors, especially in terms of investment in tangible capital which could lead to incremental and process innovations.
Several studies in the economics of innovation literature highlight the heterogeneity in the relationship between R&D investment, innovation output and productivity across several dimensions. A key dimension of the diversity in the innovation-productivity relationship is given by the industrial classification. The vast majority of the evidence points to a much larger impact of R&D and innovation on productivity for high-tech firms when compared to medium- or low-tech ones (Ortega-Argilés et al., 2010, 2014, 2015; Montresor and Vezzani, 2015, Kancs, and Siliverstovs, 2016, Castellani et al., 2018). This does not mean that innovation does not matter at all in lower-tech sectors (Robertson et al., 2009). Ortega-Argilés et al. (2015) show that in low-tech sectors, productivity is more correlated with capital accumulation than with R&D expenditures. In addition, Kirner et al. (2009) show that low-technology manufacturing firms lag behind their medium-high-tech counterparts in terms of product and service innovation, but they seem to perform equally well, and in some respects even better, in terms of process innovation adoption. Nevertheless, a study by Crowley and McCann (2018) looking at the impact of product and process innovation across manufacturing and services firms in different European economies finds no differences in terms of productivity improvements across sectors.

20
The importance of innovation for productivity growth also varies according to several other firm characteristics, most prominently firm size. Early studies were based on the assumption that small and medium enterprises (SMEs) have little innovative capacity, and hence were often excluded from empirical analyses, also due to lack of data. More recent studies have investigated the extent to which smaller firms can indeed be successful innovators (Baumann and Kritikos, 2016). Overall, the vast majority of the evidence for SMEs suggests that R&D intensity is positively associated with the probability of reporting innovation, and this effect is larger in the case of process rather than for product innovations. This is most pronounced in the case of micro firms (those with less than 10 employees). However, as SMEs often lack the resources needed to invest in risky R&D activities and might also be less capable of quickly adjusting to shocks and potential failures, they might be more reliant on external sources to fund their R&D capabilities. These include receiving public support (Vanino et al., 2019), connecting to local universities (Hewitt-Dundas et al., 2017), and establishing linkages with their local economy environment (Robinson et al., 2020).
There are also other firm-level activities that have been found to lead to higher levels of innovation and productivity. Several studies have identified that as well as investment in R&D (Blundell et al. 1999; Griffith et al., 2006; McCann and Ortega-Argilés, 2013), investment in machinery and equipment, human capital and employee training all lead to innovation. In addition, firms that export (or export more) and have foreign owners and group affiliations have also been found to be better in terms of their innovativeness and overall performance (Trigo, 2013; Crowley, 2017).

21
Knowledge transfers and spillovers
Key points:
Research & Development stimulates innovation, which directly impacts on productivity, and has potentially other indirect benefits, as it enhances the diffusion and absorption of technology.
Geographical proximity is essential to facilitate the transfer of knowledge across businesses and organisations, especially when knowledge is intangible, tacit and not easily codifiable.
Innovation is not an isolated process, and takes place inside a complex network of interactions and learning opportunities between proximate organisations.
Innovation and productivity are not evenly distributed across regions. Some regions are more innovative than others, due to their industrial structure, the concentration of high value-added activities, and an environment that is conducive to research and innovation.
Policy interventions can help develop innovation processes and promote regional economic growth. This includes linking research institutes and businesses, the creation of local networks of innovation transfers, innovation hubs, and the attraction of external sources of knowledge such as multinational enterprises.
While most of the literature surveyed so far suggests that R&D stimulates innovation, resulting in a direct impact on the innovators’ level of productivity, there are also indirect benefits for surrounding economic agents. R&D enhances transfers of technology from firms and organisations at the technology frontier to those lagging behind, thus becoming a so-called ‘public good’. Griffith et al. (2004) highlight the ‘two faces’ of R&D, on the one hand ‘stimulating innovation’, and on the other ‘facilitating the imitations of others’ discoveries. The latter relates to the ability that firms have to assimilate outside knowledge from frontier firms, or other firms connected via supply chains.
The ability to productively assimilate knowledge from frontier firms is also referred to as ‘absorptive capacity’. More than a by-product of firms’ R&D activities, absorptive capacity can be considered as equally important to the overall level of innovation in an economy as it facilitates the diffusion from innovators to organisations with less R&D activities of their own (Cohen and Levinthal, 1990; Schmidt, 2010). These indirect effects or ‘spillovers’ are usually harder to capture empirically, as knowledge transfers famously do not always ‘leave a paper trail’. Studies on knowledge

22
spillovers tend to look at how R&D carried out in one firm, sector or country may produce positive effects in other firms, sectors or countries in proximity. Proximity can refer to spatial or geographical proximity, as well as cultural or technological proximity. These processes usually take time and are more likely to take place between enterprises that have closer or pre-established ties.
Viewing R&D and innovation as a public good (i.e., with benefits beyond the immediate creator of the knowledge) also justifies the intervention of public support to stimulate R&D undertaken by private companies, in order to achieve strategic objectives such as building capacity in specific sectors, technologies or places (Vanino et al., 2019). When governments set the objective to increase levels of R&D investment via incentives, this is based on the rationale that it can lead to increased innovation capabilities and economic growth in the economy as a whole. Yet, R&D is generally recognised as being a costly and risky activity, and it tends to be concentrated in few firms and it is unevenly distributed across geographical areas and industries. There are rising concerns about this uneven distribution, with some evidence pointing at increasing inequality in prosperity within countries as a result (Crescenzi et al., 2020).
As this evidence highlights, a potential determinant of firms’ success in innovating and achieving higher productivity is the location from which they operate (Boschma, 2005; Moretti, 2012; Hughes, 2012). Geographical proximity facilitates the transmission of local knowledge, as it is easier to transfer knowledge over shorter distances, especially when knowledge is tacit, non-codified and needs face-to-face interaction (McCann, 2007). Geographical proximity is not enough to confer any automatic advantage for innovation, as other dimensions of proximity, such as cultural, institutional and technological proximity between firms or organisations, may also influence the innovation process (Boschma, 2005). Cities play an important role since the spatial agglomeration of firms and workers is fundamental to foster interactions and knowledge creation, which in turn leads to increases in productivity (Florida, 2003). While theoretical studies discuss the existence of “involuntary” flows of knowledge and R&D externalities within agglomerated areas, empirically these indirect effects are hard to quantify.
Starting from these theoretical predictions, the idea of a regional innovation system (RIS) was developed to capture the dynamics of innovation at the regional level. This concept is based on the view that innovation can be a key driver in closing the productivity and income gaps between regions as technological changes and innovation depend on the interaction between agents in different institutions and locations (Cooke et al., 1998). Thus, innovation is not an isolated process; rather, it is produced inside a complex network and interactive learning (Doloreux, 2002).4 Based on this, the ability of organisations within a region to collaborate and
4 For a complete review on the empirical evidence on regional innovation systems see Doloreux and Gomez (2017).

23
disseminate knowledge is positively associated with regional innovation and growth. Mason et al. (2013) study the impact of city-region characteristics on firm-level innovation and growth outcomes. The authors find a positive effect on firm-level innovation performance in production sectors, suggesting that the quantity and quality of localised interactions between firms and their employees are more intensified by the proximity of highly innovative firms in these sectors. The authors also find a positive effect of firm innovation performance on several local socio-economic and labour market conditions.
The fact that some regions are more innovative than others is often attributed to a number of factors, including the prevailing industrial infrastructure, the presence of high value-added activities, the existence of knowledge-promoting institutions, and the quality of regional governance as well as a number of other historical and institutional factors (OECD, 2011; McCann and Ortega-Argilés, 2013; Morgan, 2017). Thus, persistent regional differences may be partially explained by the ‘regional innovation paradox’ and while the main challenge for less developed regions is to invest more in innovation, they have lower capacity to absorb knowledge in the first place (Oughton et al., 2002; Muscio et al., 2015). Muscio et al. (2015) highlight that weak linkages between businesses, universities and research centres pose a great obstacle to obtaining product and process innovation. In order to solve this paradox, appropriate policies need to be identified to improve the ability of regions to retain investment and to promote innovation (Grillo and Landabaso, 2011).
In line with this, several public policies have emerged aimed at developing innovation processes and networks that promote regional economic growth. These include policies that intend to better link research institutes and businesses, to create local networks of innovation transfer, innovation hubs, and to strength the support of R&D collaborations between local authorities and regional agencies (D'Este et al., 2013; McCann and Ortega-Argilés, 2013).
In particular, the presence of multinational enterprises (MNEs) is an important factor for the development of regional innovation systems, as they can act as a source of technology generation and transfer (Iammarino and McCann, 2013). Often countries and regions compete to attract MNEs as they see them as a source of positive externalities, such as productivity improvements and market access (McCann and Acs, 2011; Crescenzi et al., 2015). The literature on regional economics has focused on agglomeration economies as a driver of MNEs’ location decisions, discussing the consequences of MNEs entry for the innovation and productivity externalities towards domestic firms in the local economy (Guimarães et al., 2000; Ascani et al., 2016, Iammarino and McCann, 2018). As most location benefits are concentrated in specific agglomerated areas, these tend to attract more MNEs activity, which strengthen even more their advantage and the transfer of knowledge, contributing

24
further to widen regional inequality in productivity and innovation (Iammarino and McCann, 2018).
The role of public R&D for private R&D
Key points:
Public R&D investment plays a key role in fostering both public and private innovation, and economic growth.
Public intervention in R&D activities is justified as private R&D does not account for wider public benefits and hence would lead to less investment than would be socially optimal. It also builds capacity in strategic sectors or technologies.
There is a positive effect of public R&D subsidies on private R&D investment, while there is no evidence of crowding out private investment (i.e., substituting for private investment).
The effect of public R&D support on innovation outputs is also found to be positive, and it is associated with higher probability of introducing novel product innovations.
The evidence on the effect of public R&D support on productivity is mixed. Evidence for the UK shows some positive effects on employment and turnover growth, in particular for smaller and less productive firms in high-tech sectors.
When considering the role of innovation for economic growth, the role of public investment in R&D and of public support for private R&D efforts cannot be neglected. Public intervention in R&D activities is generally justified in terms of either market failures linked to firms’ difficulties in appropriating the full returns from R&D itself, or of more strategic objectives linked to the desire to build capacity in specific sectors, technologies or localities. In both cases the objective is to incentivise increased levels of investment in R&D activities which will, in the longer term, lead to increased innovation capabilities and better economic outcomes.
Public R&D support reduces the private financial risk and increases the likelihood that a firm will undertake innovation projects (Zona, 2012). This can be achieved via cost-sharing, however there could are concerns about the commercial viability of any resulting innovation that need to be addressed (Roper et al., 2008), as well as the cost-effectiveness and duration of the R&D project (Von Stamm, 2003; Astebro and
25
Michela, 2005). As a result, public support may encourage firms to carry on projects with a higher risk-reward ratio.
Public support for innovation may also have ‘market-making’ objectives that address particular social or economic challenges (Mazzucato, 2016). For example, there may be a particular role for the public sector where technologies are emergent and markets uncertain (Van Alphen et al., 2009), or where there are wider social benefits from an innovation (Zehavi and Breznitz, 2017). Finally, public R&D and innovation support can play an enabling or bridging role, helping firms to access otherwise unavailable knowledge resources. Innovation vouchers, for example, incentivise firms to approach knowledge providers, such as universities or public research institutes, who they might not have worked with otherwise (OECD, 2010).
A large body of literature provides empirical evidence on the relationship between public and private R&D. The large majority of studies finds a positive effect of public R&D subsidies on private R&D investment, thus adding resources to private investment and reject the idea of a ‘crowding-out effect’ of private investment by public subsidies (Zuniga-Vicente et al., 2014; Dimos and Pugh, 2017). A review by Becker (2015) suggests that this ‘policy additionality’ effect is mostly relevant for small firms, which are more likely to experience financial constraints, and that these firms are more likely to start investing in R&D if they receive a subsidy.
The effect of public R&D support on innovation outputs has also received considerable attention in the literature. For instance, Becker et al. (2016) evaluate the effectiveness of public support at the regional, national and EU-level in promoting innovation activity and its market success in the UK. Their findings indicate that national innovation support is associated with a higher probability of obtaining product or service innovations.
The positive effects of public R&D support on private R&D investment and innovation do not necessarily imply that these public programs enhance productivity, and thus eventually contribute to economic growth (Cin et al., 2017). In order to assess the existence of such a direct relationship, a second stream of research has emerged, investigating the link between public R&D support, innovation input, innovation output and firm performance. Overall, the range of these studies is broad, and the results are mixed, with some studies finding that subsidy recipients achieve higher innovative productivity and are more likely to improve performance (Lerner 1999; Zhao and Ziedonis 2014; Criscuolo et al. 2016; Howell 2017). Others suggest that public innovation grants do not significantly improve firm productivity, employment growth or export performance (Gorg and Strobl 2007; Martin 2012; De Blasio et al. 2015; Criscuolo et al. 2016). Focusing on the UK, a recent study by Vanino et al. (2019) has evaluated the impact of UKRI grants on the performance of participating firms, finding a positive effect on employment and turnover growth, both in the short term (up to 3 years) and in the medium term (up to 6 years). The effect was bigger

26
for firms in R&D intensive industries and for smaller and initially less productive firms.
Links between innovation and inequality
Key points:
Innovation and economic growth are not evenly distributed and tend to be concentrated in specific areas, thus reinforcing regional inequalities. This has led to calls for a policy agenda that puts inclusivity at its heart.
There are increasing concerns over the effect of technological change on the distribution of wages and income, with some evidence suggesting a connection between an increasingly uneven geographical distribution of innovation and economic inequalities.
A large body of studies looked at the effect of technological change on the distribution of wages and income at the firm-level, finding a higher premium for low-skilled employees working in more R&D intensive firms relative to high-skilled workers.
Area level studies found that innovation increases inequalities between regions and cities, especially in Europe and Canada, but not in the United States, due to less flexible labour markets and lower levels of internal migration.
Many studies highlight that innovation and economic gains are not evenly distributed across geographies. Rather, they tend to be concentrated in specific areas, which reinforces the advantages of locating new innovative activities in those areas as well. This self-reinforcing cycle will further widen regional inequalities in terms of productivity and innovation.
There is a vast academic literature on the relationship between economic growth and income distribution. Recently, widespread concern has arisen over high, and often rising, income and wealth inequality in many countries.5 From the perspective of geographical differences, there is evidence that inequality among regions has increased (Iammarino et al., 2019), and the concept of ‘inclusive growth’ has fast become a new mantra in urban and regional policy in response to spatial economic inequalities (Lee, 2019).
5 Stiglitz, J., Sen, A. and Fitoussi, J. (2009), Report by the Commission on the Measurement of Economic Performance and Social Progress. See also the follow up reports: Stiglitz, J., Fitoussi, J.-P. and Durand, M. (2018a), Beyond GDP: Measuring what Counts for Economic and Social Performance, OECD. Stiglitz, J., Fitoussi, J.-P. and Durand, M. (2018b), For Good Measure: Advancing Research on Well- Being Metrics Beyond GDP, OECD.

27
However, there is no universal definition of inclusive growth. The OECD (2014) argues that it is “a new approach to economic growth that aims to improve living standards and share the benefits of increased prosperity more evenly across social groups”. According to the Scottish government: “When we talk about growth, we mean growth that combines increases in prosperity with greater equity, creates opportunities for all and distributes the dividends of increased prosperity fairly”.6 These definitions make clear that inclusive growth is not just about redistribution, but increasing output and ensuring that the increase is distributed in such a way as to be ‘inclusive’ (Lee, 2019).
Several studies have tried to measure inclusive growth. For the UK, Beatty et al. (2016) have introduced an ‘Inclusive Growth Monitor’ for the 39 local enterprise partnership (LEP) areas in England. This tool can be used to create different measures of ‘inclusiveness’, including levels of income and inequality, unemployment rate, economic inactivity rates, share of workless households, share of employment in low paid sectors, as well as various measures of housing affordability.
A significant body of research has focused on the effect of technological change on the distribution of wages and income. Most relevant to the current work is a study by Aghion et al. (2018) who use matched employee-employer data from the UK, along with information on R&D expenditures, to analyse the relationship between innovativeness and average wages across firms. They show that more R&D intensive firms pay on average higher wages, and that the premium for working in more R&D intensive firms seems to be higher for low-skilled workers than for high-skilled workers. This type of firm level analysis is somewhat limited in that it does not consider the overall effects on the distribution of wages within a geographic area, and is solely focused on wages, whereas there are other important dimensions of inclusiveness such as unemployment, inactivity and affordability.
A closely related study is a paper by Lee and Rodríguez-Pose (2013) who use micro data from population surveys to study the relationship between innovation and inequality across Europe and in North America between 1996 and 2001. They find no apparent link between innovation and inequality in the case of the United States, but they do find that innovation increases inequalities between regions in Europe and in cities in Canada. They suggest two effects might be at work: a growth effect which reduces inequalities and an innovation effect which increases them. Lee and Rodríguez-Pose (2013) suggest that less flexible labour markets and lower levels of migration in Europe relative to the US might explain the negative relationship between innovation and inequality found in Europe.
6 https://www.gov.scot/policies/economic-growth/inclusive-growth/

28
Another related study by Hornbeck and Moretti (2019) exploits geographical differences to estimate the direct and indirect effects that productivity gains in manufacturing firms in the United States have on workers’ wages, housing costs and purchasing power, although it does not consider innovation directly. They find that local productivity growth in manufacturing reduces local income inequality, as it raises earnings of less-skilled workers more than the earnings of more-skilled workers. Moreover, part of the increase in purchasing power that occurs outside cities is directly influenced by local productivity growth.
A recent contribution by Crescenzi et al. (2020) investigates how the geography of innovation across regions and countries worldwide has changed radically, and with it the geography of wealth creation and prosperity. In the last few decades high incomes have increasingly clustered in metropolitan areas, which are also global innovation hubs, leading to a rise in inter-regional divergence within countries. The authors argue that the emerging geography of innovation can be characterised as a globalized hub-to-hub system, rather than a geography of overall spread of innovation. In addition, there appear to be strong links between the growing geographical inequality of innovation and of prosperity, particularly within countries. This is particularly relevant in the context of potentially declining overall productivity of research itself, where innovations are becoming increasingly complex and increasing amounts of R&D investment are needed to achieve a smaller amount of innovations (Jones, 2009). This phenomenon could be further driving growing geographical concentration of R&D (due to the fact that resources to invest are finite), leading to a direct link between the spatial distribution of innovation, the level of economic development and income distribution.

29
3 Data and Methodology
Introduction
This section briefly describes the methodological approach and the data sources used to answer each of the research questions identified after the review of the existing literature. Each research question requires a different but complementary econometric methodology and data in order to explore the heterogeneous relationship between R&D investment, innovation and productivity, both at the region-industry and at the firm level. To this end, a comprehensive dataset of UK firms innovation has been assembled, matching together different micro-level datasets provided by the Office for National Statistics (ONS), the UK Research and Innovation (UKRI), and the Worldwide Patent Statistical Database (PATSTAT). The most advanced econometric techniques have been applied, to provide a robust empirical investigation of three main research questions. Further details on data construction and methodology can be found in Appendix 1.
Data
For this report a comprehensive dataset of UK firms innovation activities has been assembled, matching together different micro-level datasets provided by the Office for National Statistics (ONS), UK Research Councils and the European Commission.
The main dataset providing information on firms R&D activities is the UK Innovation Survey (UKIS). This is a representative survey collecting data from businesses about various aspects of their innovation-related activities on a biennial basis from 2001 to 2017. In particular, it provides information on both innovation inputs (such as R&D expenditure, share of employees working on R&D related activities, external resources and cooperation with other institutions or businesses), and outputs (such as share of turnover from new innovative goods or services, patents granted, process innovations, etc.). The UKIS is complemented using the Business Enterprise Research & Development (BERD) dataset, covering information on firms’ annual spending and numbers of employees in R&D activities, and detailed information on R&D occupations and tasks for a relatively smaller sample of UK firms.
In order to link innovation data with firm-level performance data, the UKIS data is matched to the Annual Business Survey (ABS) using companies unique identifiers, which contains balance-sheet information on the population of UK firms larger than 250 employees and a representative sample of smaller firms. This dataset is key for this analysis as it provides information on sales, salaries, costs of inputs and investment in capital assets, which are essential in order to calculate Total Factor

30
Productivity (TFP). In addition, information on firms is complemented using the Business Structure Database (BSD), covering the population of firms in the UK (all of those that are VAT or PAYE registered). While the coverage of BSD is more complete, it provides only limited information on UK businesses, specifically firms’ age, employment, turnover, postcode, industrial classification and ownership information.
These core datasets are then linked to additional data. First, the Worldwide Patent Statistical Database (PATSTAT) is used, containing detailed information about all patents granted worldwide since 1975, including names of applicant and inventor, country, technology field and citations. For the period 2008-2018, data for around 452,000 patents registered worldwide by almost 22,000 organisations based in the UK are reported. Second, two additional sources of information regarding public R&D funding received by UK firms and organisations are considered. First, data from the Gateway to Research (GtR) website developed by the UK Research Councils are collected, providing information about all public and private R&D projects publicly funded by UKRI from 2004 to 2016, such as number and value of funded projects, the number and characteristics of public and private partners.7 In addition, this is complemented with data on EU funded projects in the UK from the CORDIS database, providing information on UK organizations participating to EU funded R&D projects, such as the Horizon2020 framework.
Finally, the Annual Survey on Hours and Earnings (ASHE) and the Labour Force Survey (LFS)/Annual Population Survey (APS) are used to construct a time series of measures of inequality and inclusive growth such as housing affordability, economic inactivity, and number of workless households for the period 2005-2017.
Table 3.1: Description of datasets used for this analysis.
Name Source Period Variables Type
UK Innovation Survey
ONS 2001-2017
Total R&D investment, Internal and External R&D, Number of Scientists Employed, Process Innovation, Product Innovation, Sales of New to the Business Products/Services, Sales of New to the Market Products/Services.
Survey
Business Enterprise Research & Development
ONS 1995-2017
Expenditure in Science and Engineering, R&D Training, R&D Design, R&D Equipment, Other R&D expenditures.
Survey
7 See Vanino et al. (2019) for a comprehensive description of this dataset.

31
Name Source Period Variables Type
Annual Business Survey
ONS 1997-2016
Employment, Turnover, Capital Expenditure, Capital Stock, Cost of Intermediate Inputs, Labour Cost, Revenue from Exports, Share of Foreign Ownership.
Survey
Business Structure Database
ONS 1999-2018
Employment, Turnover, Age, Foreign Ownership, Group Identifier, Postcode, Industrial Classification.
Population
Worldwide Patent Statistical Database
EPO 1975-2018
Patent title, identifier, registration office, registration date, owners identifier, inventors identifiers, technological classes.
Population
Gateway to Research
UKRI 2004-2016
Value of UKRI grants, Funding organization, Project identifier, Project partners, Project Dates.
Population
CORDIS EC 2000-2018
Value of EC grants, Funding Programme, Project identifier, Project partners, Project Dates.
Population
Annual Survey on Hours and Earnings
ONS 1997-2018
Number of low-earners, inequality indicators, employment in low-pay sectors, housing affordability, higher than median earners, STEM employment.
Survey
Annual Population Survey
ONS 2004-2017
Unemployment, Workless households, Tertiary Education, Earnings.
Survey
Methodology
This section provides a brief overview of the methodologies applied in order to answer the three main research questions. Further information and details about the methodologies and techniques used are available in the appendix.
32
Main drivers of innovation
In order to explore what drives innovation, a linear regression model of the relationship between R&D inputs and innovation outputs is estimated, both at the firm and at the region-industry level. The effect of R&D investment on innovation performance is modelled considering several innovative outputs, including the number of patents granted to firms, the likelihood of firms introducing product and process innovations, and the average share of sales related to new-to-market and new-to-business innovations.
The effect of R&D investment on these innovation outputs is investigated by distinguishing between public and private innovation inputs, and further disentangling the effect of private investment in different kinds of R&D activities. Innovation is multifaceted and it is recognised that no one measure captures all dimensions. Thus, in order to be as thorough as possible, several measures of R&D activities are used, including internal and external resources dedicated to R&D, the number of scientists and other employees involved in R&D, expenditure in science and engineering activities, in R&D training, design and equipment, and finally other R&D related expenditures. In addition, the report analyses the role played by public funding in supporting private firms R&D activities, in particular by considering R&D grants funded by UKRI and through European Commission programmes.
Furthermore, the role of R&D spillovers and knowledge externalities across regions and industries is explored. To do so, a variable capturing the R&D performed by other firms is included, thus representing the ‘potential’ of knowledge transfers across firms. The measure of R&D performed by ‘neighbouring’ firms is weighted by spatial distance, looking at all R&D performed by firms within a 250 kilometre radius, and technological distance, considering the intensity of input-output linkages between firms in different sectors.
The model then controls for several firm specific characteristics known to influence the propensity of firms to undertake R&D activities and produce innovation. These include employment size, age, foreign ownership and export intensity. The model also controls for region-specific and industry-specific trends as well as firm, region-industry and time fixed-effects. In order to test for heterogeneous effects across regions and sectors, the main measures of R&D activity are interacted with region and industry dummies, comparing how the impact of R&D activities on innovation outputs varies across space and industries.
To perform this investigation at the region and industry level, the regression analysis is replicated on aggregated firm-level data at the ITL1 region and SIC2 industry classification level.8 ITL1 and SIC2 classifications are mainly considered because of data coverage limitations of some of the surveys. Especially in the case of the UKIS
8 The 62 SIC2 industries are aggregated into 27 macro-sectors, based on the SIC sub-classification.

33
and of the BERD datasets, the number of firms per region and industry would be too small at a finer level of aggregation in order to be sufficiently representative of the region-industry structure. To aggregate firm-level data at the region and industry level, statistical weights provided by the ONS are used in order to assure the representability of the data gathered from survey datasets. In the case of population datasets, data are instead aggregated through simple means or sums.
Finally, several sensitivity tests are performed, following alternative estimation procedures in order to prove the robustness of the analysis, and to address potential concerns of endogeneity and reverse causality. First, an instrumental variable approach is followed based on the shift-share methodology (Baum-Snow and Ferreira, 2015; Goldsmith-Pinkham et al. 2018), where the R&D investment of firms is predicted by each region-industry initial share of R&D investment in the country and the growth over the period of R&D investment in the rest of the country. Second, an alternative approach is followed employing the generalized method of moments (GMM), whereby instruments are used for the possible endogenous variables, using their two-period lagged values and the lagged values of public funding to R&D.
Impact of innovation on productivity growth
In order to estimate the relationship between innovation and productivity at the firm-level, a production function approach is followed where value added per worker is explained by the inputs of production (i.e. labour and intermediate inputs), tangible capital, and intangible knowledge. The production function is estimated using a linear regression model where value added and the stock of physical capital and R&D are weighted by total employment in order to consider firms’ size. In addition, measures of innovation outputs are included in the model, in order to estimate the differential impact of R&D inputs and outputs on firms’ productivity.
The model controls for several firm characteristics such as employment size, age, foreign ownership and export intensity, and finally for region-specific and industry-specific trends as well as firm, region-industry and time fixed-effects. The model tests for the heterogeneity of productivity returns to R&D and innovations across regions and sectors, by interacting the main measures of innovation output with region and industry dummies.
Given the strongly balanced structure of the region-industry panel data (no missing year or region observations), a different but comparable approach is followed at the region and industry level, where the results from the previous section are used to predict the propensity of regions and industries to introduce innovation outputs based on their R&D investment. These predictions are included to estimate the contribution of innovation outputs to productivity, measured following the total factor
34
productivity (TFP) approach, after controlling for region-industry R&D intensity and other economic conditions.
As previously highlighted, also in this case the investigation at the region-industry level is done at the ITL1 region and SIC2 industry classification level. In addition, the same sensitivity tests are performed to check the robustness of the analysis, mainly applying a shift-share instrumental variable approach and employing the generalized method of moments (GMM).
Innovation and inclusive growth
To analyse the relationship between innovation and inclusive growth, a linear regression model is estimated at the regional level, where innovation is proxied by R&D investment intensity and several measures of inclusive growth are considered. As discussed in the literature review, there are multiple definitions of inclusive growth, as it is a multifaceted phenomenon and arguably cannot be captured by a single measure. Following the JRF (2017) report, several measures of inclusive growth at the regional level are considered, such as the share of low earners over total employment, the degree of inequality, the rate of unemployment, the percentage of workless households, the percentage of employment in low pay sectors, the percentage of workless households, and a measure of housing affordability. The analysis is undertaken at Travel to Work Areas (TTWA) in the UK, as these are considered to be fairly representative of the local labour markets conditions, where approximately 75% of the people who live in a TTWA also work in the same area.
This allows to estimate the relationship between inclusive growth and innovation by using two models that take into account time invariant characteristics of regions. First, a linear regression model is estimated for the period 2005-2017 with TTWA and year fixed effects, where the different measures of inclusive growth at the local level are regressed against the R&D intensity in the region, after controlling for a set of socio-economic variables at the TTWA level such as tertiary education attainment, average wages and the availability of STEM skills. Second, a first-difference model is estimated over the same period, where changes in regional inclusive growth outcomes are related to changes in R&D intensity, while controlling for other time-varying socio-economic conditions. In this way, the models identify both the statistic and dynamic relationship between innovation and inclusive growth across UK regions.
35
4 Results
Main drivers of innovation
The first research question explores what the most significant drivers of innovation are in the UK, both at the firm and at the region and industry level. The relative importance of these drivers in terms of innovation outcomes is estimated, together with the role of private and public investment in R&D, and differences in drivers across UK regions and industries.
The key findings are:
The distribution of R&D activities is not evenly spread across UK regions and is mostly clustered in the South-East.
Higher R&D expenditure leads to more innovation outputs, particularly for process innovation and the introduction of new-to-business and new-to-market products. This effect holds at the region-industry and firm-level and is evenly distributed across regions and industries.
R&D investment also strongly affects the creation of the most advanced and radical innovations such as patents and new-to-market products, but only in R&D intensive regions and in high-tech industries.
There is a positive effect of public R&D funding and knowledge spillovers between firms on patenting activity and introductions of new-to-market products, but those are mainly clustered in few regions.
There is evidence that public R&D funding could help firms facing constraints to R&D investment in more peripheral regions of the country.
This section identifies the main drivers of innovation in the UK, looking at how public and private resources invested in R&D activities translate into different types of innovation outputs. First, the regional distribution of R&D investment and innovations across the UK is presented. Then, the relationship between R&D inputs and innovation outputs is analysed at the region-industry level, to provide an overview of the regional and industrial heterogeneity. Finally, this section looks at the relationship between R&D inputs and innovation at the firm-level, to take account of other firm specific characteristics.
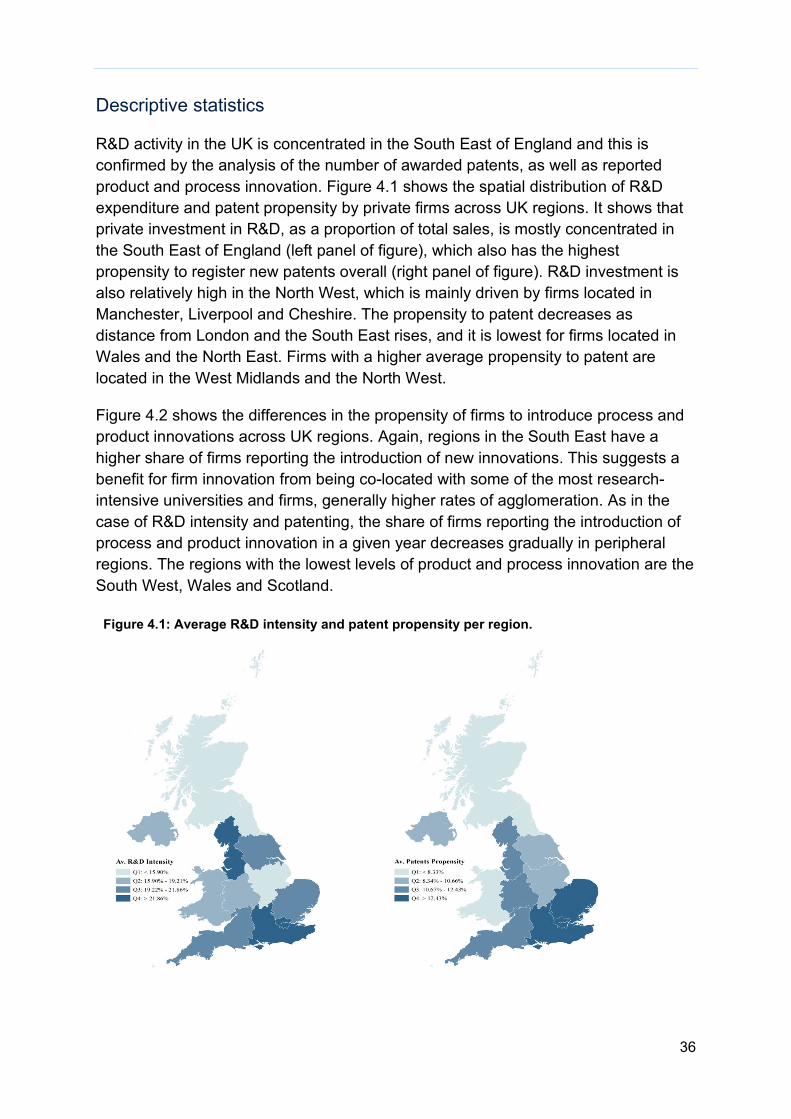
36
Descriptive statistics
R&D activity in the UK is concentrated in the South East of England and this is confirmed by the analysis of the number of awarded patents, as well as reported product and process innovation. Figure 4.1 shows the spatial distribution of R&D expenditure and patent propensity by private firms across UK regions. It shows that private investment in R&D, as a proportion of total sales, is mostly concentrated in the South East of England (left panel of figure), which also has the highest propensity to register new patents overall (right panel of figure). R&D investment is also relatively high in the North West, which is mainly driven by firms located in Manchester, Liverpool and Cheshire. The propensity to patent decreases as distance from London and the South East rises, and it is lowest for firms located in Wales and the North East. Firms with a higher average propensity to patent are located in the West Midlands and the North West.
Figure 4.2 shows the differences in the propensity of firms to introduce process and product innovations across UK regions. Again, regions in the South East have a higher share of firms reporting the introduction of new innovations. This suggests a benefit for firm innovation from being co-located with some of the most research-intensive universities and firms, generally higher rates of agglomeration. As in the case of R&D intensity and patenting, the share of firms reporting the introduction of process and product innovation in a given year decreases gradually in peripheral regions. The regions with the lowest levels of product and process innovation are the South West, Wales and Scotland.
Figure 4.1: Average R&D intensity and patent propensity per region.

37
Notes: Statistics based on CIS and BSD datasets between 2011 and 2017 by region at the ITL1 level. R&D intensity calculated as total expenditure in R&D divided by total sales. Patent propensity measured as the total number of firms registering patents over the total number of firms in a region.
Figure 4.2: Average firms process and product innovation propensity by region.
Statistics based on CIS dataset between 2011 and 2017 by region at the ITL1 level. Process and product innovation propensity measured as the total number of firms reporting product and process innovation over the total number of innovative firms in a region (i.e., firms that invest in R&D activities).
Figure 4.3 reports the geographical distribution across UK regions in terms of the share of firms introducing new-to-market and new-to-business innovations. As above, their propensity is not evenly distributed across regions. New-to-market innovations, which are the most radical and creative innovations, are more likely to take place in the South East and Greater London as compared to the rest of the country. In contrast, new-to-business innovations, which can be described as more gradual or incremental innovations, are more evenly distributed across regions, with higher intensities in the South, the Midlands and in Yorkshire and Humber.
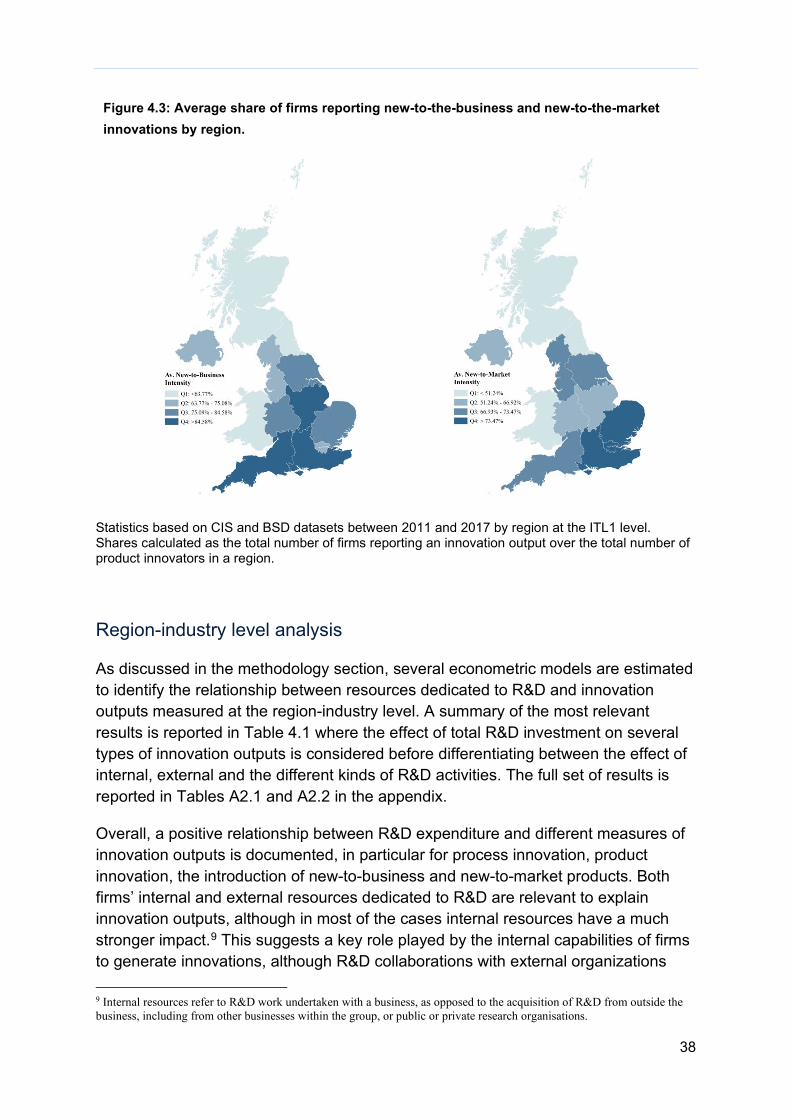
38
Figure 4.3: Average share of firms reporting new-to-the-business and new-to-the-market innovations by region.
Statistics based on CIS and BSD datasets between 2011 and 2017 by region at the ITL1 level. Shares calculated as the total number of firms reporting an innovation output over the total number of product innovators in a region.
Region-industry level analysis
As discussed in the methodology section, several econometric models are estimated to identify the relationship between resources dedicated to R&D and innovation outputs measured at the region-industry level. A summary of the most relevant results is reported in Table 4.1 where the effect of total R&D investment on several types of innovation outputs is considered before differentiating between the effect of internal, external and the different kinds of R&D activities. The full set of results is reported in Tables A2.1 and A2.2 in the appendix.
Overall, a positive relationship between R&D expenditure and different measures of innovation outputs is documented, in particular for process innovation, product innovation, the introduction of new-to-business and new-to-market products. Both firms’ internal and external resources dedicated to R&D are relevant to explain innovation outputs, although in most of the cases internal resources have a much stronger impact.9 This suggests a key role played by the internal capabilities of firms to generate innovations, although R&D collaborations with external organizations
9 Internal resources refer to R&D work undertaken with a business, as opposed to the acquisition of R&D from outside the business, including from other businesses within the group, or public or private research organisations.
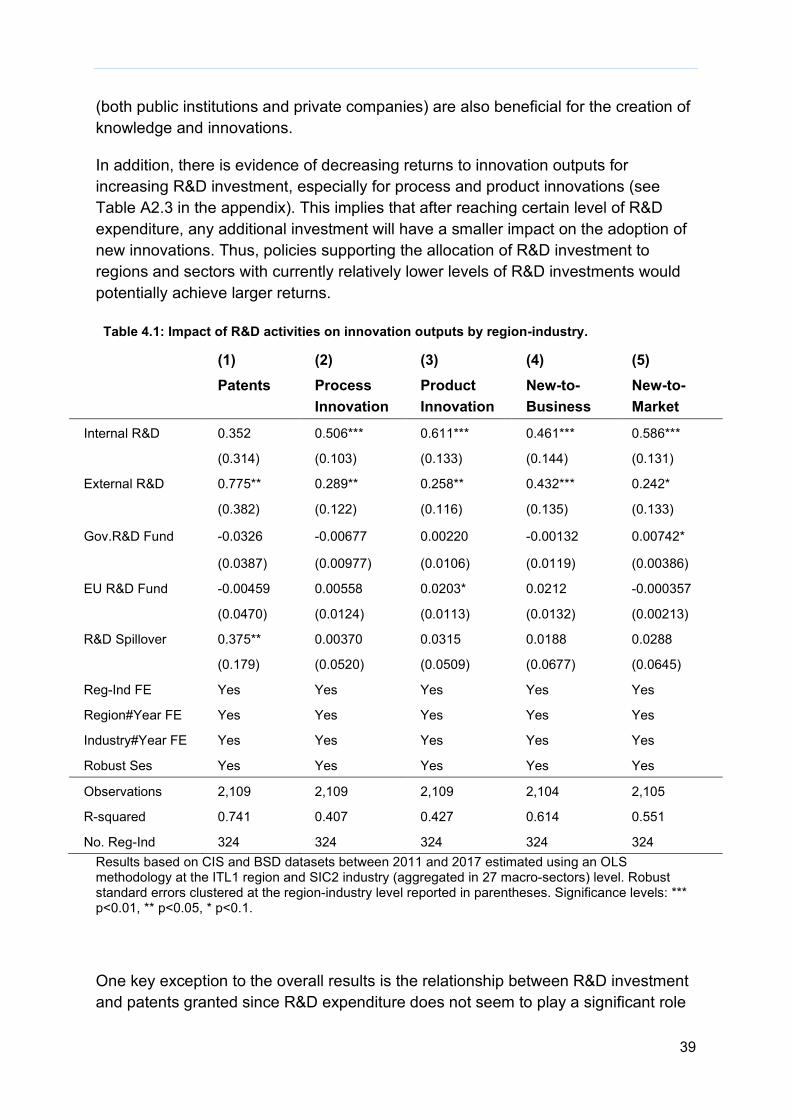
39
(both public institutions and private companies) are also beneficial for the creation of knowledge and innovations.
In addition, there is evidence of decreasing returns to innovation outputs for increasing R&D investment, especially for process and product innovations (see Table A2.3 in the appendix). This implies that after reaching certain level of R&D expenditure, any additional investment will have a smaller impact on the adoption of new innovations. Thus, policies supporting the allocation of R&D investment to regions and sectors with currently relatively lower levels of R&D investments would potentially achieve larger returns.
Table 4.1: Impact of R&D activities on innovation outputs by region-industry.
(1) Patents
(2) Process Innovation
(3) Product Innovation
(4) New-to-Business
(5) New-to-Market
Internal R&D 0.352 0.506*** 0.611*** 0.461*** 0.586***
(0.314) (0.103) (0.133) (0.144) (0.131)
External R&D 0.775** 0.289** 0.258** 0.432*** 0.242*
(0.382) (0.122) (0.116) (0.135) (0.133)
Gov.R&D Fund -0.0326 -0.00677 0.00220 -0.00132 0.00742*
(0.0387) (0.00977) (0.0106) (0.0119) (0.00386)
EU R&D Fund -0.00459 0.00558 0.0203* 0.0212 -0.000357
(0.0470) (0.0124) (0.0113) (0.0132) (0.00213)
R&D Spillover 0.375** 0.00370 0.0315 0.0188 0.0288
(0.179) (0.0520) (0.0509) (0.0677) (0.0645)
Reg-Ind FE Yes Yes Yes Yes Yes
Region#Year FE Yes Yes Yes Yes Yes
Industry#Year FE Yes Yes Yes Yes Yes
Robust Ses Yes Yes Yes Yes Yes
Observations 2,109 2,109 2,109 2,104 2,105
R-squared 0.741 0.407 0.427 0.614 0.551
No. Reg-Ind 324 324 324 324 324 Results based on CIS and BSD datasets between 2011 and 2017 estimated using an OLS methodology at the ITL1 region and SIC2 industry (aggregated in 27 macro-sectors) level. Robust standard errors clustered at the region-industry level reported in parentheses. Significance levels: *** p<0.01, ** p<0.05, * p<0.1.
One key exception to the overall results is the relationship between R&D investment and patents granted since R&D expenditure does not seem to play a significant role
40
in predicting the number of patents registered at the region-industry level. Only external resources dedicated to R&D appear to have a positive relationship with the number of patents granted, highlighting the relevance of collaborations with public and private partners. Collaborations could be particularly important in order to absorb new external knowledge (which is distant from the traditional or core activities of the firm) and integrate it with internal capabilities, in order to create new advanced innovations which are worth filing a patent for (which takes time and is costly).
The lack of evidence on the relationship between overall R&D investment and patenting might be due to several reasons. It might reflect the fact that R&D activities are highly volatile and uncertain, and only in very few instances would eventually result in the registration of a patent. In addition, frequently it takes a long time between the investment in R&D and the registration of a patent, and thus longer lags in the econometric models would be required in order to identify a positive relationship between R&D investments and patents. But data constraints prevent us from lagging the models too much. More importantly, patents tend to be registered by the company headquarters, and thus the geographic and industrial allocation of patents might be skewed towards industries and regions where headquarters are operating and not necessarily where the R&D activities actually take place. These and other caveats should be considered when using patents as an indicator of innovation. In fact, patent counts indicate that a company has invented something and would like to formally protect it, but it is difficult to see what further inferences can be made about the innovative propensity of the firm.10
It is clear that not all internal R&D activities are equally relevant to help firms in registering new patents or introducing other innovations. For this reason, this analysis disentangles the effect of internal R&D investment by differentiating between resources dedicated to different categories of R&D activities. As shown in Tables A2.1 and A2.2, investment in science and engineering positively affects the introduction of innovation outcomes as well as the registration of patents. Investment in R&D equipment seems to mainly increase the capacity of firms to register a larger number of patents. Finally, investment in R&D training seems particularly important for implementing process innovations, while investment in R&D design has a positive effect especially on product innovations, both in terms of new-to-business and new-to-market innovative products.
10 For further discussion about the analysis and interpretation of patent data please refer to the IPO (2015) Patent Guide available at: https://www.gov.uk/government/publications/the-patent-guide .
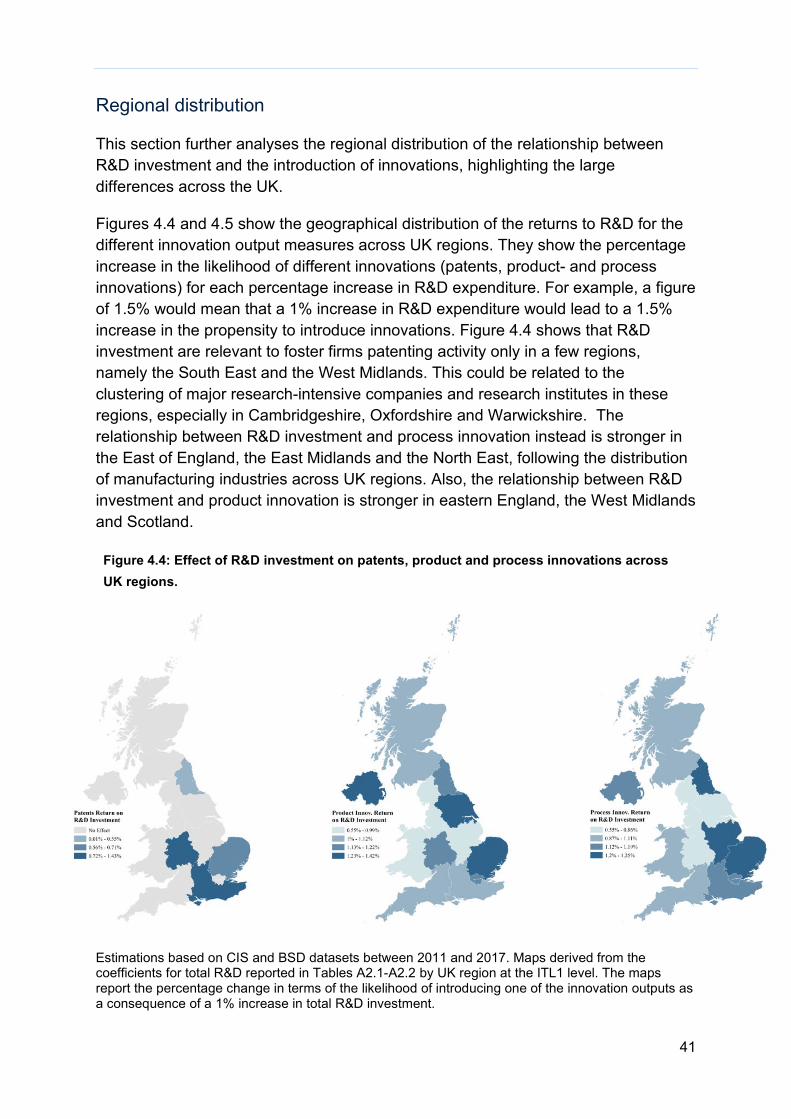
41
Regional distribution
This section further analyses the regional distribution of the relationship between R&D investment and the introduction of innovations, highlighting the large differences across the UK.
Figures 4.4 and 4.5 show the geographical distribution of the returns to R&D for the different innovation output measures across UK regions. They show the percentage increase in the likelihood of different innovations (patents, product- and process innovations) for each percentage increase in R&D expenditure. For example, a figure of 1.5% would mean that a 1% increase in R&D expenditure would lead to a 1.5% increase in the propensity to introduce innovations. Figure 4.4 shows that R&D investment are relevant to foster firms patenting activity only in a few regions, namely the South East and the West Midlands. This could be related to the clustering of major research-intensive companies and research institutes in these regions, especially in Cambridgeshire, Oxfordshire and Warwickshire. The relationship between R&D investment and process innovation instead is stronger in the East of England, the East Midlands and the North East, following the distribution of manufacturing industries across UK regions. Also, the relationship between R&D investment and product innovation is stronger in eastern England, the West Midlands and Scotland.
Figure 4.4: Effect of R&D investment on patents, product and process innovations across UK regions.
Estimations based on CIS and BSD datasets between 2011 and 2017. Maps derived from the coefficients for total R&D reported in Tables A2.1-A2.2 by UK region at the ITL1 level. The maps report the percentage change in terms of the likelihood of introducing one of the innovation outputs as a consequence of a 1% increase in total R&D investment.
42
The regional distribution of the effect of R&D investment on innovation outcomes differs considerably depending on whether patents or product/process innovation are considered. This reinforces the view that it matters a great deal how “innovation” is measured empirically. In fact, the positive and significant effect of R&D investment on patents is only found in very few regions and in particular those with the highest R&D intensity.
First, this could indicate that patents are only good indicators of innovation for firms in high-tech sectors, which are also usually agglomerated in these regions. Second, this could indicate that in order to successfully register new patents, companies need to invest relatively large amounts of resources in R&D activities. Another explanation could be linked to the importance of regions to have an “innovative ecosystem” to nurture companies’ efforts in producing new patents. In this case, the access to high-skilled workers from the local labour pool, or the possibility of profiting from knowledge spillovers from neighbouring innovative companies and research institutes, could be fundamental to foster the likelihood to translate R&D investment into new patents.
On the contrary, the effect of R&D investment on product and process innovations is more evenly distributed across UK regions. First, this could be related to the fact that those type of innovations are more easily found in all industrial sectors and not only in the highly clustered high-tech sectors. Secondly, this indicates that even small amounts of R&D expenditure could be sufficient to foster the adoption of product and process innovations. This is an important finding as it would be beneficial to improve firm productivity also in regions that are not particularly intensive in R&D activities, and with firms in medium and low-tech sectors.
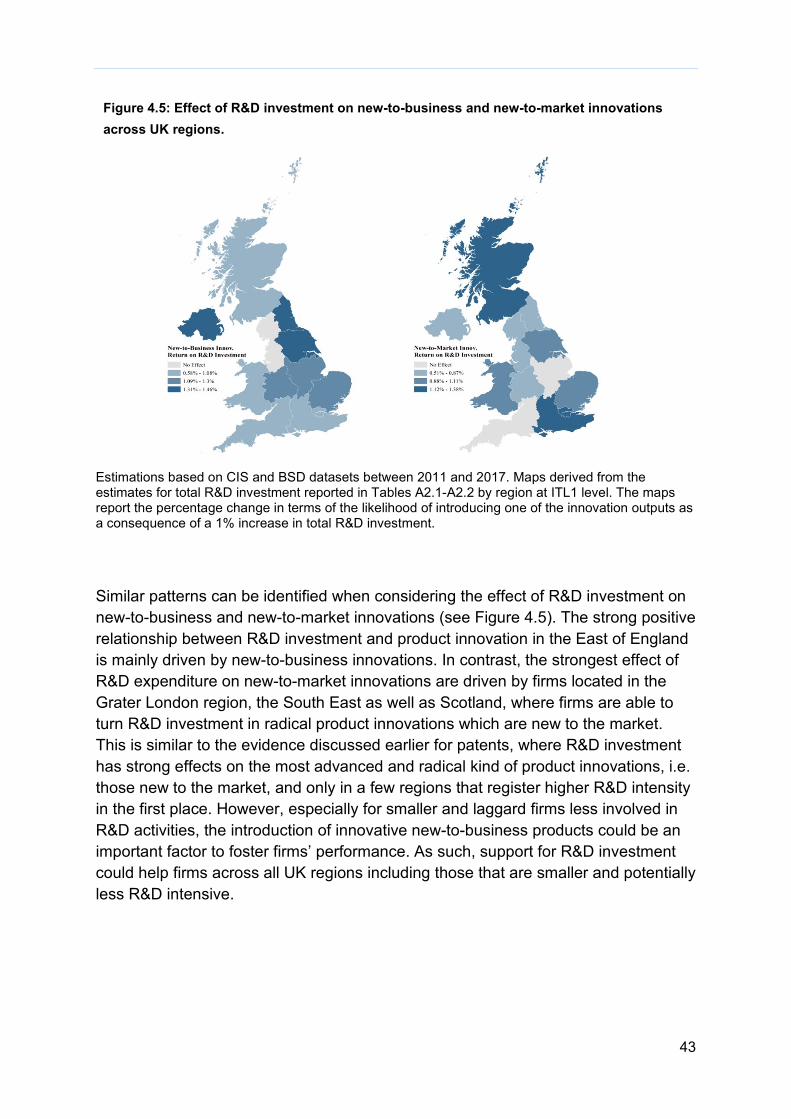
43
Figure 4.5: Effect of R&D investment on new-to-business and new-to-market innovations across UK regions.
Estimations based on CIS and BSD datasets between 2011 and 2017. Maps derived from the estimates for total R&D investment reported in Tables A2.1-A2.2 by region at ITL1 level. The maps report the percentage change in terms of the likelihood of introducing one of the innovation outputs as a consequence of a 1% increase in total R&D investment.
Similar patterns can be identified when considering the effect of R&D investment on new-to-business and new-to-market innovations (see Figure 4.5). The strong positive relationship between R&D investment and product innovation in the East of England is mainly driven by new-to-business innovations. In contrast, the strongest effect of R&D expenditure on new-to-market innovations are driven by firms located in the Grater London region, the South East as well as Scotland, where firms are able to turn R&D investment in radical product innovations which are new to the market. This is similar to the evidence discussed earlier for patents, where R&D investment has strong effects on the most advanced and radical kind of product innovations, i.e. those new to the market, and only in a few regions that register higher R&D intensity in the first place. However, especially for smaller and laggard firms less involved in R&D activities, the introduction of innovative new-to-business products could be an important factor to foster firms’ performance. As such, support for R&D investment could help firms across all UK regions including those that are smaller and potentially less R&D intensive.
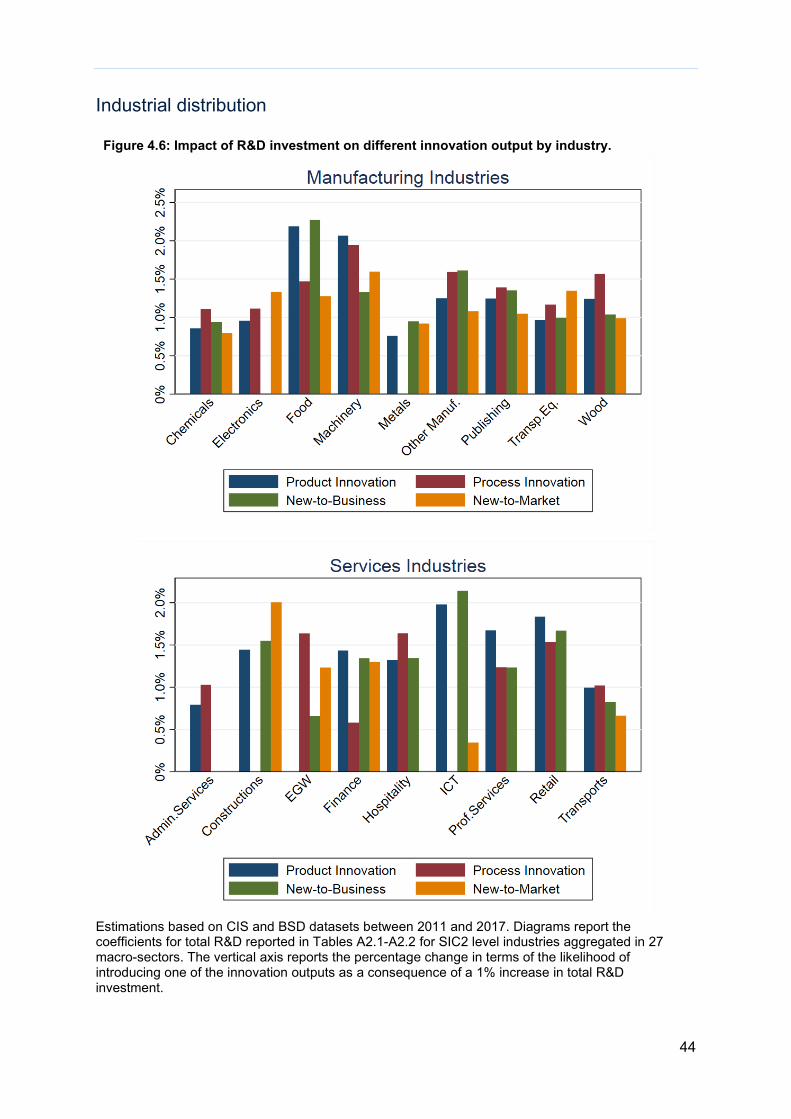
44
Industrial distribution
Figure 4.6: Impact of R&D investment on different innovation output by industry.
Estimations based on CIS and BSD datasets between 2011 and 2017. Diagrams report the coefficients for total R&D reported in Tables A2.1-A2.2 for SIC2 level industries aggregated in 27 macro-sectors. The vertical axis reports the percentage change in terms of the likelihood of introducing one of the innovation outputs as a consequence of a 1% increase in total R&D investment.
45
This section investigates the distribution of the effects of R&D expenditure on innovation outputs across different manufacturing and services industries. Figure 4.6 shows that in many sectors R&D investment does not seem to lead to innovative output. This particularly holds in service sectors such as administrative, legal and management services. By contrast, the effect of R&D investment is a particularly strong factor in explaining the creation of innovative outputs in several manufacturing industries, particularly chemicals, electrical equipment, machinery, textiles and transportation equipment. Within services, R&D investment is more likely to trigger the generation or adoption of innovations only in a few sectors such as utilities, finance, ICT services, post and telecommunications and the R&D sector itself.
This different finding in the effectiveness of R&D investment to stimulate innovation between manufacturing and service sectors could be related to the fact that innovation in services does not necessarily take the form of formal R&D spending. These findings do not necessarily lend themselves to the conclusion that service sectors do not “invest” in innovation, but rather, raise concerns about the appropriateness of traditional R&D measures as suitable proxies for innovation in the production of services. Since the sectoral mix differs considerably across regions, these findings provide some further support for the hypothesis regional heterogeneity in innovation. The effect of R&D investment on process, product, and in particular new-to-business product innovations is evenly distributed but mainly in manufacturing industries. In contrast, the impact on new-to-market products and patents seems only to be significant in a few sectors, in particular in high-tech manufacturing industries and in knowledge-intensive services sectors.
Public R&D and knowledge spillovers
Previous studies have shown that investment in R&D can hardly be considered exclusive to a firm or organisation (also called “private goods”), as ideas ‘float in the air’ which means they can more easily travel at short distances between them (Marshall, 1890). As a consequence, both private and public investment in R&D can produce knowledge spillovers and thereby stimulating technological improvements in neighbouring areas, especially if firms are specialised in similar technologies and industries. This section considers the role played particularly by public investment in R&D and knowledge spillovers in stimulating innovation activities of firms across UK regions and industries.
Our econometric analysis provides little evidence of a relationship between public R&D funding and the innovation performance at the level of regions and industries. Public R&D funding is measured as support provided by UKRI to firms in the UK, and the analysis controls for firm-internal resources dedicated to R&D investment. The full results are reported in Table A2.3. The only exception to this main finding is
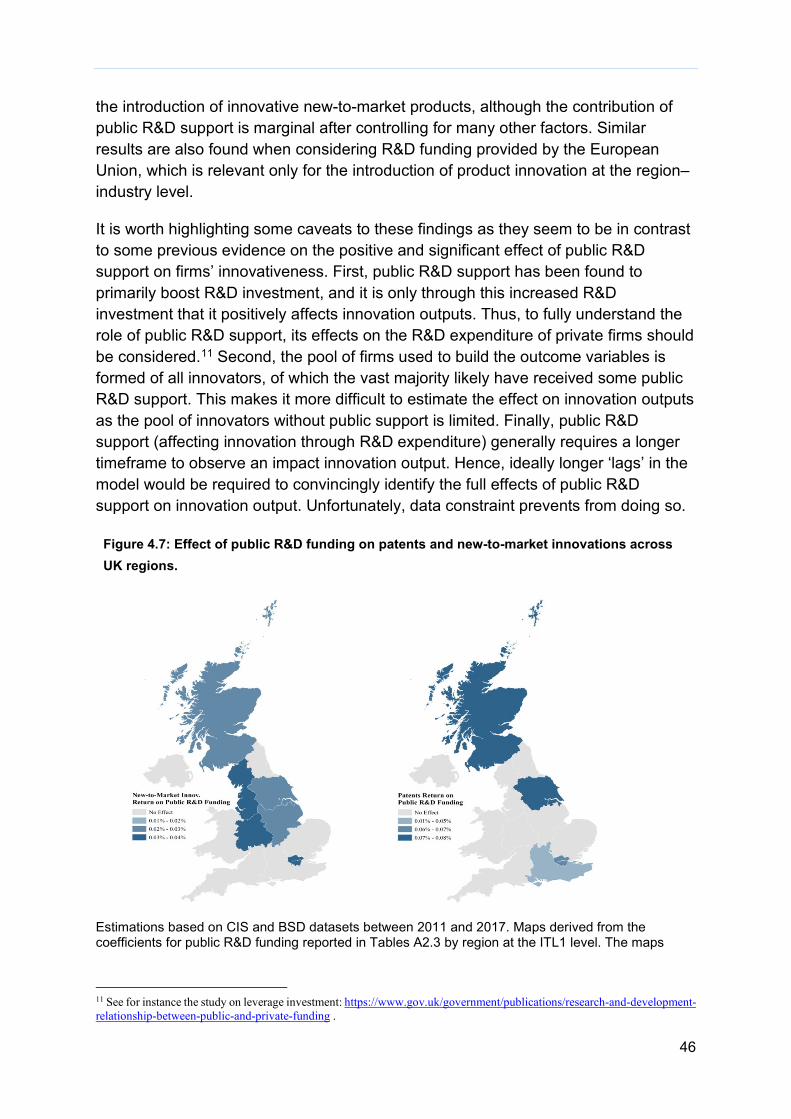
46
the introduction of innovative new-to-market products, although the contribution of public R&D support is marginal after controlling for many other factors. Similar results are also found when considering R&D funding provided by the European Union, which is relevant only for the introduction of product innovation at the region–industry level.
It is worth highlighting some caveats to these findings as they seem to be in contrast to some previous evidence on the positive and significant effect of public R&D support on firms’ innovativeness. First, public R&D support has been found to primarily boost R&D investment, and it is only through this increased R&D investment that it positively affects innovation outputs. Thus, to fully understand the role of public R&D support, its effects on the R&D expenditure of private firms should be considered.11 Second, the pool of firms used to build the outcome variables is formed of all innovators, of which the vast majority likely have received some public R&D support. This makes it more difficult to estimate the effect on innovation outputs as the pool of innovators without public support is limited. Finally, public R&D support (affecting innovation through R&D expenditure) generally requires a longer timeframe to observe an impact innovation output. Hence, ideally longer ‘lags’ in the model would be required to convincingly identify the full effects of public R&D support on innovation output. Unfortunately, data constraint prevents from doing so.
Figure 4.7: Effect of public R&D funding on patents and new-to-market innovations across UK regions.
Estimations based on CIS and BSD datasets between 2011 and 2017. Maps derived from the coefficients for public R&D funding reported in Tables A2.3 by region at the ITL1 level. The maps
11 See for instance the study on leverage investment: https://www.gov.uk/government/publications/research-and-development-relationship-between-public-and-private-funding .
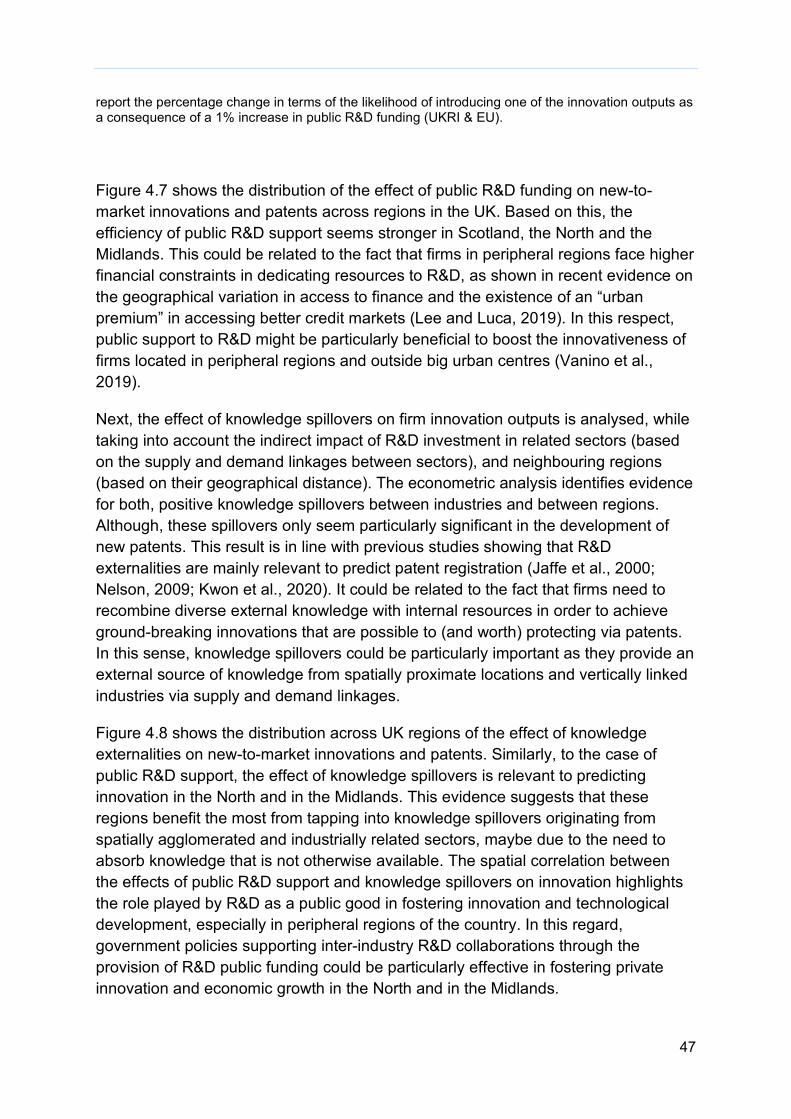
47
report the percentage change in terms of the likelihood of introducing one of the innovation outputs as a consequence of a 1% increase in public R&D funding (UKRI & EU).
Figure 4.7 shows the distribution of the effect of public R&D funding on new-to-market innovations and patents across regions in the UK. Based on this, the efficiency of public R&D support seems stronger in Scotland, the North and the Midlands. This could be related to the fact that firms in peripheral regions face higher financial constraints in dedicating resources to R&D, as shown in recent evidence on the geographical variation in access to finance and the existence of an “urban premium” in accessing better credit markets (Lee and Luca, 2019). In this respect, public support to R&D might be particularly beneficial to boost the innovativeness of firms located in peripheral regions and outside big urban centres (Vanino et al., 2019).
Next, the effect of knowledge spillovers on firm innovation outputs is analysed, while taking into account the indirect impact of R&D investment in related sectors (based on the supply and demand linkages between sectors), and neighbouring regions (based on their geographical distance). The econometric analysis identifies evidence for both, positive knowledge spillovers between industries and between regions. Although, these spillovers only seem particularly significant in the development of new patents. This result is in line with previous studies showing that R&D externalities are mainly relevant to predict patent registration (Jaffe et al., 2000; Nelson, 2009; Kwon et al., 2020). It could be related to the fact that firms need to recombine diverse external knowledge with internal resources in order to achieve ground-breaking innovations that are possible to (and worth) protecting via patents. In this sense, knowledge spillovers could be particularly important as they provide an external source of knowledge from spatially proximate locations and vertically linked industries via supply and demand linkages.
Figure 4.8 shows the distribution across UK regions of the effect of knowledge externalities on new-to-market innovations and patents. Similarly, to the case of public R&D support, the effect of knowledge spillovers is relevant to predicting innovation in the North and in the Midlands. This evidence suggests that these regions benefit the most from tapping into knowledge spillovers originating from spatially agglomerated and industrially related sectors, maybe due to the need to absorb knowledge that is not otherwise available. The spatial correlation between the effects of public R&D support and knowledge spillovers on innovation highlights the role played by R&D as a public good in fostering innovation and technological development, especially in peripheral regions of the country. In this regard, government policies supporting inter-industry R&D collaborations through the provision of R&D public funding could be particularly effective in fostering private innovation and economic growth in the North and in the Midlands.
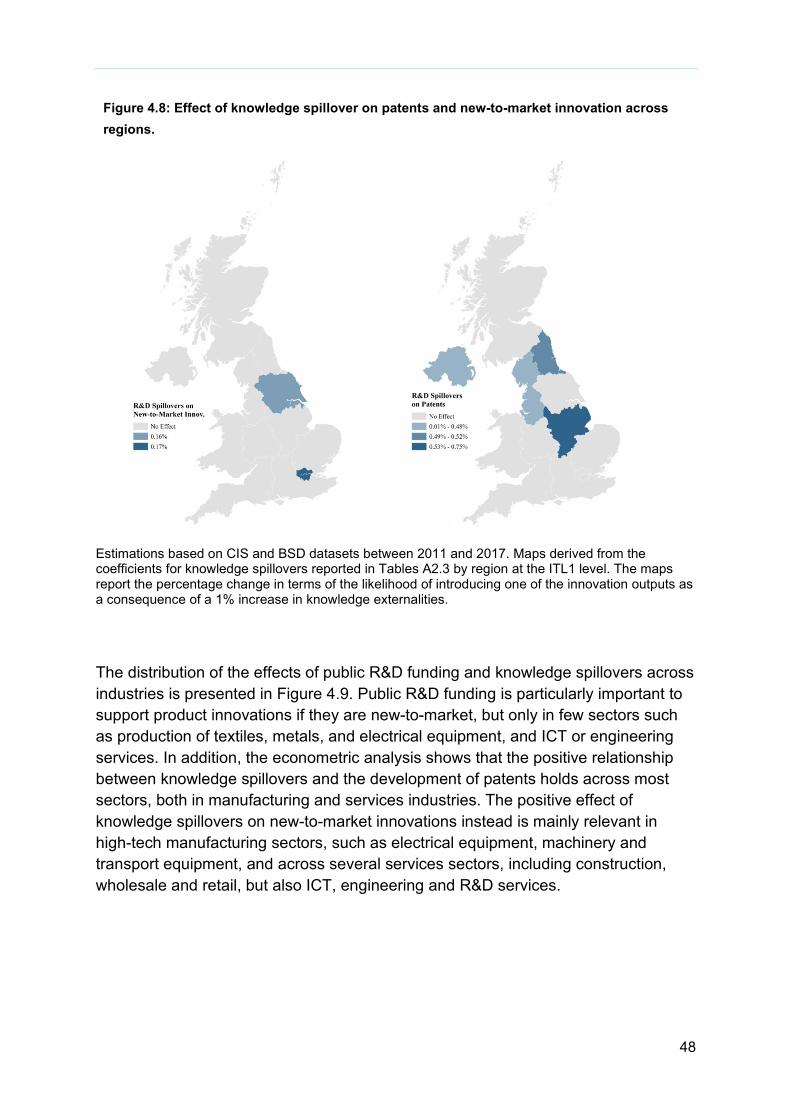
48
Figure 4.8: Effect of knowledge spillover on patents and new-to-market innovation across regions.
Estimations based on CIS and BSD datasets between 2011 and 2017. Maps derived from the coefficients for knowledge spillovers reported in Tables A2.3 by region at the ITL1 level. The maps report the percentage change in terms of the likelihood of introducing one of the innovation outputs as a consequence of a 1% increase in knowledge externalities.
The distribution of the effects of public R&D funding and knowledge spillovers across industries is presented in Figure 4.9. Public R&D funding is particularly important to support product innovations if they are new-to-market, but only in few sectors such as production of textiles, metals, and electrical equipment, and ICT or engineering services. In addition, the econometric analysis shows that the positive relationship between knowledge spillovers and the development of patents holds across most sectors, both in manufacturing and services industries. The positive effect of knowledge spillovers on new-to-market innovations instead is mainly relevant in high-tech manufacturing sectors, such as electrical equipment, machinery and transport equipment, and across several services sectors, including construction, wholesale and retail, but also ICT, engineering and R&D services.
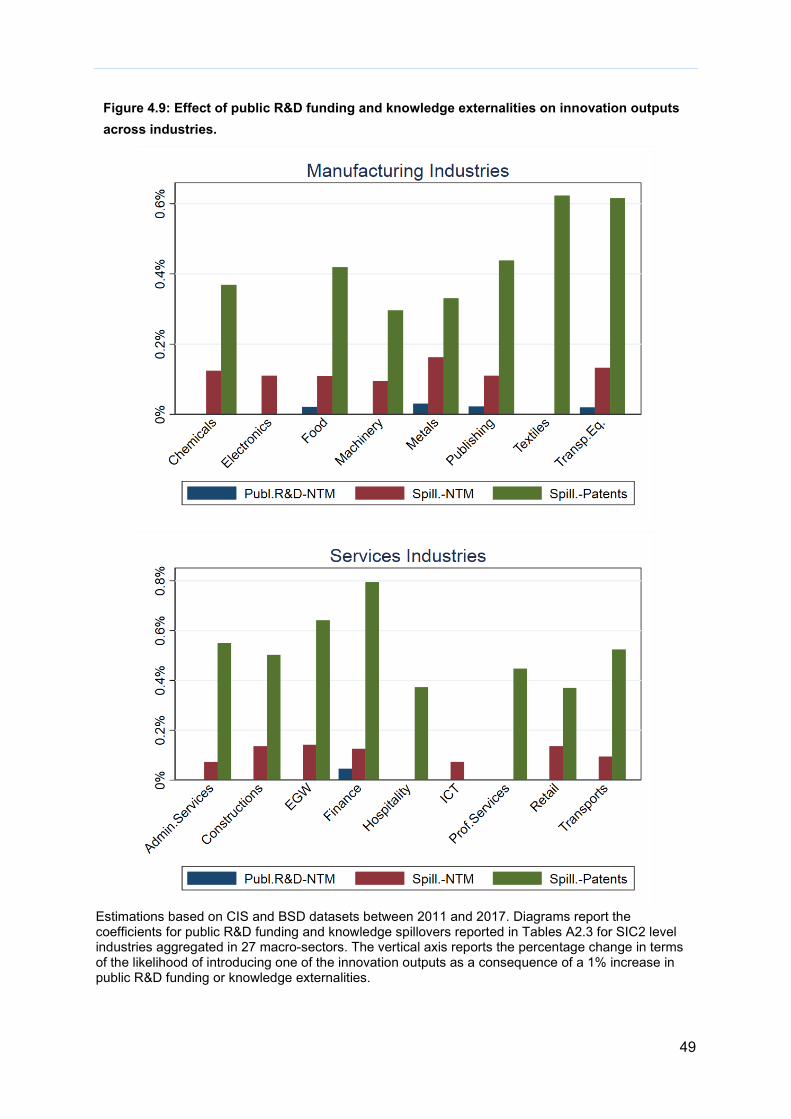
49
Figure 4.9: Effect of public R&D funding and knowledge externalities on innovation outputs across industries.
Estimations based on CIS and BSD datasets between 2011 and 2017. Diagrams report the coefficients for public R&D funding and knowledge spillovers reported in Tables A2.3 for SIC2 level industries aggregated in 27 macro-sectors. The vertical axis reports the percentage change in terms of the likelihood of introducing one of the innovation outputs as a consequence of a 1% increase in public R&D funding or knowledge externalities.
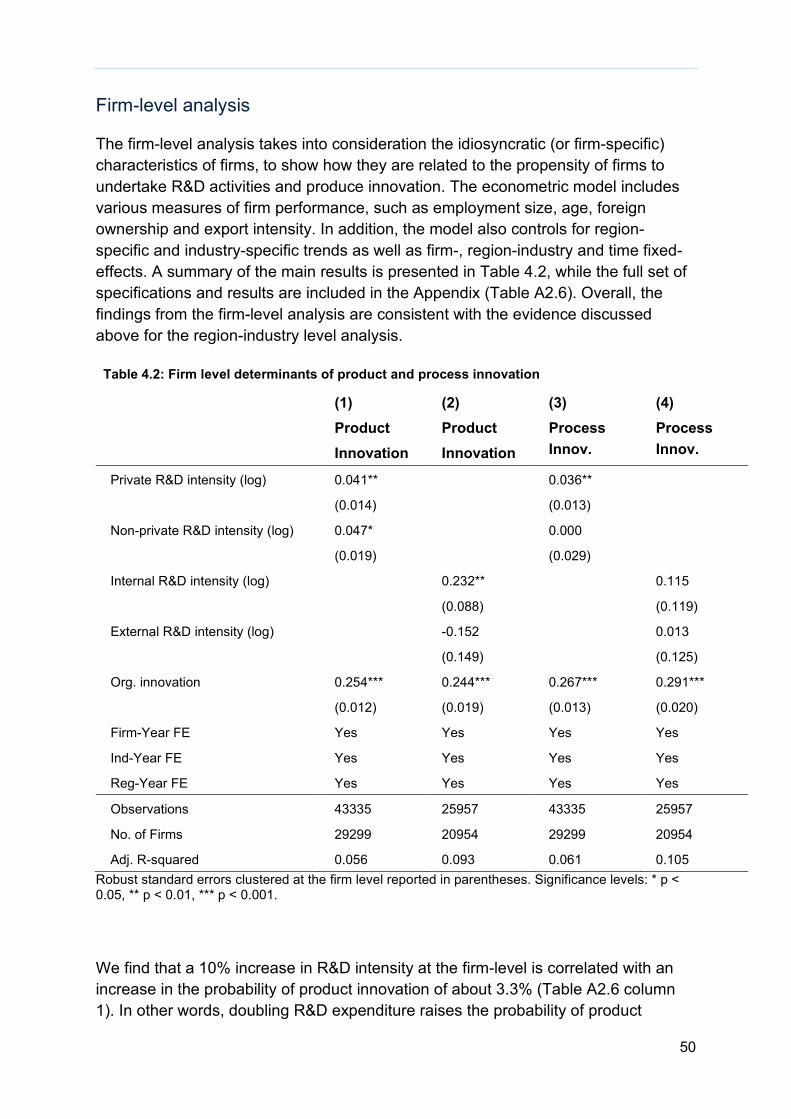
50
Firm-level analysis
The firm-level analysis takes into consideration the idiosyncratic (or firm-specific) characteristics of firms, to show how they are related to the propensity of firms to undertake R&D activities and produce innovation. The econometric model includes various measures of firm performance, such as employment size, age, foreign ownership and export intensity. In addition, the model also controls for region-specific and industry-specific trends as well as firm-, region-industry and time fixed-effects. A summary of the main results is presented in Table 4.2, while the full set of specifications and results are included in the Appendix (Table A2.6). Overall, the findings from the firm-level analysis are consistent with the evidence discussed above for the region-industry level analysis.
Table 4.2: Firm level determinants of product and process innovation
(1) Product Innovation
(2) Product Innovation
(3) Process Innov.
(4) Process Innov.
Private R&D intensity (log) 0.041** 0.036**
(0.014) (0.013)
Non-private R&D intensity (log) 0.047* 0.000
(0.019) (0.029)
Internal R&D intensity (log) 0.232** 0.115
(0.088) (0.119)
External R&D intensity (log) -0.152 0.013
(0.149) (0.125)
Org. innovation 0.254*** 0.244*** 0.267*** 0.291***
(0.012) (0.019) (0.013) (0.020)
Firm-Year FE Yes Yes Yes Yes
Ind-Year FE Yes Yes Yes Yes
Reg-Year FE Yes Yes Yes Yes
Observations 43335 25957 43335 25957
No. of Firms 29299 20954 29299 20954
Adj. R-squared 0.056 0.093 0.061 0.105 Robust standard errors clustered at the firm level reported in parentheses. Significance levels: * p < 0.05, ** p < 0.01, *** p < 0.001.
We find that a 10% increase in R&D intensity at the firm-level is correlated with an increase in the probability of product innovation of about 3.3% (Table A2.6 column 1). In other words, doubling R&D expenditure raises the probability of product

51
innovations by a third. When disaggregating this effect in Table 4.2 between internal and external R&D resources, there is no evidence of any significant effect via the acquisition of external R&D activities, while confirming a positive and significant effect only of internal R&D expenditure on product innovation of about 2.3%. In addition, by considering the different roles played by private and public R&D funding, the results suggest that a 10% increase in private R&D intensity is correlated with an increase in the probability of product innovation of about 0.41%. Similarly, a 10% increase in public R&D intensity leads to an increase in the probability of product innovation by about 0.47%.12
Further results show a positive and significant effect of firms R&D intensity on the introduction of process innovation (see Table A2.7). In particular, when considering total R&D expenditure, the results suggest that a 10% increase in R&D intensity is correlated with an increase in the probability of process innovation of about 2.5%. Similarly, when considering the different effect of private and public R&D funding on process innovation, the findings show that a 10% increase in private R&D intensity is correlated with an increase in the probability of process innovation of about 0.4% to 0.5%. However, there is no evidence that public R&D intensity has any effect on process innovation.
Finally, Tables A2.8 and A2.9 investigate further the distribution of the firm-level effects across UK regions, considering both private and public R&D funding. It confirms the important effect of private R&D intensity on product and process innovations is particularly significant in the Midlands, North-East, South-West and Scotland. Public R&D support instead seems to foster firms’ innovation mainly in the North-East, Yorkshire and East Midlands.
Local spillovers from universities’ research
This section investigates further the role of public R&D funding and also of local universities research in fostering private firms’ innovation. Table 4.3 reports the findings of the effect of regional universities research income on the adoption of different forms of innovation by firms located within the same region. First, the odd columns in the table consider the role played by the overall research income of universities in fostering private firms’ innovation outputs within region (regional spillover). To calculate this, we use data from the UK Higher Education Statistics Agency (HESA) on the biannual research income of all universities within the same ITL1 region. Even after controlling for firms own R&D resources, there is only evidence of a significant and positive relationship between universities research activities and patenting at the firm-level. The lack of significant evidence for other
12 However, the latter results are estimated based on a smaller set of firms, and therefore cannot be directly compared to the results considering only total R&D expenditure.

52
research outputs could be related to the fact that this variable does not take into account the nature of the research activity carried out by universities, nor its actual relationship with firms. In other words, the variable takes equal values for all firms within the same region despite the fact that some firms might have more direct access to university research. In fact, in the estimation models reported above at the regional level, this effect would have been entirely captured by the regional time trends included as controls.
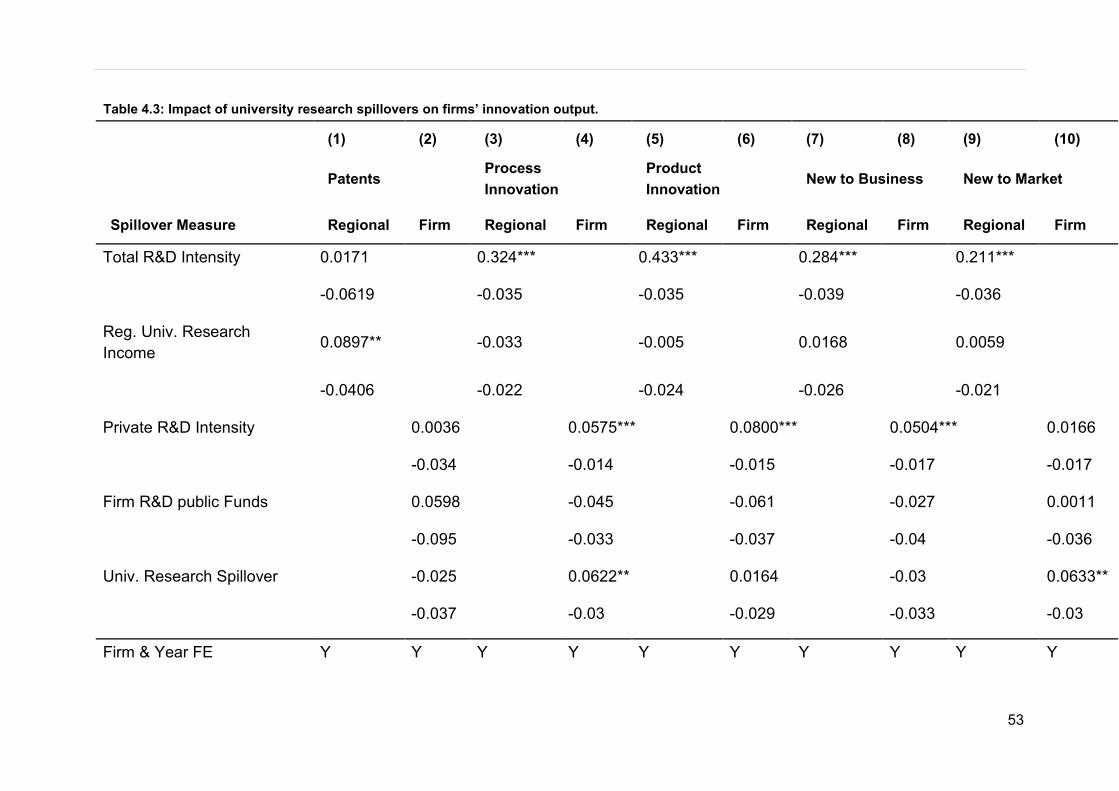
53
Table 4.3: Impact of university research spillovers on firms’ innovation output.
(1) (2) (3) (4) (5) (6) (7) (8) (9) (10)
Patents Process Innovation
Product Innovation
New to Business New to Market
Spillover Measure Regional Firm Regional Firm Regional Firm Regional Firm Regional Firm
Total R&D Intensity 0.0171
0.324*** 0.433*** 0.284*** 0.211***
-0.0619
-0.035
-0.035
-0.039
-0.036
Reg. Univ. Research Income 0.0897**
-0.033
-0.005
0.0168
0.0059
-0.0406
-0.022
-0.024
-0.026
-0.021
Private R&D Intensity
0.0036
0.0575*** 0.0800*** 0.0504*** 0.0166
-0.034
-0.014
-0.015
-0.017
-0.017
Firm R&D public Funds
0.0598
-0.045
-0.061
-0.027
0.0011
-0.095
-0.033
-0.037
-0.04
-0.036
Univ. Research Spillover
-0.025
0.0622** 0.0164
-0.03
0.0633**
-0.037
-0.03
-0.029
-0.033
-0.03
Firm & Year FE Y Y Y Y Y Y Y Y Y Y
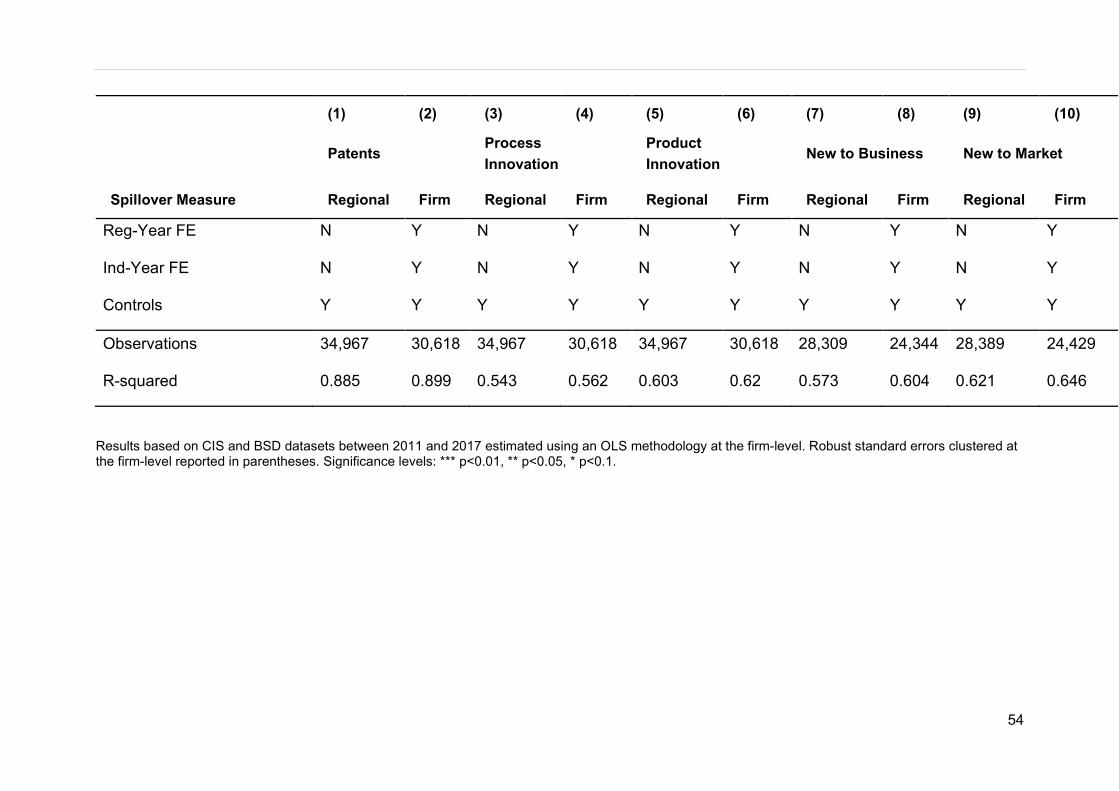
54
(1) (2) (3) (4) (5) (6) (7) (8) (9) (10)
Patents Process Innovation
Product Innovation
New to Business New to Market
Spillover Measure Regional Firm Regional Firm Regional Firm Regional Firm Regional Firm
Reg-Year FE N Y N Y N Y N Y N Y
Ind-Year FE N Y N Y N Y N Y N Y
Controls Y Y Y Y Y Y Y Y Y Y
Observations 34,967 30,618 34,967 30,618 34,967 30,618 28,309 24,344 28,389 24,429
R-squared 0.885 0.899 0.543 0.562 0.603 0.62 0.573 0.604 0.621 0.646
Results based on CIS and BSD datasets between 2011 and 2017 estimated using an OLS methodology at the firm-level. Robust standard errors clustered at the firm-level reported in parentheses. Significance levels: *** p<0.01, ** p<0.05, * p<0.1.
In order to better identify the relationship between firm innovativeness and university R&D activities, a new indicator of local universities research spillovers is developed. For each firm, this indicator is the average research income of universities in the same region weighted by the geographical proximity of the firm to each university.13 Here the geographical proximity is considered to be a proxy for the strength of the relationship between firms and universities, following previous studies (e.g., D’Este et al. 2013). Results for this weighted indicator are reported in the even columns of Table 4.3 (firm-weighted spillover) and include controls for firms private and public R&D funding, other firm-level control variables, as well as firm- and year fixed-effects, and regional and industry time trends. The results show that on top of private R&D funding, spillovers from local universities research do have a significant and positive relation with the process innovations and of new-to-market products introduced by firms (specifications 4 and 10 in Table 4.3). Thanks to further estimations and back of the envelope calculations we find that the positive effects of university research spillovers for private firms become insignificant below the 80th percentile of the proximity distribution, which is equal to a 15 miles distance from universities, both for process and new-to-market innovations. This means that only firms located within a 15 miles radius from local universities are able to enjoy the benefits of university research spillovers for private innovations. This is the first estimate of this effect for the UK, and it is consistent with previous studies on other developed countries, showing that geographical distance could be used as a good proxy for the likelihood of research interactions and collaborations between private firms and universities and other public research centres.
These relationships can be further investigated by analysing the role of local universities research spillovers by distinguishing between manufacturing and services sectors, and between high-tech and low-tech firms. Results for this exercise are presented in Table 4.4. Research spillovers from local or proximate universities are mainly relevant in fostering the adoption of process innovation in services sectors, and there is no evidence of a significant difference between low- and high-tech firms. The results for new-to-market innovative products suggest that research spillovers from local universities are particularly important in the services sectors and for high-tech firms. It could include R&D activities by private labs and firms providing engineering services that are located in science parks in close proximity to research-intensive universities. These would profit from R&D collaborations with university researchers, university spinoffs and the provision of highly skilled and trained research-oriented graduates.
13 This firm specific measure of university research spillover (𝑈𝑈𝑈𝑈𝑈𝑈𝑖𝑖𝑖𝑖) is calculated as follows: 𝑈𝑈𝑈𝑈𝑈𝑈𝑖𝑖𝑖𝑖 = ∑ 𝑈𝑈𝑗𝑗𝑖𝑖 × 𝑃𝑃𝑖𝑖𝑗𝑗𝑖𝑖𝑗𝑗 , where we sum up the research income of all universities j located in the same region r of firm i (𝑈𝑈𝑗𝑗𝑖𝑖) weighted by the proximity between firm i and each university j (𝑃𝑃𝑖𝑖𝑗𝑗𝑖𝑖). Proximity is calculated as the inverse of the square root of the Euclidean distance between firm i and each university j.
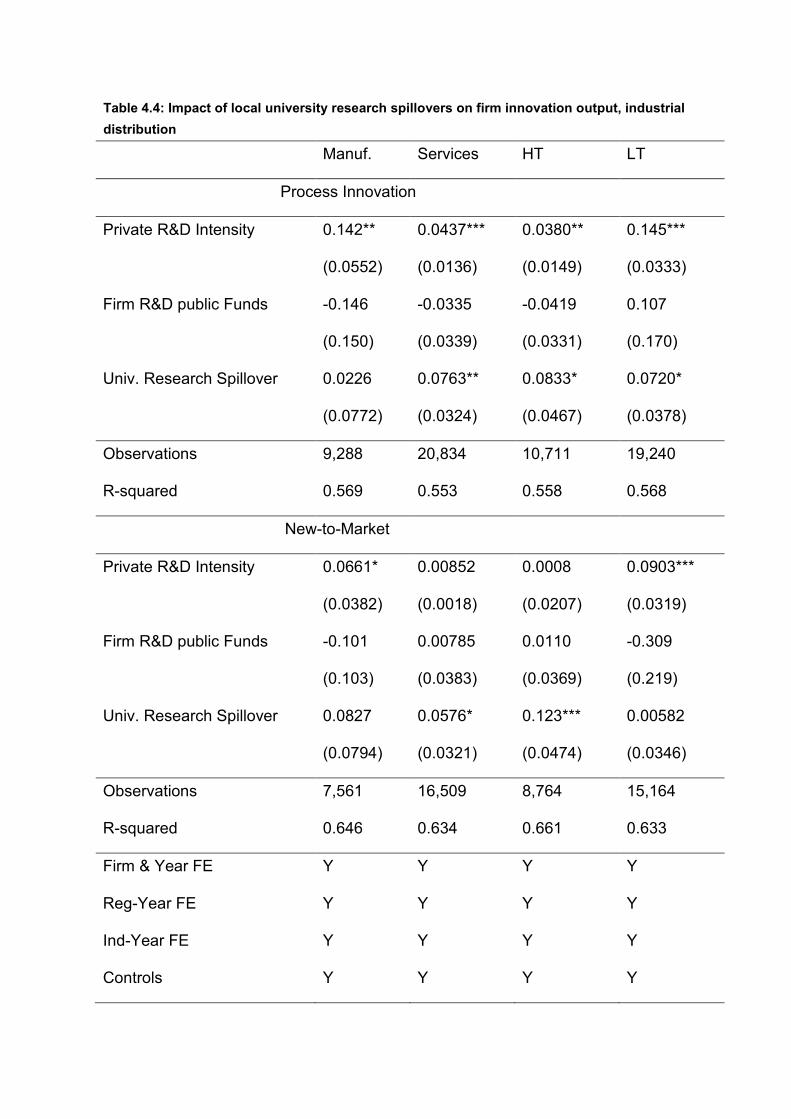
Table 4.4: Impact of local university research spillovers on firm innovation output, industrial distribution
Manuf. Services HT LT
Process Innovation
Private R&D Intensity 0.142** 0.0437*** 0.0380** 0.145***
(0.0552) (0.0136) (0.0149) (0.0333)
Firm R&D public Funds -0.146 -0.0335 -0.0419 0.107
(0.150) (0.0339) (0.0331) (0.170)
Univ. Research Spillover 0.0226 0.0763** 0.0833* 0.0720*
(0.0772) (0.0324) (0.0467) (0.0378)
Observations 9,288 20,834 10,711 19,240
R-squared 0.569 0.553 0.558 0.568
New-to-Market
Private R&D Intensity 0.0661* 0.00852 0.0008 0.0903***
(0.0382) (0.0018) (0.0207) (0.0319)
Firm R&D public Funds -0.101 0.00785 0.0110 -0.309
(0.103) (0.0383) (0.0369) (0.219)
Univ. Research Spillover 0.0827 0.0576* 0.123*** 0.00582
(0.0794) (0.0321) (0.0474) (0.0346)
Observations 7,561 16,509 8,764 15,164
R-squared 0.646 0.634 0.661 0.633
Firm & Year FE Y Y Y Y
Reg-Year FE Y Y Y Y
Ind-Year FE Y Y Y Y
Controls Y Y Y Y
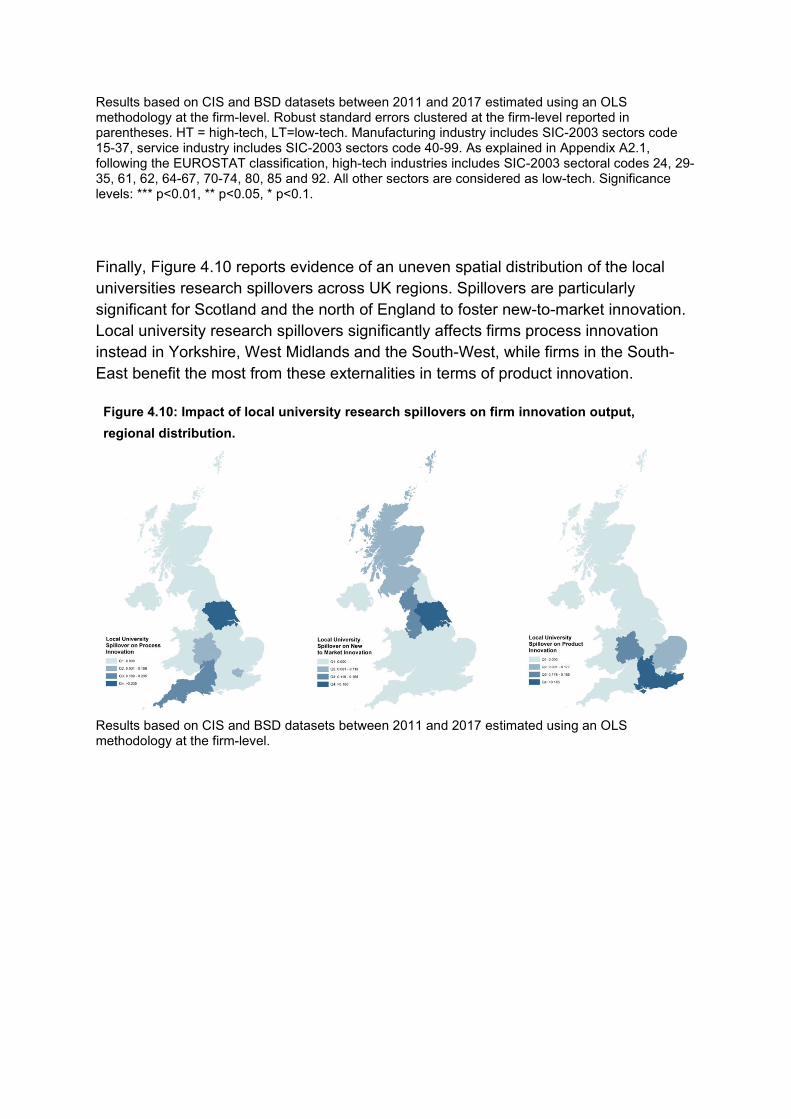
Results based on CIS and BSD datasets between 2011 and 2017 estimated using an OLS methodology at the firm-level. Robust standard errors clustered at the firm-level reported in parentheses. HT = high-tech, LT=low-tech. Manufacturing industry includes SIC-2003 sectors code 15-37, service industry includes SIC-2003 sectors code 40-99. As explained in Appendix A2.1, following the EUROSTAT classification, high-tech industries includes SIC-2003 sectoral codes 24, 29-35, 61, 62, 64-67, 70-74, 80, 85 and 92. All other sectors are considered as low-tech. Significance levels: *** p<0.01, ** p<0.05, * p<0.1.
Finally, Figure 4.10 reports evidence of an uneven spatial distribution of the local universities research spillovers across UK regions. Spillovers are particularly significant for Scotland and the north of England to foster new-to-market innovation. Local university research spillovers significantly affects firms process innovation instead in Yorkshire, West Midlands and the South-West, while firms in the South-East benefit the most from these externalities in terms of product innovation.
Figure 4.10: Impact of local university research spillovers on firm innovation output, regional distribution.
Results based on CIS and BSD datasets between 2011 and 2017 estimated using an OLS methodology at the firm-level.

Impact of innovation on productivity growth
For the second research question, this report explores the relation between innovation and productivity, both at the firm- and at the region-industry level. More specifically, the relative importance of different innovation outcomes on productivity is analysed, together with the role of public R&D and spillovers, and the heterogeneity across UK regions and industries. The key findings are:
1. Innovation positively contributes to firm productivity growth.
2. Estimates suggest net of depreciation, an R&D investment by £1 would yield a productivity benefit of over £0.20, as a maximum.
3. The impact of R&D on productivity is larger in high-tech manufacturing industries and knowledge-intensive services sectors.
4. For manufacturing, patents are particularly important in boosting productivity, while in services sectors new-to-market innovations are most important.
5. A regional-level analysis reveals positive and significant effects of innovation on productivity growth in the South East, West Midlands, North East and Scotland.
The second key question considered in this report is whether innovation leads to higher productivity growth in the UK. According to several economic theories, investment in R&D increases the stock of knowledge, which can in turn lead firms to increase productivity and profits due to the development of new products, increasing market share, or the adoption of more efficient innovative processes. This section starts by analysing this relationship at the region-industry level, providing evidence of the regional and industrial heterogeneity in the link between innovation and productivity. It then moves to a micro firm-level analysis, drawing from a panel of UK firms for the period between 2008 and 2017, to better understand the mechanisms behind the R&D-productivity link.
Descriptive statistics
Figure 4.11 shows the spatial distribution of average firm productivity and R&D intensity across UK regions. The spatial correlation between the two is clearly visible, with particularly high levels of both R&D intensity and total factor productivity (TFP) in the South-East of England. Relatively high levels of productivity outside of the southern regions can also be found in the East Midlands and Yorkshire.
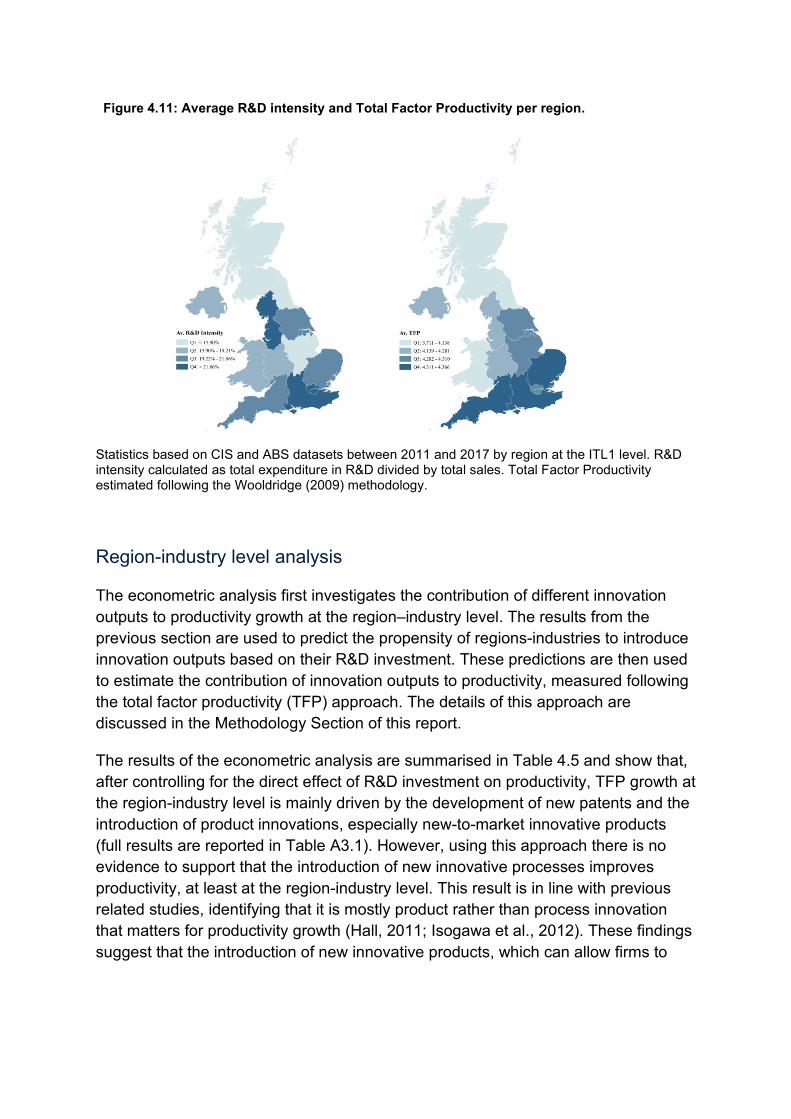
Figure 4.11: Average R&D intensity and Total Factor Productivity per region.
Statistics based on CIS and ABS datasets between 2011 and 2017 by region at the ITL1 level. R&D intensity calculated as total expenditure in R&D divided by total sales. Total Factor Productivity estimated following the Wooldridge (2009) methodology.
Region-industry level analysis
The econometric analysis first investigates the contribution of different innovation outputs to productivity growth at the region–industry level. The results from the previous section are used to predict the propensity of regions-industries to introduce innovation outputs based on their R&D investment. These predictions are then used to estimate the contribution of innovation outputs to productivity, measured following the total factor productivity (TFP) approach. The details of this approach are discussed in the Methodology Section of this report.
The results of the econometric analysis are summarised in Table 4.5 and show that, after controlling for the direct effect of R&D investment on productivity, TFP growth at the region-industry level is mainly driven by the development of new patents and the introduction of product innovations, especially new-to-market innovative products (full results are reported in Table A3.1). However, using this approach there is no evidence to support that the introduction of new innovative processes improves productivity, at least at the region-industry level. This result is in line with previous related studies, identifying that it is mostly product rather than process innovation that matters for productivity growth (Hall, 2011; Isogawa et al., 2012). These findings suggest that the introduction of new innovative products, which can allow firms to
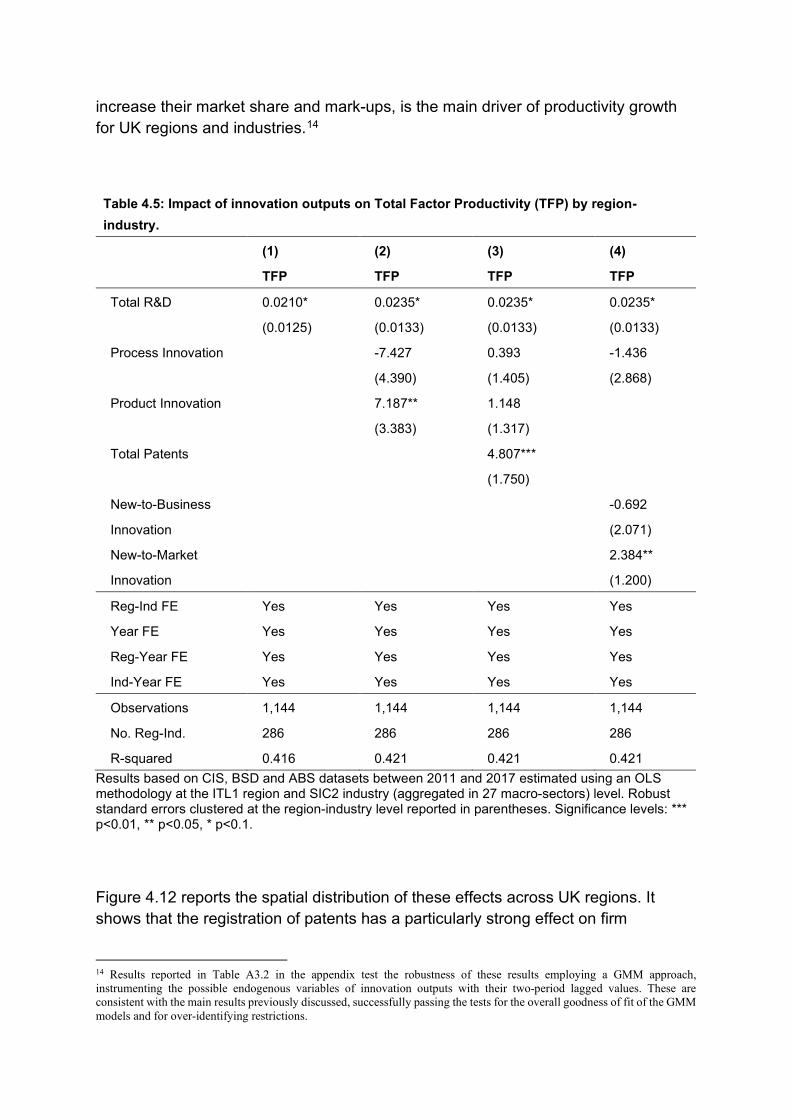
increase their market share and mark-ups, is the main driver of productivity growth for UK regions and industries.14
Table 4.5: Impact of innovation outputs on Total Factor Productivity (TFP) by region-industry.
(1) (2) (3) (4)
TFP TFP TFP TFP
Total R&D 0.0210* 0.0235* 0.0235* 0.0235*
(0.0125) (0.0133) (0.0133) (0.0133)
Process Innovation -7.427 0.393 -1.436
(4.390) (1.405) (2.868)
Product Innovation 7.187** 1.148
(3.383) (1.317)
Total Patents 4.807***
(1.750)
New-to-Business -0.692
Innovation (2.071)
New-to-Market 2.384**
Innovation (1.200)
Reg-Ind FE Yes Yes Yes Yes
Year FE Yes Yes Yes Yes
Reg-Year FE Yes Yes Yes Yes
Ind-Year FE Yes Yes Yes Yes
Observations 1,144 1,144 1,144 1,144
No. Reg-Ind. 286 286 286 286
R-squared 0.416 0.421 0.421 0.421 Results based on CIS, BSD and ABS datasets between 2011 and 2017 estimated using an OLS methodology at the ITL1 region and SIC2 industry (aggregated in 27 macro-sectors) level. Robust standard errors clustered at the region-industry level reported in parentheses. Significance levels: *** p<0.01, ** p<0.05, * p<0.1.
Figure 4.12 reports the spatial distribution of these effects across UK regions. It shows that the registration of patents has a particularly strong effect on firm
14 Results reported in Table A3.2 in the appendix test the robustness of these results employing a GMM approach, instrumenting the possible endogenous variables of innovation outputs with their two-period lagged values. These are consistent with the main results previously discussed, successfully passing the tests for the overall goodness of fit of the GMM models and for over-identifying restrictions.
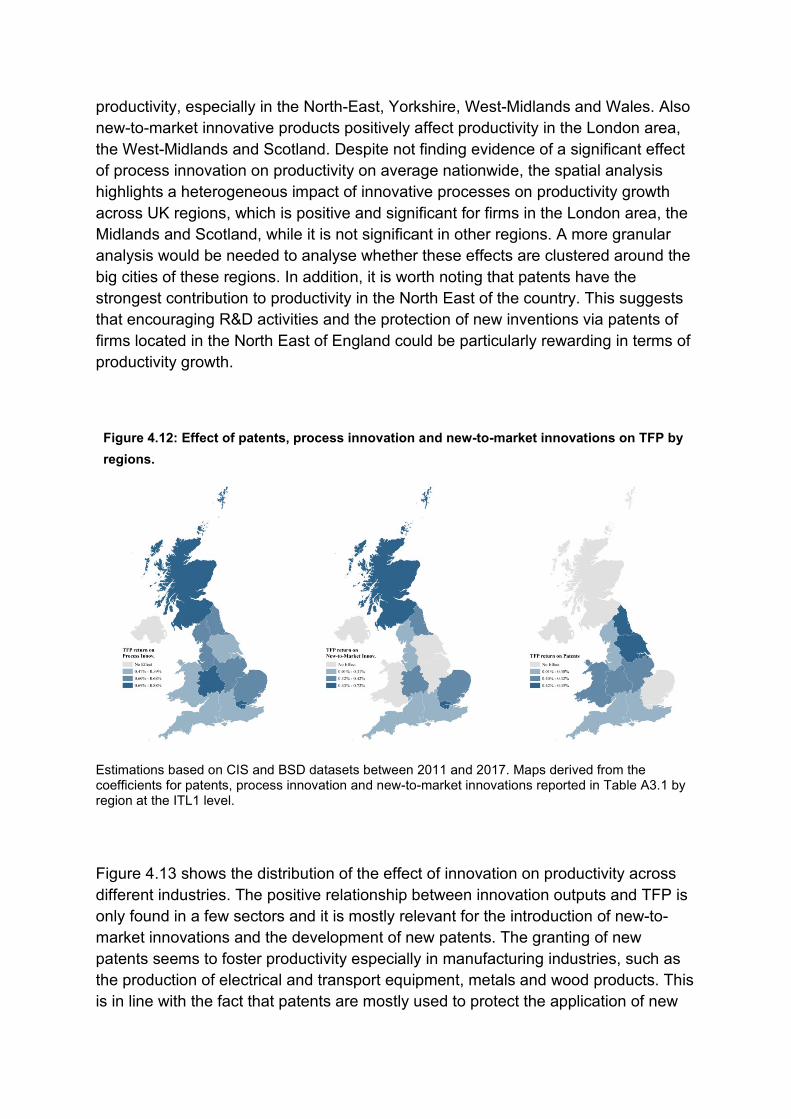
productivity, especially in the North-East, Yorkshire, West-Midlands and Wales. Also new-to-market innovative products positively affect productivity in the London area, the West-Midlands and Scotland. Despite not finding evidence of a significant effect of process innovation on productivity on average nationwide, the spatial analysis highlights a heterogeneous impact of innovative processes on productivity growth across UK regions, which is positive and significant for firms in the London area, the Midlands and Scotland, while it is not significant in other regions. A more granular analysis would be needed to analyse whether these effects are clustered around the big cities of these regions. In addition, it is worth noting that patents have the strongest contribution to productivity in the North East of the country. This suggests that encouraging R&D activities and the protection of new inventions via patents of firms located in the North East of England could be particularly rewarding in terms of productivity growth.
Figure 4.12: Effect of patents, process innovation and new-to-market innovations on TFP by regions.
Estimations based on CIS and BSD datasets between 2011 and 2017. Maps derived from the coefficients for patents, process innovation and new-to-market innovations reported in Table A3.1 by region at the ITL1 level.
Figure 4.13 shows the distribution of the effect of innovation on productivity across different industries. The positive relationship between innovation outputs and TFP is only found in a few sectors and it is mostly relevant for the introduction of new-to-market innovations and the development of new patents. The granting of new patents seems to foster productivity especially in manufacturing industries, such as the production of electrical and transport equipment, metals and wood products. This is in line with the fact that patents are mostly used to protect the application of new

inventions to manufacturing goods. On the contrary, the introduction of new-to-market innovative products is the main driver of productivity growth for services industries, such as utilities, engineering and the financial sector. In this sense, new-to-market innovative products do not refer only to manufacturing goods, but also to the introduction of new services as a result of R&D activities. This evidence suggests that R&D investment aiming at introducing innovative services should be considered as the most viable option to boost productivity in services industries, which are the largest contributors to the UK economy in terms of employment and turnover, but affected by significant low levels of productivity.
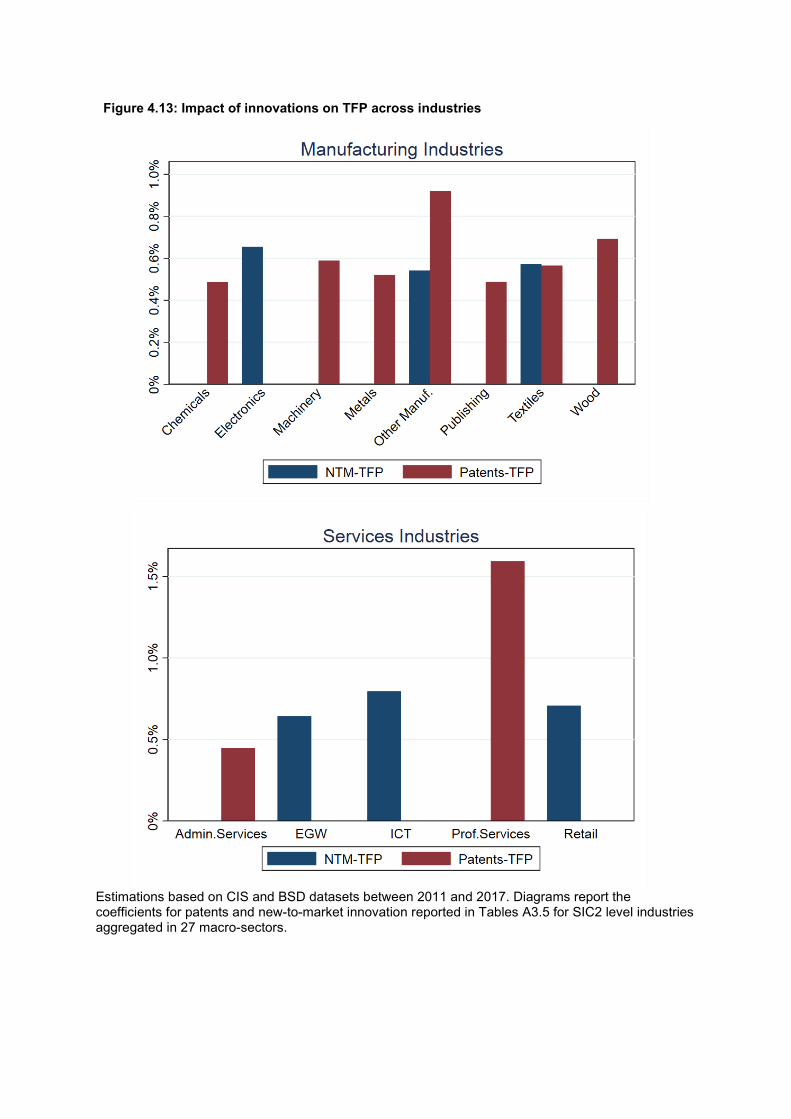
Figure 4.13: Impact of innovations on TFP across industries
Estimations based on CIS and BSD datasets between 2011 and 2017. Diagrams report the coefficients for patents and new-to-market innovation reported in Tables A3.5 for SIC2 level industries aggregated in 27 macro-sectors.

Overall, these findings highlight how different types of innovations affect productivity at the region-industry level in different ways. For this reason, ‘one-size-fits-all’ interventions might not be the best way to address the UK productivity conundrum. Rather, innovation policies aiming at improving UK productivity would need to be tailored to the specificities of individual UK regions and sectors in order to better target the needs and peculiarities of different sectoral and geographical conditions. This would require industrial policies that are both place- and industry-sensitive.
Firm-level analysis
This section investigates the relationship between R&D outcomes and productivity at the firm-level, within a standard production function framework. The aim is to obtain a greater understanding of what the returns to innovation are, and whether these differ across geographies. This framework of analysis allows a more precise identification of the relationship between innovation and productivity, by controlling for firm-specific factors that can affect productivity. It also allows to highlight relevant firm dynamics otherwise unobservable at the region-industry level and the estimation of the private rate of return of firms total output to R&D. As discussed in the methodology section, an augmented production function is estimated with three distinct factors of production: physical capital, labour, and knowledge capital (R&D) following Hall and Mairesse (1995). The estimated results of the productivity impact associated with the use of these R&D and innovative inputs for the whole sample of UK firms are summarised in Table 4.6, including differentiation by industry. More detailed results are reported in Tables A3.3-3.6 in the Appendix.
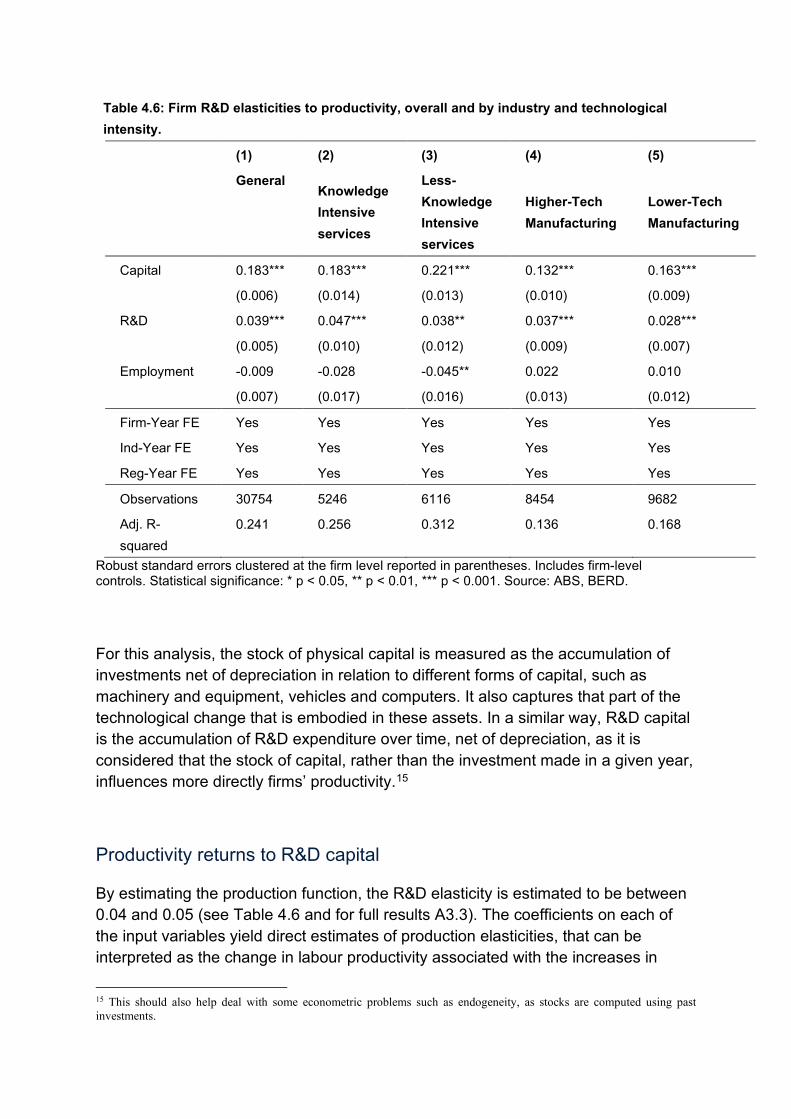
Table 4.6: Firm R&D elasticities to productivity, overall and by industry and technological intensity.
(1) (2) (3) (4) (5)
General Knowledge Intensive services
Less- Knowledge Intensive services
Higher-Tech Manufacturing
Lower-Tech Manufacturing
Capital 0.183*** 0.183*** 0.221*** 0.132*** 0.163***
(0.006) (0.014) (0.013) (0.010) (0.009)
R&D 0.039*** 0.047*** 0.038** 0.037*** 0.028***
(0.005) (0.010) (0.012) (0.009) (0.007)
Employment -0.009 -0.028 -0.045** 0.022 0.010
(0.007) (0.017) (0.016) (0.013) (0.012)
Firm-Year FE Yes Yes Yes Yes Yes
Ind-Year FE Yes Yes Yes Yes Yes
Reg-Year FE Yes Yes Yes Yes Yes
Observations 30754 5246 6116 8454 9682
Adj. R-squared
0.241 0.256 0.312 0.136 0.168
Robust standard errors clustered at the firm level reported in parentheses. Includes firm-level controls. Statistical significance: * p < 0.05, ** p < 0.01, *** p < 0.001. Source: ABS, BERD.
For this analysis, the stock of physical capital is measured as the accumulation of investments net of depreciation in relation to different forms of capital, such as machinery and equipment, vehicles and computers. It also captures that part of the technological change that is embodied in these assets. In a similar way, R&D capital is the accumulation of R&D expenditure over time, net of depreciation, as it is considered that the stock of capital, rather than the investment made in a given year, influences more directly firms’ productivity.15
Productivity returns to R&D capital
By estimating the production function, the R&D elasticity is estimated to be between 0.04 and 0.05 (see Table 4.6 and for full results A3.3). The coefficients on each of the input variables yield direct estimates of production elasticities, that can be interpreted as the change in labour productivity associated with the increases in
15 This should also help deal with some econometric problems such as endogeneity, as stocks are computed using past investments.
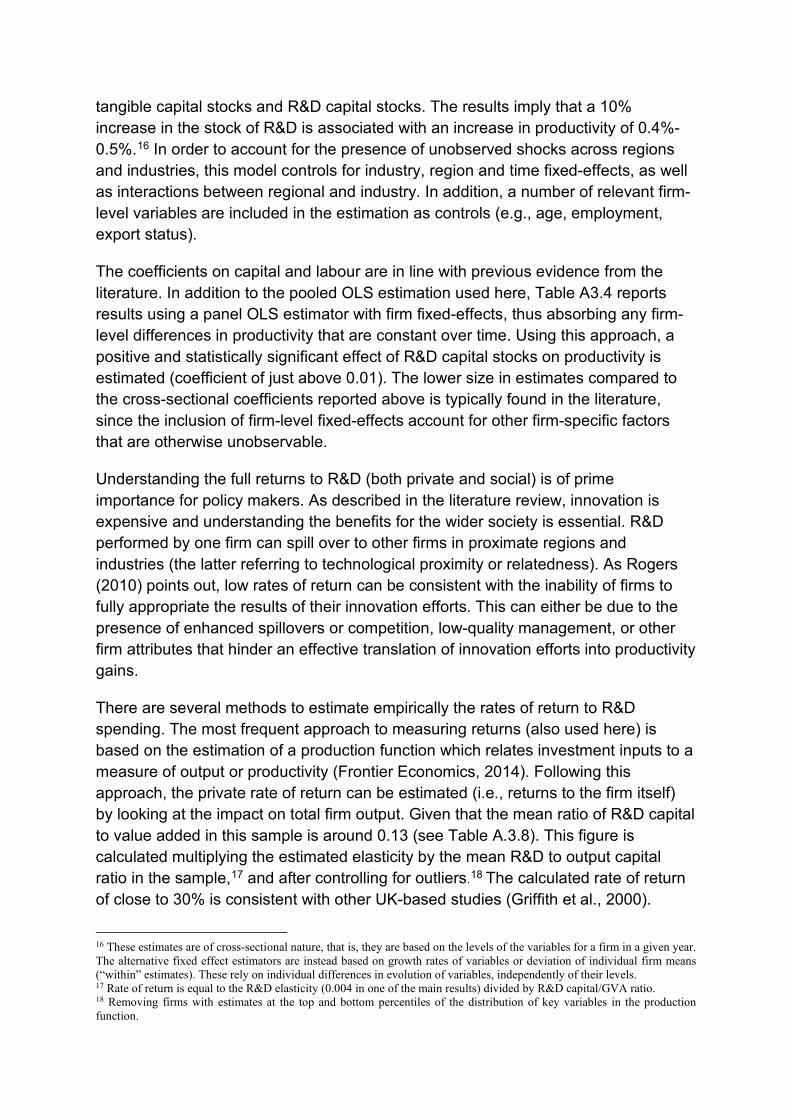
tangible capital stocks and R&D capital stocks. The results imply that a 10% increase in the stock of R&D is associated with an increase in productivity of 0.4%-0.5%.16 In order to account for the presence of unobserved shocks across regions and industries, this model controls for industry, region and time fixed-effects, as well as interactions between regional and industry. In addition, a number of relevant firm-level variables are included in the estimation as controls (e.g., age, employment, export status).
The coefficients on capital and labour are in line with previous evidence from the literature. In addition to the pooled OLS estimation used here, Table A3.4 reports results using a panel OLS estimator with firm fixed-effects, thus absorbing any firm-level differences in productivity that are constant over time. Using this approach, a positive and statistically significant effect of R&D capital stocks on productivity is estimated (coefficient of just above 0.01). The lower size in estimates compared to the cross-sectional coefficients reported above is typically found in the literature, since the inclusion of firm-level fixed-effects account for other firm-specific factors that are otherwise unobservable.
Understanding the full returns to R&D (both private and social) is of prime importance for policy makers. As described in the literature review, innovation is expensive and understanding the benefits for the wider society is essential. R&D performed by one firm can spill over to other firms in proximate regions and industries (the latter referring to technological proximity or relatedness). As Rogers (2010) points out, low rates of return can be consistent with the inability of firms to fully appropriate the results of their innovation efforts. This can either be due to the presence of enhanced spillovers or competition, low-quality management, or other firm attributes that hinder an effective translation of innovation efforts into productivity gains.
There are several methods to estimate empirically the rates of return to R&D spending. The most frequent approach to measuring returns (also used here) is based on the estimation of a production function which relates investment inputs to a measure of output or productivity (Frontier Economics, 2014). Following this approach, the private rate of return can be estimated (i.e., returns to the firm itself) by looking at the impact on total firm output. Given that the mean ratio of R&D capital to value added in this sample is around 0.13 (see Table A.3.8). This figure is calculated multiplying the estimated elasticity by the mean R&D to output capital ratio in the sample,17 and after controlling for outliers.18 The calculated rate of return of close to 30% is consistent with other UK-based studies (Griffith et al., 2000).
16 These estimates are of cross-sectional nature, that is, they are based on the levels of the variables for a firm in a given year. The alternative fixed effect estimators are instead based on growth rates of variables or deviation of individual firm means (“within” estimates). These rely on individual differences in evolution of variables, independently of their levels. 17 Rate of return is equal to the R&D elasticity (0.004 in one of the main results) divided by R&D capital/GVA ratio. 18 Removing firms with estimates at the top and bottom percentiles of the distribution of key variables in the production function.
However, the rate is lower if the fixed-effects estimation results are considered (just below 10%). The range of estimation methods provides us with a range of estimates between 10-30 per cent.
Additionally, the rate of return to knowledge capital can be computed as the increase in productivity driven by an increase in the stock of knowledge capital, net of depreciation. Assuming an annual depreciation of R&D capital of 10%, these estimates suggest that increasing R&D investment by £1 would yield a productivity benefit of just over £0.20.19
In addition to estimating the private returns to R&D, there is also evidence of spillover effects of R&D undertaken by other neighbouring firms (see Table A.3.7). The effect of R&D performed by other firms on the productivity of firms in the same LEP is just over 1%. This is a smaller effect than for private R&D, as expected. While these effects are statistically significant, they are at the lower end of the range of estimates found in prior firm-level studies, typically between 20 and 30 per cent (Frontier Economics, 2014). The social rate of return can be computed by adding the private rate of return to the sum of returns on R&D performed by other geographically proximate firms (i.e. the spillover effects), estimated to be just under 30%, in line with international evidence (Frontier Economics, 2014).20
Industry heterogeneity
This section investigates the different relationships between R&D and productivity on an industry basis, as reported in Table 4.6 and in Table A3.4. The estimation is performed distinguishing between higher-tech from lower-tech manufacturing, and knowledge-intensive from less knowledge-intensive services. The classification of industries follows the Eurostat guidelines, which measure the technological intensity of industries from measures of R&D expenditure over value added.
The R&D elasticities are higher for industries of greater technological intensity, both in manufacturing and services, which is expected and in line with previous cross-country studies (see e.g. Castellani et al., 2018). The results for high and medium-high tech manufacturing activities comprise industries such as production of pharmaceuticals and chemicals, computing, and electrical equipment, vehicles and other transport equipment. Here, the estimated elasticity of R&D on productivity is found to be 0.037. This is higher than the effect found for low and medium-low technology industries (0.028), which include the production of food and beverages, rubber and plastics, textiles and leather, basic metals and fabricated products etc.
19 Following Hall (2010) methodology, this is calculated as: Rate of return = R&D elasticity/(R&D capital/value added) - deprecation rate; (0.04/0.13) - 0.10 = 0.2. 20See results in Table A.3.7. Calculated as: (0.04 + 0.01)/0.13 = 0.28.
For services sectors, the results show a more sizable R&D effect in the more knowledge-intensive industries with an R&D elasticity of 0.047. This group comprises industries such as information and communication industries, finance and professional, technical and scientific activities. The estimated elasticity of R&D is lower for the less-knowledge intensive industries (0.038), which comprise activities such as wholesale and retail, food and accommodation, office and administrative support activities.
On the other hand, as expected, the elasticity of the physical capital stock (as opposed to R&D) is larger in the low and medium-low technology industries when compared to the high and medium-high tech industries (0.16 compared to 0.13). In addition, tangible capital is also a more important driver of productivity in those less knowledge-intensive service industries (0.22 compared to 0.18).
Finally, the industry-level results are also sensitive to the type of estimator used. As expected, including firm fixed-effects, the coefficient for the R&D capital is lower, and only statistically significant for the knowledge-intensive services, and for the manufacturing low and medium-low tech industries.
Regional heterogeneity
Next, the different effects of R&D capital on productivity across UK regions are estimated. The objective here is to investigate whether R&D capital has a different impact on productivity for firms located in different regions. In fact, results from this analysis and summarised in Table 4.7 show that the effect of R&D on productivity is higher in the East of England, as previously highlighted also in the region-industry analysis. R&D impacts in other regions are also positive and statistically significant. However, a test has shown that the East of England is the only region where the impact of R&D is statistically different to that in other regions.
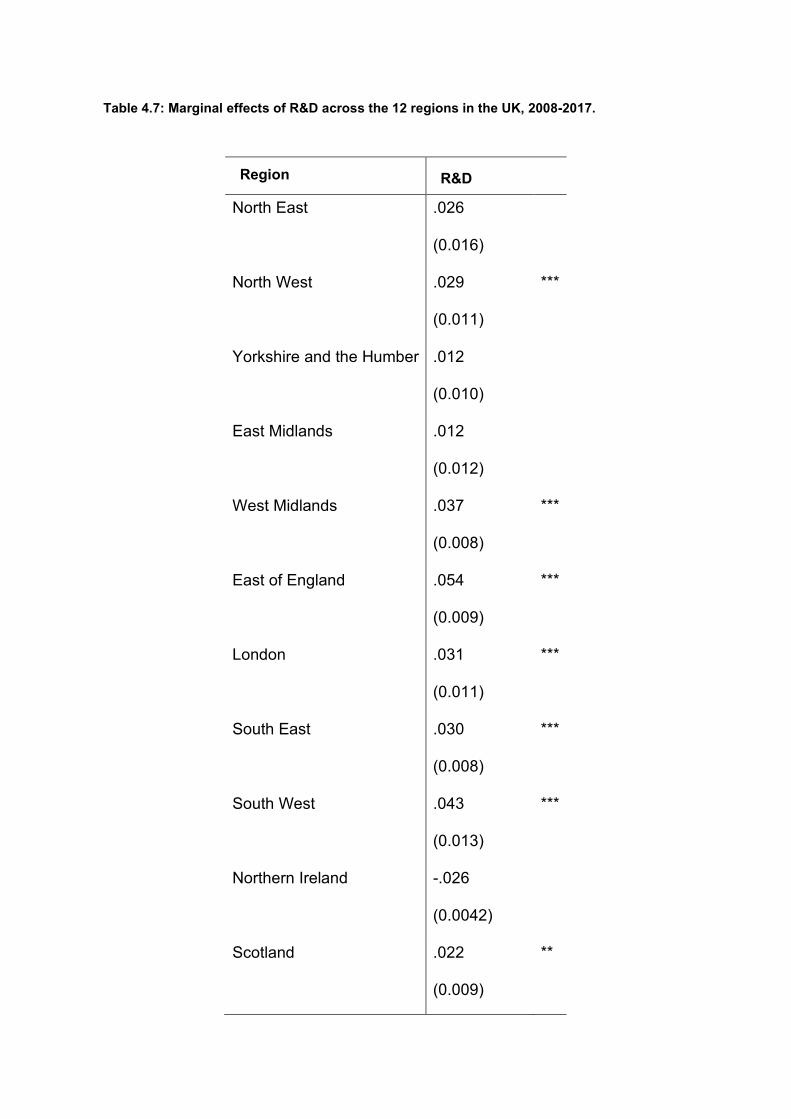
Table 4.7: Marginal effects of R&D across the 12 regions in the UK, 2008-2017.
Region R&D
North East .026
(0.016)
North West .029
(0.011)
***
Yorkshire and the Humber .012
(0.010)
East Midlands .012
(0.012)
West Midlands .037
(0.008)
***
East of England .054
(0.009)
***
London .031
(0.011)
***
South East .030
(0.008)
***
South West .043
(0.013)
***
Northern Ireland -.026
(0.0042)
Scotland .022
(0.009)
**
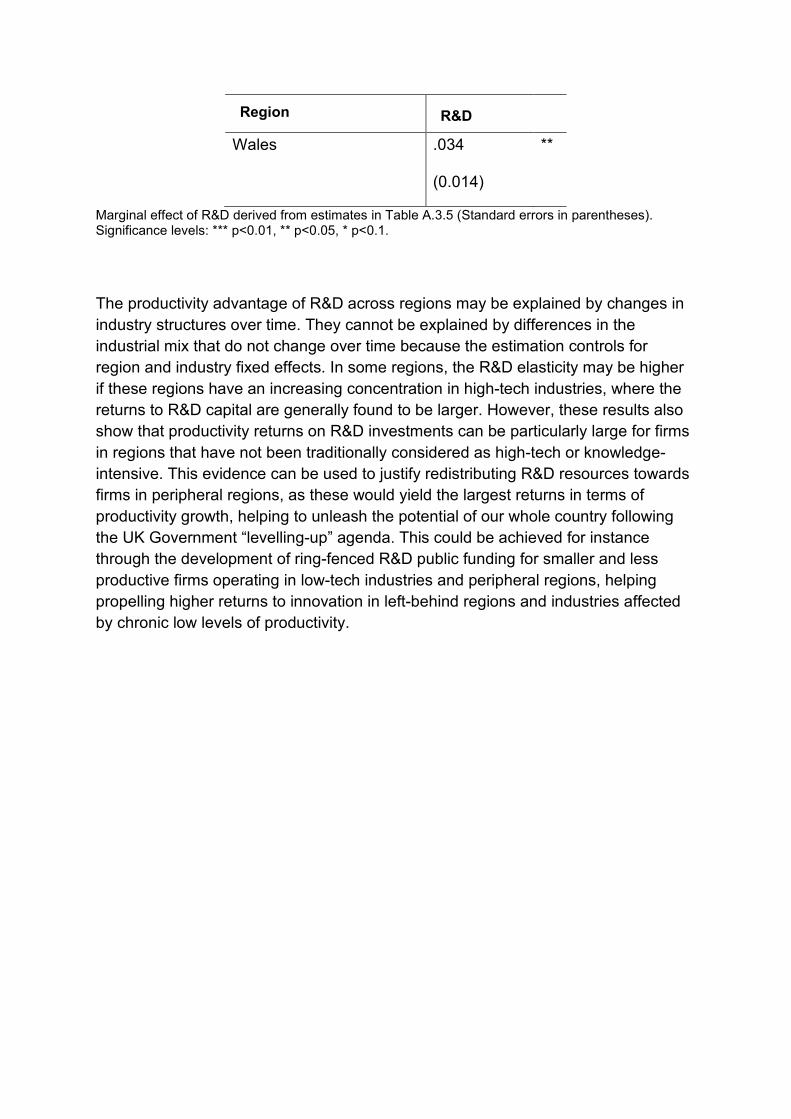
Region R&D
Wales .034
(0.014)
**
Marginal effect of R&D derived from estimates in Table A.3.5 (Standard errors in parentheses). Significance levels: *** p<0.01, ** p<0.05, * p<0.1.
The productivity advantage of R&D across regions may be explained by changes in industry structures over time. They cannot be explained by differences in the industrial mix that do not change over time because the estimation controls for region and industry fixed effects. In some regions, the R&D elasticity may be higher if these regions have an increasing concentration in high-tech industries, where the returns to R&D capital are generally found to be larger. However, these results also show that productivity returns on R&D investments can be particularly large for firms in regions that have not been traditionally considered as high-tech or knowledge-intensive. This evidence can be used to justify redistributing R&D resources towards firms in peripheral regions, as these would yield the largest returns in terms of productivity growth, helping to unleash the potential of our whole country following the UK Government “levelling-up” agenda. This could be achieved for instance through the development of ring-fenced R&D public funding for smaller and less productive firms operating in low-tech industries and peripheral regions, helping propelling higher returns to innovation in left-behind regions and industries affected by chronic low levels of productivity.

Effect of innovation on inclusive growth
The third research question examines the relationship between innovation and inclusive growth at the local level. Inclusiveness is measured in several ways, including the degree of income inequality, incidence of workless households and the level of unemployment.
The key findings in this section are:
1. There is little evidence of an impact of changes in innovation activity at a local level on various measures of inclusive growth, including inequality.
2. While there is some evidence of a small negative relationship between innovation and unemployment rate, we find no significant results for the other six measures.
3. Overall, our findings suggest that the relationship between innovation and inequality is at best weak.
This section discusses the results of the empirical analysis exploring the effects of innovation efforts (proxied by R&D investment intensity) on inclusive growth measures at the local level. As discussed in the literature review, there are only a limited number of academic studies that explore the causal effects of innovation on inclusive growth at a sub-national level. Innovation can be a positive driver of inclusiveness if it provides more equal opportunities for lower-income groups. However, innovation could also worsen socio-economic disparities if only a limited group of people, such as the highly skilled or educated, working for the most innovative and productive firms, reap the benefits. This would create both within and across regions imbalances, in particular if high-skilled workers, R&D activities and innovative firms tend to concentrate geographically in very few places, or “innovation hubs”, as previous studies have suggested (Overman et al., 2014; Crescenzi et al. 2020). This phenomenon would pose a serious threat to the levelling-up aim of the Government. Therefore, the relationship between innovation and inclusive growth at a local level is still an open question, with clear potential welfare implications.
Our empirical approach is closely related to studies by Lee and Rodríguez-Pose (2013) and Hornbeck and Moretti (2019), who estimate the relationship between innovation or productivity in local areas and measures of inequality or inclusive growth. Following the Joseph Rowntree Foundation (JRF),21 inclusive growth is measured by using a set of variables that capture economic inclusion and prosperity. These variables are described in Table A4.1 and include measures of low earnings, income inequality, unemployment, incidence of workless households, and housing
21 Available here: https://www.mui.manchester.ac.uk/igau/research/inclusive-growth-indicators/
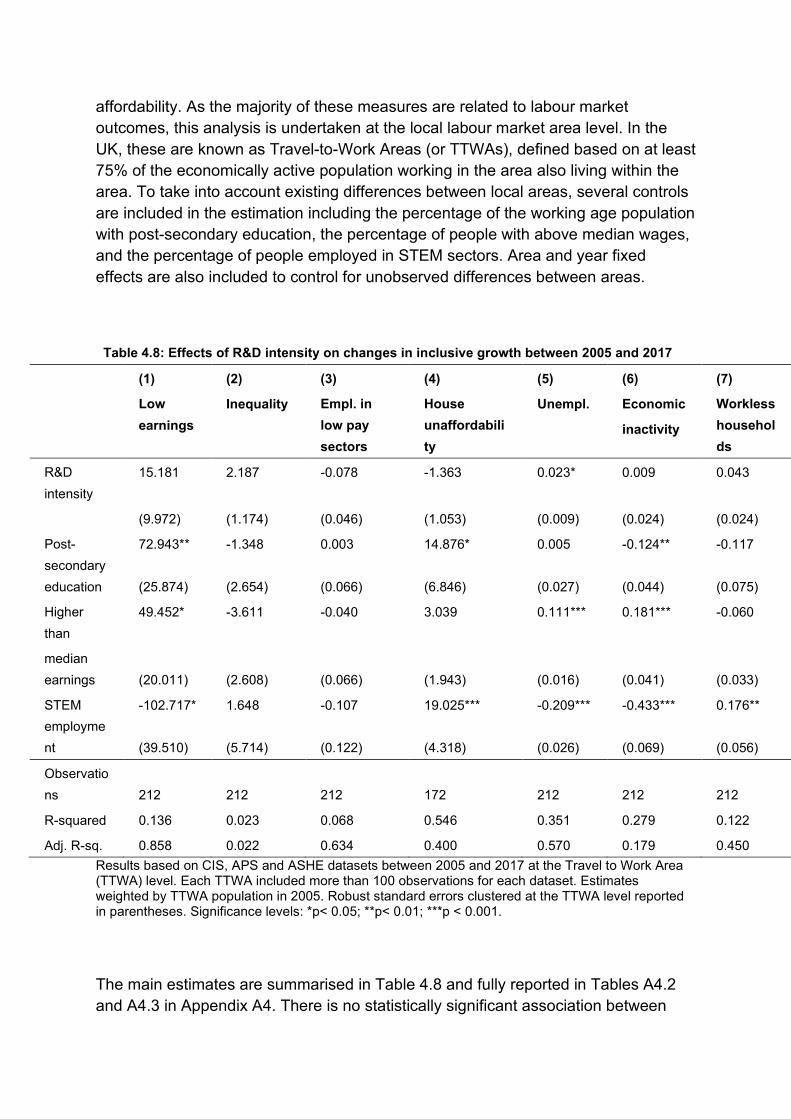
affordability. As the majority of these measures are related to labour market outcomes, this analysis is undertaken at the local labour market area level. In the UK, these are known as Travel-to-Work Areas (or TTWAs), defined based on at least 75% of the economically active population working in the area also living within the area. To take into account existing differences between local areas, several controls are included in the estimation including the percentage of the working age population with post-secondary education, the percentage of people with above median wages, and the percentage of people employed in STEM sectors. Area and year fixed effects are also included to control for unobserved differences between areas.
Table 4.8: Effects of R&D intensity on changes in inclusive growth between 2005 and 2017
(1) (2) (3) (4) (5) (6) (7)
Low earnings
Inequality Empl. in low pay sectors
House unaffordability
Unempl. Economic
inactivity
Workless households
R&D intensity
15.181 2.187 -0.078 -1.363 0.023* 0.009 0.043
(9.972) (1.174) (0.046) (1.053) (0.009) (0.024) (0.024)
Post-secondary education
72.943** -1.348 0.003 14.876* 0.005 -0.124** -0.117
(25.874) (2.654) (0.066) (6.846) (0.027) (0.044) (0.075)
Higher than
median earnings
49.452* -3.611 -0.040 3.039 0.111*** 0.181*** -0.060
(20.011) (2.608) (0.066) (1.943) (0.016) (0.041) (0.033)
STEM employment
-102.717* 1.648 -0.107 19.025*** -0.209*** -0.433*** 0.176**
(39.510) (5.714) (0.122) (4.318) (0.026) (0.069) (0.056)
Observations 212 212 212 172 212 212 212
R-squared 0.136 0.023 0.068 0.546 0.351 0.279 0.122
Adj. R-sq. 0.858 0.022 0.634 0.400 0.570 0.179 0.450 Results based on CIS, APS and ASHE datasets between 2005 and 2017 at the Travel to Work Area (TTWA) level. Each TTWA included more than 100 observations for each dataset. Estimates weighted by TTWA population in 2005. Robust standard errors clustered at the TTWA level reported in parentheses. Significance levels: *p< 0.05; **p< 0.01; ***p < 0.001.
The main estimates are summarised in Table 4.8 and fully reported in Tables A4.2 and A4.3 in Appendix A4. There is no statistically significant association between

R&D intensity and several measures of inclusive growth at the local level. The only exception is that growth in local R&D intensity appears to lead to a small increase in the share of unemployed individuals. This result is consistent with results found by Lee and Rodríguez-Pose (2013). They describe evidence of a negative relationship between innovation and inequality across Europe, where inequality was measured solely by wage inequality. Lee and Rodríguez-Pose (2013) suggest that their results for Europe can be explained by more regulated labour markets and lower migration in Europe compared to the US (where they do not find evidence of a relationship between innovation and inequality). Labour markets are considered to be more flexible in the UK compared to many European countries, so these results for the UK could arguably best be compared to those for the US. The fact that a statistically significant relationship for only one out of seven different indicators of inequality is found for the UK suggests fairly weak evidence of a relationship between innovation and inclusive growth. However, this is an area worthy of further exploration since, as Lee and Rodríguez-Pose (2013) argue, this relationship is likely to be place specific.

5 Conclusions This report has investigated the factors explaining innovative performance across regions and industries in the UK. It also measures innovation performance’s effect on productivity and inclusive growth. This is highly relevant given the importance of productivity for sustainable wage growth, and for prosperity and wellbeing.
One of the main findings is that private R&D investment successfully fosters firms’ innovations, in particular in relation to process innovation as well as in relation to new-to-business and new-to-market innovative products. By applying a range of advanced econometric techniques to a comprehensive dataset covering a range of innovation activities of UK firms, this report has also unveiled that the drivers of innovation as well as their impact on productivity, are not homogenous across the UK regions and industries. R&D investment has stronger effects when considering the most advanced and radical type of innovations, but only in those regions that are most intensive in R&D and specialised in high-tech industries. On the contrary, the effect of R&D investment in more gradual and incremental types of innovation appears to be more moderate and more evenly distributed across regions and industries in the UK.
Our results indicate that there is no evidence of a ‘crowding-out’ effect of private R&D investment by public R&D. On the contrary, public R&D seems to be beneficial, as it fosters new-to-market innovative products in particular in areas such as the Midlands and the North of England. These findings suggest that this kind of support can help companies facing financial constraints, and which might not have otherwise enough internal resources to perform R&D. Firms’ innovativeness is not nurtured just by the amount of private or public investment, but also through the spread of knowledge and ideas that are known to spill over from geographically and technologically proximate firms, universities or other research organisations undertaking R&D. Private and public R&D investment can indirectly stimulate technological improvements and foster idea creation in firms located in neighbouring areas and across the chains of integrated industries. Firms can derive new innovations through a process of combining external knowledge and learning, and with their own internal resources and experience. This analysis shows that knowledge spillovers do boost firms’ innovation, especially in terms of new patents, and are particularly relevant again in the North and in the Midlands, and all across manufacturing and service industries.
In turn, both R&D investment and innovations significantly boost productivity growth. On average, estimates suggest that a 10% increase in R&D capital leads to a 0.5% increase in firms’ productivity. In terms of rates of return, an increase in R&D investment by £1 would yield an economic return of over £0.20, as a maximum, over our period of analysis. However, this relationship is highly varied across UK

industries and regions and across estimation methods. R&D investments have a strong positive effect on productivity especially in the high-tech manufacturing industries and in knowledge-intensive services sectors, consistent with prior evidence. But positive returns are also found for firms in industries at the lower end of the technology spectrum. Second, from a regional perspective, despite R&D investment and productivity levels being higher in the South East, strong effects of innovation on productivity growth are also found in other regions characterised by lower levels of R&D and productivity, such as the West Midlands, the North East and Scotland. Productivity growth is mainly driven by the registration of new patents and the introduction of new-to-market innovative products, while there is limited evidence at present of any relevant role played by process innovation in improving productivity.
Finally, this analysis finds little evidence that innovation and productivity growth translate into more inclusive growth at the regional level, finding no significant differences within the timeframe of the analysis, along the income distribution, for example, between regions with different levels of innovation and technological intensity.
These results are of relevance to the development of new policies aimed at promoting innovation, addressing the UK productivity puzzle and the “levelling up” agenda. Overall, this report highlights the importance of R&D investment and broader innovation activities for productivity growth. Private R&D investment is particularly relevant, but public R&D support can play an essential role especially in fostering innovation in more financially constrained firms and peripheral areas. In this sense, the UK government’s commitment to increase R&D investment to 2.4% of GDP by 2027, increasing public funding in R&D to £22 billion per year, could yield long-term rewards, especially when combined with support for applied research and the commercialization of innovations.
One key finding is that the distribution of innovation differs notably across regions and industries in the UK, and with it its effect on productivity. Innovation and productivity growth remain increasingly clustered in a few specific areas and industries, mainly in the South East and in higher-tech sectors, potentially leading to larger inter-regional divergence within the UK. There are increasing concerns about the uneven distribution of innovation and economic gains across the UK. R&D activities, as a key input to the innovation process, are highly costly, risky and volatile, and as a consequence, R&D investment tends to be concentrated in very few firms and locations, widening economic inequalities. However, R&D investment and innovation could also effectively foster productivity growth in peripheral regions and in lower-tech sectors. Thus, government policy needs to be informed by place-based considerations, in order to design a “levelling up” agenda that brings about fairer and more inclusive growth. Especially in peripheral regions and in lower-tech sectors, this could be achieved by strengthening the interactions between research,

incremental innovation and commercialisation. In addition, a successful R&D ecosystem would need to support entrepreneurs and start-ups in the process of scaling up, by increasing the flow of capital into firms carrying out R&D.
Higher levels of R&D investment in the UK could lead to growth in economic productivity and prosperity through the adoption of new products and services and the creation of new high-wage jobs, tackling some of the big challenges of today and tomorrow’s societies in improving health, the environment, and living standards overall. However, it is not sufficient to increase the overall resources spent on R&D activities, as the interventions would need to be carefully selected. First, it is essential to foster greater collaborations and partnerships, including the creation of networks between private companies, universities and research institutes across regions and industries, and to invest in research infrastructures that can contribute to generate and propagate knowledge spillovers, as shown in our findings. In addition, levelling-up in innovation and economic growth could be achieved through the allocation of ring-fenced R&D public funding for smaller and less productive firms, especially if operating in low-tech industries and peripheral regions. We found evidence that both public and private R&D in these sectors and regions yield the largest returns to innovation, boosting productivity catch-up. This requires significant investment and institutional support, and the consideration of other regional elements that can deliver stronger and more resilient local economic benefits from R&D and innovation.
Looking ahead further research is needed to improve the understanding of the innovation process within firms, addressing some of the gaps that this study could not fully cover. More and better data would be needed to investigate the heterogeneous nature of R&D activities within UK regions. All datasets covering firms’ innovation in the UK used in this report are surveys that tend to be limited in scope and in sample size. For example, it is not always feasible for researchers to track changes in firms’ R&D activities across time, and to generate representative sub-samples of geographies or industries at a finer and more appropriate level (i.e., Travel to Work Areas or more disaggregated industry level).
While there is academic consensus about what the main drivers of innovation are, more research is needed in other areas in particular the role of public funding, and the quantitative and qualitative importance of innovation for achieving productivity growth. First, more research is needed to open up the knowledge spillovers black box. Compelling theories predict the existence of an involuntary flow of knowledge that benefits society at large. However, the empirical findings are rather mixed, and identifying the precise mechanisms at play and a cause-and-effect relationship remain a challenge to researchers. The availability of better data and methodologies could be a step in the right direction to provide better answers. Second, there is preliminary evidence regarding the uneven distribution of innovation across space, highlighting the complexity of high-tech economic activities, where the higher-skilled

jobs and innovations tend to cluster in large cities. This is believed to be contributing to increased regional inequalities in the availability of quality jobs and wages. More research is needed on this topic, in order to improve the understanding of the relationship between innovation and inclusive growth, and to assess what policy instruments could be used to moderate the uneven distribution of innovations, and related economic benefits across UK regions. Any UK Government policy interested in "levelling up" the UK economy geographically and sectorally should consider the pivotal role of innovation, to ensure truly inclusive economic growth, and the implementation of appropriate policies tackling the imbalances created by the uneven distribution of innovation and new technologies.

6 References Aghion, P., Akcigit, U., Bergeaud, A., Blundell, R., and Hemous, R. (2018). Innovation and Top Income Inequality. The Review of Economic Studies, 86(1): 1–45.
Alvarez, R., and Crespi, G. A. (2015). Heterogeneous effects of financial constraints on innovation: Evidence from Chile. Science and Public Policy, 42(5), 711-724.
Ascani, A., Crescenzi, R., and Iammarino, S. (2016). Economic institutions and the location strategies of European multinationals in their geographic neighborhood. Economic Geography, 92(4), 401-429.
Astebro, T. and Michela, J.L. (2005). Predictors of the survival of innovations. Journal of Product Innovation Management 22: 322-335.
Baumann, J., and Kritikos, A. S. (2016). The link between R&D, innovation and productivity: Are micro firms different? Research Policy, 45(6), 1263-1274.
Beatty, C., Crisp, R., and Gore, T. (2016). An inclusive growth monitor for measuring the relationship between poverty and growth. JRF Report.
Becker B., Roper S., Love J. (2016). The effectiveness of regional, national and EU support for innovation in the UK and Spain. ERC Research Paper No 52.
Becker, B. (2015). Public R&D policies and private R&D investment: A survey of the empirical evidence. Journal of Economic Surveys 29:917-942.
Blundell, R., Dearden, L., Meghir, C., and Sianesi, B. (1999). Human capital investment: the returns from education and training to the individual, the firm and the economy. Fiscal studies, 20(1), 1-23.
Boschma R. (2005). “Proximity and Innovation: A critical assessment”, Regional Studies, vol. 39(1): 61-74.
Castellani, D., Piva, M., Schubert, T., and Vivarelli, M. (2018). The source of the US/EU productivity gap: Less and less effective R&D (No. 2018/16). LEM Working Paper Series.
Cin, B.C., Kim, Y.J. and Vonortas, N.S. (2017). The impact of public R&D subsidy on small firm productivity: evidence from Korean SMEs. Small Business Economics 48:345-360.
Cohen, W. M., and Levinthal, D. A. (1990). Absorptive capacity: A new perspective on learning and innovation. Administrative Science Quarterly, 128-152.

Conte, A., and Vivarelli, M. (2014). Succeeding in innovation: key insights on the role of R&D and technological acquisition drawn from company data. Empirical Economics, 47(4), 1317-1340.
Cooke, P., Uranga, M. G., and Etxebarria, G. (1998). Regional systems of innovation: an evolutionary perspective. Environment and planning A, 30(9), 1563-1584.
Crépon, B., Duguet, E., and Mairesse, J. (1998). Research, Innovation And Productivity: An Econometric Analysis At The Firm Level. Economics of Innovation and New Technology, 7(2), 115-158.
Crescenzi, R., Gagliardi, L., and Iammarino, S. (2015). Foreign multinationals and domestic innovation: Intra-industry effects and firm heterogeneity. Research Policy, 44(3), 596-609.
Crescenzi, R., Iammarino, S., Ioramashvili, C., Rodríguez-Pose, A., and Storper, M. (2020). The Geography of Innovation and Development: Global spread and local hotspots. Geography and Environment Discussion Paper Series, no. 4.
Criscuolo C., Martin R., Overman H.G. and Van Reenen J. (2016). The causal effects of an industrial policy. CEP Discussion Paper No 1113.
Crowley, F. (2017). Product and service innovation and discontinuation in manufacturing and service firms in Europe. European Journal of Innovation Management, 20(2), 250-268.
Crowley, F., and McCann, P. (2018). Firm innovation and productivity in Europe: evidence from innovation-driven and transition-driven economies. Applied Economics, 50(11), 1203-1221.
De Blasio, G., Fantino, D., and Pellegrini, G. (2015). Evaluating the impact of innovation incentives: evidence from an unexpected shortage of funds. Industrial and Corporate Change 24:1285–1314.
D’Este, P., Guy, F. and Iammarino S. (2013). Shaping the formation of university–industry research collaborations: what type of proximity does really matter? Journal of Economic Geography 13(4): 537–558.
Dimos, C. and Pugh, G. (2016). The effectiveness of R&D subsidies: A meta-regression analysis of the evaluation literature. Research Policy 45:797-815.
Doloreux, D. (2002). What we should know about regional systems of innovation. Technology in society, 24(3), 243-263.

Doloreux, D., and Gomez, I. P. (2017). A review of (almost) 20 years of regional innovation systems research. European Planning Studies, 25(3), 371-387.
Florida, R. (2003). Cities and the creative class. City & community, 2(1), 3-19.
García-Quevedo, J., Pellegrino, G., and Vivarelli, M. (2014). R&D drivers and age: Are young firms different? Research Policy, 43(9), 1544-1556.
Guellec, D. and van Pottelsberghe, B. (2004), “From R&D to productivity growth: Do the institutional setting and the source of funds matter?”, Oxford Bulleting of Economics and Statistics, 66(3), 353-378
Görg, H. and Strobl, E. (2007). The effect of R&D subsidies on private R&D. Economica 74:215–234.
Griffith, R., Huergo, E., Mairesse, J., and Peters, B. (2006). Innovation and productivity across four European countries. Oxford Review of Economic Policy, 22(4), 483-498.
Griffith, R., Redding, S., and Reenen, J. V. (2004). Mapping the two faces of R&D: Productivity growth in a panel of OECD industries. Review of Economics and Statistics, 86(4), 883-895.
Griliches, Z. (1998), “R&D and productivity: The econometric evidence, Chicago, IL. University of Chicago Press.
Griliches, Z. (1979). Issues in assessing the contribution of research and development to productivity growth. The Bell Journal of Economics, 92-116.
Griliches, Z. and Lichtemberg, F. (1984), “Interindustry technology flows and productivity growth: A re-examination”, Review of Economic and Statistics, 66(2), 324-329.
Grillo, F., and Landabaso, M. (2011). Merits, problems and paradoxes of regional innovation policies. Local Economy, 26(6-7), 544-561.
Guimarães, P., Figueiredo, O., and Woodward, D. (2000). Agglomeration and the Location of Foreign Direct Investment in Portugal. Journal of Urban Economics, 1(47), 115-135.
Hall, B. H. (2010). The financing of innovative firms. Review of Economics and Institutions, 1(1).
Hall, B. H. (2011). Innovation and productivity. Nordic Economic Policy Review, (2-2011), 167.

Hall, B. H., and Sena, V. (2017). Appropriability mechanisms, innovation, and productivity: evidence from the UK. Economics of Innovation and New Technology, 26(1-2), 42-62.
Hall, B. H., Mairesse, J., and Mohnen, P. (2010). Measuring the Returns to R&D. In Handbook of the Economics of Innovation (Vol. 2, pp. 1033-1082). North-Holland.
Hewitt-Dundas, N., Gkypali, A., and Roper, S. (2017). Accessibility, utility and learning effects in university-business collaboration. ERC Research Paper No 57.
Hornbeck, R. and Moretti, E. (2019). Who Benefits From Productivity Growth? Direct and Indirect Effects of Local TFP Growth on Wages, Rents, and Inequality, NBER Working Paper No. 24661 (January).
Howell, S.T. (2017). Financing innovation: Evidence from R&D grants. American Economic Review 107:1136-64.
Hughes, A. (2012). Choosing races and placing bets: UK national innovation policy and the globalisation of innovation systems. The UK in a global world, 37.
Iammarino, S., and McCann, P. (2013). Multinationals and economic geography: Location, technology and innovation. Edward Elgar Publishing.
Iammarino, S., and McCann, P. (2018) Network Geographies and Geographical Networks: Co-dependence and Co-evolution of Multinational Enterprises and Space. In: The New Oxford Handbook of Economic Geography. Oxford, UK: Oxford University Press.
Iammarino, S., Rodriguez-Pose, A., and Storper, M. (2019). Regional inequality in Europe: evidence, theory and policy implications. Journal of Economic Geography, 19(2): 273-298.
Isogawa, D., Nishikawa, K. and Ohashi, H. (2012). Innovation height and firm performance: using innovation survey from Japan. RIETI Discussion Paper Series 12‐E‐077.
Jones, B. F. (2009). The burden of knowledge and the "death of the renaissance man": Is innovation getting harder? The Review of Economic Studies 76(1), 283–317.
Kancs, D. A.,and Siliverstovs, B. (2016). R&D and non-linear productivity growth. Research Policy, 45(3), 634-646.
Kirner, E., Kinkel, S., and Jäger, A. (2009). Innovation Paths and the Innovation Performance of Low-technology Firms – an Empirical Analysis of German Industry. Research Policy, 38(3): 447-458.

Kleinknecht, A., K. Van Montfort and E. Brouwer. (2002). “The Non-Trivial Choice between Innovation Indicators,” Economics of Innovation and New Technology, 11(2), pp. 109-121.
Lee, N. (2019). Inclusive Growth in cities: a sympathetic critique. Regional Studies, 53(3): 424-434.
Lee, N. and Rodríguez-Pose, A. (2013). Innovation and spatial inequality in Europe and USA, Journal of Economic Geography, 13(1), pp. 1–22.
Lerner J. (1999). The government as venture capitalist: The long-run effects of the SBIR program. Journal of Business 72:285-318.
Lööf, H., and Heshmati, A. (2002). Knowledge capital and performance heterogeneity: A firm-level innovation study. International Journal of Production Economics, 76(1), 61-85.
Lööf, H., Mairesse, J., and Mohnen, P. (2017). CDM 20 years after. Economics of Innovation and New Technology, 26(1-2), 1-5.
Mairesse, J., and Mohnen, P. (2010). Using innovation surveys for econometric analysis. In Handbook of the Economics of Innovation (Vol. 2, pp. 1129-1155). North-Holland.
Martin, B.R. (2012). The evolution of science policy and innovation studies. Research Policy 41:1219-1239.
Mason, G., C. Robinson, and C. Rosazza Bondibene. (2013). “Firm growth and innovation in UK city regions,” NESTA Working Paper No. 13/11. June.
Mazzucato, M. (2016). From market fixing to market-creating: a new framework for innovation policy. Industry and Innovation 23:140-156.
McCann, P. (2007). Sketching out a model of innovation, face-to-face interaction and economic geography. Spatial Economic Analysis, 2(2), 117-134.
McCann, P., and Acs, Z. J. (2011). Globalization: countries, cities and multinationals. Regional Studies, 45(1), 17-32.
McCann, P., and Ortega-Argilés, R. (2013). Modern regional innovation policy. Cambridge Journal of Regions, Economy and Society, 6(2), 187-216.
Mohnen, P. and Hall, B. H. (2013). Innovation and productivity: An update. Eurasian Business Review, 3(1), 47-65.

Montresor, S., and Vezzani, A. (2015). The production function of top R&D investors: Accounting for size and sector heterogeneity with quantile estimations. Research Policy, 44(2), 381-393.
Moretti, E. (2012). The new geography of jobs. New York: Houghton Mifflin Harcourt.
Morgan, K. (2017). Nurturing novelty: Regional innovation policy in the age of smart specialisation. Environment and Planning C: Politics and Space, 35(4), 569-583.
Morris, D. M. (2018). Innovation and productivity among heterogeneous firms. Research Policy, 47(10), 1918-1932.
Muscio, A., Reid, A., and Rivera Leon, L. (2015). An empirical test of the regional innovation paradox: can smart specialisation overcome the paradox in Central and Eastern Europe? Journal of Economic Policy Reform, 18(2), 153-171.
OECD (2010). Innovation vouchers, ed. O.I.P. Platform. Paris: OECD.
OECD (2011) Regions and Innovation Policy. Paris: Organisation for Economic Cooperation and Development.
OECD (2014). All on board: Making inclusive growth happen. OECD, Paris.
Ortega‐Argilés, R., Piva, M., and Vivarelli, M. (2014). The transatlantic productivity gap: Is R&D the main culprit? Canadian Journal of Economics/Revue Canadienne d'économique, 47(4), 1342-1371.
Ortega-Argilés, R., Piva, M., and Vivarelli, M. (2015). The productivity impact of R&D investment: are high-tech sectors still ahead? Economics of Innovation and New Technology, 24(3), 204-222.
Ortega‐Argilés, R., Piva, M., Potters, L., and Vivarelli, M. (2010). Is corporate R&D investment in high‐tech sectors more effective? Contemporary Economic Policy, 28(3), 353-365.
Oughton, C., Landabaso, M., and Morgan, K. (2002). The regional innovation paradox: innovation policy and industrial policy. The Journal of Technology Transfer, 27(1), 97-110.
Parisi, M. L., Schiantarelli, F., and Sembenelli, A. (2006). Productivity, innovation and R&D: Micro evidence for Italy. European Economic Review, 50(8), 2037-2061.
Peters, B., Roberts, M. J., Vuong, V. A., and Fryges, H. (2017). Estimating dynamic R&D choice: an analysis of costs and long‐run benefits. The RAND Journal of Economics, 48(2), 409-437.

Robertson, P.L., Keith, S., and Von Tunzelmann, N. (2009). Innovation in low- and medium-technology industries Introduction. Research Policy, 38(3):441-446.
Robinson, C., Garcia, M., Howells J., and Ko, G. (2020). The Role of Innovation in Small Business Performance: A Regional Perspective. ERC Research Paper no. 82.
Rogers, M. (2010). R&D and productivity: Using UK firm‐level data to inform policy. Empirica 37: 329–59.
Romer, P.M. (1986), “Increasing Returns and Long-Run Growth”, Journal of Political Economy, October 1986, 94, 1002-37.
Romer, P.M., (1990) “Endogenous Technological Change," Journal of Political Economy, 98, vol.5.
Roper, S.; J. Du; and J.H. Love. (2008). Modelling the innovation value chain. Research Policy 37: 961-977.
Schmidt, T. (2010). Absorptive capacity—one size fits all? A firm‐level analysis of absorptive capacity for different kinds of knowledge. Managerial and Decision Economics, 31(1), 1-18.
Trigo, A. (2013). The nature of innovation in R&D-and non-R&D-intensive service firms: Evidence from firm-level latent class analysis. Industry and Innovation, 20(1), 48-68.
Ugur, M., Trushin, E., Solomon, E., and Guidi, F. (2016). R&D and productivity in OECD firms and industries: A hierarchical meta-regression analysis. Research Policy, 45(10): 2069-2086.
Van Alphen, K.; Van Ruijven, J., Kasa, S., Hekkert, M. and Turkenburg, W. (2009). The performance of the Norwegian carbon dioxide, capture and storage innovation system. Energy Policy 37:43-55.
Vanino, E., Roper, S., and Becker, B. (2019). Knowledge to money: Assessing the business performance effects of publicly-funded R&D grants. Research Policy, 48(7): 1714-1737.
Von Stamm, B. (2003). Innovation, Creativity and Design. Chichester: John Wiley and Sons.
Zehavi, A. and Breznitz, D. (2017). Distribution sensitive innovation policies: Conceptualization and empirical examples. Research Policy 46:327-336.

Zhao, B. and Ziedonis, R.H. (2012). State governments as financiers of technology start-ups: Implications for firm performance. Available at http://dx.doi.org/10.2139/ssrn.2060739.
Zona, F. (2012). Corporate investing as a response to economic downturn: Prospect theory, the behavioural agency model and the role of financial slack. British Journal of Management 23:S42-S57.
Zuniga-Vicente, J.A.; C. Alonso-Borrego; F.J. Forcadell; and J.I. Galan. (2014). Assessing the effect of public subsidies on firm R&D investment: A survey. Journal of Economic Surveys 28:36-67.
Appendix A
A1. Data sources and matching
This study is based on data compiled matching together different micro-level datasets provided by the Office for National Statistics (ONS), UK Research Councils and the European Commission. This section provides details about the data sources and their matching rates22.
A1.1 UK Innovation Survey (UKIS) / Community and Innovation Survey (CIS)
The aim of the UK Innovation Survey (UKIS) is to collect data from businesses about various aspects of their innovation-related activities on a biennial basis from 2001 to 2017.23 The UKIS is also known as the Community and Innovation Survey (CIS) with questions being harmonised across Europe. Crucially for this project, the survey asks questions about both innovation inputs and outputs. This is important as it allows to explore whether R&D activities lead to innovation outcomes. R&D inputs include, for example, the share of employees with STEM degrees, R&D expenditure, information on financial support from the UK Government, from the European Commission, or other sources, and cooperation with other organizations. Outputs measured in the survey include for example, the percentage of total turnover from innovative goods or services, whether new to the business or to the market, and process innovations. It can be used to measure the level, types and trends of innovation across firms and across regions and industries. The survey includes only firms with more than 10 employees, but results are weighted back to the population of firms using data from the IDBR, making it representative of the population of UK firms.
Table A1.1 shows the number of observations in each year of the CIS, the number of observations after some initial cleaning, and the number of observations in the matched CIS-BSD sample. Table A1.2 instead reports the frequency with which the same firms occur more than once. Approximately 32% of firms only appear once, while 66% of firms occur more than once.
Table A1.1: Matched CIS-BSD data.
22 This dataset has been constructed by accredited researchers at the ONS Secure Research Service (SRS) for this research project. Underlying databases can be accessed by all accredited researchers that register a research project through the SRS. 23 The questionnaire includes 28 questions and it is available at the following link: https://assets.publishing.service.gov.uk/government/uploads/system/uploads/attachment_data/file/750535/UKIS_FINAL_questionnaire_2017.pdf
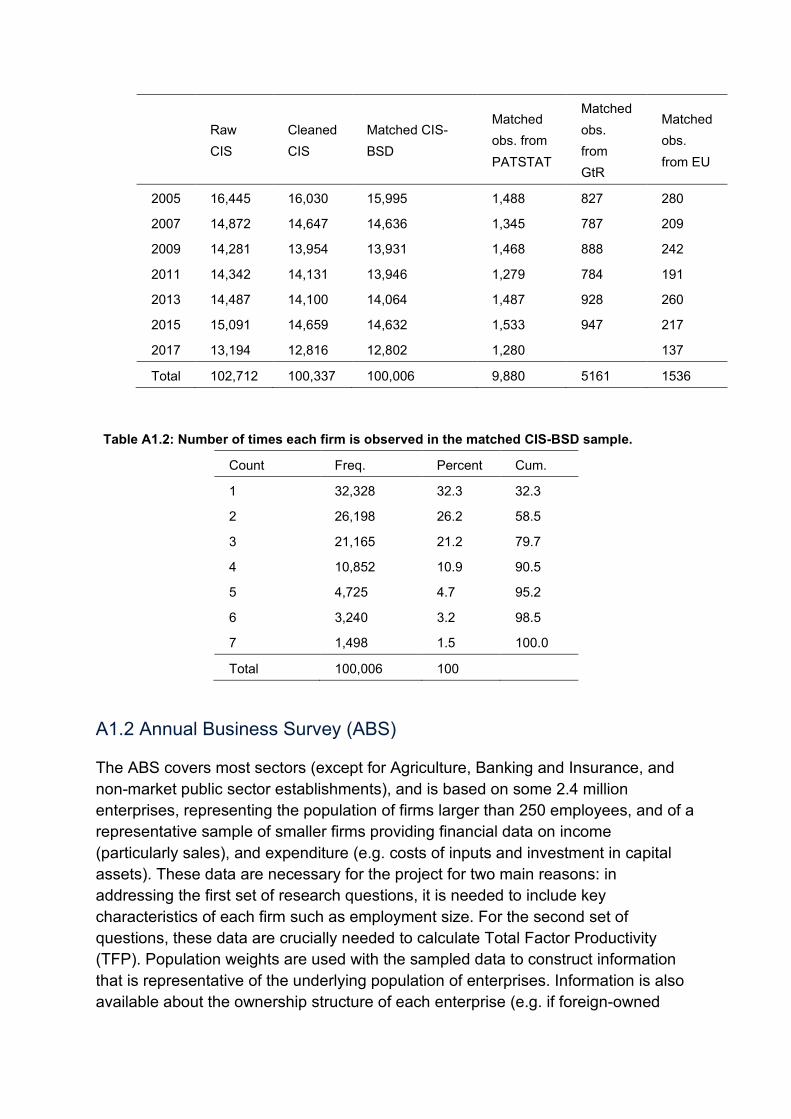
Raw CIS
Cleaned CIS
Matched CIS-BSD
Matched obs. from PATSTAT
Matched obs. from GtR
Matched obs. from EU
2005 16,445 16,030 15,995 1,488 827 280
2007 14,872 14,647 14,636 1,345 787 209
2009 14,281 13,954 13,931 1,468 888 242
2011 14,342 14,131 13,946 1,279 784 191
2013 14,487 14,100 14,064 1,487 928 260
2015 15,091 14,659 14,632 1,533 947 217
2017 13,194 12,816 12,802 1,280 137
Total 102,712 100,337 100,006 9,880 5161 1536
Table A1.2: Number of times each firm is observed in the matched CIS-BSD sample.
Count Freq. Percent Cum.
1 32,328 32.3 32.3
2 26,198 26.2 58.5
3 21,165 21.2 79.7
4 10,852 10.9 90.5
5 4,725 4.7 95.2
6 3,240 3.2 98.5
7 1,498 1.5 100.0
Total 100,006 100
A1.2 Annual Business Survey (ABS)
The ABS covers most sectors (except for Agriculture, Banking and Insurance, and non-market public sector establishments), and is based on some 2.4 million enterprises, representing the population of firms larger than 250 employees, and of a representative sample of smaller firms providing financial data on income (particularly sales), and expenditure (e.g. costs of inputs and investment in capital assets). These data are necessary for the project for two main reasons: in addressing the first set of research questions, it is needed to include key characteristics of each firm such as employment size. For the second set of questions, these data are crucially needed to calculate Total Factor Productivity (TFP). Population weights are used with the sampled data to construct information that is representative of the underlying population of enterprises. Information is also available about the ownership structure of each enterprise (e.g. if foreign-owned

and/or part of a business group), and when plants opened, closed or were bought and sold (acquisitions/mergers). Each plant has a postcode address and a 5-digit industry code classification (SIC).
A1.3 Business Structure Database (BSD)
The BSD dataset covers virtually all business organisations in the UK, but providing only a limited number of variables. The BSD is derived primarily from the Inter-Departmental Business Register (IDBR), which is a live register of data collected by HM Revenue and Customs via VAT and Pay As You Earn (PAYE) records. The IDBR data are complimented with data from ONS business surveys. If a business is liable for VAT (turnover exceeds the VAT threshold) and/or has at least one member of staff registered for the PAYE tax collection system, then the business appears on the IDBR, and hence in the BSD. In 2004 it was estimated that the businesses listed on the IDBR accounted for almost 99 per cent of economic activity in the UK. Only very small businesses, such as self-employed, are not found on the IDBR. Because of the broad coverage, it is possible to match virtually all of the CIS to the BSD in contrast to the much lower matching rate possible between the CIS and the ABS. The BSD contains key firm characteristics such as firm age, employment and turnover. While it does not contain enough information to calculate TFP (notably the absence of information on capital expenditure), it does allow us to calculate labour productivity (turnover over total employment) for a larger sample of firms than it will be possible to calculate TFP for using the ABS. While TFP and labour productivity are different measures of productivity, they both capture the overall productive efficiency of inputs. Analysing both measures of productivity should be informative in order to understand better the nature of differences in firm productivity across regions.
A1.4 Business Enterprise Research & Development (BERD)
The BERD dataset covers the annual expenditure and numbers of employees in research and development activities in the UK, broken down by industrial sector. The UK sample size is approximately 5,500 businesses (4,000 in GB and 1,500 in NI), with a response rate around 92%.24 The sampling frame consists of 31,400 businesses in the UK that are known to carry out R&D, and the survey is stratified by R&D expenditure, employment size bands (under 100, 100-399, and over 400), and industry. The key issue with using BERD is its relatively low sample size. However, the long questionnaire is sent to the 400 largest R&D performers that account for
24 QMI, ONS (2017): https://www.ons.gov.uk/economy/governmentpublicsectorandtaxes/researchanddevelopmentexpenditure/methodologies/ukbusinessenterpriseresearchanddevelopmentsurveyqmi
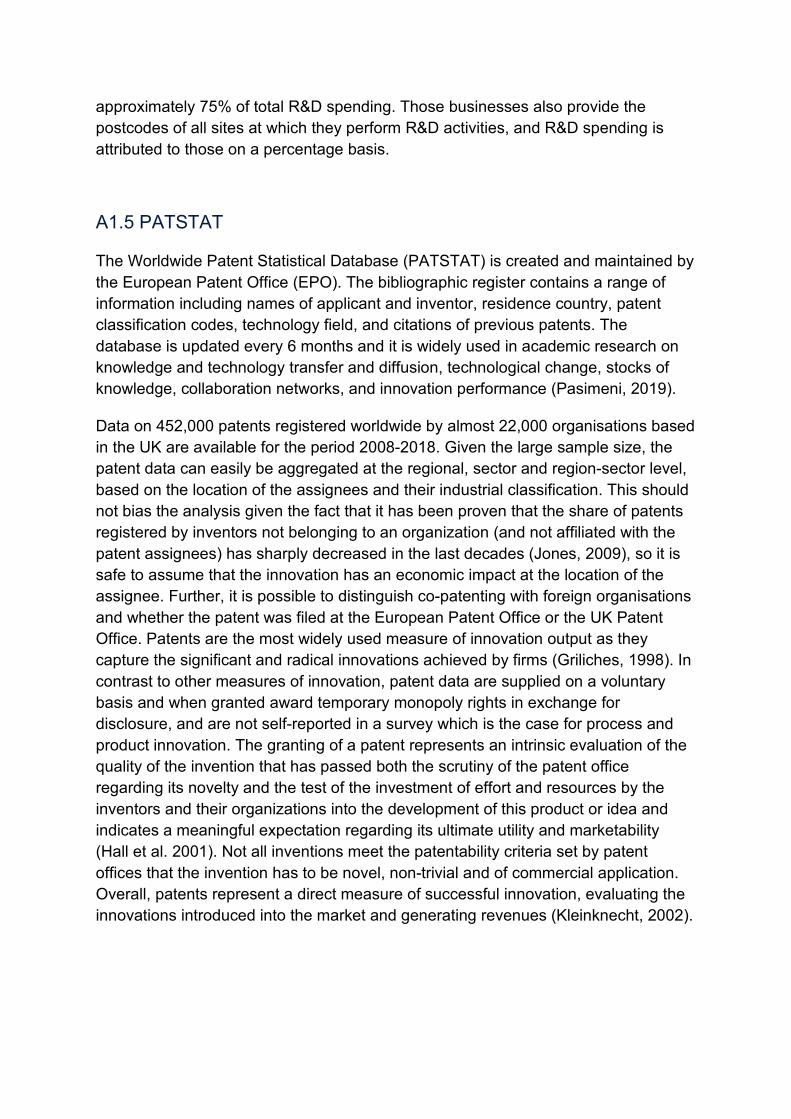
approximately 75% of total R&D spending. Those businesses also provide the postcodes of all sites at which they perform R&D activities, and R&D spending is attributed to those on a percentage basis.
A1.5 PATSTAT
The Worldwide Patent Statistical Database (PATSTAT) is created and maintained by the European Patent Office (EPO). The bibliographic register contains a range of information including names of applicant and inventor, residence country, patent classification codes, technology field, and citations of previous patents. The database is updated every 6 months and it is widely used in academic research on knowledge and technology transfer and diffusion, technological change, stocks of knowledge, collaboration networks, and innovation performance (Pasimeni, 2019).
Data on 452,000 patents registered worldwide by almost 22,000 organisations based in the UK are available for the period 2008-2018. Given the large sample size, the patent data can easily be aggregated at the regional, sector and region-sector level, based on the location of the assignees and their industrial classification. This should not bias the analysis given the fact that it has been proven that the share of patents registered by inventors not belonging to an organization (and not affiliated with the patent assignees) has sharply decreased in the last decades (Jones, 2009), so it is safe to assume that the innovation has an economic impact at the location of the assignee. Further, it is possible to distinguish co-patenting with foreign organisations and whether the patent was filed at the European Patent Office or the UK Patent Office. Patents are the most widely used measure of innovation output as they capture the significant and radical innovations achieved by firms (Griliches, 1998). In contrast to other measures of innovation, patent data are supplied on a voluntary basis and when granted award temporary monopoly rights in exchange for disclosure, and are not self-reported in a survey which is the case for process and product innovation. The granting of a patent represents an intrinsic evaluation of the quality of the invention that has passed both the scrutiny of the patent office regarding its novelty and the test of the investment of effort and resources by the inventors and their organizations into the development of this product or idea and indicates a meaningful expectation regarding its ultimate utility and marketability (Hall et al. 2001). Not all inventions meet the patentability criteria set by patent offices that the invention has to be novel, non-trivial and of commercial application. Overall, patents represent a direct measure of successful innovation, evaluating the innovations introduced into the market and generating revenues (Kleinknecht, 2002).

A1.6 EU funding data from CORDIS
Data on EU funded R&D projects in the UK are collected from the EU CORDIS database (https://cordis.europa.eu/projects/en), providing information on UK organizations participating to EU funded R&D projects, such as the Horizon2020 framework. Through the ONS system this dataset is matched to the other firm-level datasets. These data are important for answering both of the main research questions, understanding the impact of public support on innovation outcomes and on the returns to innovation, as the EU is a significant source of innovation funding.
A1.7 Gateway to Research (GtR)
From the Gateway to Research (GtR) website developed by the UK Research Councils data on publicly funded public and private R&D projects have been extracted for the period 2004-2016. Of about 34,000 participating organisations, the largest group is that of private firms (with more than 14,500 firms participating in funded projects). The GtR database provides details on the number and value of funded projects, the number and characteristics of partners, the topics and outcomes of the research projects, the value of grants awarded per year, what is the Research Council providing the funding, and information about each project’s leader.
A1.8 Data on inclusive growth
To measure inclusive growth, the Annual Survey on Hours and Earnings (ASHE), and the Labour Force Survey (LFS)/Annual Population Survey (APS) are used 25. The ASHE is available annually from 1997 to 2018 and is based on a 1% sample of HMRC tax records. The APS is a nationally representative household survey and is available annually from 2004 to 2017. These datasets report socio-economic information about workers and households such as education, wages and skills.
25 The APS is essentially the LFS but with boosted regional samples providing more data for small area analysis.
A2 Main drivers of innovation
A2.1 Methodology
A2.1.1 Econometric model To answer the first set of research questions, a linear regression model is applied to estimate the relationship between R&D inputs and innovation outputs, both at the firm and at the region-industry level:
𝑌𝑌𝑖𝑖𝑖𝑖𝑟𝑟 = 𝛼𝛼 + 𝛽𝛽0𝑰𝑰𝑖𝑖𝑖𝑖𝑟𝑟−𝑛𝑛 + 𝛽𝛽1𝑿𝑿𝑖𝑖𝑖𝑖𝑟𝑟−𝑛𝑛 + 𝛽𝛽2𝑷𝑷𝑖𝑖𝑖𝑖𝑟𝑟−𝑛𝑛+ 𝛽𝛽3𝑹𝑹𝑖𝑖𝑟𝑟−𝑛𝑛 + 𝛽𝛽4𝑶𝑶𝑖𝑖𝑟𝑟−𝑛𝑛 + 𝛿𝛿𝑖𝑖 + 𝛾𝛾𝑖𝑖 + 𝜗𝜗𝑟𝑟 + 𝜇𝜇𝑘𝑘 +𝜀𝜀𝑖𝑖𝑖𝑖𝑟𝑟 (1)
In the above model, 𝑌𝑌𝑖𝑖𝑖𝑖𝑟𝑟 denotes firm-level measures of innovation outcomes for firm i at time t in area r. 𝐼𝐼𝑖𝑖𝑖𝑖𝑟𝑟−𝑛𝑛 is a vector of firm-specific R&D activities lagged at time t-n, while 𝑋𝑋𝑖𝑖𝑖𝑖𝑟𝑟−𝑛𝑛 is a vector of lagged firm-level characteristics including employment size, age, sector and involvement in exporting activities or foreign-ownership. In addition, 𝑃𝑃𝑖𝑖𝑖𝑖𝑟𝑟−𝑛𝑛, a vector of lagged firm-level publicly funded innovation inputs is included; 𝑈𝑈𝑖𝑖𝑟𝑟−𝑛𝑛 is a vector of lagged regional specific innovation inputs, such as external knowledge sources and knowledge spillovers from neighbouring firms and other organizations. The model also includes 𝑂𝑂𝑖𝑖𝑟𝑟−𝑛𝑛 a vector of other time-varying lagged regional characteristics such as population, employment density, average firm size diversity, educational attainment, and regional growth measured as GDP growth.
The estimation also includes area fixed effects denoted by 𝛾𝛾𝑖𝑖, firm fixed effects denoted by 𝛿𝛿𝑖𝑖, time (year) fixed effects denoted by 𝜗𝜗𝑟𝑟, industry fixed effects denoted by 𝜇𝜇𝑘𝑘 for each industry k, while 𝜀𝜀𝑖𝑖𝑖𝑖𝑟𝑟 denotes the error term. Area fixed effects control for average time-invariant unobservable differences across areas. Year fixed effects reduce the likelihood of omitted variable bias caused by excluding unobserved variables that evolve over time but are constant across firms. Firm fixed effects allow us to control for any time-invariant unobservable factors within firms, while industry fixed effects control for any time-invariant unobservable factors within industries. In addition, region-specific and industry-specific time trends are included. These fixed effects reduce the likelihood of the estimates being biased as a result of omitting variables that affect the outcomes of interest but are not controlled for.
A2.1.2 Definitions of variables Data on innovation outcomes, the dependent variables (𝑌𝑌𝑖𝑖𝑖𝑖𝑟𝑟), come primarily from the CIS or PATSTAT and include:
• New-to-market Innovation: percentage of a business's total turnover from new goods or services new to the market;

• New-to-business Innovation: percentage of a business’s total turnover from new goods or services new to the business;
• Product Innovation: dummy for new or significantly improved goods or services;
• Process Innovation: dummy for new or significantly improved production processes;
• Patents: number of patents granted to the Intellectual Property Office.
Data on firm-specific R&D inputs (𝐼𝐼𝑖𝑖𝑖𝑖𝑟𝑟−𝑛𝑛) from the CIS or BERD includes:
• share of employees with science/engineering degrees;
• share of employees in R&D activities;
• total, internal and external R&D expenditure;
• Internal resources dedicated to Science and Engineering research, R&D Training, R&D Design and R&D Equipment; Organisational innovation (i.e. changes in corporate strategy or business practices).
Information on publicly funded innovation inputs (𝑃𝑃𝑖𝑖𝑖𝑖𝑟𝑟−𝑛𝑛) are derived from the GtR and EU CORDIS databases, reporting the number and value of funded projects for each firm.
A2.1.3 Estimation of knowledge spillovers In addition, knowledge spillovers (𝑈𝑈𝑖𝑖𝑟𝑟−𝑛𝑛) are modelled propagating across regions and industries. Due to the public good characteristics of knowledge, private returns to R&D tend to be lower than public or social returns (Bloom et al., 2013). The presence of these so-called ‘positive externalities’ or ‘knowledge spillovers’ are also the key reason that justifies the use of public funds to support private innovation efforts. Hence, evidence on the presence of R&D spillovers is crucial for any policy initiative seeking to maximise the social returns to R&D when using public money to do so.
Knowledge spillovers may materialise in a number of ways, but usually depend on spatial and technological proximity as well as the ‘absorptive capacity’ of firms (Bloom et al., 2013; Lychagin et al., 2016). A term capturing the R&D performed by other firms is then included. In other words, this term captures the ‘potential’ of knowledge transfers across firms. It is important to highlight that it is not possible to actually observe the R&D or knowledge spillover. Rather, the existence of spillovers is inferred from the significance of the spillover term in the regression, after ‘controlling for everything else’. This is a common approach in the literature on innovation and knowledge spillovers. The measure of R&D performed by ‘neighbouring’ firms (total R&D expenditure) is weighted by spatial distance (i.e. all

R&D within 250 km) and technological distance (i.e. intensity of input-output linkages).
First, spatial distance is based on calculating the Euclidian distance between the centroid (i.e. geographic centre) of a region and all other regions within a distance of 250 km (approximately 155 miles).26 In order to give more weight to regions that are closer to each other, spatial ‘proximity’ (as opposed to distance) is computed as 1 divided by kilometre distance. For example, the value of ‘proximity’ for two regions with a distance of 130 km between their centroids is 1/130 = 0.0077, while a distance of 20 km gives us a proximity value of 1/20 = 0.05. Since the latter is around 6.5 time higher than the former it is easy to see that there is a linear relation between distance and proximity (130 divided by 20 also yields a value of 6.5).
Secondly, technological proximity captures whether the R&D of a proximate firm is relevant at all. For example, it is unlikely that much of the R&D undertaken by pharmaceutical companies is relevant for firms in the automotive sector. This is reflected in the fact that there is close to zero input-output linkages between both sectors. However, R&D by firms in the chemical sector could potentially be relevant for both, and the data shows that there are input-output linkages between chemicals and pharmaceuticals and chemicals and automotive. A measure of how ‘technologically related’ two firms are is needed. For this reason, information on input-output relations at the 2-digit sector level are used. This is a better measure than ‘simply’ relying on firms within the same 2-digit sector, as it also accounts for relations between sectors, while disregarding sectors that are not related at all.
In order to compute ‘technological proximity’ the 2015 input-output tables from the Office for National Statistics are used,27 undertaking the following transformations:
• For some sectors information is available at the 3-digit level and for others only at the 2-digit level. Everything is aggregated up to the 2-digit level to have a consistent level of analysis.
• Sectors buy from other sectors (backward linkages) and supply to other sectors (forward linkages). In some instances, the value of type of linkage is much larger than the other so relying on either type alone will underestimate the strength of the relation between two sectors. For this analysis, whichever is larger is used.
26 This can also be thought of as drawing ‘circles’ with increasing radii around the centroid of a region, and then count the number of other centroids that fit within the same circle. For example, when drawing a circle of 100km around the centroid of London 8 centroids of other LEPs in England are captured, with the closest being Hertfordshire (37km) and the South East (49km) and the furthest being Oxfordshire (89km). This is repeated for each of the 44 regions in the sample and with circles up to a distance of 250km. 27 Available at: https://www.ons.gov.uk/economy/nationalaccounts/supplyandusetables/datasets/ukinputoutputanalyticaltablesdetailed
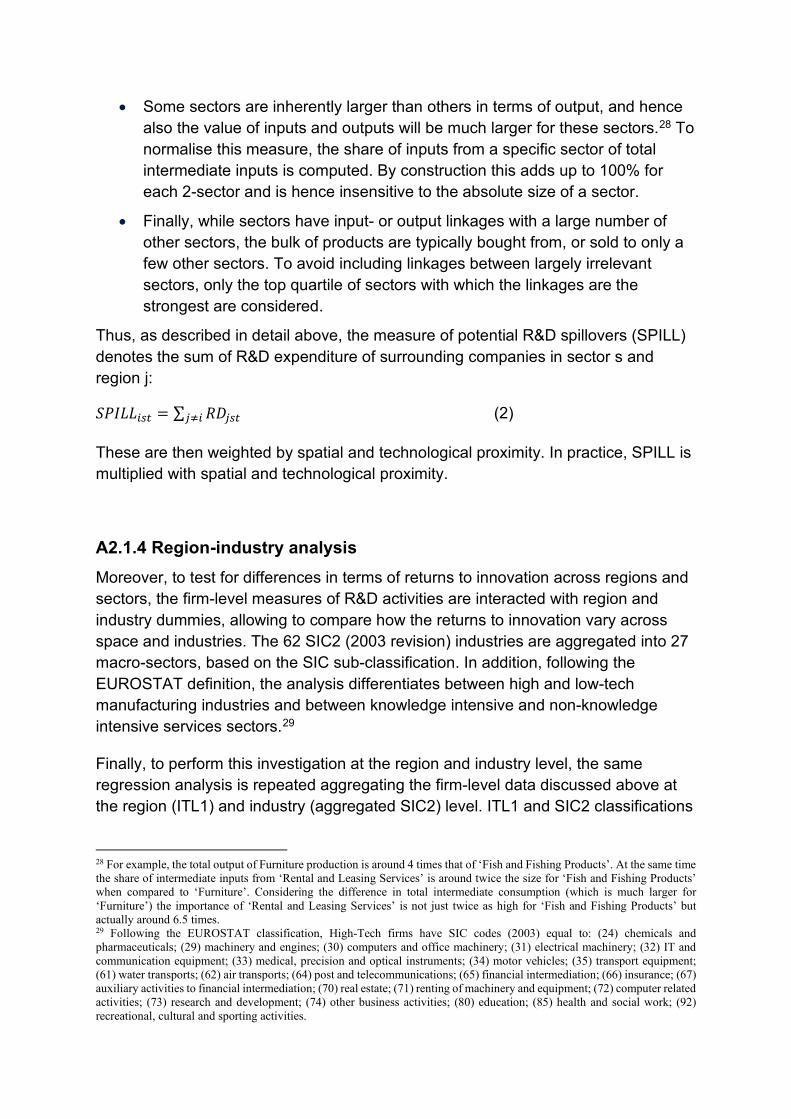
• Some sectors are inherently larger than others in terms of output, and hence also the value of inputs and outputs will be much larger for these sectors.28 To normalise this measure, the share of inputs from a specific sector of total intermediate inputs is computed. By construction this adds up to 100% for each 2-sector and is hence insensitive to the absolute size of a sector.
• Finally, while sectors have input- or output linkages with a large number of other sectors, the bulk of products are typically bought from, or sold to only a few other sectors. To avoid including linkages between largely irrelevant sectors, only the top quartile of sectors with which the linkages are the strongest are considered.
Thus, as described in detail above, the measure of potential R&D spillovers (SPILL) denotes the sum of R&D expenditure of surrounding companies in sector s and region j:
𝑈𝑈𝑃𝑃𝐼𝐼𝑆𝑆𝑆𝑆𝑖𝑖𝑖𝑖𝑟𝑟 = ∑ 𝑈𝑈𝑅𝑅𝑗𝑗𝑖𝑖𝑟𝑟𝑗𝑗≠𝑖𝑖 (2)
These are then weighted by spatial and technological proximity. In practice, SPILL is multiplied with spatial and technological proximity.
A2.1.4 Region-industry analysis Moreover, to test for differences in terms of returns to innovation across regions and sectors, the firm-level measures of R&D activities are interacted with region and industry dummies, allowing to compare how the returns to innovation vary across space and industries. The 62 SIC2 (2003 revision) industries are aggregated into 27 macro-sectors, based on the SIC sub-classification. In addition, following the EUROSTAT definition, the analysis differentiates between high and low-tech manufacturing industries and between knowledge intensive and non-knowledge intensive services sectors.29
Finally, to perform this investigation at the region and industry level, the same regression analysis is repeated aggregating the firm-level data discussed above at the region (ITL1) and industry (aggregated SIC2) level. ITL1 and SIC2 classifications
28 For example, the total output of Furniture production is around 4 times that of ‘Fish and Fishing Products’. At the same time the share of intermediate inputs from ‘Rental and Leasing Services’ is around twice the size for ‘Fish and Fishing Products’ when compared to ‘Furniture’. Considering the difference in total intermediate consumption (which is much larger for ‘Furniture’) the importance of ‘Rental and Leasing Services’ is not just twice as high for ‘Fish and Fishing Products’ but actually around 6.5 times. 29 Following the EUROSTAT classification, High-Tech firms have SIC codes (2003) equal to: (24) chemicals and pharmaceuticals; (29) machinery and engines; (30) computers and office machinery; (31) electrical machinery; (32) IT and communication equipment; (33) medical, precision and optical instruments; (34) motor vehicles; (35) transport equipment; (61) water transports; (62) air transports; (64) post and telecommunications; (65) financial intermediation; (66) insurance; (67) auxiliary activities to financial intermediation; (70) real estate; (71) renting of machinery and equipment; (72) computer related activities; (73) research and development; (74) other business activities; (80) education; (85) health and social work; (92) recreational, cultural and sporting activities.

are mainly considered because of data coverage limitations of some of the surveys. Especially in the case of the UKIS and of the BERD datasets, the number of firms per region and industry would be too small at a finer level of aggregation in order to be sufficiently representative of the region-industry structure. To aggregate firm-level data at the region and industry level, statistical weights provided by the ONS have been used in order to assure the representability of the data gathered from survey datasets. In the case of population datasets, instead the data have been aggregated through simple means or sums.
A2.1.5 Robustness tests In order to test the robustness of the results different approaches are followed. First, an instrumental variable approach is implemented to tackle the potential problem of endogeneity of R&D investment to innovation output. This instrument is based on the shift-share methodology, calculated for each region-industry as the initial share over the total investment in R&D in the country before the beginning of the period of analysis in 2005 (the “share”), multiplied by the increase between 2005 and each year in the period of analysis of the investment in R&D in the rest of the country, except for the region-industry of interest (the “shift”) (Baum-Snow and Ferreira, 2015; Goldsmith-Pinkham et al. 2018).
Secondly, an alternative approach is followed to check the robustness of these results, by employing the generalized method of moments (GMM), where the possible endogenous variables are instrumented with their two-period lagged values and the lagged values of public funding to R&D. In this case, lagged variables are considered as predetermined and therefore not correlated with the error term but expected to influence innovation outputs. To evaluate the overall goodness of fit of the GMM models the Hansen test of overidentifying restrictions is reported, which presents an evaluation of exogeneity of the subset of instruments, and test for the presence of first and second order serial autocorrelation, which would be inconsistent with predetermined variable regressions.
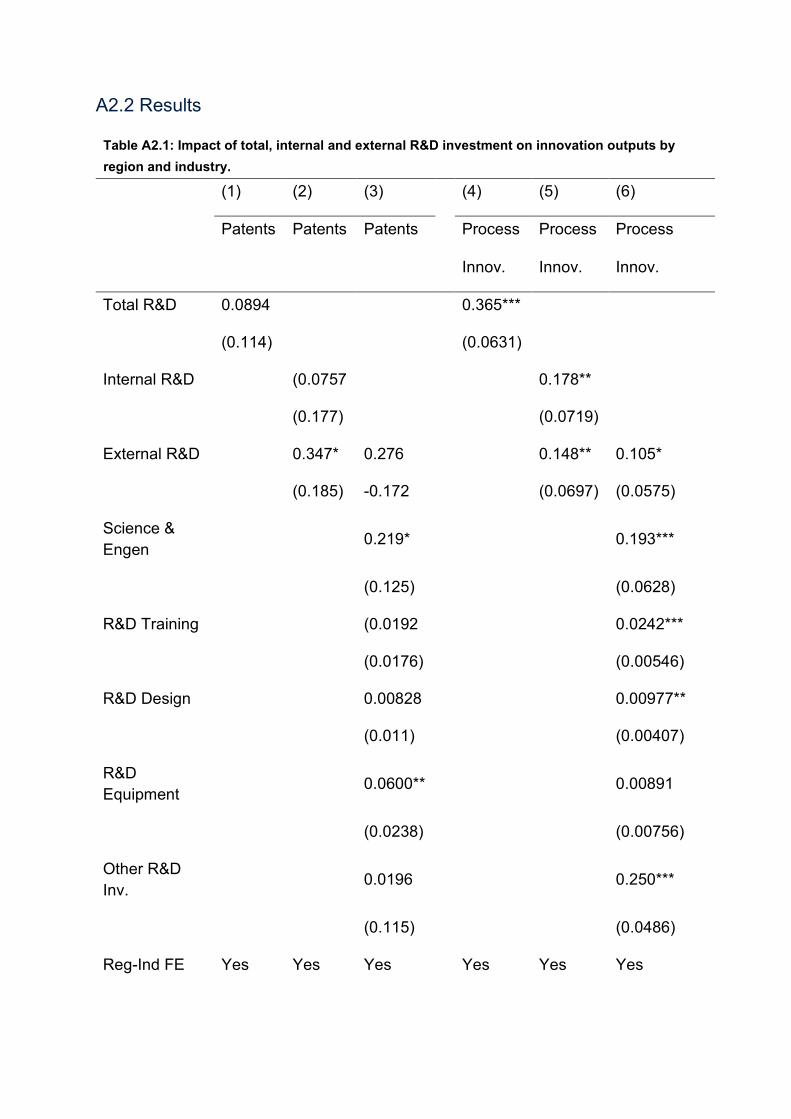
A2.2 Results
Table A2.1: Impact of total, internal and external R&D investment on innovation outputs by region and industry.
(1) (2) (3) (4) (5) (6)
Patents Patents Patents
Process Process Process
Innov. Innov. Innov.
Total R&D 0.0894 0.365***
(0.114) (0.0631)
Internal R&D (0.0757
0.178**
(0.177)
(0.0719)
External R&D 0.347* 0.276 0.148** 0.105*
(0.185) -0.172 (0.0697) (0.0575)
Science & Engen 0.219* 0.193***
(0.125) (0.0628)
R&D Training (0.0192 0.0242***
(0.0176) (0.00546)
R&D Design 0.00828 0.00977**
(0.011) (0.00407)
R&D Equipment 0.0600** 0.00891
(0.0238) (0.00756)
Other R&D Inv. 0.0196 0.250***
(0.115) (0.0486)
Reg-Ind FE Yes Yes Yes Yes Yes Yes
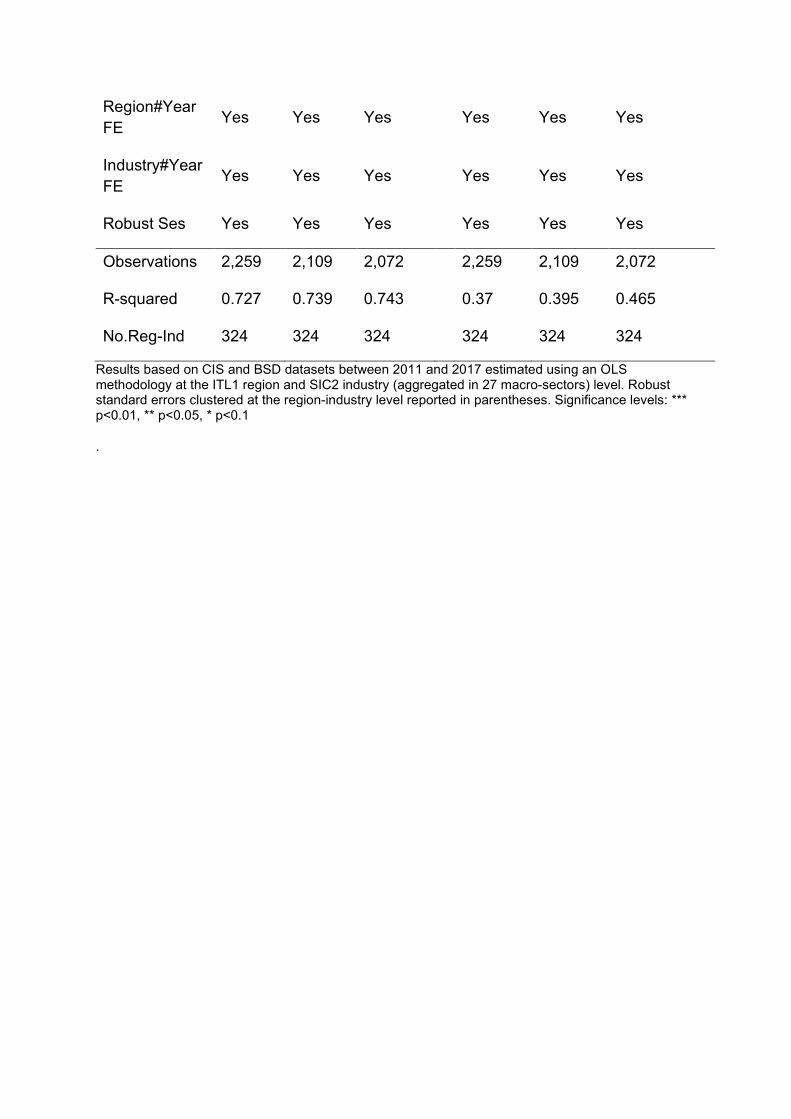
Region#Year FE Yes Yes Yes Yes Yes Yes
Industry#Year FE Yes Yes Yes Yes Yes Yes
Robust Ses Yes Yes Yes Yes Yes Yes
Observations 2,259 2,109 2,072 2,259 2,109 2,072
R-squared 0.727 0.739 0.743 0.37 0.395 0.465
No.Reg-Ind 324 324 324 324 324 324
Results based on CIS and BSD datasets between 2011 and 2017 estimated using an OLS methodology at the ITL1 region and SIC2 industry (aggregated in 27 macro-sectors) level. Robust standard errors clustered at the region-industry level reported in parentheses. Significance levels: *** p<0.01, ** p<0.05, * p<0.1
.
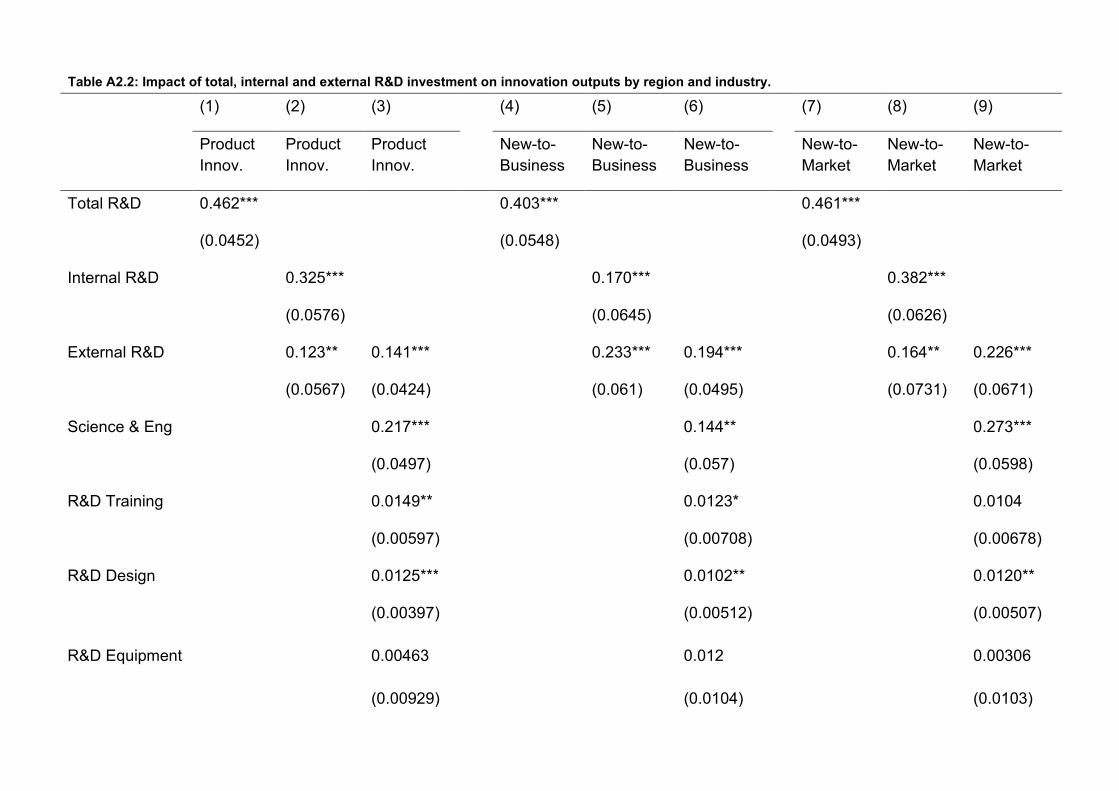
Table A2.2: Impact of total, internal and external R&D investment on innovation outputs by region and industry.
(1) (2) (3) (4) (5) (6) (7) (8) (9)
Product Innov.
Product Innov.
Product Innov. New-to-
Business New-to-Business
New-to-Business
New-to-Market
New-to-Market
New-to-Market
Total R&D 0.462*** 0.403*** 0.461***
(0.0452) (0.0548) (0.0493)
Internal R&D 0.325*** 0.170*** 0.382***
(0.0576) (0.0645) (0.0626)
External R&D 0.123** 0.141*** 0.233*** 0.194*** 0.164** 0.226***
(0.0567) (0.0424) (0.061) (0.0495) (0.0731) (0.0671)
Science & Eng 0.217*** 0.144** 0.273***
(0.0497) (0.057) (0.0598)
R&D Training 0.0149** 0.0123* 0.0104
(0.00597) (0.00708) (0.00678)
R&D Design 0.0125*** 0.0102** 0.0120**
(0.00397) (0.00512) (0.00507)
R&D Equipment 0.00463 0.012 0.00306
(0.00929) (0.0104) (0.0103)
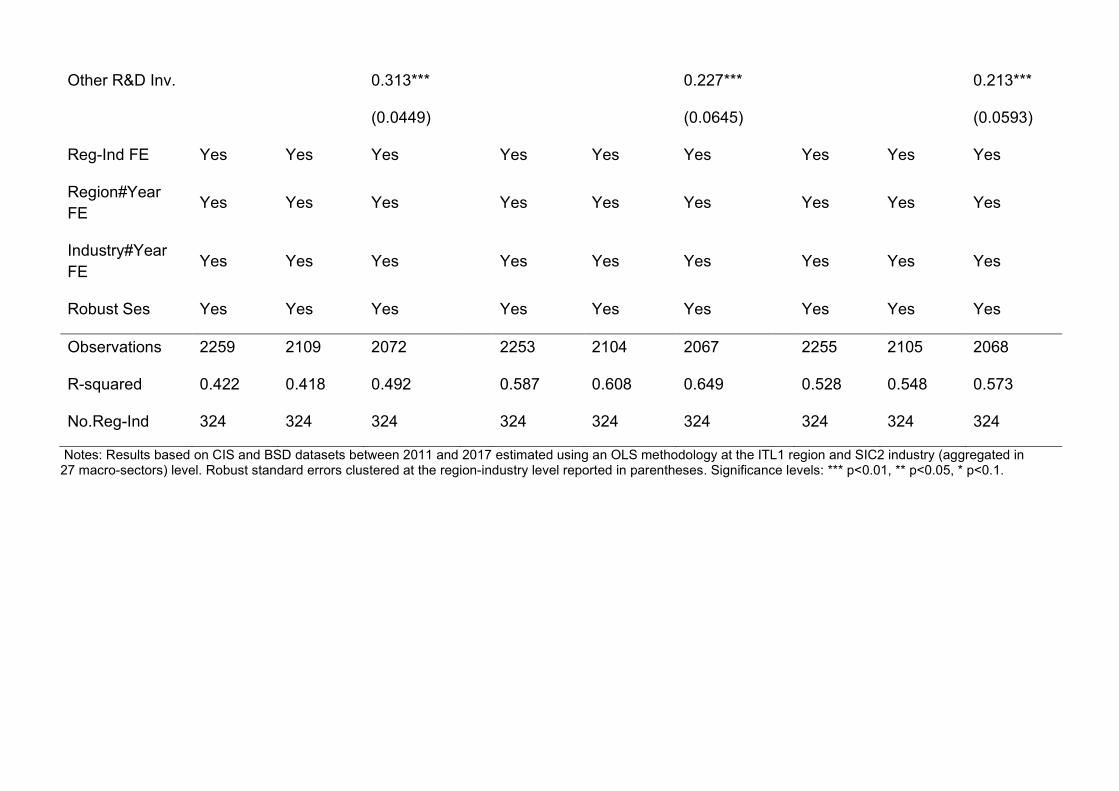
Other R&D Inv. 0.313*** 0.227*** 0.213***
(0.0449) (0.0645) (0.0593)
Reg-Ind FE Yes Yes Yes Yes Yes Yes Yes Yes Yes
Region#Year FE Yes Yes Yes Yes Yes Yes Yes Yes Yes
Industry#Year FE Yes Yes Yes Yes Yes Yes Yes Yes Yes
Robust Ses Yes Yes Yes Yes Yes Yes Yes Yes Yes
Observations 2259 2109 2072 2253 2104 2067 2255 2105 2068
R-squared 0.422 0.418 0.492 0.587 0.608 0.649 0.528 0.548 0.573
No.Reg-Ind 324 324 324 324 324 324 324 324 324
Notes: Results based on CIS and BSD datasets between 2011 and 2017 estimated using an OLS methodology at the ITL1 region and SIC2 industry (aggregated in 27 macro-sectors) level. Robust standard errors clustered at the region-industry level reported in parentheses. Significance levels: *** p<0.01, ** p<0.05, * p<0.1.
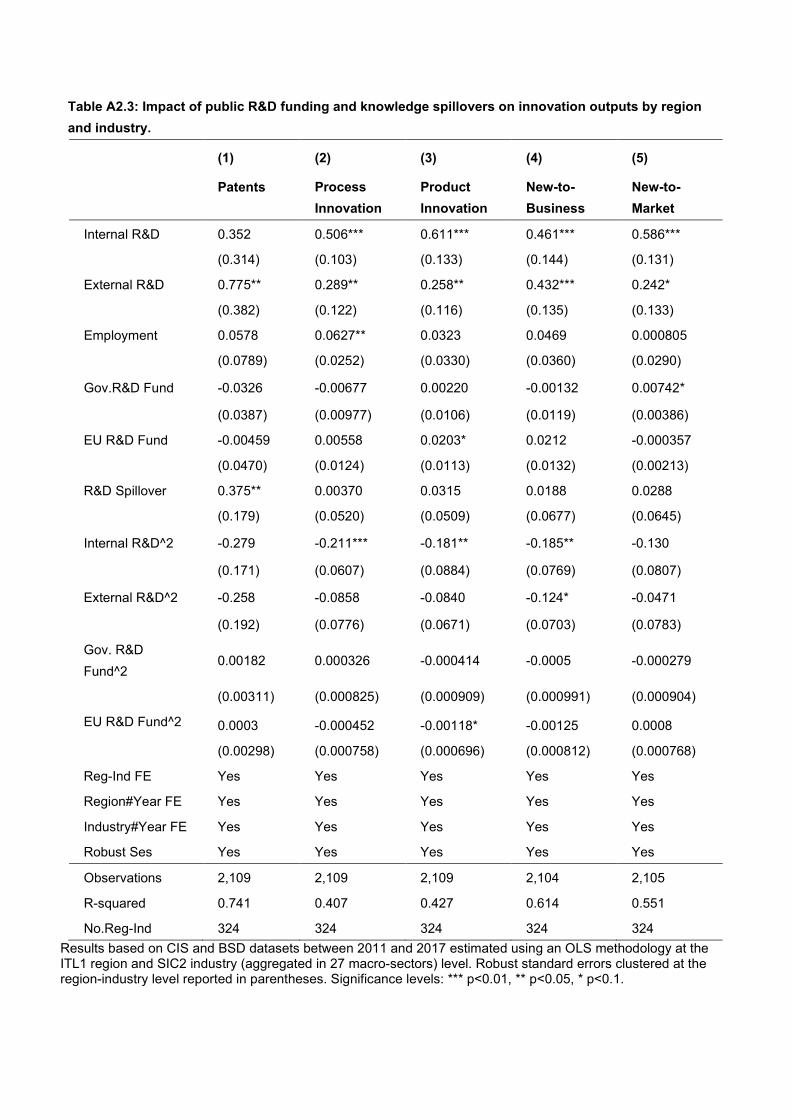
Table A2.3: Impact of public R&D funding and knowledge spillovers on innovation outputs by region and industry.
(1) (2) (3) (4) (5)
Patents Process Innovation
Product Innovation
New-to-Business
New-to-Market
Internal R&D 0.352 0.506*** 0.611*** 0.461*** 0.586***
(0.314) (0.103) (0.133) (0.144) (0.131)
External R&D 0.775** 0.289** 0.258** 0.432*** 0.242*
(0.382) (0.122) (0.116) (0.135) (0.133)
Employment 0.0578 0.0627** 0.0323 0.0469 0.000805
(0.0789) (0.0252) (0.0330) (0.0360) (0.0290)
Gov.R&D Fund -0.0326 -0.00677 0.00220 -0.00132 0.00742*
(0.0387) (0.00977) (0.0106) (0.0119) (0.00386)
EU R&D Fund -0.00459 0.00558 0.0203* 0.0212 -0.000357
(0.0470) (0.0124) (0.0113) (0.0132) (0.00213)
R&D Spillover 0.375** 0.00370 0.0315 0.0188 0.0288
(0.179) (0.0520) (0.0509) (0.0677) (0.0645)
Internal R&D^2 -0.279 -0.211*** -0.181** -0.185** -0.130
(0.171) (0.0607) (0.0884) (0.0769) (0.0807)
External R&D^2 -0.258 -0.0858 -0.0840 -0.124* -0.0471
(0.192) (0.0776) (0.0671) (0.0703) (0.0783)
Gov. R&D Fund^2
0.00182 0.000326 -0.000414 -0.0005 -0.000279
(0.00311) (0.000825) (0.000909) (0.000991) (0.000904)
EU R&D Fund^2 0.0003 -0.000452 -0.00118* -0.00125 0.0008
(0.00298) (0.000758) (0.000696) (0.000812) (0.000768)
Reg-Ind FE Yes Yes Yes Yes Yes
Region#Year FE Yes Yes Yes Yes Yes
Industry#Year FE Yes Yes Yes Yes Yes
Robust Ses Yes Yes Yes Yes Yes
Observations 2,109 2,109 2,109 2,104 2,105
R-squared 0.741 0.407 0.427 0.614 0.551
No.Reg-Ind 324 324 324 324 324 Results based on CIS and BSD datasets between 2011 and 2017 estimated using an OLS methodology at the ITL1 region and SIC2 industry (aggregated in 27 macro-sectors) level. Robust standard errors clustered at the region-industry level reported in parentheses. Significance levels: *** p<0.01, ** p<0.05, * p<0.1.
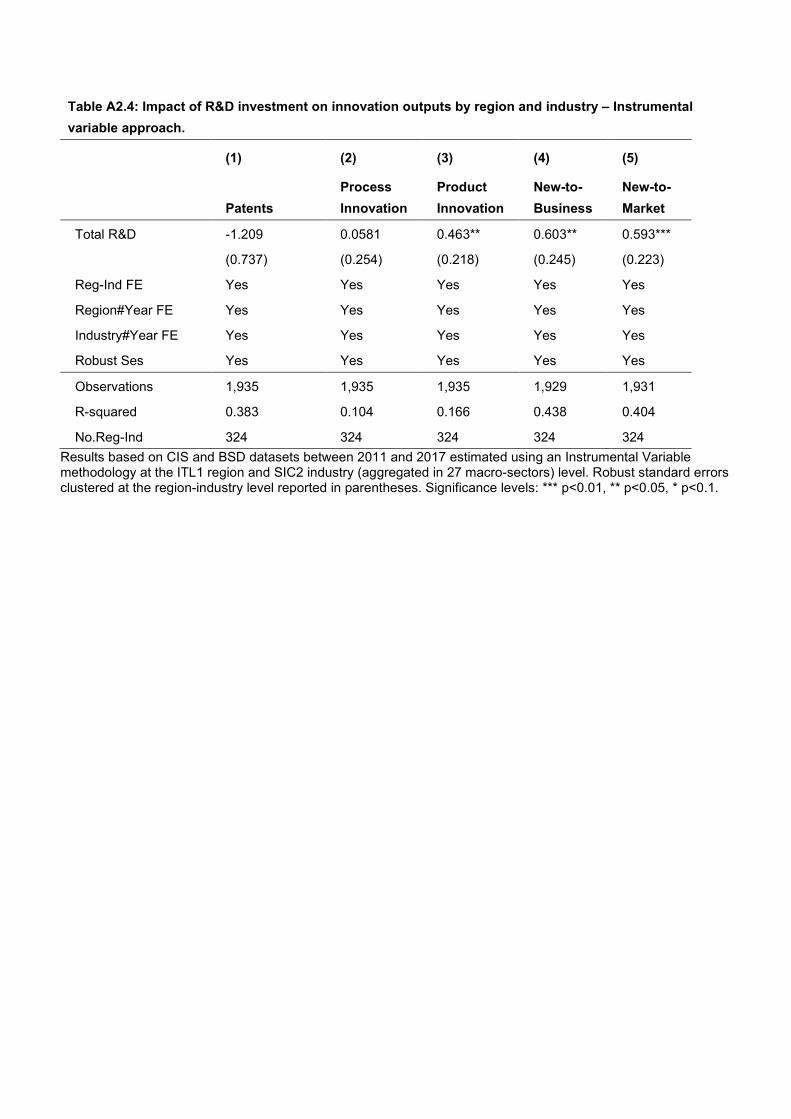
Table A2.4: Impact of R&D investment on innovation outputs by region and industry – Instrumental variable approach.
(1) (2) (3) (4) (5)
Patents Process Innovation
Product Innovation
New-to-Business
New-to-Market
Total R&D -1.209 0.0581 0.463** 0.603** 0.593***
(0.737) (0.254) (0.218) (0.245) (0.223)
Reg-Ind FE Yes Yes Yes Yes Yes
Region#Year FE Yes Yes Yes Yes Yes
Industry#Year FE Yes Yes Yes Yes Yes
Robust Ses Yes Yes Yes Yes Yes
Observations 1,935 1,935 1,935 1,929 1,931
R-squared 0.383 0.104 0.166 0.438 0.404
No.Reg-Ind 324 324 324 324 324 Results based on CIS and BSD datasets between 2011 and 2017 estimated using an Instrumental Variable methodology at the ITL1 region and SIC2 industry (aggregated in 27 macro-sectors) level. Robust standard errors clustered at the region-industry level reported in parentheses. Significance levels: *** p<0.01, ** p<0.05, * p<0.1.
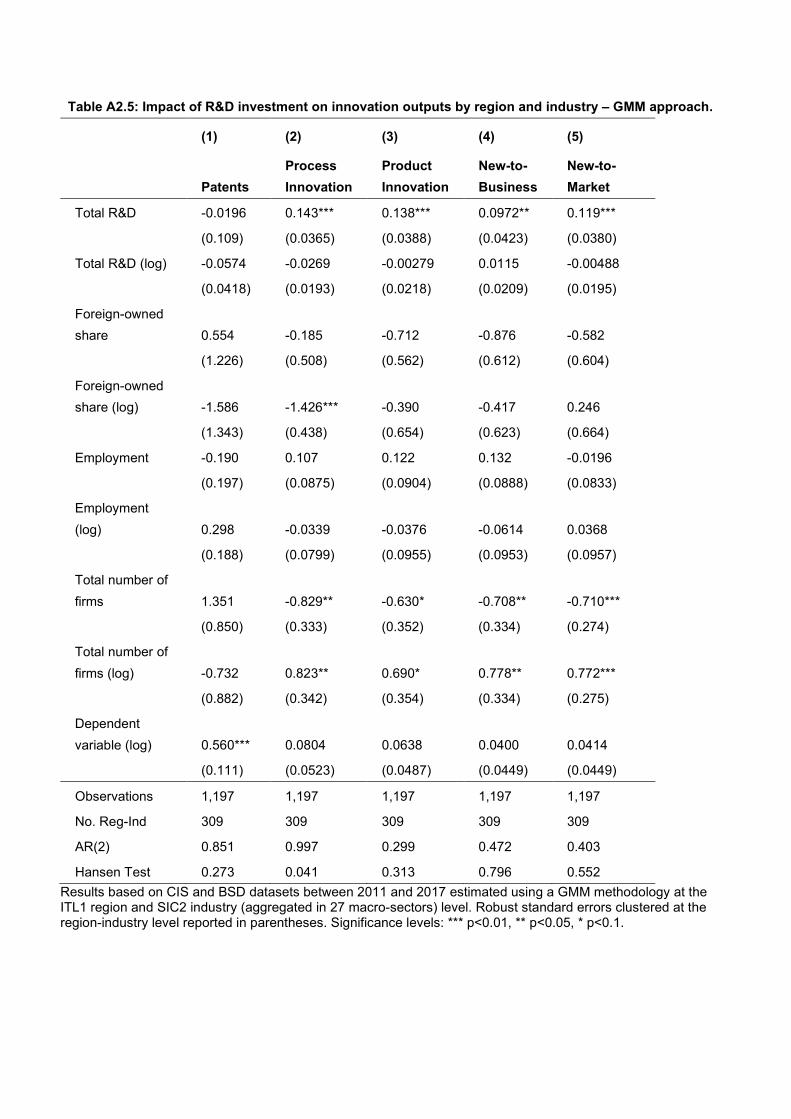
Table A2.5: Impact of R&D investment on innovation outputs by region and industry – GMM approach.
(1) (2) (3) (4) (5)
Patents Process Innovation
Product Innovation
New-to-Business
New-to-Market
Total R&D -0.0196 0.143*** 0.138*** 0.0972** 0.119***
(0.109) (0.0365) (0.0388) (0.0423) (0.0380)
Total R&D (log) -0.0574 -0.0269 -0.00279 0.0115 -0.00488
(0.0418) (0.0193) (0.0218) (0.0209) (0.0195)
Foreign-owned share 0.554 -0.185 -0.712 -0.876 -0.582
(1.226) (0.508) (0.562) (0.612) (0.604)
Foreign-owned share (log) -1.586 -1.426*** -0.390 -0.417 0.246
(1.343) (0.438) (0.654) (0.623) (0.664)
Employment -0.190 0.107 0.122 0.132 -0.0196
(0.197) (0.0875) (0.0904) (0.0888) (0.0833)
Employment (log) 0.298 -0.0339 -0.0376 -0.0614 0.0368
(0.188) (0.0799) (0.0955) (0.0953) (0.0957)
Total number of firms 1.351 -0.829** -0.630* -0.708** -0.710***
(0.850) (0.333) (0.352) (0.334) (0.274)
Total number of firms (log) -0.732 0.823** 0.690* 0.778** 0.772***
(0.882) (0.342) (0.354) (0.334) (0.275)
Dependent variable (log) 0.560*** 0.0804 0.0638 0.0400 0.0414
(0.111) (0.0523) (0.0487) (0.0449) (0.0449)
Observations 1,197 1,197 1,197 1,197 1,197
No. Reg-Ind 309 309 309 309 309
AR(2) 0.851 0.997 0.299 0.472 0.403
Hansen Test 0.273 0.041 0.313 0.796 0.552 Results based on CIS and BSD datasets between 2011 and 2017 estimated using a GMM methodology at the ITL1 region and SIC2 industry (aggregated in 27 macro-sectors) level. Robust standard errors clustered at the region-industry level reported in parentheses. Significance levels: *** p<0.01, ** p<0.05, * p<0.1.
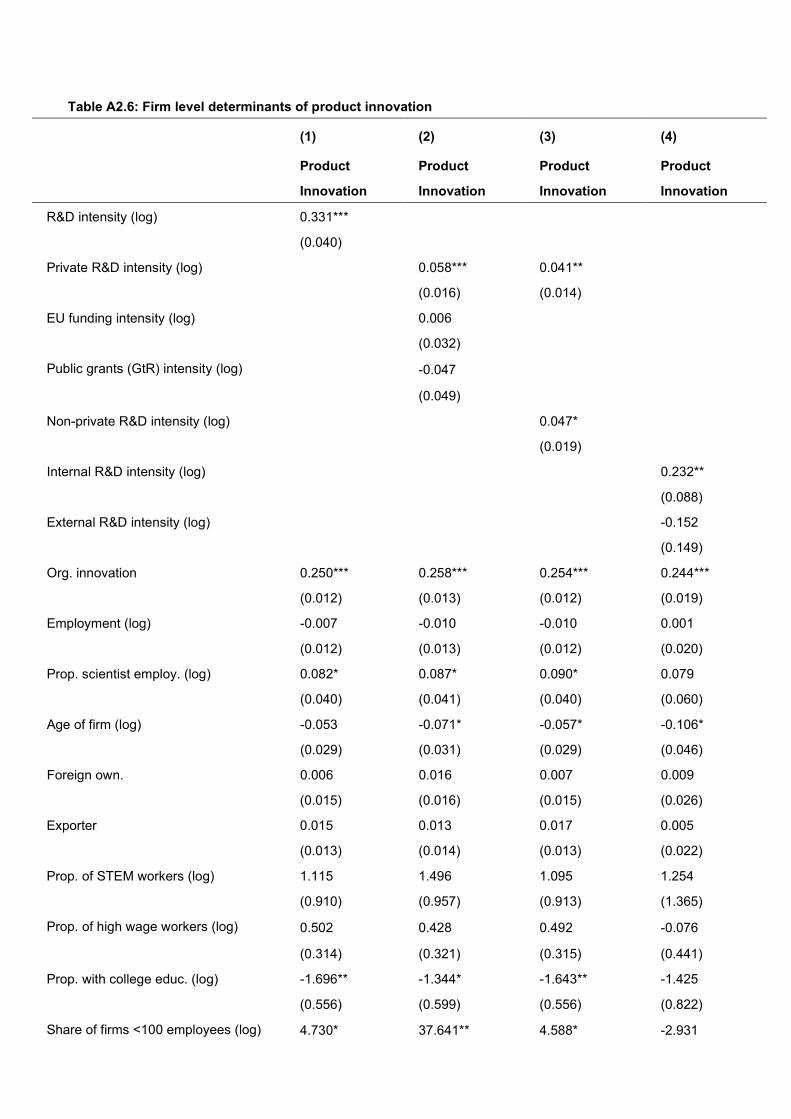
Table A2.6: Firm level determinants of product innovation
(1) (2) (3) (4)
Product
Innovation
Product
Innovation
Product
Innovation
Product
Innovation
R&D intensity (log) 0.331***
(0.040)
Private R&D intensity (log) 0.058*** 0.041**
(0.016) (0.014)
EU funding intensity (log) 0.006
(0.032)
Public grants (GtR) intensity (log) -0.047
(0.049)
Non-private R&D intensity (log) 0.047*
(0.019)
Internal R&D intensity (log) 0.232**
(0.088)
External R&D intensity (log) -0.152
(0.149)
Org. innovation 0.250*** 0.258*** 0.254*** 0.244***
(0.012) (0.013) (0.012) (0.019)
Employment (log) -0.007 -0.010 -0.010 0.001
(0.012) (0.013) (0.012) (0.020)
Prop. scientist employ. (log) 0.082* 0.087* 0.090* 0.079
(0.040) (0.041) (0.040) (0.060)
Age of firm (log) -0.053 -0.071* -0.057* -0.106*
(0.029) (0.031) (0.029) (0.046)
Foreign own. 0.006 0.016 0.007 0.009
(0.015) (0.016) (0.015) (0.026)
Exporter 0.015 0.013 0.017 0.005
(0.013) (0.014) (0.013) (0.022)
Prop. of STEM workers (log) 1.115 1.496 1.095 1.254
(0.910) (0.957) (0.913) (1.365)
Prop. of high wage workers (log) 0.502 0.428 0.492 -0.076
(0.314) (0.321) (0.315) (0.441)
Prop. with college educ. (log) -1.696** -1.344* -1.643** -1.425
(0.556) (0.599) (0.556) (0.822)
Share of firms <100 employees (log) 4.730* 37.641** 4.588* -2.931

(1.978) (13.265) (1.973) (4.794)
Year FE Yes Yes Yes Yes
Ind FE Yes Yes Yes Yes
Reg FE Yes Yes Yes Yes
Ind-Year FE Yes Yes Yes Yes
Reg-Year FE Yes Yes Yes Yes
Observations 43335 39932 43335 25957
No. of Firms 29299 27517 29299 20954
Adj. R-squared 0.059 0.055 0.056 0.093 Robust standard errors clustered at the firm level reported in parentheses. * p < 0.05, ** p < 0.01, *** p < 0.001
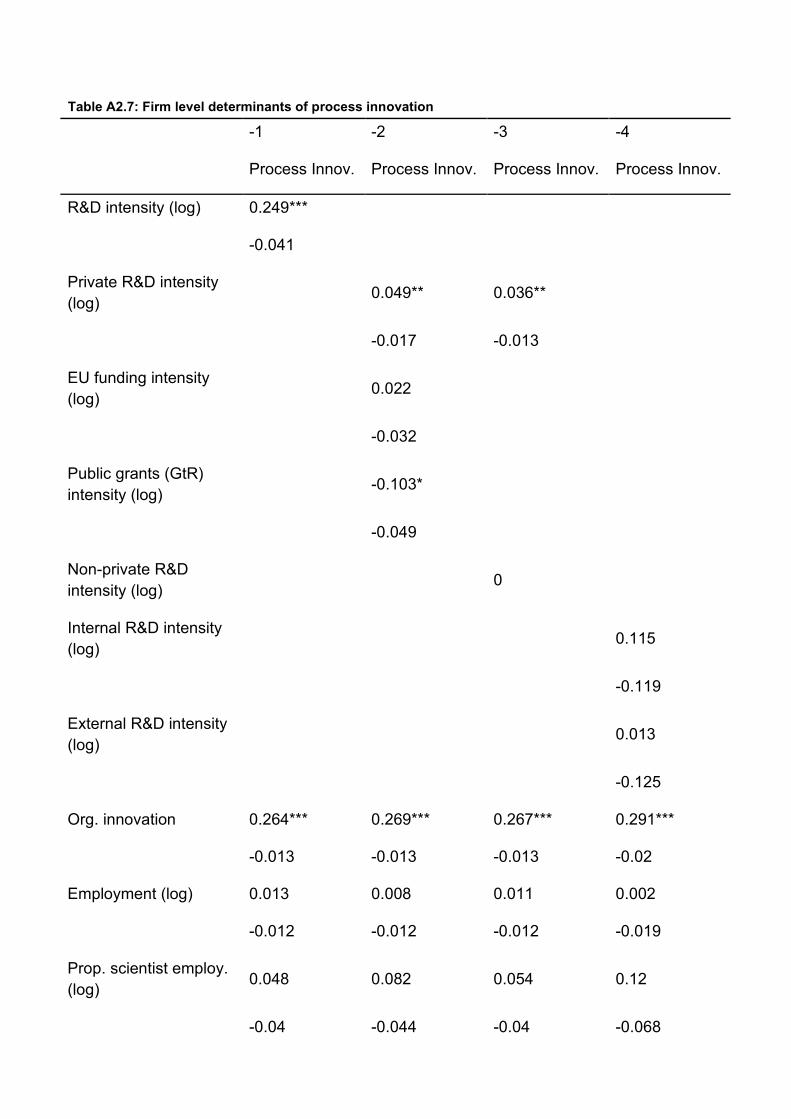
Table A2.7: Firm level determinants of process innovation
-1 -2 -3 -4
Process Innov. Process Innov. Process Innov. Process Innov.
R&D intensity (log) 0.249***
-0.041
Private R&D intensity (log) 0.049** 0.036**
-0.017 -0.013
EU funding intensity (log) 0.022
-0.032
Public grants (GtR) intensity (log) -0.103*
-0.049
Non-private R&D intensity (log) 0
Internal R&D intensity (log) 0.115
-0.119
External R&D intensity (log) 0.013
-0.125
Org. innovation 0.264*** 0.269*** 0.267*** 0.291***
-0.013 -0.013 -0.013 -0.02
Employment (log) 0.013 0.008 0.011 0.002
-0.012 -0.012 -0.012 -0.019
Prop. scientist employ. (log) 0.048 0.082 0.054 0.12
-0.04 -0.044 -0.04 -0.068
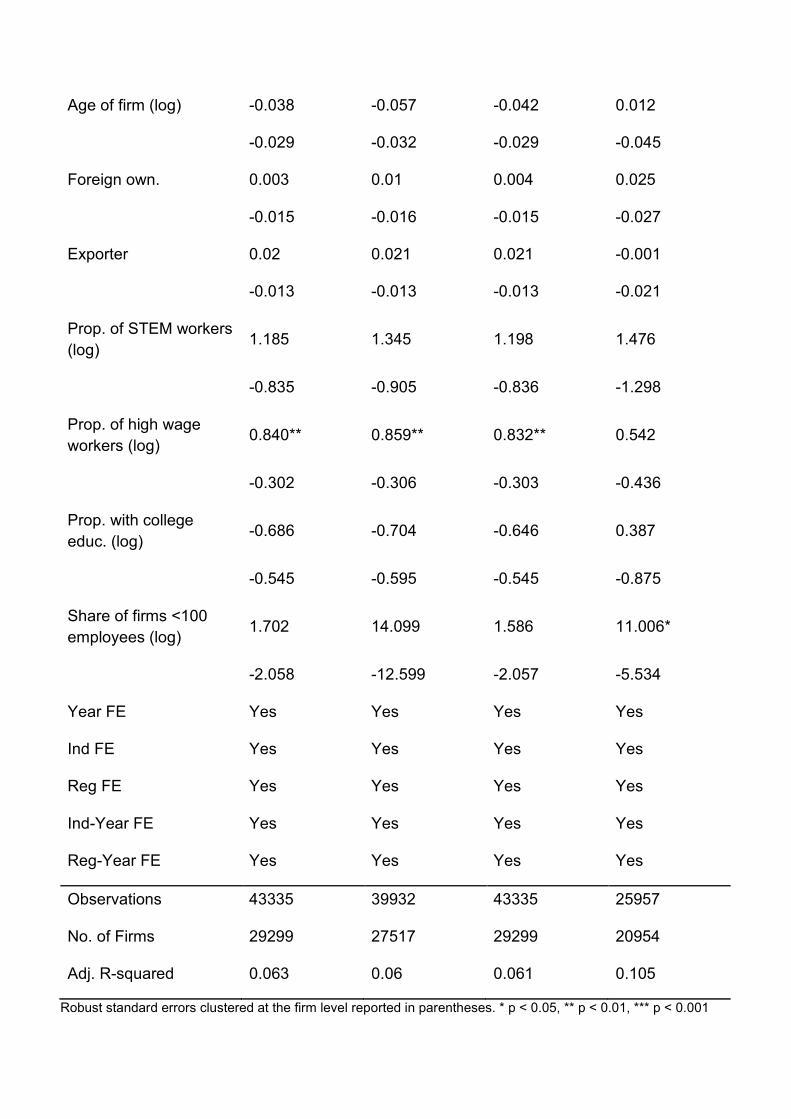
Age of firm (log) -0.038 -0.057 -0.042 0.012
-0.029 -0.032 -0.029 -0.045
Foreign own. 0.003 0.01 0.004 0.025
-0.015 -0.016 -0.015 -0.027
Exporter 0.02 0.021 0.021 -0.001
-0.013 -0.013 -0.013 -0.021
Prop. of STEM workers (log) 1.185 1.345 1.198 1.476
-0.835 -0.905 -0.836 -1.298
Prop. of high wage workers (log) 0.840** 0.859** 0.832** 0.542
-0.302 -0.306 -0.303 -0.436
Prop. with college educ. (log) -0.686 -0.704 -0.646 0.387
-0.545 -0.595 -0.545 -0.875
Share of firms <100 employees (log) 1.702 14.099 1.586 11.006*
-2.058 -12.599 -2.057 -5.534
Year FE Yes Yes Yes Yes
Ind FE Yes Yes Yes Yes
Reg FE Yes Yes Yes Yes
Ind-Year FE Yes Yes Yes Yes
Reg-Year FE Yes Yes Yes Yes
Observations 43335 39932 43335 25957
No. of Firms 29299 27517 29299 20954
Adj. R-squared 0.063 0.06 0.061 0.105
Robust standard errors clustered at the firm level reported in parentheses. * p < 0.05, ** p < 0.01, *** p < 0.001
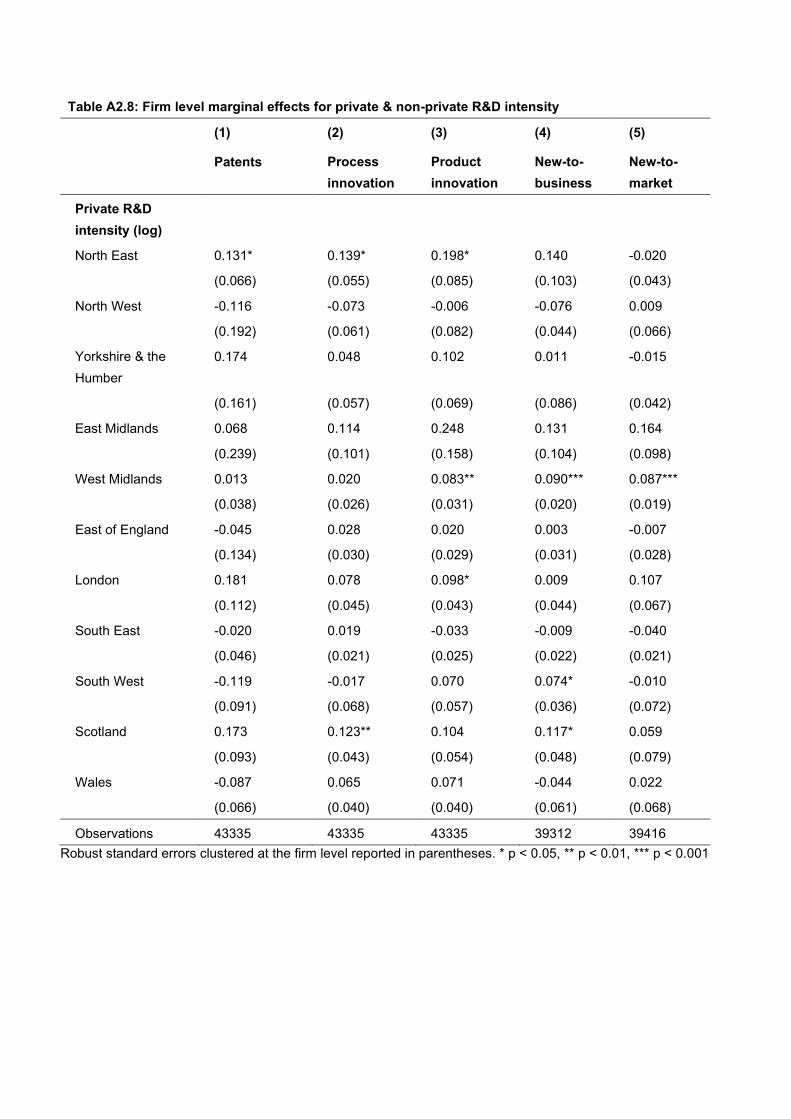
Table A2.8: Firm level marginal effects for private & non-private R&D intensity
(1) (2) (3) (4) (5)
Patents Process innovation
Product innovation
New-to-business
New-to-market
Private R&D intensity (log)
North East 0.131* 0.139* 0.198* 0.140 -0.020
(0.066) (0.055) (0.085) (0.103) (0.043)
North West -0.116 -0.073 -0.006 -0.076 0.009
(0.192) (0.061) (0.082) (0.044) (0.066)
Yorkshire & the Humber
0.174 0.048 0.102 0.011 -0.015
(0.161) (0.057) (0.069) (0.086) (0.042)
East Midlands 0.068 0.114 0.248 0.131 0.164
(0.239) (0.101) (0.158) (0.104) (0.098)
West Midlands 0.013 0.020 0.083** 0.090*** 0.087***
(0.038) (0.026) (0.031) (0.020) (0.019)
East of England -0.045 0.028 0.020 0.003 -0.007
(0.134) (0.030) (0.029) (0.031) (0.028)
London 0.181 0.078 0.098* 0.009 0.107
(0.112) (0.045) (0.043) (0.044) (0.067)
South East -0.020 0.019 -0.033 -0.009 -0.040
(0.046) (0.021) (0.025) (0.022) (0.021)
South West -0.119 -0.017 0.070 0.074* -0.010
(0.091) (0.068) (0.057) (0.036) (0.072)
Scotland 0.173 0.123** 0.104 0.117* 0.059
(0.093) (0.043) (0.054) (0.048) (0.079)
Wales -0.087 0.065 0.071 -0.044 0.022
(0.066) (0.040) (0.040) (0.061) (0.068)
Observations 43335 43335 43335 39312 39416 Robust standard errors clustered at the firm level reported in parentheses. * p < 0.05, ** p < 0.01, *** p < 0.001
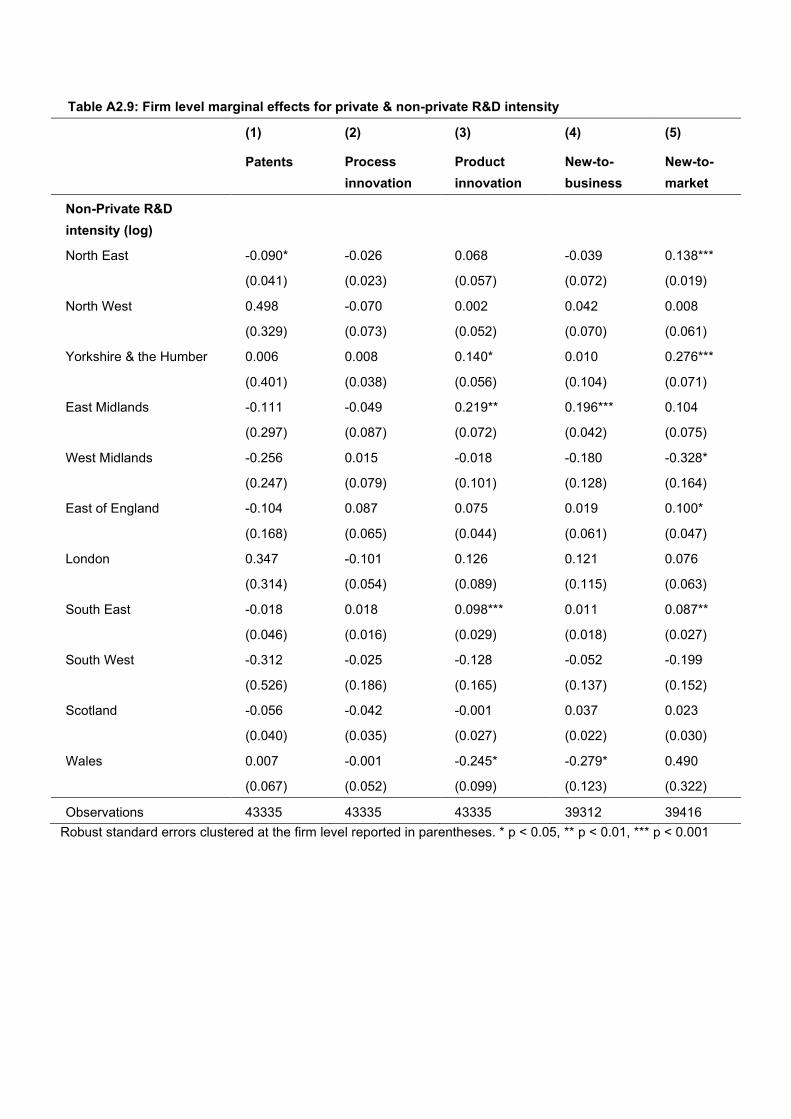
Table A2.9: Firm level marginal effects for private & non-private R&D intensity
(1) (2) (3) (4) (5)
Patents Process innovation
Product innovation
New-to-business
New-to-market
Non-Private R&D intensity (log)
North East -0.090* -0.026 0.068 -0.039 0.138***
(0.041) (0.023) (0.057) (0.072) (0.019)
North West 0.498 -0.070 0.002 0.042 0.008
(0.329) (0.073) (0.052) (0.070) (0.061)
Yorkshire & the Humber 0.006 0.008 0.140* 0.010 0.276***
(0.401) (0.038) (0.056) (0.104) (0.071)
East Midlands -0.111 -0.049 0.219** 0.196*** 0.104
(0.297) (0.087) (0.072) (0.042) (0.075)
West Midlands -0.256 0.015 -0.018 -0.180 -0.328*
(0.247) (0.079) (0.101) (0.128) (0.164)
East of England -0.104 0.087 0.075 0.019 0.100*
(0.168) (0.065) (0.044) (0.061) (0.047)
London 0.347 -0.101 0.126 0.121 0.076
(0.314) (0.054) (0.089) (0.115) (0.063)
South East -0.018 0.018 0.098*** 0.011 0.087**
(0.046) (0.016) (0.029) (0.018) (0.027)
South West -0.312 -0.025 -0.128 -0.052 -0.199
(0.526) (0.186) (0.165) (0.137) (0.152)
Scotland -0.056 -0.042 -0.001 0.037 0.023
(0.040) (0.035) (0.027) (0.022) (0.030)
Wales 0.007 -0.001 -0.245* -0.279* 0.490
(0.067) (0.052) (0.099) (0.123) (0.322)
Observations 43335 43335 43335 39312 39416 Robust standard errors clustered at the firm level reported in parentheses. * p < 0.05, ** p < 0.01, *** p < 0.001
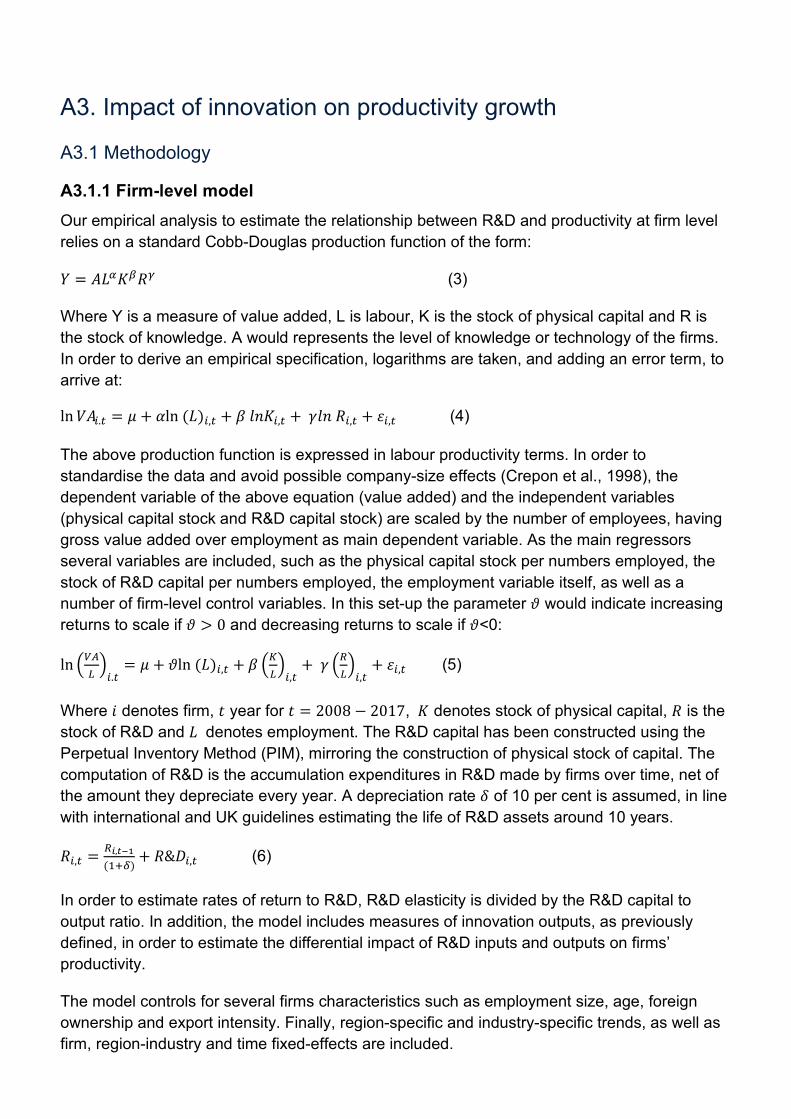
A3. Impact of innovation on productivity growth
A3.1 Methodology
A3.1.1 Firm-level model Our empirical analysis to estimate the relationship between R&D and productivity at firm level relies on a standard Cobb-Douglas production function of the form:
𝑌𝑌 = 𝐴𝐴𝑆𝑆𝛼𝛼𝐾𝐾𝛽𝛽𝑈𝑈𝛾𝛾 (3)
Where Y is a measure of value added, L is labour, K is the stock of physical capital and R is the stock of knowledge. A would represents the level of knowledge or technology of the firms. In order to derive an empirical specification, logarithms are taken, and adding an error term, to arrive at:
ln𝑉𝑉𝐴𝐴𝑖𝑖.𝑟𝑟 = 𝜇𝜇 + 𝛼𝛼ln (𝑆𝑆)𝑖𝑖,𝑟𝑟 + 𝛽𝛽 𝑙𝑙𝑙𝑙𝐾𝐾𝑖𝑖,𝑟𝑟 + 𝛾𝛾𝑙𝑙𝑙𝑙 𝑈𝑈𝑖𝑖,𝑟𝑟 + 𝜀𝜀𝑖𝑖,𝑟𝑟 (4)
The above production function is expressed in labour productivity terms. In order to standardise the data and avoid possible company-size effects (Crepon et al., 1998), the dependent variable of the above equation (value added) and the independent variables (physical capital stock and R&D capital stock) are scaled by the number of employees, having gross value added over employment as main dependent variable. As the main regressors several variables are included, such as the physical capital stock per numbers employed, the stock of R&D capital per numbers employed, the employment variable itself, as well as a number of firm-level control variables. In this set-up the parameter 𝜗𝜗 would indicate increasing returns to scale if 𝜗𝜗 > 0 and decreasing returns to scale if 𝜗𝜗<0:
ln �𝑉𝑉𝑉𝑉𝐿𝐿�𝑖𝑖.𝑟𝑟
= 𝜇𝜇 + 𝜗𝜗ln (𝑆𝑆)𝑖𝑖,𝑟𝑟 + 𝛽𝛽 �𝐾𝐾𝐿𝐿�𝑖𝑖,𝑟𝑟
+ 𝛾𝛾 �𝑅𝑅𝐿𝐿�𝑖𝑖,𝑟𝑟
+ 𝜀𝜀𝑖𝑖,𝑟𝑟 (5)
Where 𝑖𝑖 denotes firm, 𝑡𝑡 year for 𝑡𝑡 = 2008 − 2017, 𝐾𝐾 denotes stock of physical capital, 𝑈𝑈 is the stock of R&D and 𝑆𝑆 denotes employment. The R&D capital has been constructed using the Perpetual Inventory Method (PIM), mirroring the construction of physical stock of capital. The computation of R&D is the accumulation expenditures in R&D made by firms over time, net of the amount they depreciate every year. A depreciation rate 𝛿𝛿 of 10 per cent is assumed, in line with international and UK guidelines estimating the life of R&D assets around 10 years.
𝑈𝑈𝑖𝑖,𝑟𝑟 = 𝑅𝑅𝑖𝑖,𝑡𝑡−1(1+𝛿𝛿)
+ 𝑈𝑈&𝑅𝑅𝑖𝑖,𝑟𝑟 (6)
In order to estimate rates of return to R&D, R&D elasticity is divided by the R&D capital to output ratio. In addition, the model includes measures of innovation outputs, as previously defined, in order to estimate the differential impact of R&D inputs and outputs on firms’ productivity.
The model controls for several firms characteristics such as employment size, age, foreign ownership and export intensity. Finally, region-specific and industry-specific trends, as well as firm, region-industry and time fixed-effects are included.

As highlighted previously, in order to test for the heterogeneity of productivity returns to R&D and innovations across regions and sectors, the main measures of innovation output are interacted with region and industry dummies.
A3.1.2 Region-industry model Given the strongly balance structure of the region-industry panel data, at the region and industry level a different but comparable approach is followed, where the results from the previous section are used to predict the propensity of regions and industries to introduce innovation outputs based on their R&D investment. These predictions are then used to estimate the contribution of innovation outputs to productivity, measured following the total factor productivity (TFP) approach, after controlling for region-industry R&D intensity and other economic conditions.
A3.1.2 Robustness tests Finally, to test the validity of the results several robustness tests are performed, following both an instrumental variable approach based on the shift-share methodology, and generalized method of moments (GMM), where the possible endogenous variables are instrumented with their two-period lagged values and the lagged values of public funding to R&D.
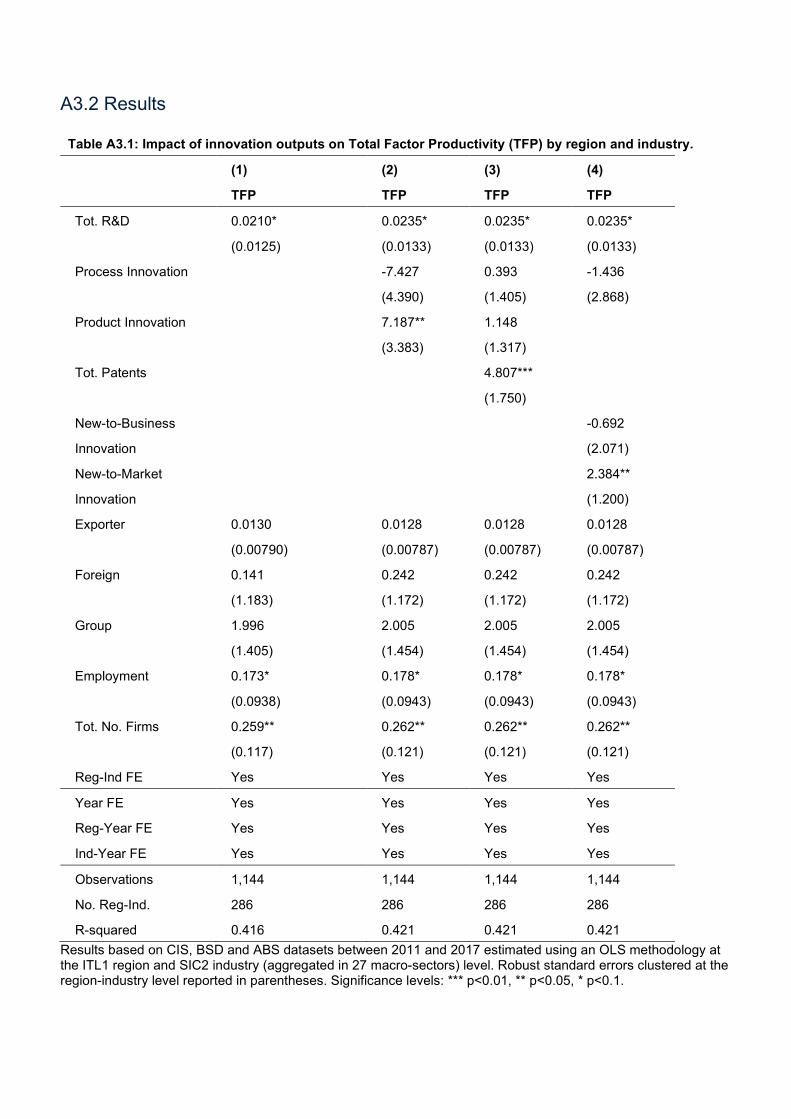
A3.2 Results
Table A3.1: Impact of innovation outputs on Total Factor Productivity (TFP) by region and industry.
(1) (2) (3) (4)
TFP TFP TFP TFP
Tot. R&D 0.0210* 0.0235* 0.0235* 0.0235*
(0.0125) (0.0133) (0.0133) (0.0133)
Process Innovation -7.427 0.393 -1.436
(4.390) (1.405) (2.868)
Product Innovation 7.187** 1.148
(3.383) (1.317)
Tot. Patents 4.807***
(1.750)
New-to-Business -0.692
Innovation (2.071)
New-to-Market 2.384**
Innovation (1.200)
Exporter 0.0130 0.0128 0.0128 0.0128
(0.00790) (0.00787) (0.00787) (0.00787)
Foreign 0.141 0.242 0.242 0.242
(1.183) (1.172) (1.172) (1.172)
Group 1.996 2.005 2.005 2.005
(1.405) (1.454) (1.454) (1.454)
Employment 0.173* 0.178* 0.178* 0.178*
(0.0938) (0.0943) (0.0943) (0.0943)
Tot. No. Firms 0.259** 0.262** 0.262** 0.262**
(0.117) (0.121) (0.121) (0.121)
Reg-Ind FE Yes Yes Yes Yes
Year FE Yes Yes Yes Yes
Reg-Year FE Yes Yes Yes Yes
Ind-Year FE Yes Yes Yes Yes
Observations 1,144 1,144 1,144 1,144
No. Reg-Ind. 286 286 286 286
R-squared 0.416 0.421 0.421 0.421 Results based on CIS, BSD and ABS datasets between 2011 and 2017 estimated using an OLS methodology at the ITL1 region and SIC2 industry (aggregated in 27 macro-sectors) level. Robust standard errors clustered at the region-industry level reported in parentheses. Significance levels: *** p<0.01, ** p<0.05, * p<0.1.
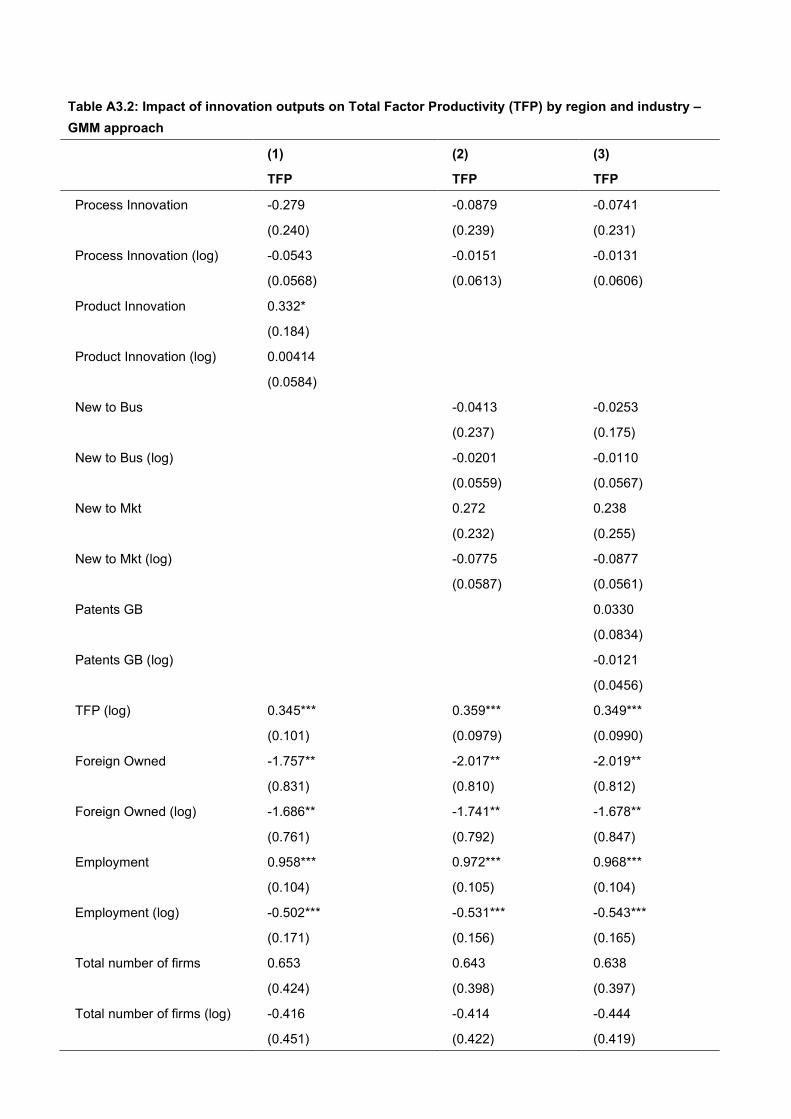
Table A3.2: Impact of innovation outputs on Total Factor Productivity (TFP) by region and industry – GMM approach
(1) (2) (3)
TFP TFP TFP
Process Innovation -0.279 -0.0879 -0.0741
(0.240) (0.239) (0.231)
Process Innovation (log) -0.0543 -0.0151 -0.0131
(0.0568) (0.0613) (0.0606)
Product Innovation 0.332*
(0.184)
Product Innovation (log) 0.00414
(0.0584)
New to Bus -0.0413 -0.0253
(0.237) (0.175)
New to Bus (log) -0.0201 -0.0110
(0.0559) (0.0567)
New to Mkt 0.272 0.238
(0.232) (0.255)
New to Mkt (log) -0.0775 -0.0877
(0.0587) (0.0561)
Patents GB 0.0330
(0.0834)
Patents GB (log) -0.0121
(0.0456)
TFP (log) 0.345*** 0.359*** 0.349***
(0.101) (0.0979) (0.0990)
Foreign Owned -1.757** -2.017** -2.019**
(0.831) (0.810) (0.812)
Foreign Owned (log) -1.686** -1.741** -1.678**
(0.761) (0.792) (0.847)
Employment 0.958*** 0.972*** 0.968***
(0.104) (0.105) (0.104)
Employment (log) -0.502*** -0.531*** -0.543***
(0.171) (0.156) (0.165)
Total number of firms 0.653 0.643 0.638
(0.424) (0.398) (0.397)
Total number of firms (log) -0.416 -0.414 -0.444
(0.451) (0.422) (0.419)
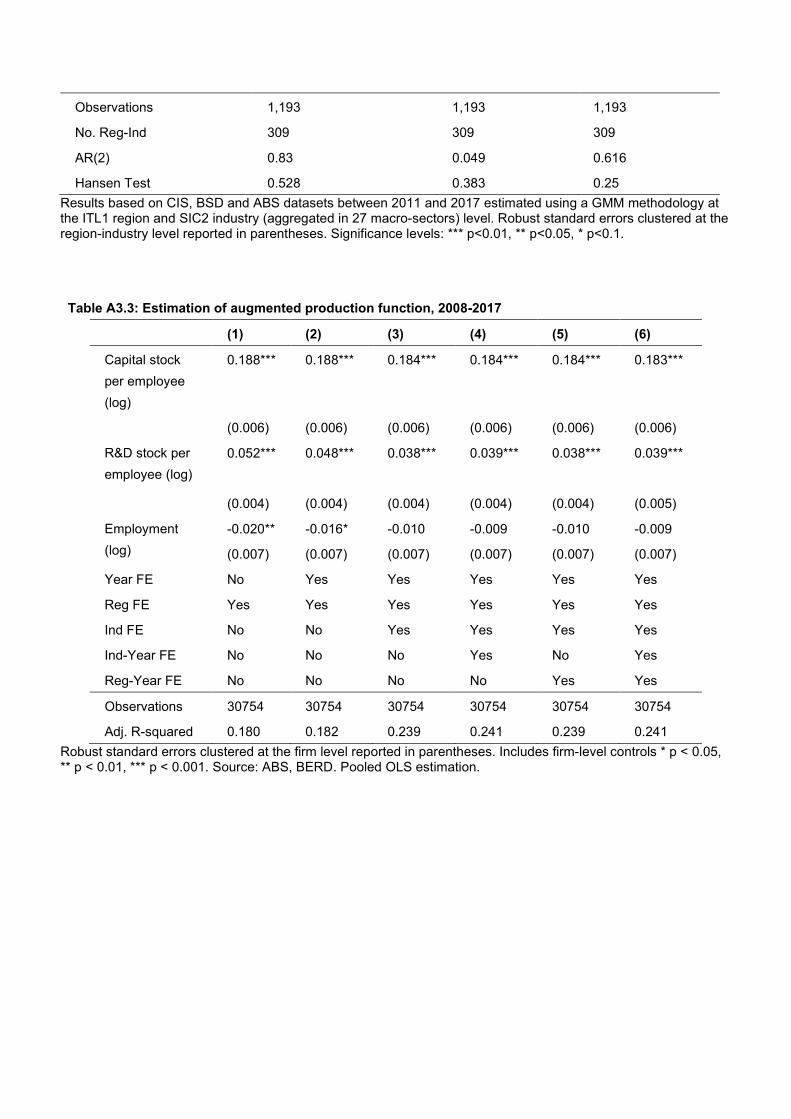
Observations 1,193 1,193 1,193
No. Reg-Ind 309 309 309
AR(2) 0.83 0.049 0.616
Hansen Test 0.528 0.383 0.25 Results based on CIS, BSD and ABS datasets between 2011 and 2017 estimated using a GMM methodology at the ITL1 region and SIC2 industry (aggregated in 27 macro-sectors) level. Robust standard errors clustered at the region-industry level reported in parentheses. Significance levels: *** p<0.01, ** p<0.05, * p<0.1.
Table A3.3: Estimation of augmented production function, 2008-2017
(1) (2) (3) (4) (5) (6)
Capital stock per employee (log)
0.188***
0.188***
0.184***
0.184***
0.184***
0.183***
(0.006) (0.006) (0.006) (0.006) (0.006) (0.006)
R&D stock per employee (log)
0.052***
0.048***
0.038***
0.039***
0.038***
0.039***
(0.004) (0.004) (0.004) (0.004) (0.004) (0.005)
Employment (log)
-0.020**
(0.007)
-0.016*
(0.007)
-0.010
(0.007)
-0.009
(0.007)
-0.010
(0.007)
-0.009
(0.007)
Year FE No Yes Yes Yes Yes Yes
Reg FE Yes Yes Yes Yes Yes Yes
Ind FE No No Yes Yes Yes Yes
Ind-Year FE No No No Yes No Yes
Reg-Year FE No No No No Yes Yes
Observations 30754 30754 30754 30754 30754 30754
Adj. R-squared 0.180 0.182 0.239 0.241 0.239 0.241 Robust standard errors clustered at the firm level reported in parentheses. Includes firm-level controls * p < 0.05, ** p < 0.01, *** p < 0.001. Source: ABS, BERD. Pooled OLS estimation.
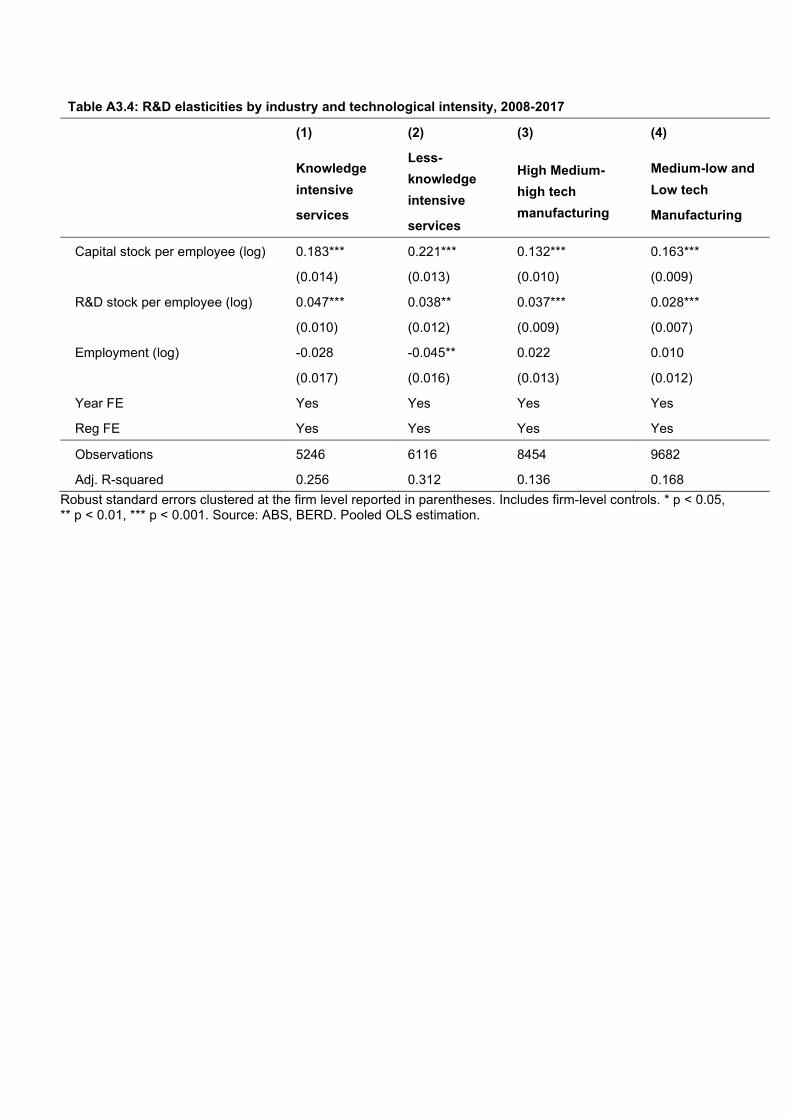
Table A3.4: R&D elasticities by industry and technological intensity, 2008-2017
(1) (2) (3) (4)
Knowledge intensive
services
Less-knowledge intensive
services
High Medium-high tech manufacturing
Medium-low and Low tech
Manufacturing
Capital stock per employee (log) 0.183*** 0.221*** 0.132*** 0.163***
(0.014) (0.013) (0.010) (0.009)
R&D stock per employee (log) 0.047*** 0.038** 0.037*** 0.028***
(0.010) (0.012) (0.009) (0.007)
Employment (log) -0.028 -0.045** 0.022 0.010
(0.017) (0.016) (0.013) (0.012)
Year FE Yes Yes Yes Yes
Reg FE Yes Yes Yes Yes
Observations 5246 6116 8454 9682
Adj. R-squared 0.256 0.312 0.136 0.168 Robust standard errors clustered at the firm level reported in parentheses. Includes firm-level controls. * p < 0.05, ** p < 0.01, *** p < 0.001. Source: ABS, BERD. Pooled OLS estimation.
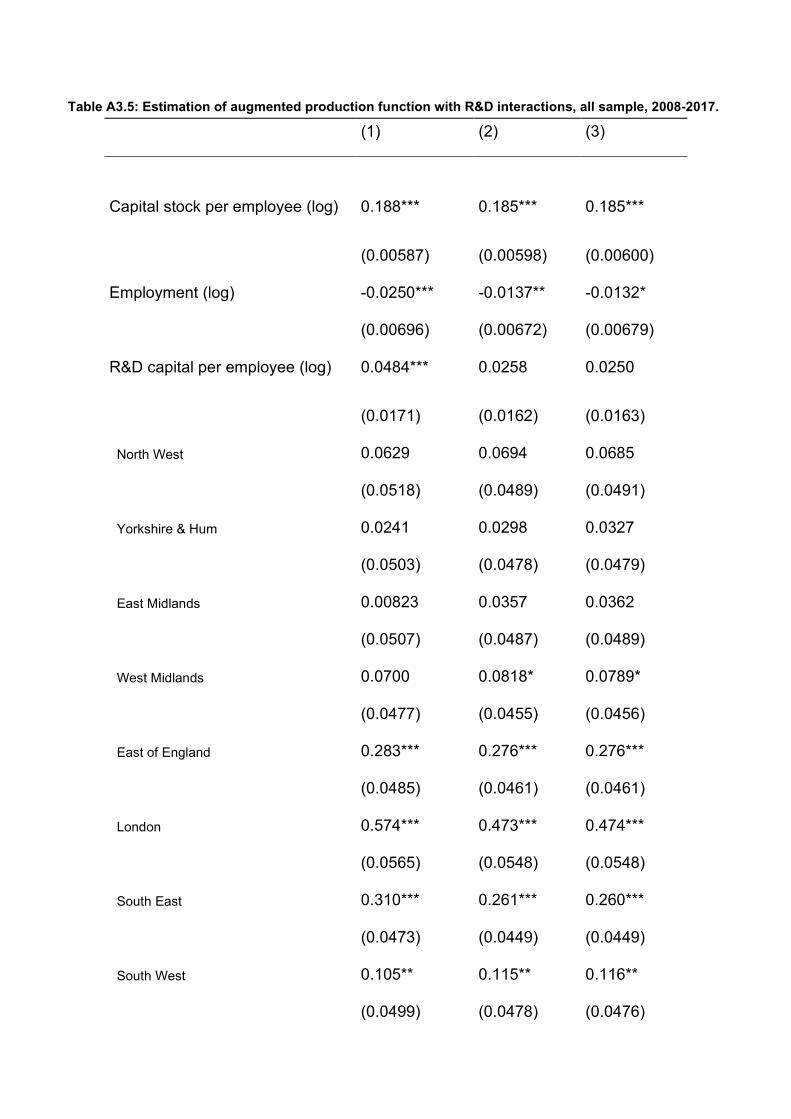
Table A3.5: Estimation of augmented production function with R&D interactions, all sample, 2008-2017.
(1) (2) (3)
Capital stock per employee (log) 0.188*** 0.185*** 0.185***
(0.00587) (0.00598) (0.00600)
Employment (log) -0.0250*** -0.0137** -0.0132*
(0.00696) (0.00672) (0.00679)
R&D capital per employee (log) 0.0484*** 0.0258 0.0250
(0.0171) (0.0162) (0.0163)
North West 0.0629 0.0694 0.0685
(0.0518) (0.0489) (0.0491)
Yorkshire & Hum 0.0241 0.0298 0.0327
(0.0503) (0.0478) (0.0479)
East Midlands 0.00823 0.0357 0.0362
(0.0507) (0.0487) (0.0489)
West Midlands 0.0700 0.0818* 0.0789*
(0.0477) (0.0455) (0.0456)
East of England 0.283*** 0.276*** 0.276***
(0.0485) (0.0461) (0.0461)
London 0.574*** 0.473*** 0.474***
(0.0565) (0.0548) (0.0548)
South East 0.310*** 0.261*** 0.260***
(0.0473) (0.0449) (0.0449)
South West 0.105** 0.115** 0.116**
(0.0499) (0.0478) (0.0476)
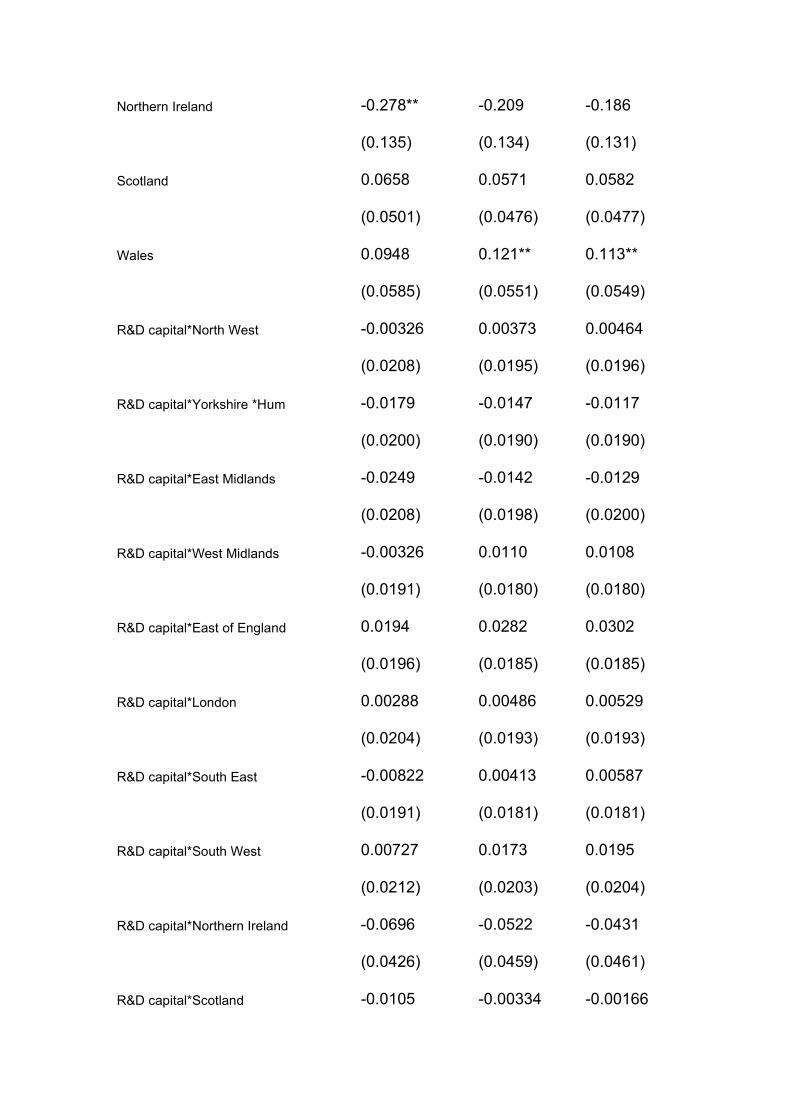
Northern Ireland -0.278** -0.209 -0.186
(0.135) (0.134) (0.131)
Scotland 0.0658 0.0571 0.0582
(0.0501) (0.0476) (0.0477)
Wales 0.0948 0.121** 0.113**
(0.0585) (0.0551) (0.0549)
R&D capital*North West -0.00326 0.00373 0.00464
(0.0208) (0.0195) (0.0196)
R&D capital*Yorkshire *Hum -0.0179 -0.0147 -0.0117
(0.0200) (0.0190) (0.0190)
R&D capital*East Midlands -0.0249 -0.0142 -0.0129
(0.0208) (0.0198) (0.0200)
R&D capital*West Midlands -0.00326 0.0110 0.0108
(0.0191) (0.0180) (0.0180)
R&D capital*East of England 0.0194 0.0282 0.0302
(0.0196) (0.0185) (0.0185)
R&D capital*London 0.00288 0.00486 0.00529
(0.0204) (0.0193) (0.0193)
R&D capital*South East -0.00822 0.00413 0.00587
(0.0191) (0.0181) (0.0181)
R&D capital*South West 0.00727 0.0173 0.0195
(0.0212) (0.0203) (0.0204)
R&D capital*Northern Ireland -0.0696 -0.0522 -0.0431
(0.0426) (0.0459) (0.0461)
R&D capital*Scotland -0.0105 -0.00334 -0.00166
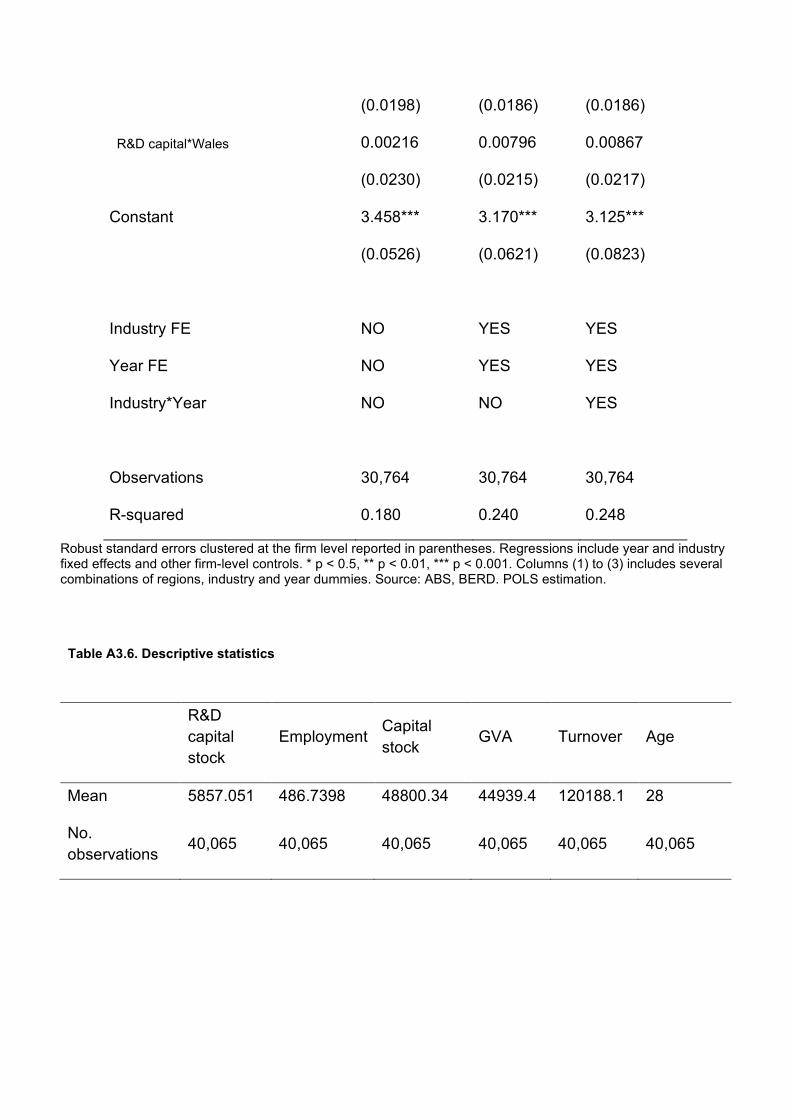
(0.0198) (0.0186) (0.0186)
R&D capital*Wales 0.00216 0.00796 0.00867
(0.0230) (0.0215) (0.0217)
Constant 3.458*** 3.170*** 3.125***
(0.0526) (0.0621) (0.0823)
Industry FE NO YES YES
Year FE NO YES YES
Industry*Year NO NO YES
Observations 30,764 30,764 30,764
R-squared 0.180 0.240 0.248
Robust standard errors clustered at the firm level reported in parentheses. Regressions include year and industry fixed effects and other firm-level controls. * p < 0.5, ** p < 0.01, *** p < 0.001. Columns (1) to (3) includes several combinations of regions, industry and year dummies. Source: ABS, BERD. POLS estimation.
Table A3.6. Descriptive statistics
R&D capital stock
Employment Capital stock GVA Turnover Age
Mean 5857.051 486.7398 48800.34 44939.4 120188.1 28
No. observations 40,065 40,065 40,065 40,065 40,065 40,065
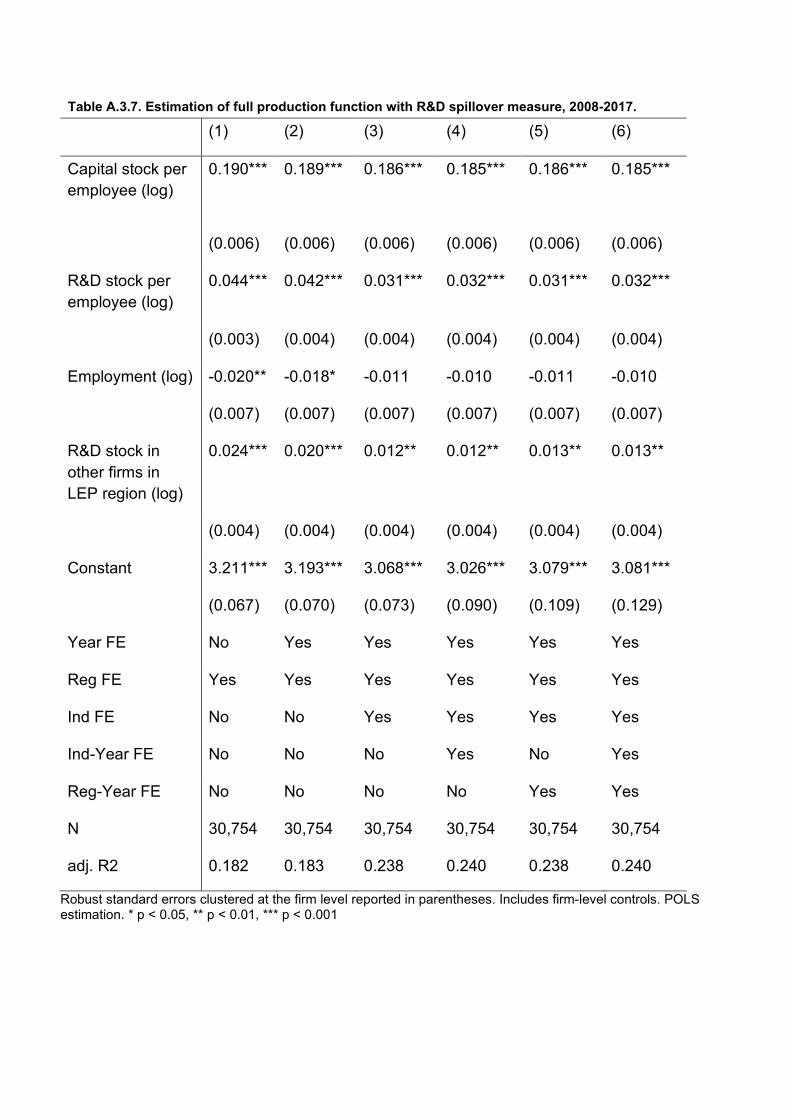
Table A.3.7. Estimation of full production function with R&D spillover measure, 2008-2017.
(1) (2) (3) (4) (5) (6)
Capital stock per employee (log)
0.190***
0.189*** 0.186*** 0.185*** 0.186*** 0.185***
(0.006) (0.006) (0.006) (0.006) (0.006) (0.006)
R&D stock per employee (log)
0.044*** 0.042*** 0.031*** 0.032*** 0.031*** 0.032***
(0.003) (0.004) (0.004) (0.004) (0.004) (0.004)
Employment (log) -0.020** -0.018* -0.011 -0.010 -0.011 -0.010
(0.007) (0.007) (0.007) (0.007) (0.007) (0.007)
R&D stock in other firms in LEP region (log)
0.024*** 0.020*** 0.012** 0.012** 0.013** 0.013**
(0.004) (0.004) (0.004) (0.004) (0.004) (0.004)
Constant 3.211*** 3.193*** 3.068*** 3.026*** 3.079*** 3.081***
(0.067) (0.070) (0.073) (0.090) (0.109) (0.129)
Year FE No Yes Yes Yes Yes Yes
Reg FE Yes Yes Yes Yes Yes Yes
Ind FE No No Yes Yes Yes Yes
Ind-Year FE No No No Yes No Yes
Reg-Year FE No No No No Yes Yes
N 30,754 30,754 30,754 30,754 30,754 30,754
adj. R2 0.182 0.183 0.238 0.240 0.238 0.240
Robust standard errors clustered at the firm level reported in parentheses. Includes firm-level controls. POLS estimation. * p < 0.05, ** p < 0.01, *** p < 0.001
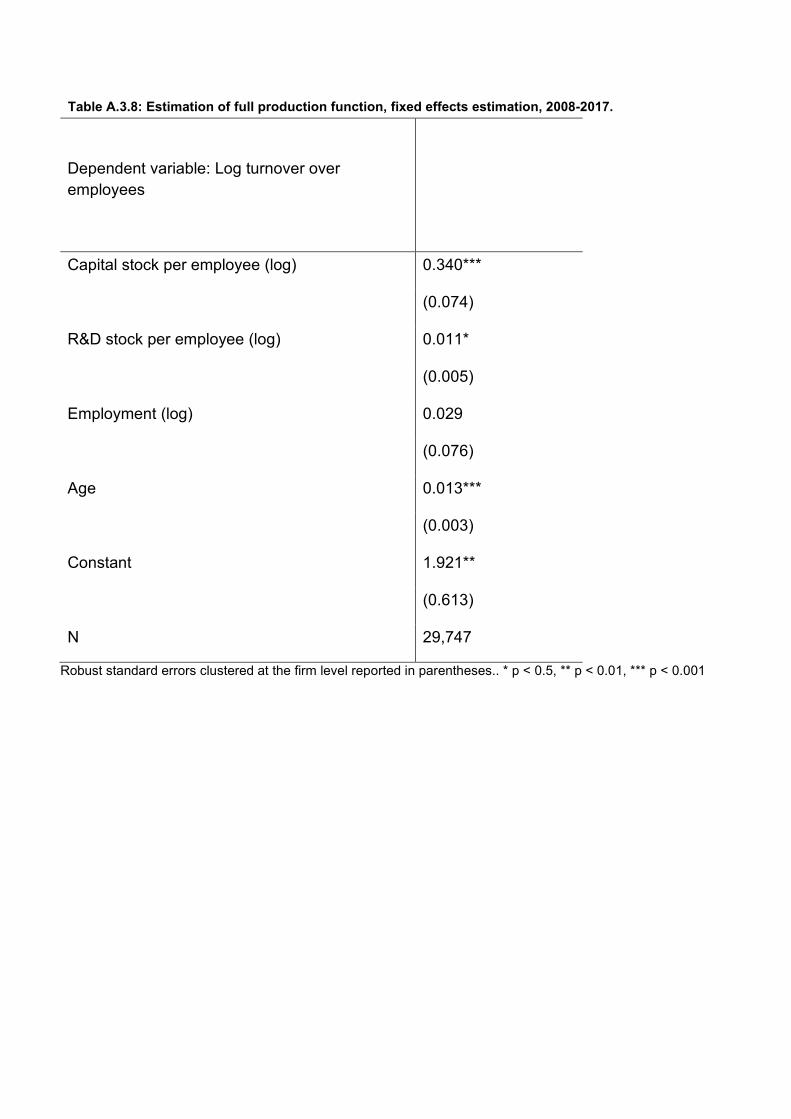
Table A.3.8: Estimation of full production function, fixed effects estimation, 2008-2017.
Dependent variable: Log turnover over employees
Capital stock per employee (log) 0.340***
(0.074)
R&D stock per employee (log) 0.011*
(0.005)
Employment (log) 0.029
(0.076)
Age 0.013***
(0.003)
Constant 1.921**
(0.613)
N 29,747
Robust standard errors clustered at the firm level reported in parentheses.. * p < 0.5, ** p < 0.01, *** p < 0.001
A4. Innovation and inclusive growth
A4.1 Methodology
A4.1.1 Econometric model To analyse the relationship between innovation and inclusive growth at the regional level, two models that take into account time invariant characteristics of regions are estimated. Innovation is defined as the R&D expenditures/turnover and regions as Travel to Work Areas (TTWA) because they are a close approximation to local labour markets, and these are appropriate geographic areas for examining how innovation might affect labour market and associated outcomes. There are 243 TTWAs in England Scotland and Wales.
In the first model, TTWA level data are used for the years 2005-2017 to estimate the following linear model:
𝑦𝑦𝑖𝑖𝑟𝑟 = 𝛼𝛼 + 𝛿𝛿𝐼𝐼𝑖𝑖𝑟𝑟−1 + 𝑿𝑿𝑖𝑖𝑟𝑟𝜷𝜷 + 𝜃𝜃𝑖𝑖 + 𝛾𝛾𝑟𝑟 + 𝜀𝜀𝑖𝑖𝑟𝑟 (7)
where 𝑦𝑦𝑖𝑖𝑟𝑟 are a set of local level outcomes that capture elements of inclusive growth in area i at time t (listed in Table A4.1), 𝐼𝐼𝑖𝑖𝑟𝑟 is the level of R&D intensity in the area i, 𝑿𝑿𝑖𝑖𝑟𝑟 are a set of controls variables, 𝜃𝜃𝑖𝑖 and 𝛾𝛾𝑟𝑟 are area and year fixed effects, and 𝜀𝜀𝑖𝑖𝑟𝑟 is the error term. The control variables included are the percentage of working age individuals with a post-secondary education, the percentage of individuals with a wage higher than the median, and the percentage of individuals employed in STEM sectors. These help control for systematic time-varying differences between TTWAs.
In the second model, changes in area outcomes are related to changes in innovation and other controls between the years 2005 and 2017. Thus, the following model is estimated:
Δ𝑦𝑦𝑖𝑖 = 𝛿𝛿Δ𝐼𝐼𝑖𝑖 + 𝚫𝚫𝑿𝑿𝑖𝑖𝜷𝜷 + 𝜂𝜂𝑖𝑖 (8)
where 𝜂𝜂𝑖𝑖 is the error term. This specification allows for the fact that changes to a new equilibrium could take time; if there is a change in innovation it may take time for this to feed through into changes in the outcomes under consideration. Robust standard errors are reported for all the estimations, and the estimates are weighted by the local population count.
A4.1.2 Robustness tests In addition to the OLS specifications presented above, the use of instrumental variables is also explored to isolate exogenous changes in local innovation, however the first-stage results were not convincing, so the results are not presented. The two equations above may be biased if TTWA-level innovation is correlated with changes in unobserved factors such as production or consumption amenities that affect employment, wages/income, or housing costs for example. A shift-share instrumental variable approach is followed using national level changes in innovation intensity by industry to predict each TTWA’s change in innovation intensity

depending on each TTWA’s initial concentration of industries. The identification assumption is that changes in the unobserved determinants of labour market and housing market outcomes in TTWAs with output initially concentrated in industries that experience stronger nationwide innovation intensity increases are similar, on average, to changes in TTWAs with output initially concentrated in industries that experience weaker national level innovation intensity increases.
A4.1.3 Definitions of variables The variables, their specification and the data used to create them are described in the Table A4.1:
Table A4.1: Description of the variables used in the inclusive growth analysis
Variable Description Data source
Innovation
R&D intensity R&D expenditure/turnover CIS
Inclusive growth
Low earnings 20th percentile of gross weekly earnings (Twenty per cent of full-time workers receive earnings equal to or below this threshold, in GBP)
ASHE
Inequality
90/10 income inequality ratio (the wage or salary income earned by individuals at the 90th percentile (those earning more than 90 percent of other workers) compared to the earnings of workers at the 10th percentile (those earning higher than the bottom 10 percent)
ASHE
Unemployment % of working-age population not in employment but actively seeking and available to start work APS
Economic inactivity % of working-age population who are economically inactive APS
Workless households % of working age households with no one in work APS
Employment in low pay sectors
% employed in administrative and support services, wholesale and retail trade, accommodation and food services, and residential social care
ASHE

Housing unaffordability Ratio of lower quartile house price to lower quartile earnings
Land Registry and ASHE
Controls
Post-secondary education % of working age individuals with post-secondary education APS
Higher than the median earnings
% of individuals with wage higher than the median ASHE
STEM employment % of individuals employed in STEM sectors ASHE
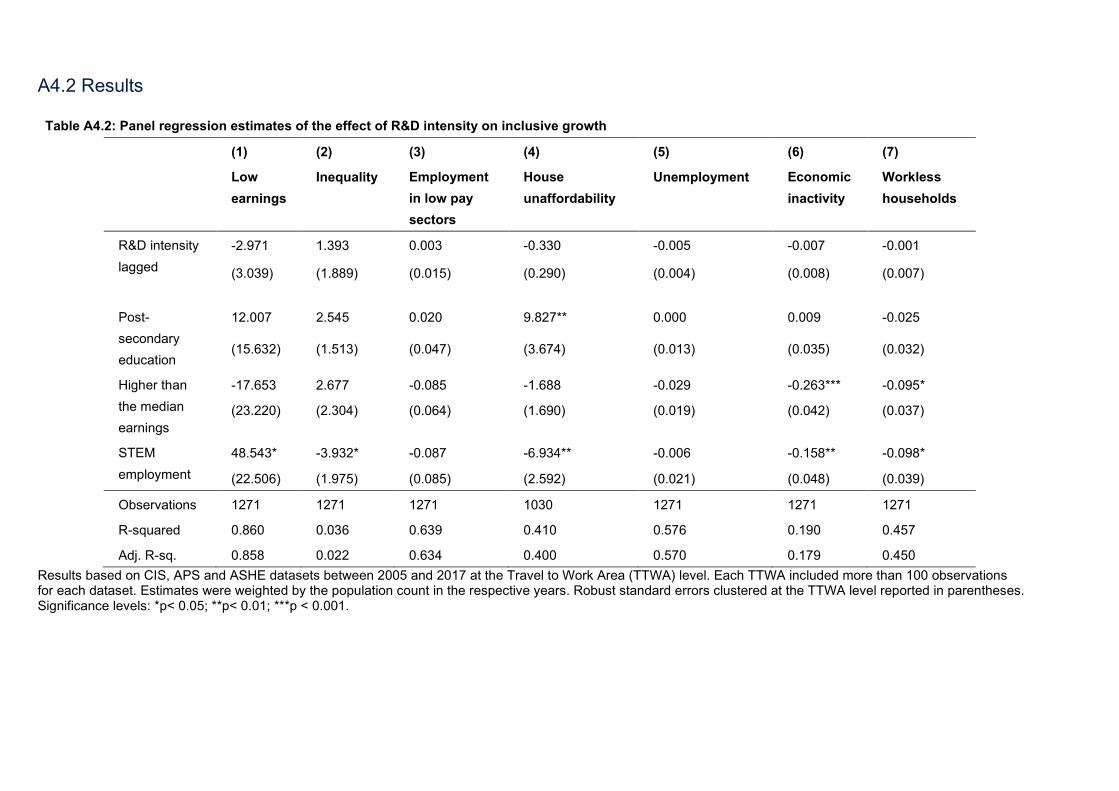
A4.2 Results
Table A4.2: Panel regression estimates of the effect of R&D intensity on inclusive growth
(1) (2) (3) (4) (5) (6) (7)
Low earnings
Inequality Employment in low pay sectors
House unaffordability
Unemployment Economic inactivity
Workless households
R&D intensity lagged
-2.971 1.393 0.003 -0.330 -0.005 -0.007 -0.001
(3.039) (1.889) (0.015) (0.290) (0.004) (0.008) (0.007)
Post-secondary education
12.007 2.545 0.020 9.827** 0.000 0.009 -0.025
(15.632) (1.513) (0.047) (3.674) (0.013) (0.035) (0.032)
Higher than the median earnings
-17.653 2.677 -0.085 -1.688 -0.029 -0.263*** -0.095*
(23.220) (2.304) (0.064) (1.690) (0.019) (0.042) (0.037)
STEM employment
48.543* -3.932* -0.087 -6.934** -0.006 -0.158** -0.098*
(22.506) (1.975) (0.085) (2.592) (0.021) (0.048) (0.039)
Observations 1271 1271 1271 1030 1271 1271 1271
R-squared 0.860 0.036 0.639 0.410 0.576 0.190 0.457
Adj. R-sq. 0.858 0.022 0.634 0.400 0.570 0.179 0.450 Results based on CIS, APS and ASHE datasets between 2005 and 2017 at the Travel to Work Area (TTWA) level. Each TTWA included more than 100 observations for each dataset. Estimates were weighted by the population count in the respective years. Robust standard errors clustered at the TTWA level reported in parentheses. Significance levels: *p< 0.05; **p< 0.01; ***p < 0.001.
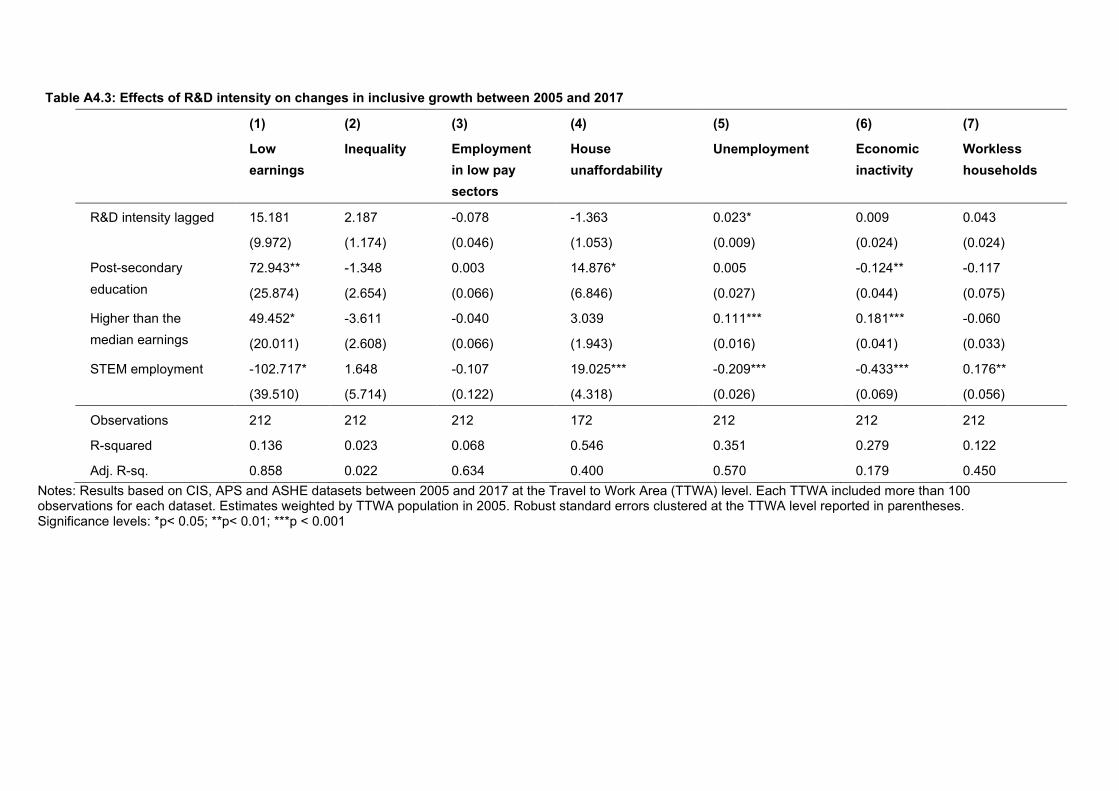
Table A4.3: Effects of R&D intensity on changes in inclusive growth between 2005 and 2017
(1) (2) (3) (4) (5) (6) (7)
Low earnings
Inequality Employment in low pay sectors
House unaffordability
Unemployment Economic inactivity
Workless households
R&D intensity lagged
15.181 2.187 -0.078 -1.363 0.023* 0.009 0.043
(9.972) (1.174) (0.046) (1.053) (0.009) (0.024) (0.024)
Post-secondary education
72.943** -1.348 0.003 14.876* 0.005 -0.124** -0.117
(25.874) (2.654) (0.066) (6.846) (0.027) (0.044) (0.075)
Higher than the median earnings
49.452* -3.611 -0.040 3.039 0.111*** 0.181*** -0.060
(20.011) (2.608) (0.066) (1.943) (0.016) (0.041) (0.033)
STEM employment -102.717* 1.648 -0.107 19.025*** -0.209*** -0.433*** 0.176**
(39.510) (5.714) (0.122) (4.318) (0.026) (0.069) (0.056)
Observations 212 212 212 172 212 212 212
R-squared 0.136 0.023 0.068 0.546 0.351 0.279 0.122
Adj. R-sq. 0.858 0.022 0.634 0.400 0.570 0.179 0.450 Notes: Results based on CIS, APS and ASHE datasets between 2005 and 2017 at the Travel to Work Area (TTWA) level. Each TTWA included more than 100 observations for each dataset. Estimates weighted by TTWA population in 2005. Robust standard errors clustered at the TTWA level reported in parentheses. Significance levels: *p< 0.05; **p< 0.01; ***p < 0.001

This publication is available from: www.gov.uk/beis
If you need a version of this document in a more accessible format, please email [email protected]. Please tell us what format you need. It will help us if you say what assistive technology you use.