From Heat to Electricity: How “nano” Saved...
44
From Heat to Electricity: How “nano” Saved Thermoelectrics Sponsored by Mercouri Kanatzidis, Northwestern University
Transcript of From Heat to Electricity: How “nano” Saved...

From Heat to Electricity: How “nano”Saved Thermoelectrics
Sponsored by
Mercouri Kanatzidis, Northwestern University

Collaborating Team interactions
Kanatzidis groupChemistry
Materials design, discoveryand optimization
Hogan groupE. Engineering
Module design and optimization
Uher groupPhysics
TE Measurements
Mahanti groupPhysics (theory)
Fundamental understandingElectronic structure, Property prediction
Schock groupM. Engineering
Materials scale-up andoptimization, design/testing
Case groupMaterials Science
Powder processingMechanical properties
Tellurex CorpIndustry
Bruce CookTEM, transport

Outline
IntroductionMaterials under investigationSynthesis (successes and challenges)TEM characterization and nanostructuringStructure property relationships- Nanostructures reduce the lattice thermal conductivityMaterials scale up and optimizationModule Fabrication Progress, low resistance contactsMaking brittle materials strongConclusions

Heat to Electrical Energy DirectlyUp to 20% conversion efficiency with right materials
http://www.dts-generator.com/
TE devices have no moving parts, no noise, reliable

Thermoelectric applicationsWaste heat recovery • Automobiles• Over the road trucks• Utilities• Chemical plants
Space powerRemote Power GenerationSolar energyGeothermal power generationDirect nuclear to electrical

U.S. Energy Flow, 1999
web site: www.eia.doe.gov
Given that ~60% of energy becomes waste heat, even a 10% capture and conversionto useful forms can have huge impact on overall energy utilization

Figure of Merit
ZT =σ ⋅ S2
κ total
•T
σ ⋅ S2Power factor
Total thermal conductivity
electrical conductivity thermopower
ZT =σ ⋅ S2
κ total
•T
σ ⋅ S2Power factor
Total thermal conductivity
electrical conductivity thermopower
0
0.05
0.1
0.15
0.2
0.25
0 0.5 1 1.5 2 2.5 3
η
ZTavg
δ = 0.0δ = 0.1
δ = 1.1
0
0.05
0.1
0.15
0.2
0.25
0 0.5 1 1.5 2 2.5 3
η
ZTavg
δ = 0.0δ = 0.1
δ = 1.1
δ=Rc/RFor Th = 800K
Tc = 300K

Today’s situationThe most efficient materials today for power generation:PbTe: ZT~0.8 at 800 K (n-type)TAGS: ZT~1.2 700 K (p-type)Bi2Te3-xSex: ZT~1 at 300 KFurther improvements are needed.New materials emerging
PbTePbSe 20 nm dot
Quantum Dot Layers in thin MBE-grown PbSe/PbTe superlattices (Harman et al, ZT~3)
10Å/50Å Bi2Te3/Sb2Te3 superlattice structures
Venkatasubramanian R, Siivola E, Colpitts T et al. Nature, 2001, 413: 597
Harman T C, Taylor P J, Walsh M P et al. Science, 2002, 297: 2229

Some promising systems under investigation
half-Heusler alloys (ZrNiSn)Zn4Sb3ClathratesSkutterudites (CoSb3)Bulk nanocomposites based on PbTe Bulk nanocomposites based on Si-GeAgSbTe2/PbTe, NaSbTe2/PbTe
March 2006 issue of MRS Bulletin
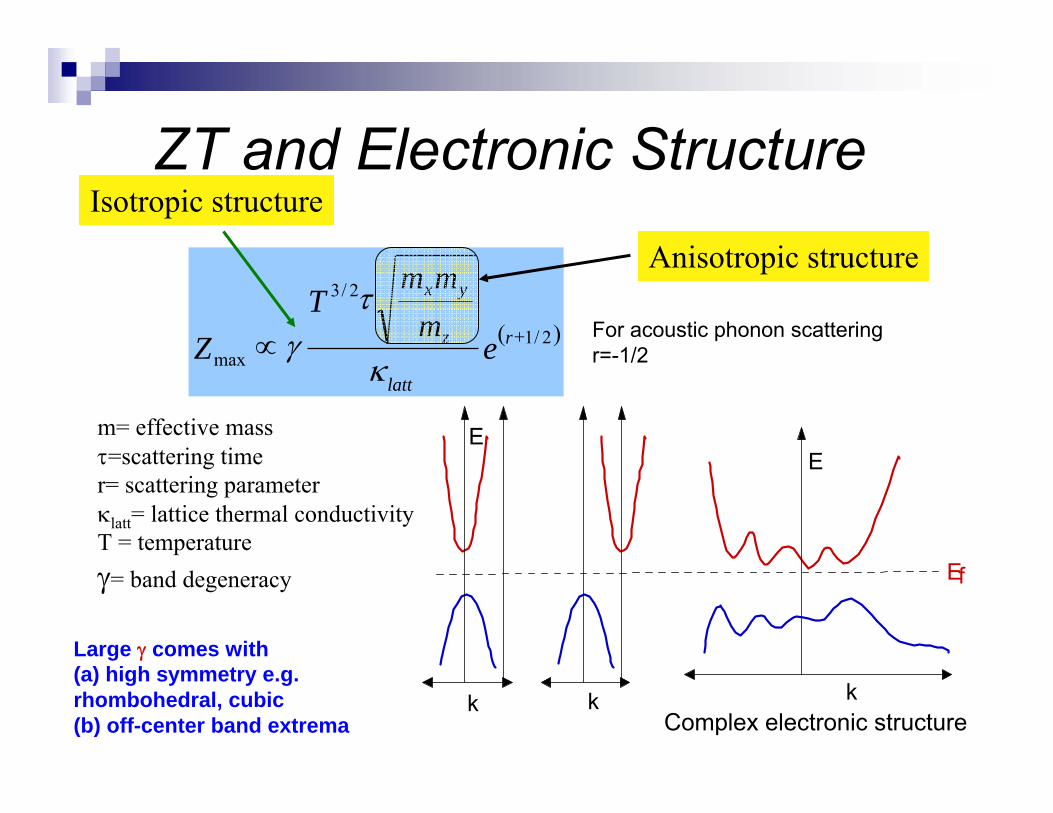
( )2/1
2/3
max+∝ r
latt
z
yx
em
mmT
Zκ
τγ
ZT and Electronic Structure
m= effective massτ=scattering timer= scattering parameterκlatt= lattice thermal conductivityT = temperatureγ= band degeneracy
Large γ comes with(a) high symmetry e.g. rhombohedral, cubic(b) off-center band extrema
Isotropic structure
Anisotropic structure
k
E
k
E
k
Ef
For acoustic phonon scatteringr=-1/2
Complex electronic structure

Selection criteria for candidate materials
Narrow band-gap semiconductorsHeavy elements
High μ, low κLarge unit cell, complex structure
low κHighly anisotropic or highly symmetric…Complex compositions
low κ, complex electronic structure

A2Q + PbQ + M2Q3 –––––> (A2Q)n(PbQ)m(M2Q3)p
Investigating the A/Bi/Q system
A2Q
PbQBi2Q3
A=Ag, K, Rb, CsM=Sb, BiQ=Se, Te
β-K2Bi8Se13
Rb0.5Bi1.83Te3
Pb5Bi6Se14
A1+xPb4-2xBi7+xSe15
APb2Bi3Te7
Pb6Bi2Se9 Pb5Bi12Se23
Map generates target compounds
CsBi4Te6
Phases shownare promising new TEmaterials
Cubic materialsAmBnMmQ2m+n

Compounds discovered
K2Bi8Se13, KPbBi9Se13, KPb4Sb7Se15
Cs1-xPb5-xBi10+xSe21
CsPbBi3Te6, CsPb2Bi3Te7, RbPbBi3Te6, RbPb2Bi3Te7, RbPb3Bi3Te8,KPbBiSe3, K2PbBi2Se5
AgPb10SbTe12, NaPb20SbTe22

AgPbmSbTe2+m (LAST-m) NaPbmSbTe2+m (SALT-m)
AgSbTe
Pb
6 8 10 12 14 16 18
263
264
265
266
267
268
Uni
t cel
l vol
ume
(Å)
Vegard's law
m value
Powder data
Single crystal data
(1) (a) Rodot, H. Compt. Rend. 1959, 249, 1872-4. (2) (a) Rosi, F. D.; Hockings, E. S.; Lindenblad, N. E. Adv. EnergyConvers. 1961, 1, 151.
No phase transitions to melting point

Synthesis
R. G. Maier Z. Metallkunde 1963, 311
T, K
time, h
1000 ºC
Cool to 50 ºCin 24 h
Gravity induced inhomogeneityLAST-18
time, h
T, K950-1000 ºC Cool to 50 ºC in
72 h
13 deg/h
Ingot properties very sensitive to cooling profile
Wernick, J. H.. Metallurg. Soc. Conf. Proc. (1960), 5 69-87.
rock
rock

Large scale LAST-18 (n-type)
Kosuga et al J. Alloys Compnds, 2005, 391, 288
0
0.5
1
1.5
2
320 400 480 560 640 720 800 880
ZT
Temperature (K)
LAST-18
ETN-16 (LAST-18)
LAST-18Kosuga et al 2005
PbTe
LAST-22Wang et al 2006
m= 40
m= 25
m= 18
m= 14m= 8
Strong composition grading along ingot
Deviations from the AgPb18SbTe20 compositionBest samples are Te-deficient

Ag0.86Pb19SbTe20EDS analysis
49.8247.201.391.59Average
49.7147.431.441.42
49.6547.181.471.70
49.7547.271.391.60
50.1746.921.261.65
TePbSbAgETN125A
49.4447.561.431.57Average
49.5146.981.472.04
49.7047.361.761.18
49.0847.651.451.82
48.9448.181.261.61
49.9847.631.211.19
TePbSbAgETN125B
49.7847.451.561.21Average
49.9647.351.790.89
49.5048.051.720.73
49.8047.351.111.74
49.8747.041.601.49
TePbSbAgETN125C
49.5347.891.131.50Average
49.9747.731.181.12
48.9247.061.362.65
49.6147.701.241.45
49.5648.021.391.02
49.9248.190.851.55
TePbSbAgETN125D

7 d4 h1000 oC
700 oC
12 h
50 oC
12 h
LAST-18: Synthesis with Slow Cooling
fast cooled sample
slow cooled sample
105 g201910.86amountTePbSbAg
25.6-1581026C
-180
-128
-121
S(μV/K)
43.41341D
15.7959B
7.8535A
PF(μW/cm∙K2)
σ(S/cm)
ETN125
~2deg/hr

Properties of Ag1-xPb18SbTe20
0
500
1000
1500
2000
-400
-350
-300
-250
-200
-150
-100
300 350 400 450 500 550 600 650 700
σ (S
/cm
) S (μV
/K)
Temperature, K0.00
0.50
1.00
1.50
2.00
300 350 400 450 500 550 600 650 700
Ag0.86
Pb18
SbTe20
ZT
Temperature, K
PbTe

TEM investigation on nanostructuring: LAST-18 (Cook)

Nanostructures reduce the lattice thermal conductivity
0.35 W/mK (Harman PbTe/PbSe superlattice)0
0.5
1
1.5
2
2.5
300 400 500 600 700 800
Latti
ce T
herm
al C
ondu
ctiv
ity (W
/mK
)
Temperature (K)
PbTe
LAST-18
Lattice thermal conductivity
Clemens-Drabble theory

Recent Report for Sintered Pellet Ag0.8Pb22SbTe20, ZT ~ 1.4 at 680 K

P-type materials, LASTT(LASTT-m) Ag(Pb1-xSnx)mSbTe2+mSn atoms act as acceptorsAg atoms act as acceptorsSb atoms act as donorse.g AgPb10Sn8SbTe20, AgxPb7Sn3SbyTe12, Ag1-xSnSb1+xTe3, etcVery low lattice thermal conductivityGood homogeneity
Hogan
PF~17-18 μW/cmK2
200
400
600
800
1000
300 400 500 600 700
Ele
ctri
cal C
ondu
ctiv
ity (S
/cm
)
Temperature (K)
Ag0.5
Pb6Sn
2Sb
0.2Te
10
50
100
150
200
250
300
300 400 500 600 700
The
rmop
ower
(µV
/K)
Temperature (K)
Ag0.5
Pb6Sn
2Sb
0.2Te
10

LASTT: Very low lattice thermal conductivity
J. Androulakis, K. F. Hsu, R. Pcionek, H. Kong, C. Uher, J. J. D'Angelo, A. Downey, T. Hogan, M. G. Kanatzidis, Advanced Materials 2006, 18, 1170
300 350 400 450 500 550 600 650 700 7500.0
0.2
0.4
0.6
0.8
1.0
1.2
1.4
1.6
1.8
2.0
2.2
κ (W
/mK
)
Temperature (K)
κlatt, PbTe
κlatt,LASTT
LASTT-16: AgPb14Sn4Sb0.4Te20
LASTT-10: AgPb10Sn10Sb0.7Te22
0 100 200 300 400 500 6000.000
0.002
0.004
0.006
0.008
0.010
0.012
0.014
0.016
0.018
JAE69P110-BAg0.5Pb6Sn2Sb0.2Te10
κ (W
/cm
K)
Temperature (K)
0.0
0.2
0.4
0.6
0.8
1.0
1.2
1.4
1.6
1.8
κ (W
/mK)
0 100 200 300 400 500 6000.000
0.002
0.004
0.006
0.008
0.010
0.012
0.014
0.016
0.018
JAE69P110-BAg0.5Pb6Sn2Sb0.2Te10
κ (W
/cm
K)
Temperature (K)
0.0
0.2
0.4
0.6
0.8
1.0
1.2
1.4
1.6
1.8
κ (W
/mK)

Why do the LAST materials nanostructure?
Pb Te Pb Te Pb Te Pb
Te Pb Te Pb Te Pb Te
Pb Te Sb Te Pb Te Pb
Te Ag Te Ag Te Pb Te
Pb
Te Pb
Te
Te
Sb
Pb
Te
Te
Pb
Pb
Te
Te
Pb
Ag Te Pb Te Pb Te Pb
Te Pb Te Pb Te Sb Te
Pb Te Pb Te Pb Te Pb
Te Ag Te Pb Te Pb Te
Pb
Te Pb
Te
Te
Pb
Pb
Te
Te
Sb
Pb
Te
Te
Pb
Dissociated state..unstable Associated state..stable
Any +1/+3 pair
Driving force for segregation Ag+/Sb3+ pair: thermodynamics

Figure of Merit LASTT (p-type)
0.0
0.2
0.4
0.6
0.8
1.0
1.2
1.4
1.6
1.8 Ag0.9Pb10.8Sn7.2Sb0.6Te20 Ag0.9Pb7.2Sn10.8Sb0.6Te20 Ag0.9Pb9Sn9Sb0.6Te20 Ag0.6Pb7Sn3Sb0.2Te12 Ag0.5Pb6Sn2Sb0.2Te10Ag0.9Pb5Sn3Sb0.7Te10
ZT
(a)
J. Androulakis, K. F. Hsu, R. Pcionek, H. Kong, C. Uher, J. J. D'Angelo, A. Downey, T. Hogan, M. G. Kanatzidis, Advanced Materials 2006, 18, 1170

Na-based materials (SALT-m)New high ZT p-type material Na1-xPbmSbTe2+m
m~19-21
5 nm
2 nm

What is nanostructuring worth?
0
0.5
1
1.5
2
300 350 400 450 500 550 600 650 700
Latti
ce T
herm
al c
ondu
ctiv
ity (W
/mK
)
Temperature, K
PbTe0.9
Se0.1
Pb0.9
Sn0.1
Te
Na1-x
Pb20
SbTe22
(B)
P. F. P. Poudeu, J. D'Angelo, A. D. Downey, J. L. Short, T. P. Hogan, M. G. Kanatzidis, Angew. Chem. Int. Ed. 2006, 45, 1
Pb Te Pb Te Pb Te Pb
Te Pb Te Pb Te Pb Te
Pb Te Sb Te Pb Te Pb
Te Na Te Na Te Pb Te
Pb
Te Pb
Te
Te
Sb
Pb
Te
Te
Pb
Pb
Te
Te
Pb

Matrix Encapsulation as a Route to Nanostructured PbTe
PbTe + X
X = InSb
X = Sb
X = B
i 20 nm
100 nm
2 nm
2 nm
100 nm
2 nm

Nanocrystals of Sb in PbTe
300 400 500 600 7000.5
1.0
1.5
2.0
2.5
PbTe - Sb(16%)PbTe - Sb(4%)
κ lat, W
m-1K
-1
Temperature, K
PbTe - Sb(2%)
PbTe
300 400 500 600 7000.5
1.0
1.5
2.0
2.5PbTe
4% InSb
4% Bi
κ lat,
Wm
-1K
-1
Temperature, K
4% Sb
• An optimum concentration of nanoscale second phase is necessary• Mass fluctuations play a role in thermal conductivity reduction• Lattice thermal conductivity reduced, however ZT low due to small Seebeck
20 nm

Phonons

Electrons


Completed and Processed IngotComposition: Ag0.43Pb18Sb1.2Te20 Weight: 200 grams
0
200
400
600
800
1000
1200
1400
1600
-280
-260
-240
-220
-200
-180
-160
-140
-120
350 400 450 500 550 600 650
1 - Increasing T2 - Decreasing T3 - Increasing T4 - Decreasing T
1 - Increasing T2 - Decreasing T3 - Increasing T4 - Decreasing T
Ele
ctric
al C
ondu
ctiv
ity (S
/cm
)
TEP (µV/K)
Temperature (K)
Ag0.43
Pb18
Sb1.2
Te20
Temperature cyclability
Schock

ETN611020oC to 700oC @ 120oC/hr
ETN641020oC to 825oC @ 97.5oC/hr
Cool from 1020ºC to 700, 800, 825, 850, 875, 900°C typically from one – two hours
Heating and Cooling Optimization of LASTAg0.43Pb18Sb1.2Te20
ETN651020oC to 875oC @ 72.5oC/hr
ETN681020oC to 900oC @ 120oC/hr

Module Fabrication
1.78mΩ total 16.0µΩ·cm2
Hot side diffusion contacts, and cold side solder contacts with <10 µW·cm2 have been achieved.
0.01
0.02
0.03
0.04
0.05
0.06
0.07
0.08
0 0.02 0.04 0.06 0.08 0.1 0.12 0.14
Th=495KTh=545KTh=585K
Pow
er G
ener
ated
(W)
Load resistance (ohms)

0
0.2
0.4
0.6
0.8
1
0 2 4 6 8 10
Vol
tage
(mV
)
Position (mm)
ETN123
0
0.1
0.2
0.3
0.4
0.5
0.6
0.7
0.8
0 1 2 3 4 5 6 7 8
Vol
tage
(mV
)
Position (mm)
Ni plated samples.SnPb to Ni.Kester Flux.Hot plate.
Scanning Probe Results
ETN123
crack
0
50
100
150
200
0 2 4 6 8 10
Vol
tage
(µV
)
Position (mm)
Ag0.9
Pb9Sn
9Sb
0.6Te
20
Jarrod Short
Ni
Ni
I = 100mASlope = 26 (µV/mm)4.7mm x 4.7mmσ = 1740 (S/cm)
Ni electrode on LASTT

In region 1 (large grains), grain size dominates the
fracture behavior
In region 2 (smaller grains), grain size and surface
defects contribute to fracture
For brittle materials in general, the fracture strength is a function of the reciprocal square root of grain size.
(Grain Size)-1/2
Stre
ngth
Grain Size (G)
Region 1
Region 2
Eldon CaseMaking brittle materials strong
Hot pressing

Powder Processing and Mechanical Characterization of LAST/T Materials
Ingot LAST/T materials have a large mean grain size (~ 500 to 700 μm), resulting in poor mechanical properties. We utilize planetary ball milling to generate micron-scale powders from LAST/T ingots. To date, we have achieved equiaxed powders with a mean particle size of ~ 5 μm via dry milling. Wet milling studies demonstrate further size reduction with a mean grain sizes of ~ 2 to 3 μm.
Eldon Case
To improve mechanical integrity, smaller grain size is needed.

Hot Press BilletsHPMSU-01 HPMSU-02
Schock, Case
1 inch

Best ZT Materials
0
0.5
1
1.5
2
0 200 400 600 800 1000 1200 1400
Temperature (K)
CsBi4Te
6
Bi2Te
3
Tl9BiTe
6
LAST
LASTTNa
0.95Pb
20SbTe
22
TAGS
Ce0.9
Fe3CoSb
12PbTe SiGeβ -K2Bi
8Se
13

ConclusionsLAST, LASTT and SALT: promising thermoelectric materials for next generation power generation modules. (expected device efficiency ~14%)Nanostructures strongly reduce thermal conductivity.Nanostructures are closely linked to high ZT.Scaleup successful in producing large quantities but material is brittle and contains microcracks.Hot pressing and powder processing yield 3x improvement in strength.Higher average ZT (>2) needed to reach 20% efficiency.


Students and postdocsGraduate Students
Joe Sootsman, Chemistry Huijun Kong, Physics, U. of MichiganAdam Downey, Electrical EngineeringJarrod Short, Electrical EngineeringJonathan D’Angelo, Electrical EngineeringFei Ren, Chem. Engineering and Materials ScienceChris Malliakas, ChemistryKhang Hoang, PhysicsAhmed Salameh, PhysicsMayank Mittal, Mech. EngineeringAurelie Guegen, Chemistry
UndergraduatesAdam Pilchak, Materials ScienceTeresa Rhodes, ChemistryJason Johnson, Materials Science
Postdocs and Research AssociatesFerdinand Poudeu, ChemistryEd Timm, Mechanical EngineeringRobert Pcionek, ChemistryChun-I Wu, E. EngineeringJim Salvador, ChemistryChia-Her Lin, ChemistryXun Shi, Physics U of Michigan
Sponsored by