From Diversity Comes Innovation and Growth Social, Generational and Broader Demographic Matters in...
17
From Diversity Comes Innovation and Growth Social, Generational and Broader Demographic Matters in Sport Bernard Salt 11 May 2015
-
Upload
norma-osborne -
Category
Documents
-
view
218 -
download
0
Transcript of From Diversity Comes Innovation and Growth Social, Generational and Broader Demographic Matters in...
From Diversity Comes Innovation and Growth
Social, Generational and Broader Demographic Matters in Sport
Bernard Salt
11 May 2015
© 2015 KPMG, an Australian partnership and a member firm of the KPMG network of independent member firms affiliated with KPMG International Cooperative (“KPMG International”), a Swiss entity. All rights reserved.
The KPMG name, logo and "cutting through complexity" are registered trademarks or trademarks of KPMG International Cooperative ("KPMG International"). Liability limited by a scheme approved under Professional Standards Legislation.
Disclaimer
These slides are not for commercial use or redistribution. The information contained herein is of a general nature and is not intended to address the circumstances of any particular individual or entity. No one should act on such information without appropriate professional advice after a thorough examination of the particular situation. KPMG have indicated within this presentation the sources of the information provided. KPMG has not sought to independently verify those sources unless otherwise noted within the presentation. No reliance should be placed on additional oral remarks provided during the presentation, unless these are confirmed in writing by KPMG. KPMG is under no obligation in any circumstance to update this presentation, in either oral or written form, for events occurring after the presentation has been issued in final form. The findings in this presentation have been formed on the above basis.
Forecasts are based on a number of assumptions and estimates and are subject to contingencies and uncertainties. Forecasts should not be regarded as a representation or warranty by or on behalf of KPMG or any other person that such forecasts will be met. Forecasts constitute judgment and are subject to change without notice, as are statements about market trends, which are based on current market conditions.
Neither KPMG nor any member or employee of KPMG undertakes responsibility arising in any way from reliance placed by a third party on this presentation. Any reliance placed is that party’s sole responsibility. The presentation (and the accompanying slide pack) is provided solely for the benefit of the conference attendees and is not to be copied, quoted or referred to in whole or in part without KPMG’s prior written consent. KPMG accepts no responsibility to anyone other than the conference attendees for the information contained in this presentation.
Sydney
Melbourne
Hobart
Adelaide
Perth
Darwin
Brisbane
Canberra
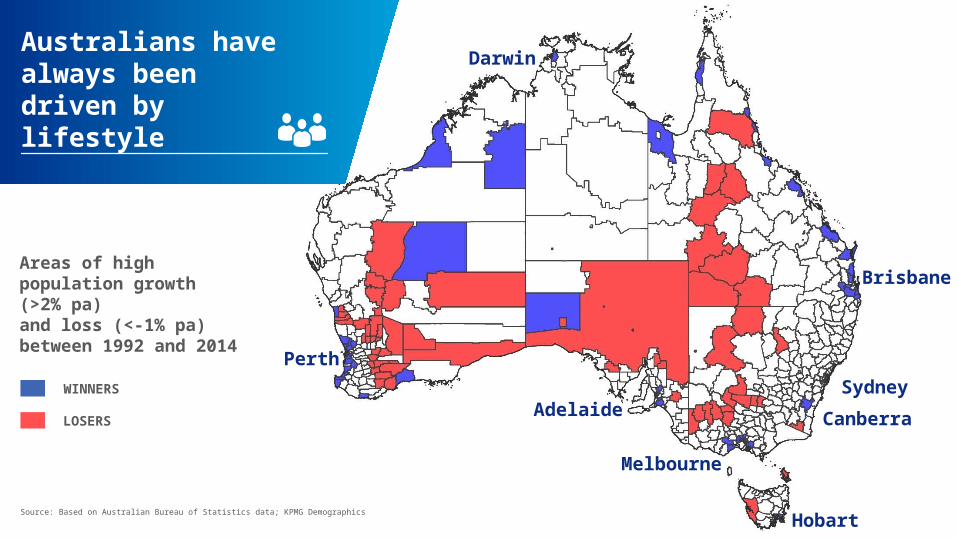
Source: Based on Australian Bureau of Statistics data; KPMG Demographics
Australians have always been driven by lifestyle
Areas of high population growth (>2% pa) and loss (<-1% pa) between 1992 and 2014
WINNERS
LOSERS
© 2015 KPMG, an Australian partnership and a member firm of the KPMG network of independent member firms affiliated with KPMG International Cooperative (“KPMG International”), a Swiss entity. All rights reserved.
The KPMG name, logo and "cutting through complexity" are registered trademarks or trademarks of KPMG International Cooperative ("KPMG International"). Liability limited by a scheme approved under Professional Standards Legislation.
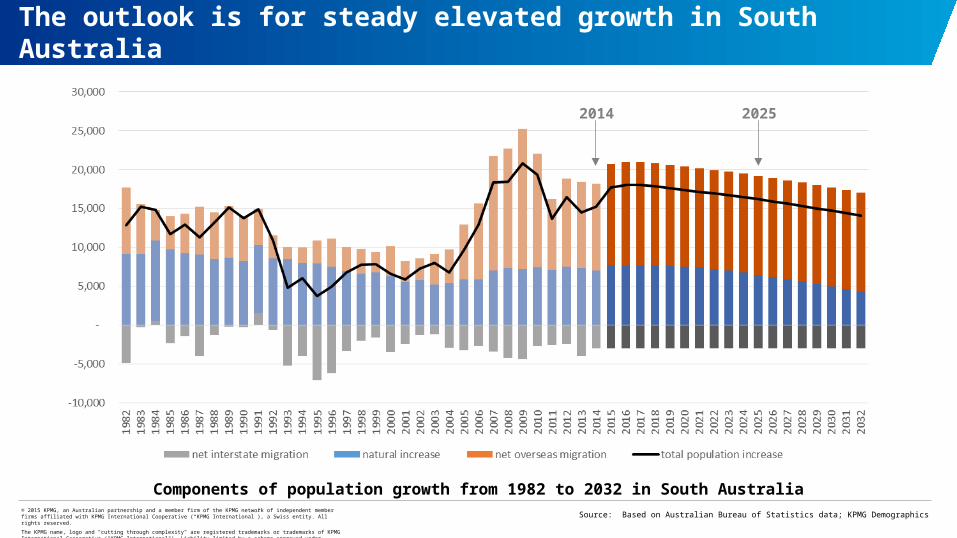
The outlook is for steady elevated growth in South Australia
Components of population growth from 1982 to 2032 in South Australia
Source: Based on Australian Bureau of Statistics data; KPMG Demographics
2014 2025
© 2015 KPMG, an Australian partnership and a member firm of the KPMG network of independent member firms affiliated with KPMG International Cooperative (“KPMG International”), a Swiss entity. All rights reserved.
The KPMG name, logo and "cutting through complexity" are registered trademarks or trademarks of KPMG International Cooperative ("KPMG International"). Liability limited by a scheme approved under Professional Standards Legislation.
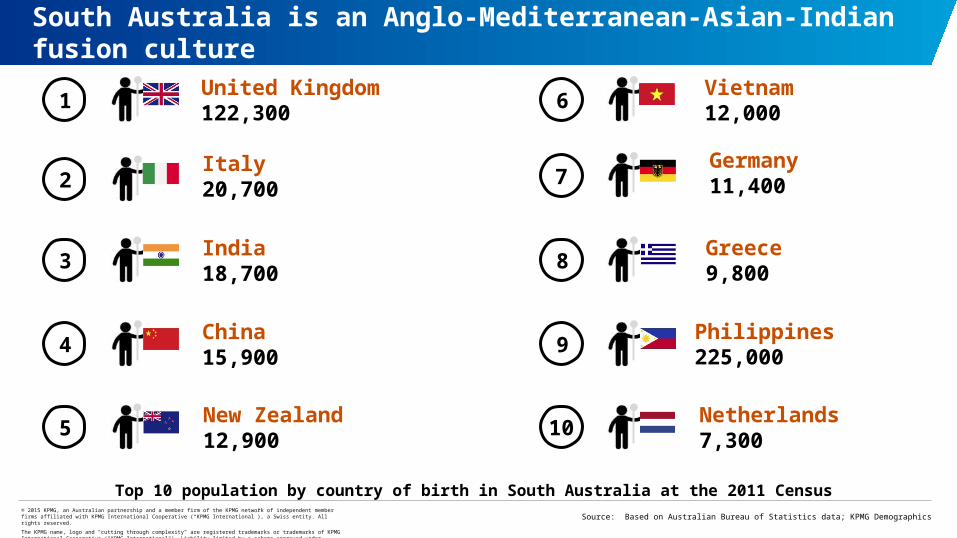
South Australia is an Anglo-Mediterranean-Asian-Indian fusion culture
Source: Based on Australian Bureau of Statistics data; KPMG Demographics
United Kingdom122,300
1
New Zealand12,900
5
China15,900
4
India18,700
3
Italy20,7002
Top 10 population by country of birth in South Australia at the 2011 Census
9Philippines225,000
Vietnam12,000
6
Greece9,800
8
Netherlands7,300
Germany11,4007
10
© 2015 KPMG, an Australian partnership and a member firm of the KPMG network of independent member firms affiliated with KPMG International Cooperative (“KPMG International”), a Swiss entity. All rights reserved.
The KPMG name, logo and "cutting through complexity" are registered trademarks or trademarks of KPMG International Cooperative ("KPMG International"). Liability limited by a scheme approved under Professional Standards Legislation.
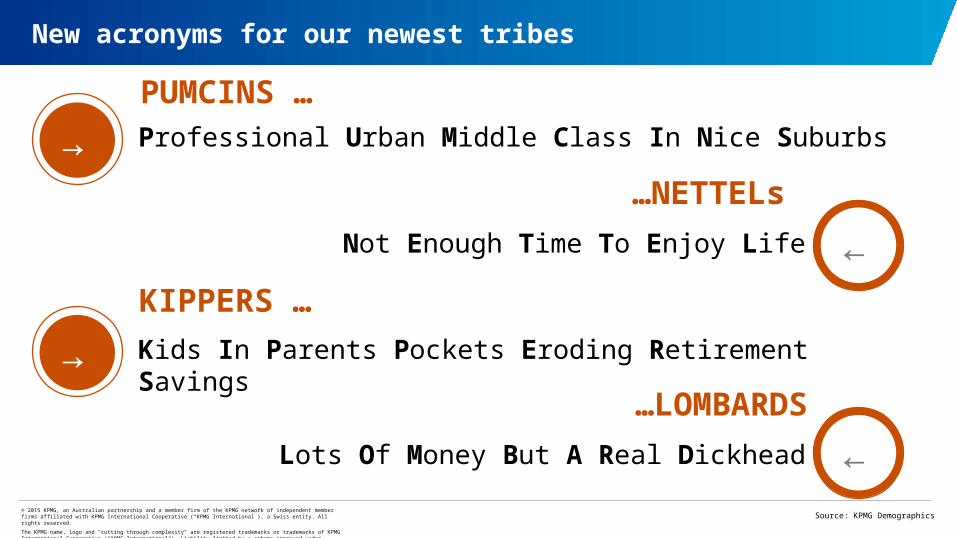
New acronyms for our newest tribes
PUMCINS …
→ Professional Urban Middle Class In Nice Suburbs
…NETTELs
←Not Enough Time To Enjoy Life
KIPPERS …
→ Kids In Parents Pockets Eroding Retirement Savings
…LOMBARDS
←Lots Of Money But A Real Dickhead
Source: KPMG Demographics
© 2015 KPMG, an Australian partnership and a member firm of the KPMG network of independent member firms affiliated with KPMG International Cooperative (“KPMG International”), a Swiss entity. All rights reserved.
The KPMG name, logo and "cutting through complexity" are registered trademarks or trademarks of KPMG International Cooperative ("KPMG International"). Liability limited by a scheme approved under Professional Standards Legislation.
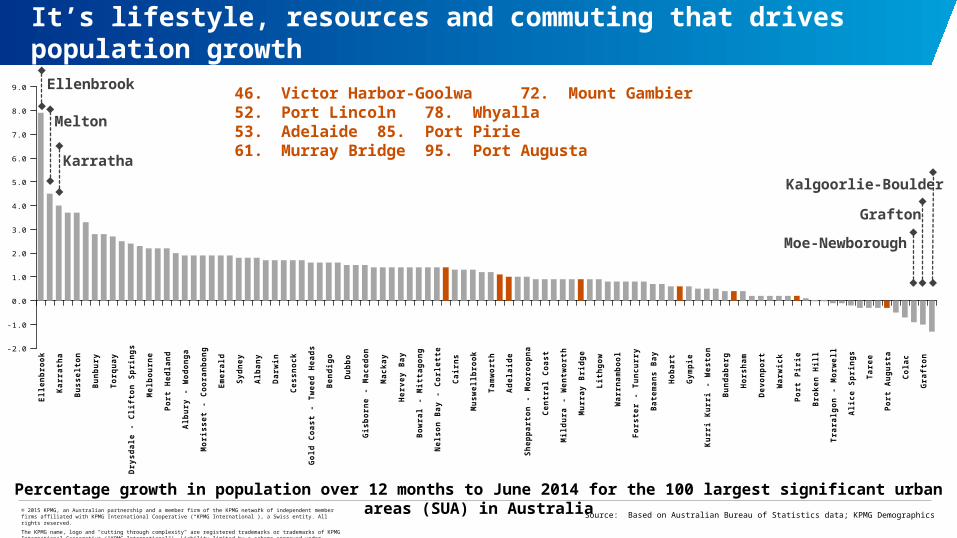
It’s lifestyle, resources and commuting that drives population growth
Percentage growth in population over 12 months to June 2014 for the 100 largest significant urban areas (SUA) in Australia
Source: Based on Australian Bureau of Statistics data; KPMG Demographics
Elle
nb
roo
k
Kar
rath
a
Bu
ssel
ton
Bu
nb
ury
To
rqu
ay
Dry
sdal
e -
Clif
ton
Sp
rin
gs
Mel
bo
urn
e
Po
rt H
edla
nd
Alb
ury
- W
od
on
ga
Mo
riss
et -
Co
ora
nb
on
g
Em
eral
d
Syd
ney
Alb
any
Dar
win
Ces
sno
ck
Go
ld C
oas
t -
Tw
eed
Hea
ds
Ben
dig
o
Du
bb
o
Gis
bo
rne
- M
aced
on
Mac
kay
Her
vey
Bay
Bo
wra
l - M
itta
go
ng
Nel
son
Bay
- C
orl
ette
Cai
rns
Mu
swel
lbro
ok
Tam
wo
rth
Ad
elai
de
Sh
epp
arto
n -
Mo
oro
op
na
Cen
tral
Co
ast
Mild
ura
- W
entw
ort
h
Mu
rray
Bri
dg
e
Lit
hg
ow
War
rnam
bo
ol
Fo
rste
r -
Tu
ncu
rry
Bat
eman
s B
ay
Ho
bar
t
Gym
pie
Ku
rri K
urr
i - W
esto
n
Bu
nd
aber
g
Ho
rsh
am
Dev
on
po
rt
War
wic
k
Po
rt P
irie
Bro
ken
Hill
Tra
ralg
on
- M
orw
ell
Alic
e S
pri
ng
s
Tar
ee
Po
rt A
ug
ust
a
Co
lac
Gra
fto
n
-2.0
-1.0
0.0
1.0
2.0
3.0
4.0
5.0
6.0
7.0
8.0
9.0
Melton
Ellenbrook
Kalgoorlie-Boulder
46. Victor Harbor-Goolwa 72. Mount Gambier52. Port Lincoln 78. Whyalla53. Adelaide 85. Port Pirie61. Murray Bridge 95. Port Augusta
Moe-Newborough
Karratha
Grafton
© 2015 KPMG, an Australian partnership and a member firm of the KPMG network of independent member firms affiliated with KPMG International Cooperative (“KPMG International”), a Swiss entity. All rights reserved.
The KPMG name, logo and "cutting through complexity" are registered trademarks or trademarks of KPMG International Cooperative ("KPMG International"). Liability limited by a scheme approved under Professional Standards Legislation.
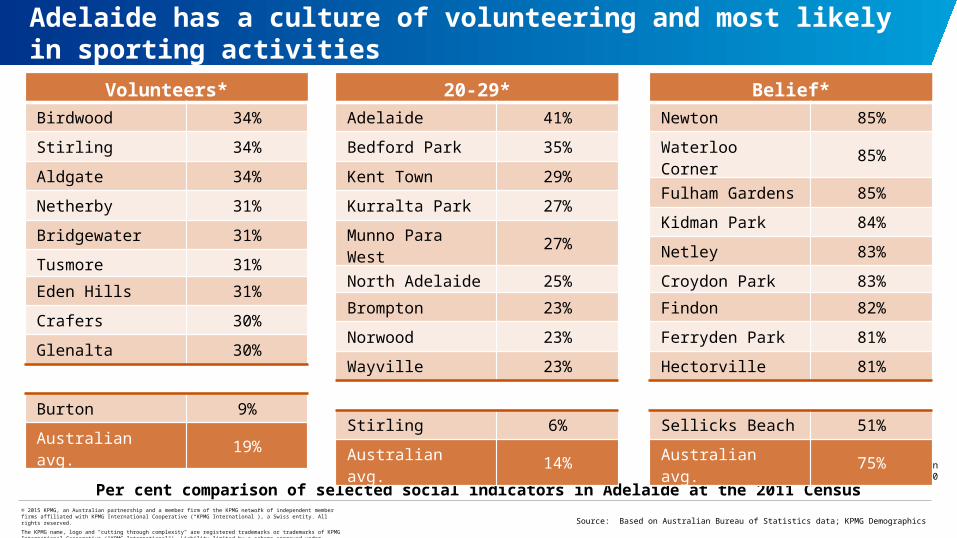
Adelaide has a culture of volunteering and most likely in sporting activities
* Excludes suburbs with total population less than 1,000
Source: Based on Australian Bureau of Statistics data; KPMG Demographics
Per cent comparison of selected social indicators in Adelaide at the 2011 Census
Volunteers*
Birdwood 34%
Stirling 34%
Aldgate 34%
Netherby 31%
Bridgewater 31%
Tusmore 31%
Eden Hills 31%
Crafers 30%
Glenalta 30%
Burton 9%
Australian avg. 19%
20-29*
Adelaide 41%
Bedford Park 35%
Kent Town 29%
Kurralta Park 27%
Munno Para West 27%
North Adelaide 25%
Brompton 23%
Norwood 23%
Wayville 23%
Stirling 6%
Australian avg. 14%
Belief*
Newton 85%
Waterloo Corner 85%
Fulham Gardens 85%
Kidman Park 84%
Netley 83%
Croydon Park 83%
Findon 82%
Ferryden Park 81%
Hectorville 81%
Sellicks Beach 51%
Australian avg. 75%
© 2015 KPMG, an Australian partnership and a member firm of the KPMG network of independent member firms affiliated with KPMG International Cooperative (“KPMG International”), a Swiss entity. All rights reserved.
The KPMG name, logo and "cutting through complexity" are registered trademarks or trademarks of KPMG International Cooperative ("KPMG International"). Liability limited by a scheme approved under Professional Standards Legislation.
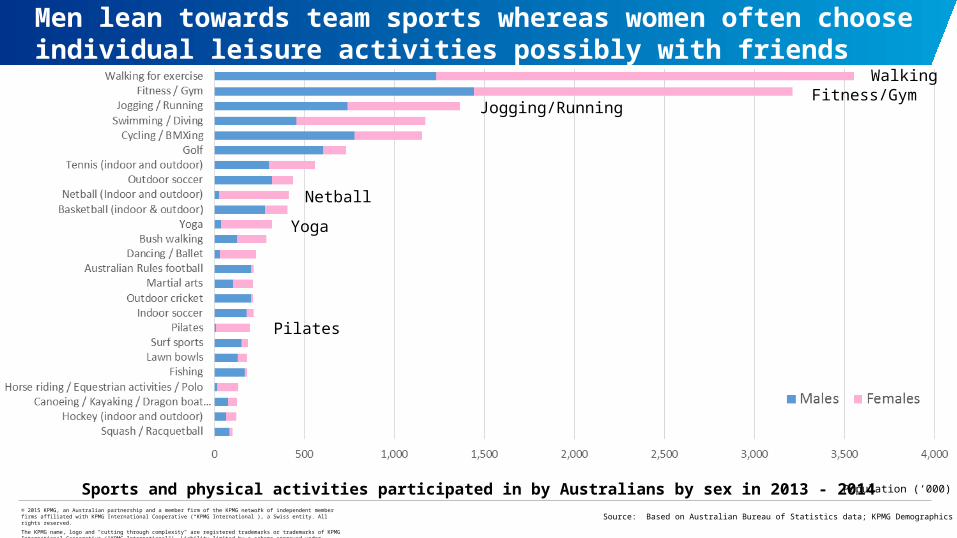
Men lean towards team sports whereas women often choose individual leisure activities possibly with friends
Source: Based on Australian Bureau of Statistics data; KPMG Demographics
Sports and physical activities participated in by Australians by sex in 2013 - 2014 Population (‘000)
Fitness/GymWalking
Jogging/Running
Yoga
Pilates
Netball
© 2015 KPMG, an Australian partnership and a member firm of the KPMG network of independent member firms affiliated with KPMG International Cooperative (“KPMG International”), a Swiss entity. All rights reserved.
The KPMG name, logo and "cutting through complexity" are registered trademarks or trademarks of KPMG International Cooperative ("KPMG International"). Liability limited by a scheme approved under Professional Standards Legislation.
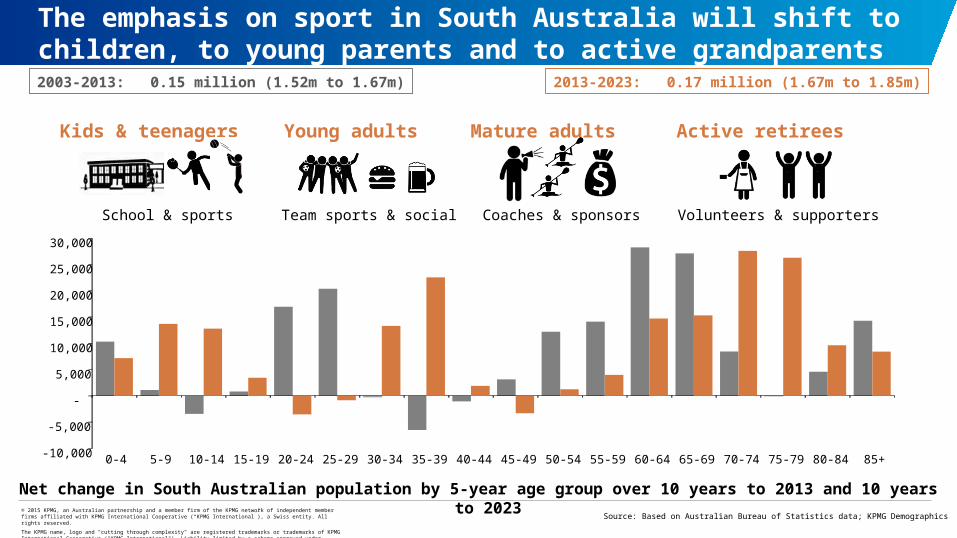
Net change in South Australian population by 5-year age group over 10 years to 2013 and 10 years to 2023
Source: Based on Australian Bureau of Statistics data; KPMG Demographics
The emphasis on sport in South Australia will shift to children, to young parents and to active grandparents
-10,000
-5,000
-
5,000
10,000
15,000
20,000
25,000
30,000
0-4 5-9 10-14 15-19 20-24 25-29 30-34 35-39 40-44 45-49 50-54 55-59 60-64 65-69 70-74 75-79 80-84 85+
2003-2013: 0.15 million (1.52m to 1.67m)
Kids & teenagers
School & sports
Active retirees
Volunteers & supportersCoaches & sponsors
Mature adultsYoung adults
Team sports & social
2013-2023: 0.17 million (1.67m to 1.85m)
© 2015 KPMG, an Australian partnership and a member firm of the KPMG network of independent member firms affiliated with KPMG International Cooperative (“KPMG International”), a Swiss entity. All rights reserved.
The KPMG name, logo and "cutting through complexity" are registered trademarks or trademarks of KPMG International Cooperative ("KPMG International"). Liability limited by a scheme approved under Professional Standards Legislation.
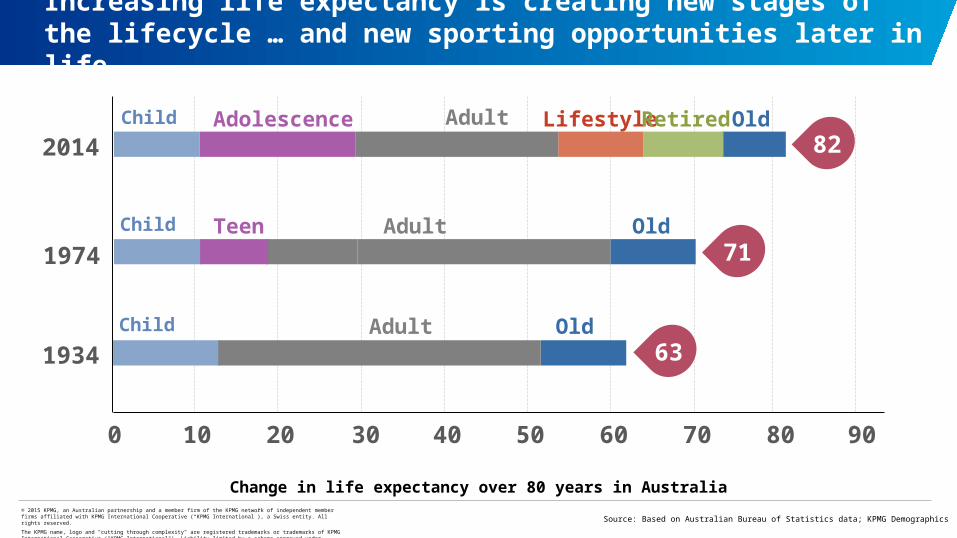
Increasing life expectancy is creating new stages of the lifecycle … and new sporting opportunities later in life
Source: Based on Australian Bureau of Statistics data; KPMG Demographics
0 9010 20 30 40 50 60 70 80
Child Adult Old
1934
Child Teen OldAdult
1974 71
Child Adolescence Lifestyle OldRetired2014
Adult82
63
Change in life expectancy over 80 years in Australia
© 2015 KPMG, an Australian partnership and a member firm of the KPMG network of independent member firms affiliated with KPMG International Cooperative (“KPMG International”), a Swiss entity. All rights reserved.
The KPMG name, logo and "cutting through complexity" are registered trademarks or trademarks of KPMG International Cooperative ("KPMG International"). Liability limited by a scheme approved under Professional Standards Legislation.
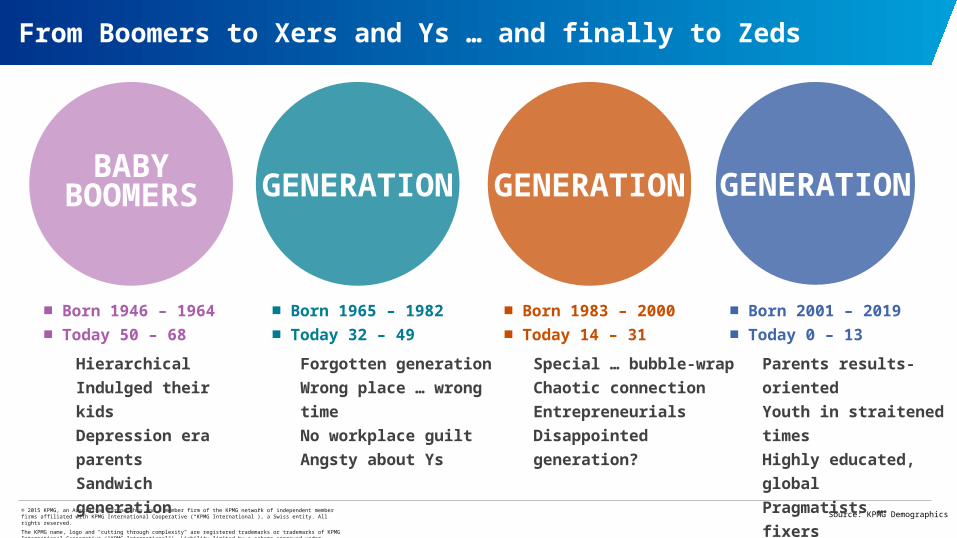
From Boomers to Xers and Ys … and finally to Zeds
Source: KPMG Demographics
Forgotten generation
Wrong place … wrong time
No workplace guilt
Angsty about Ys
XGENERATION
■ Born 1965 – 1982
■ Today 32 – 49
Hierarchical
Indulged their kids
Depression era parents
Sandwich generation
BABYBOOMERS
■ Born 1946 – 1964
■ Today 50 – 68
YGENERATION
Special … bubble-wrap
Chaotic connection
Entrepreneurials
Disappointed generation?
■ Born 1983 – 2000
■ Today 14 – 31
Parents results-oriented
Youth in straitened times
Highly educated, global
Pragmatists … fixers
ZGENERATION
■ Born 2001 – 2019
■ Today 0 – 13
© 2015 KPMG, an Australian partnership and a member firm of the KPMG network of independent member firms affiliated with KPMG International Cooperative (“KPMG International”), a Swiss entity. All rights reserved.
The KPMG name, logo and "cutting through complexity" are registered trademarks or trademarks of KPMG International Cooperative ("KPMG International"). Liability limited by a scheme approved under Professional Standards Legislation.
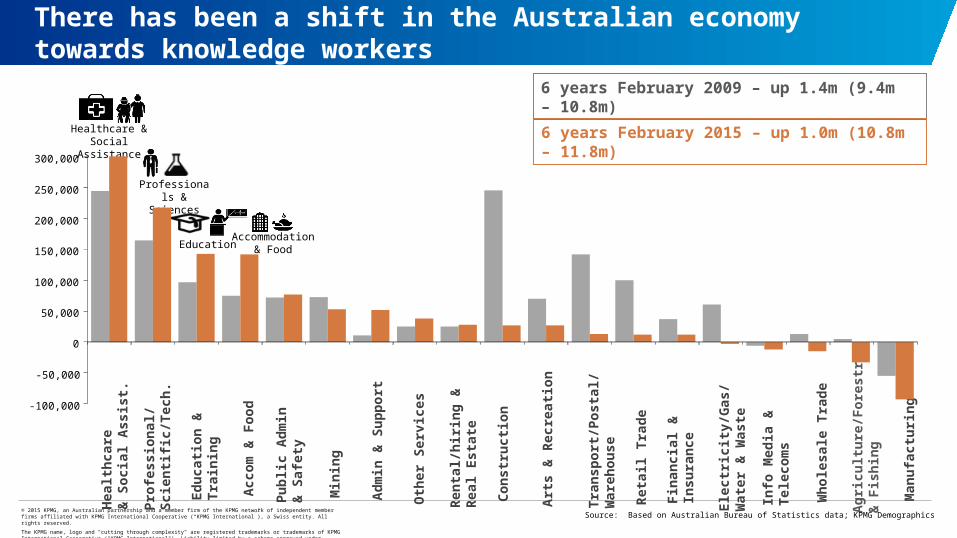
There has been a shift in the Australian economy towards knowledge workers
Hea
lth
care
& S
oci
al A
ssis
t.
Pro
fess
ion
al/
Sci
enti
fic/
Tech
.
Pu
blic
Ad
min
&
Saf
ety
Acc
om
& F
oo
d
Ad
min
& S
up
po
rt
Min
ing
Ed
uca
tio
n &
Trai
nin
g
Art
s &
Rec
reat
ion
Fin
anci
al &
Insu
ran
ce
Oth
er S
ervi
ces
Ret
ail T
rad
e
Wh
ole
sale
Tra
de
Ren
tal/h
irin
g &
Rea
l Est
ate
Info
Med
ia &
Te
leco
ms
Man
ufa
ctu
rin
g
6 years February 2009 – up 1.4m (9.4m – 10.8m)
Ele
ctri
city
/Gas
/W
ater
& W
aste
Ag
ricu
ltu
re/F
ore
stry
&
Fis
hin
g
Tran
spo
rt/P
ost
al/
War
eho
use
Healthcare & Social Assistance
Professionals & Sciences
EducationAccommodation
& Food
6 years February 2015 – up 1.0m (10.8m – 11.8m)
-100,000
-50,000
0
50,000
100,000
150,000
200,000
250,000
300,000
Co
nst
ruct
ion
Source: Based on Australian Bureau of Statistics data; KPMG Demographics
© 2015 KPMG, an Australian partnership and a member firm of the KPMG network of independent member firms affiliated with KPMG International Cooperative (“KPMG International”), a Swiss entity. All rights reserved.
The KPMG name, logo and "cutting through complexity" are registered trademarks or trademarks of KPMG International Cooperative ("KPMG International"). Liability limited by a scheme approved under Professional Standards Legislation.
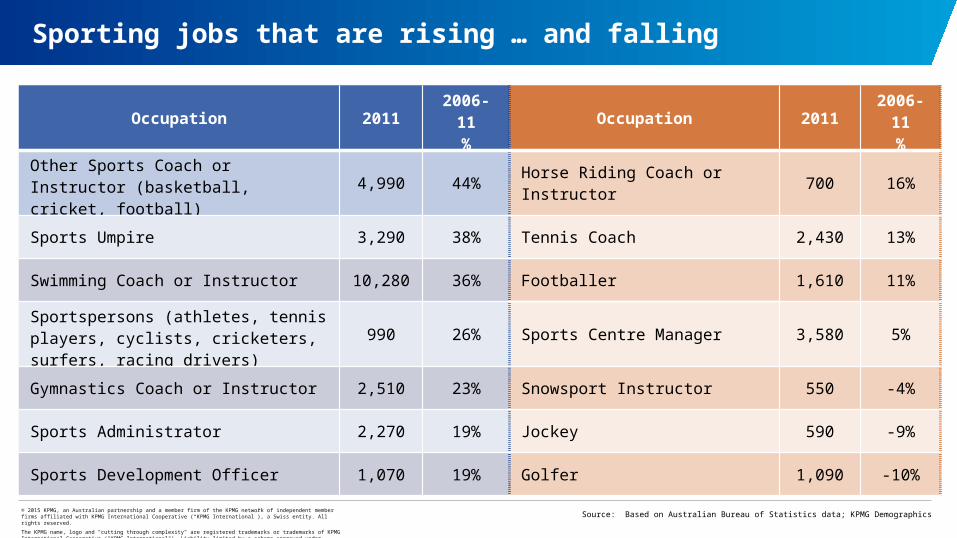
Sporting jobs that are rising … and falling
Net change in sports-related occupations in Australia over 5 years to 2011
Source: Based on Australian Bureau of Statistics data; KPMG Demographics
Occupation 20112006-11
%Occupation 2011
2006-11%
Other Sports Coach or Instructor (basketball, cricket, football)
4,990 44% Horse Riding Coach or Instructor 700 16%
Sports Umpire 3,290 38% Tennis Coach 2,430 13%
Swimming Coach or Instructor 10,280 36% Footballer 1,610 11%
Sportspersons (athletes, tennis players, cyclists, cricketers, surfers, racing drivers)
990 26% Sports Centre Manager 3,580 5%
Gymnastics Coach or Instructor 2,510 23% Snowsport Instructor 550 -4%
Sports Administrator 2,270 19% Jockey 590 -9%
Sports Development Officer 1,070 19% Golfer 1,090 -10%
© 2015 KPMG, an Australian partnership and a member firm of the KPMG network of independent member firms affiliated with KPMG International Cooperative (“KPMG International”), a Swiss entity. All rights reserved.
The KPMG name, logo and "cutting through complexity" are registered trademarks or trademarks of KPMG International Cooperative ("KPMG International"). Liability limited by a scheme approved under Professional Standards Legislation.
Source: KPMG Demographics
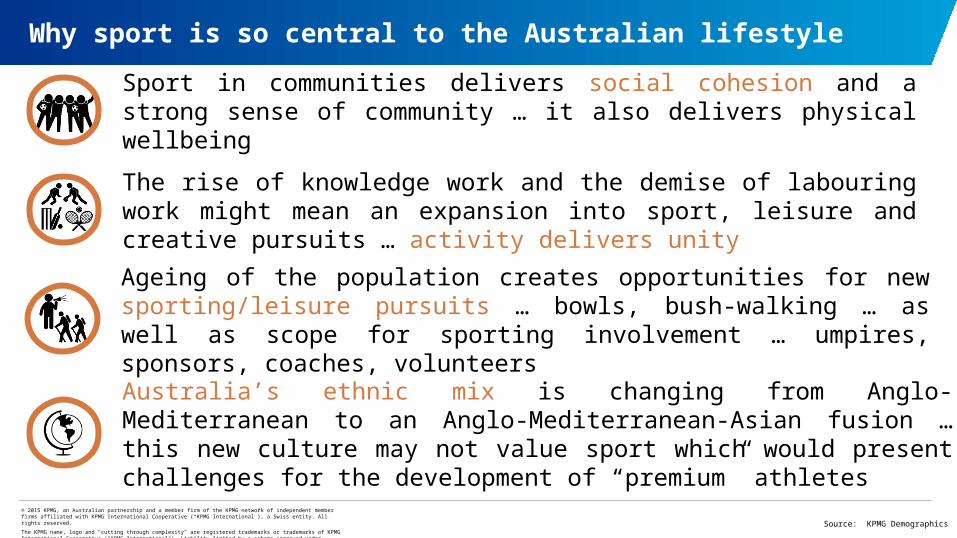
Why sport is so central to the Australian lifestyle
Sport in communities delivers social cohesion and a strong sense of community … it also delivers physical wellbeing
Australia’s ethnic mix is changing from Anglo-Mediterranean to an Anglo-Mediterranean-Asian fusion … this new culture may not value sport which would present challenges for the development of “premium” athletes
Ageing of the population creates opportunities for new sporting/leisure pursuits … bowls, bush-walking … as well as scope for sporting involvement … umpires, sponsors, coaches, volunteers
The rise of knowledge work and the demise of labouring work might mean an expansion into sport, leisure and creative pursuits … activity delivers unity
© 2015 KPMG, an Australian partnership and a member firm of the KPMG network of independent member firms affiliated with KPMG International Cooperative (“KPMG International”), a Swiss entity. All rights reserved.
The KPMG name, logo and "cutting through complexity" are registered trademarks or trademarks of KPMG International Cooperative ("KPMG International"). Liability limited by a scheme approved under Professional Standards Legislation.
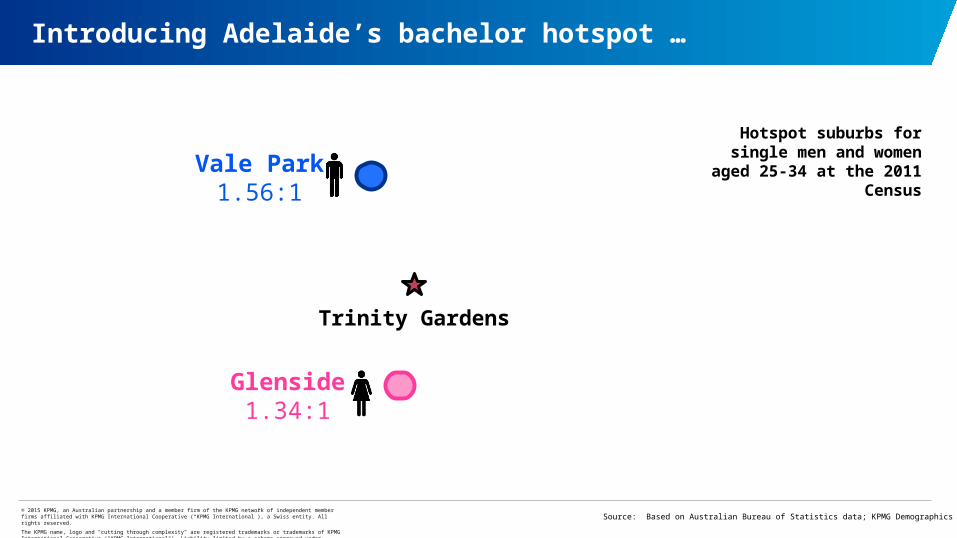
Introducing Adelaide’s bachelor hotspot …
Source: Based on Australian Bureau of Statistics data; KPMG Demographics
Hotspot suburbs for single men and women aged 25-34
at the 2011 CensusVale Park1.56:1
Trinity Gardens
Glenside1.34:1
© 2015 KPMG, an Australian partnership and a member firm of the KPMG network of independent member firms affiliated with KPMG International Cooperative (“KPMG International”), a Swiss entity. All rights reserved.
The KPMG name, logo and "cutting through complexity" are registered trademarks or trademarks of KPMG International Cooperative ("KPMG International"). Liability limited by a scheme approved under Professional Standards Legislation.
@bernardsalt
Bernard Salt Demographer
linkedin.com/in/bernardsalt
+61 3 9288 5047
www.bernardsalt.com.au
@bernardsalt
Connect