FROM CAR TO BIKE. (DTU – 2013) Share of Cycling trips and km on different distances.
20
FROM CAR TO BIKE
-
Upload
eustacia-allison -
Category
Documents
-
view
217 -
download
1
Transcript of FROM CAR TO BIKE. (DTU – 2013) Share of Cycling trips and km on different distances.
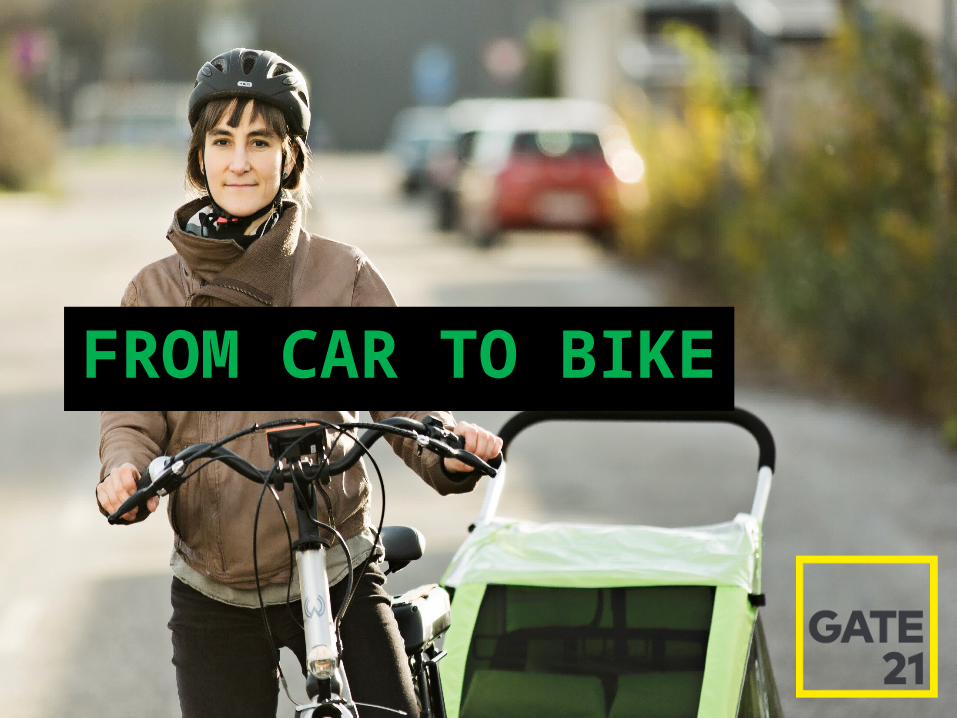
FROM CAR TO BIKE

(DTU – 2013)
Share of Cycling trips and km on different distances

THE POTENTIAL
28% of all commuters have less than 10 km to work
(DTU – 2013)

WE NEED A DISRUPTION

THE CAMPAIGN

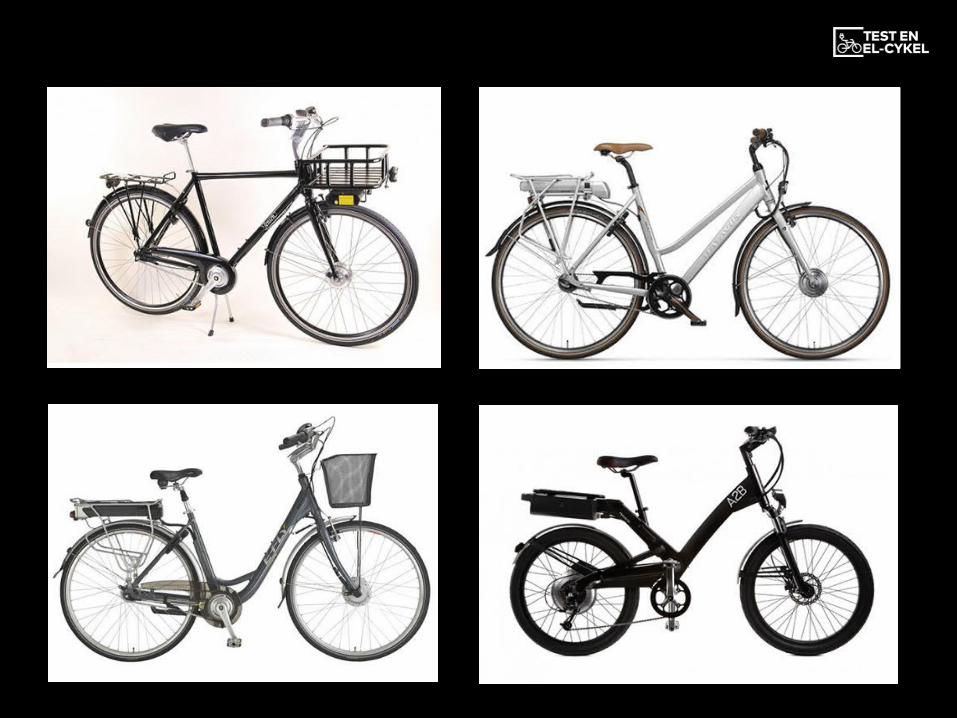
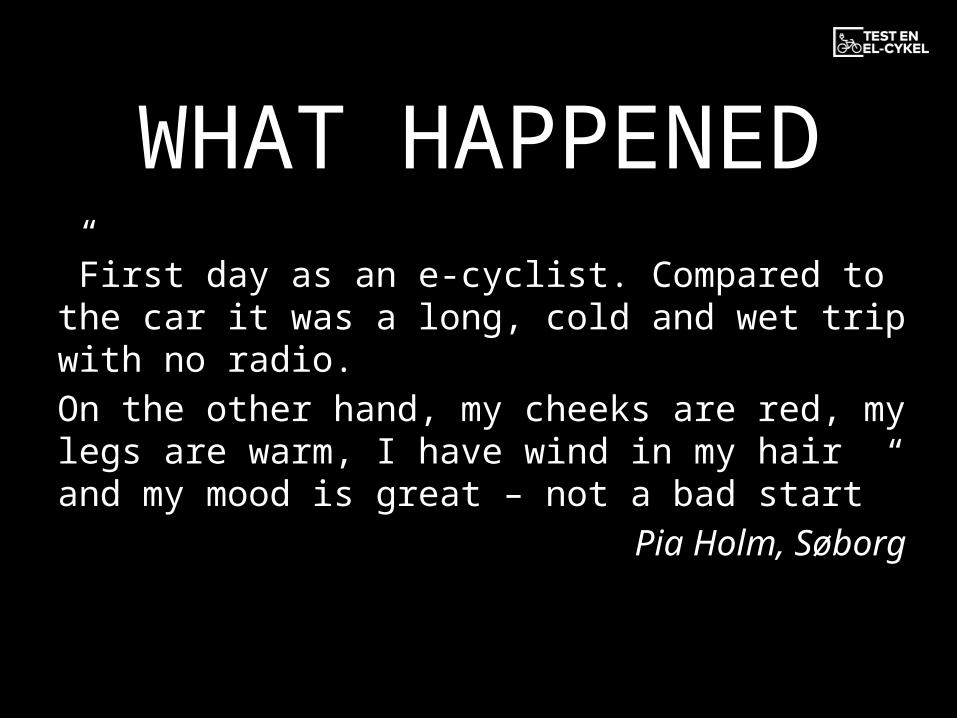
WHAT HAPPENED”First day as an e-cyclist. Compared to the car it was a long, cold and wet trip with no radio.
On the other hand, my cheeks are red, my legs are warm, I have wind in my hair and my mood is great – not a bad start”
Pia Holm, Søborg
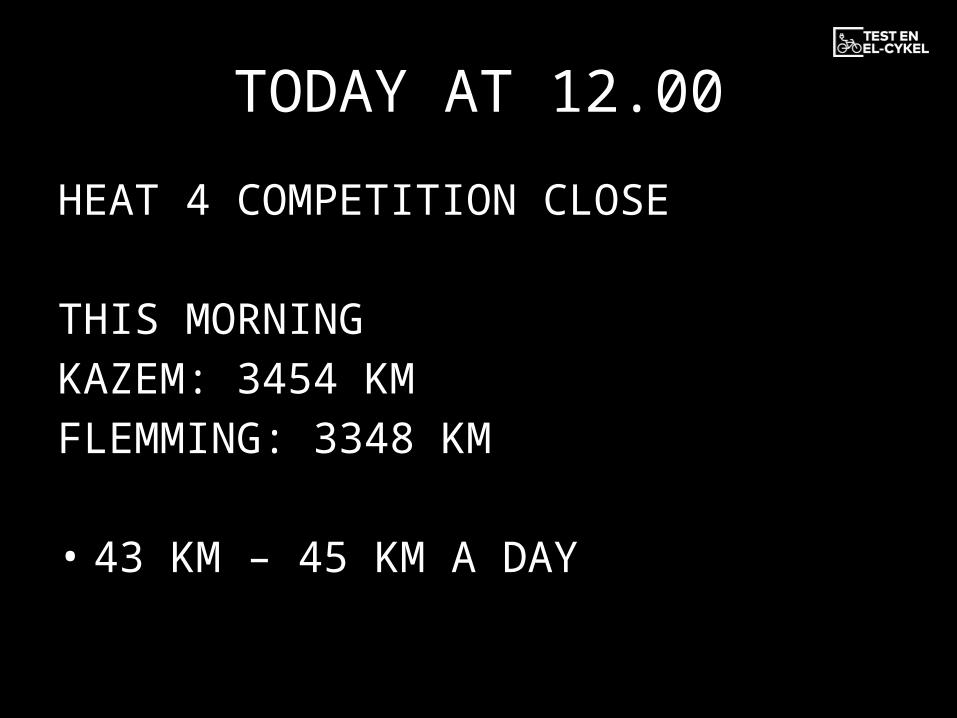
TODAY AT 12.00
HEAT 4 COMPETITION CLOSE
THIS MORNINGKAZEM: 3454 KMFLEMMING: 3348 KM
• 43 KM – 45 KM A DAY

RESULTS
SURVEYSBEFORE, AFTER,
3 MONTHS AFTER
675 PATICIPANTS

47% continues to cycle to work minimum one day per week
35% cycle 3-5 days per week
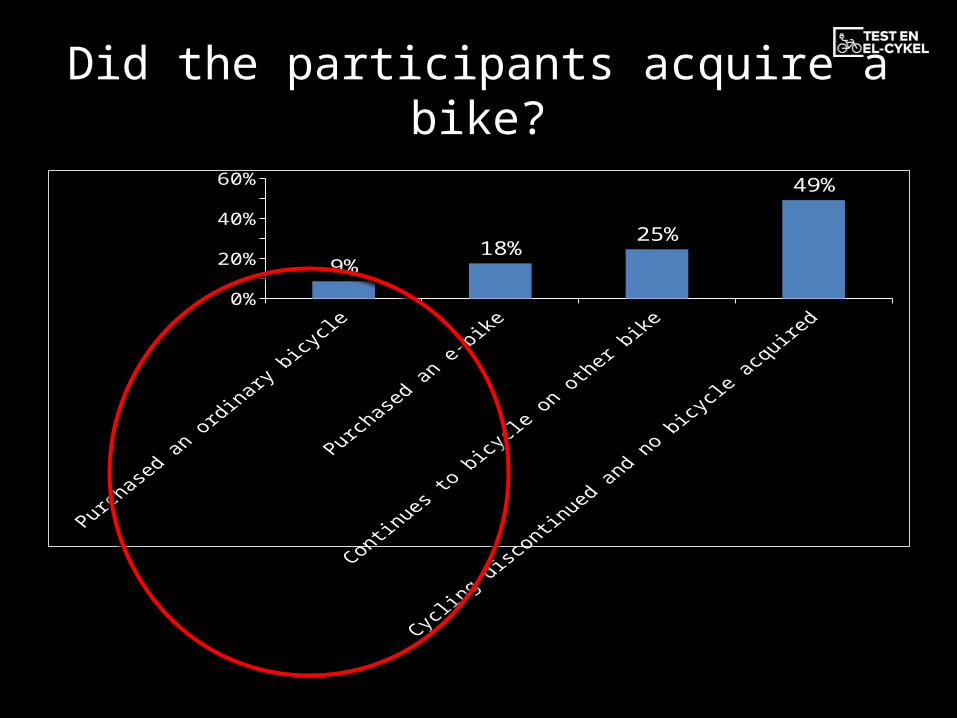
Did the participants acquire a bike?
Purchase
d an ordinary
bicycle
Purchase
d an e-
bike
Continues to bicy
cle on other
bike
Cyclin
g disc
ontinued an
d no bicycle
acquire
d0%
10%20%30%40%50%60%
9%18%
25%
49%
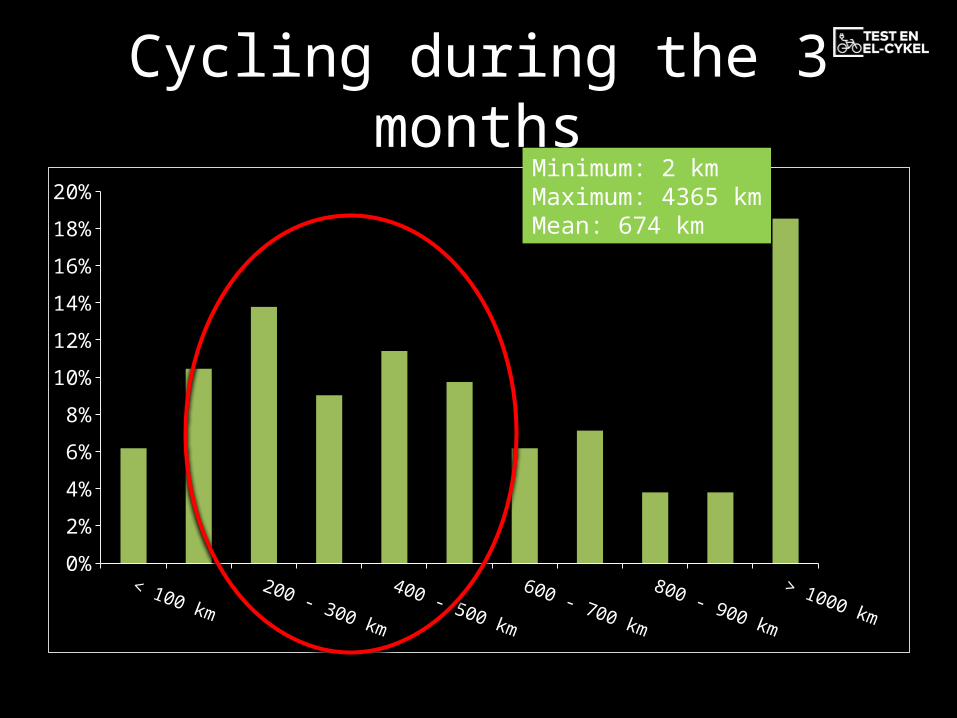
Cycling during the 3 months
0%
2%
4%
6%
8%
10%
12%
14%
16%
18%
20%Minimum: 2 kmMaximum: 4365 kmMean: 674 km
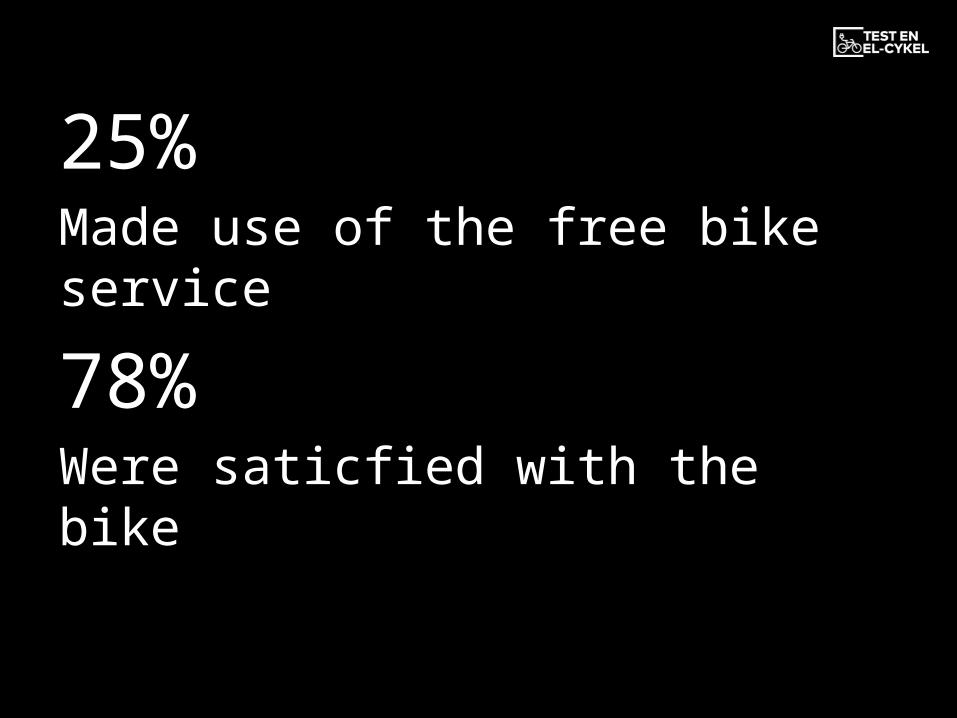
25%Made use of the free bike service
78% Were saticfied with the bike
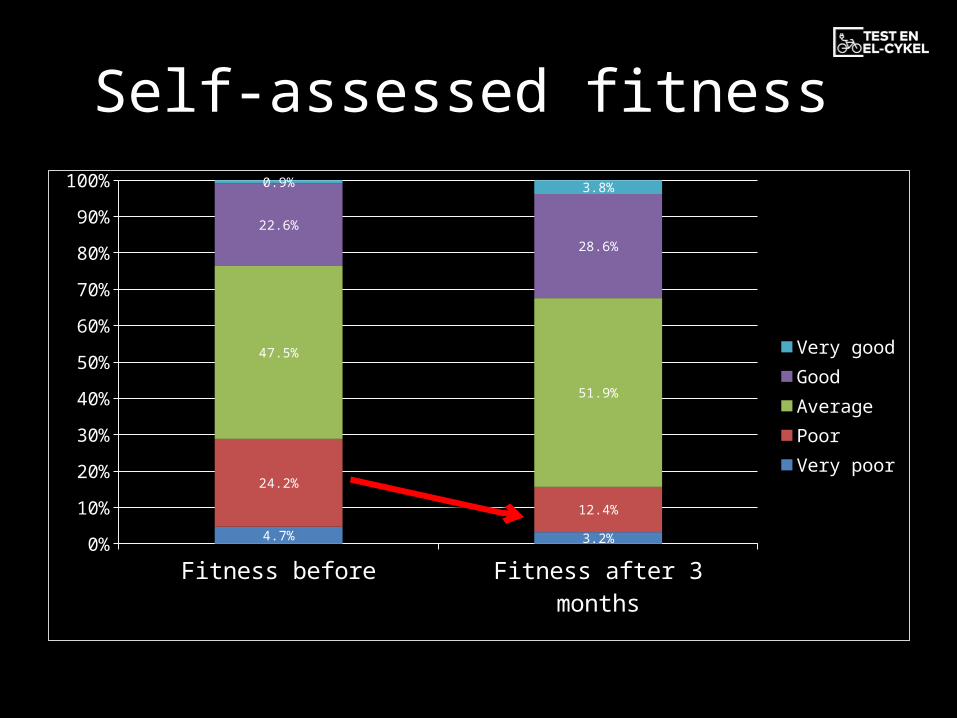
Self-assessed fitness
Fitness before Fitness after 3 months0%
10%
20%
30%
40%
50%
60%
70%
80%
90%
100%
4.7% 3.2%
24.2%
12.4%
47.5%
51.9%
22.6%
28.6%
0.9% 3.8%
Very goodGoodAveragePoorVery poor

What motivates continued cycling after the experiment?
Other= transport/functionality, parking, personal freedam etc.
Being a role-model
Getting out in nature/green areas
Cutting CO2/care for the environment
Increase speed (shorter commuting time)
Other motives
Loosing weight
Cutting commuting costs
To get releif from stress
Getting fresh air
For mental energy/surplus
Getting in shape
0% 5% 10% 15% 20% 25% 30% 35%
1%
2%
3%
6%
7%
7%
7%
7%
12%
16%
32%Chart Title
• Will this work in your country?• How can you use these
experiences?
HABITS CAN BE CHANGEDOur Test cyclist are very happy