From Big Data To Important Information - arXiv.org e-Print … · · 2016-04-05From Big Data To...
24
From Big Data To Important Information Yaneer Bar-Yam New England Complex Systems Institute 210 Broadway, Suite 101, Cambridge, MA 02139, USA (Dated: April 1, 2016) Advances in science are being sought in newly available opportunities to collect massive quantities of data about complex systems. While key advances are being made in detailed mapping of systems, how to relate this data to solving many of the challenges facing humanity is unclear. The questions we often wish to address require identifying the impact of interventions on the system and that impact is not apparent in the detailed data that is available. Here we review key concepts and motivate a general framework for building larger scale views of complex systems and for characterizing the importance of information in physical, biological and social systems. We provide examples of its application to evolutionary biology with relevance to ecology, biodiversity, pandemics, and human lifespan, and in the context of social systems with relevance to ethnic violence, global food prices, and stock market panic. Framing scientific inquiry as an effort to determine what is important and unimportant is a means for advancing our understanding and addressing many practical concerns, such as economic development or treating disease. I. OVERVIEW Changing disease to health and economic instability to growth are among the complex challenges we face to- day. How can we turn the massive quantities of data that are increasingly available towards addressing these pressing problems? The data provide abundant detail, but generally carry no labels for guidance about which pieces of information are important for determining suc- cessful interventions. The questions we need to address are about properties of complex systems—human phys- iology, the global economy. Addressing questions about such systems requires disentangling the intricate depen- dencies and multiple causes and effects of behaviors, and recognizing that behaviors range across scales from mi- croscopic to macroscopic. Here we argue that the key to addressing these ques- tions is to focus on the way behavior at different scales are related, and how dependencies within a system lead to the large scale patterns of behavior that can be char- acterized directly without mapping all of the intricate details. The approach builds upon an understanding of how to aggregate component behaviors to identify larger scale behaviors, an approach developed in the “renor- malization group” study of phase transitions in physics, and generalized here to multiscale information theory. In this framework, information itself has scale and larger scale information is the most important information to know, with progressively finer scale information only of importance to provide detail when necessary. This anal- ysis focuses attention on information characterizing how to affect the largest scale behaviors of the system. The method is a shortcut for the infeasible effort of mapping all of the causes and effects that extend from molecular to global scales of biological and social systems. Specific causes and effects that need to be studied are only a few compared to the many that underly the system behavior at all scales. It is thus a tremendous simplification com- pared to extending traditional approaches to the desired outcome. On the other hand, the resulting formalism is challenging to execute in particular circumstances. When properly applied, the result is clear guidance about how to intervene and solve major problems, a result justify- ing the high level of directed effort involved. Successful examples demonstrate it is possible to apply it to a wide variety of scientific questions and real world problems, though many aspects of how to proceed more generally remain to be developed. Where the effects of interest range across scales, other methods must be applied. Both opportunities and limitations of the method can be un- derstood within the general formalism that describes the approach. The approach is complementary to many other strate- gies that are usefully applied to complex systems, in- cluding not just big data but also network models, agent based models, game theory, system dynamics, machine learning, stochastic modeling, coupled differential equa- tions, and other frameworks whose starting point is a par- ticular representational framework. It is closer in spirit to fractals and chaos in their attention to the role of scales, but as with the other approaches, it does not adopt their specific representational strategies. In the approach de- scribed here the strategy is to describe the largest scale behaviors with a minimal but faithful representation, and each of the different representational strategies, or com- binations of them, may be used as appropriate. This paper reviews and extends basic approaches to the quantitative analysis of systems. While many of the concepts have been developed in physics, the generaliza- tion provided here can be better applied across complex biological and social systems. The paper is written to be accessible to a wide audience and yet to provide essential insights that are important for physicists and mathemati- cians that are interested in expanding the quantitative understanding of complex systems. Despite the effort to make it accessible, it is not a general tutorial in complex systems science concepts and methods, for which other resources are available [1, 2]. Reviewing certain basic arXiv:1604.00976v1 [physics.soc-ph] 4 Apr 2016
Transcript of From Big Data To Important Information - arXiv.org e-Print … · · 2016-04-05From Big Data To...

From Big Data To Important Information
Yaneer Bar-YamNew England Complex Systems Institute
210 Broadway, Suite 101, Cambridge, MA 02139, USA(Dated: April 1, 2016)
Advances in science are being sought in newly available opportunities to collect massive quantitiesof data about complex systems. While key advances are being made in detailed mapping of systems,how to relate this data to solving many of the challenges facing humanity is unclear. The questions weoften wish to address require identifying the impact of interventions on the system and that impactis not apparent in the detailed data that is available. Here we review key concepts and motivatea general framework for building larger scale views of complex systems and for characterizing theimportance of information in physical, biological and social systems. We provide examples of itsapplication to evolutionary biology with relevance to ecology, biodiversity, pandemics, and humanlifespan, and in the context of social systems with relevance to ethnic violence, global food prices,and stock market panic. Framing scientific inquiry as an effort to determine what is important andunimportant is a means for advancing our understanding and addressing many practical concerns,such as economic development or treating disease.
I. OVERVIEW
Changing disease to health and economic instabilityto growth are among the complex challenges we face to-day. How can we turn the massive quantities of datathat are increasingly available towards addressing thesepressing problems? The data provide abundant detail,but generally carry no labels for guidance about whichpieces of information are important for determining suc-cessful interventions. The questions we need to addressare about properties of complex systems—human phys-iology, the global economy. Addressing questions aboutsuch systems requires disentangling the intricate depen-dencies and multiple causes and effects of behaviors, andrecognizing that behaviors range across scales from mi-croscopic to macroscopic.
Here we argue that the key to addressing these ques-tions is to focus on the way behavior at different scalesare related, and how dependencies within a system leadto the large scale patterns of behavior that can be char-acterized directly without mapping all of the intricatedetails. The approach builds upon an understanding ofhow to aggregate component behaviors to identify largerscale behaviors, an approach developed in the “renor-malization group” study of phase transitions in physics,and generalized here to multiscale information theory.In this framework, information itself has scale and largerscale information is the most important information toknow, with progressively finer scale information only ofimportance to provide detail when necessary. This anal-ysis focuses attention on information characterizing howto affect the largest scale behaviors of the system. Themethod is a shortcut for the infeasible effort of mappingall of the causes and effects that extend from molecularto global scales of biological and social systems. Specificcauses and effects that need to be studied are only a fewcompared to the many that underly the system behaviorat all scales. It is thus a tremendous simplification com-pared to extending traditional approaches to the desired
outcome. On the other hand, the resulting formalism ischallenging to execute in particular circumstances. Whenproperly applied, the result is clear guidance about howto intervene and solve major problems, a result justify-ing the high level of directed effort involved. Successfulexamples demonstrate it is possible to apply it to a widevariety of scientific questions and real world problems,though many aspects of how to proceed more generallyremain to be developed. Where the effects of interestrange across scales, other methods must be applied. Bothopportunities and limitations of the method can be un-derstood within the general formalism that describes theapproach.
The approach is complementary to many other strate-gies that are usefully applied to complex systems, in-cluding not just big data but also network models, agentbased models, game theory, system dynamics, machinelearning, stochastic modeling, coupled differential equa-tions, and other frameworks whose starting point is a par-ticular representational framework. It is closer in spirit tofractals and chaos in their attention to the role of scales,but as with the other approaches, it does not adopt theirspecific representational strategies. In the approach de-scribed here the strategy is to describe the largest scalebehaviors with a minimal but faithful representation, andeach of the different representational strategies, or com-binations of them, may be used as appropriate.
This paper reviews and extends basic approaches tothe quantitative analysis of systems. While many of theconcepts have been developed in physics, the generaliza-tion provided here can be better applied across complexbiological and social systems. The paper is written to beaccessible to a wide audience and yet to provide essentialinsights that are important for physicists and mathemati-cians that are interested in expanding the quantitativeunderstanding of complex systems. Despite the effort tomake it accessible, it is not a general tutorial in complexsystems science concepts and methods, for which otherresources are available [1, 2]. Reviewing certain basic
arX
iv:1
604.
0097
6v1
[ph
ysic
s.so
c-ph
] 4
Apr
201
6

2
concepts is necessary here as they are not typically laidout in a way that is conducive to generalization. Exam-ples are also included of applications to biological and so-cial systems. While they do not manifest the full power ofthe fundamental approach, each illustrates aspects of itsapplication to a highly complex system with real worldimportance, and without reference to the fundamental,general approach, it would be unclear how they are be-ing studied. This paper is not a “how to” but rather aconceptual framing and motivation, so that there is muchroom left for other papers to provide practical guides forfuture work.
In Section II, we review the essential nature of tra-ditional scientific approaches based upon calculus andstatistics that rely upon separation of scales of behavior.We point out why they are not effective for dependenciesof complex systems that generate multiscale patterns ofbehavior. In Section III, we describe how an essentialinsight about the breakdown of calculus and statisticsarose from the study of phase transitions in materialsleading to the development of concepts of renormaliza-tion group that uses a multiscale approach. In SectionIV, we frame a generalization of this approach to complexsystems by introducing the complexity profile, a multi-scale characterization of complex systems, and the con-cept of descriptions that are reliable at a particular scaleof observation. Section V discusses the concept of univer-sality, formalized in renormalization group, which servesin the more general complex systems context as a way torecognize the importance of characterizing the behaviorof systems at large scale. Section VI briefly addressescomplications that arise due to dynamics of amplifica-tion, dissipation and chaos which do not preserve scaleover time. Section VII provides a brief discussion of sev-eral examples, population biology, ethnic violence, thedynamics of food prices, market crashes, organizationalstructures and references to others. Finally in SectionVIII, we point out that without a focus on universal-ity, there can be no effective understanding of systems aseach individual observation is of a different microscopicstate. Thus, anchoring scientific inquiry in a scale sensi-tive approach focused on large scale behaviors is essential.Without attention to scale, any approach is destined tomiss essential large scale properties and devote most ofits attention to irrelevant fine scale details.
II. SEPARATION OF SCALES
One of the central insights about complex systems isthat the effect of dependencies among components cannotbe fully represented by traditional mathematical and con-ceptual approaches. A key to their limitation is that theyare applicable only to systems in which there is a sepa-ration of behavior between the micro and macro scales.Interactions among the parts that cause behaviors acrossscales violate this separation.
Consider a block sliding down an inclined plane. In a
v
FIG. 1: Schematic diagram of a block (with a velocity at aparticular moment, v) sliding down an inclined plane. Themacroscopic motion subject to gravity and friction may betreated using Newton’s laws of motion, while the microscopicbehavior of the atoms may be treated using thermodynamicsby considering the local oscillations of groups of atoms asrandom and independent (the probability that one group isin a particular state is independent of the state of anothergroup); the statistical treatment of that movement leads tothe determination of pressure and temperature of the blockand the inclined plane.
traditional approach, micro and macro scales are treatedseparately. To address dynamics at the micro scale—themolecules—we average over them and, using thermody-namics, describe their temperature and pressure. To ad-dress dynamics at the macro scale—the motion of theblock on the inclined plane—we use Newtonian physicsto talk about their large scale motion (see Fig. 1). Inthis case, the pieces can be considered to be acting ei-ther independently, like the random relative motion onthe micro scale, or coherently, like the average motion onthe macro scale. Since the scales are sufficiently distinct,separated by orders of magnitude, we do not encountera problem in describing them separately. Finally, oftenunstated, the structures of the block and the plane areconsidered fixed.
Thus, traditionally, there were three aspects of a sys-tem: fine scale, dynamic, and fixed. A glass of water ona table with an ice cube in it might be treated by con-sidering the movement and melting of the ice cube, theaverage over molecular vibrations, and the fixed structureof the glass. At longer time scales, the water will evap-orate, the glass will flow, the table may rot, but this isnot important at a particular scale (or a range of scales)of observation.
Consider the earth viewed from space. The earth ishighly complex. Still, we can describe it as a planet orbit-ing the sun in a predictable fashion. Most of the detailsof what happens on Earth play no role at the scale of itsorbit. For the earth, at the orbital scale, all the internalstructure can be averaged to a point. The bodies of thesolar system are assumed unchanging and the material ofeach of them is separated from other solar objects. Thedynamic behavior can then be modeled and predicted.
When separation of scales works, we can describe not
3
only the system as it exists in isolation, but also howit responds to external forces. Forces that act on theearth at the scale of orbital motion couple to the dynamicbehavior that occurs at that scale. Thus if we were toconsider a new celestial body entering the solar system,unless it disrupted the structure of the system (i.e. byshattering a planet) and as long as we continue to beinterested in the scale of orbital motion, we can describethe behavior of the system using these same degrees offreedom.
For complex systems, it is still true that the questionswe most want to answer have to do with the larger scaleinformation. Significantly, the scale of description andscale of interactions are similar. When we have a descrip-tion of the larger scale behavior we are also consideringthe larger scale impacts of the environment on the systemand reciprocally.
But many systems, especially those we are interestedin understanding and influencing, are not well describedby separate micro and macro scales. Consider a flock ofbirds. If all of the birds flew independently in differentdirections, we would need to describe each one separately.If they instead all went in the same direction, we couldsimply describe their average motion. However, if weare interested in their movement as a flock, describingeach bird’s motion would be too much information anddescribing the average would be too little information.Understanding complex behavior that is neither indepen-dent nor coherent is best described across scales. Thisrequires knowing which information can be observed ata scale of interest. A generalized framing of this examplecan be applied to a wide range of complex systems.
III. THEORY-EXPERIMENTCONTRADICTION AND MULTISCALE INSIGHT
The key ideas can be understood from the differencebetween traditional physics and an approach developedin statistical physics beginning in the 1970s anchored inthe method of renormalization group. Modeling in thisframework allows distinguishing what can be observed atthe largest scale. To explain the concepts of this formal-ism, we describe its development in the study of materi-als [3–9]. We then describe a generalization to complexbiological and social systems.
Central to the study of matter is that movements ofindividual atoms are not visible to us. Instead, we usepressure, temperature and volume to describe both whatwe see and how we can manipulate matter using forces.For example, a piston compressing a gas reduces the vol-ume and increases the pressure, and heat transfer to amaterial causes its temperature to rise. The key con-cept underlying our ability to make such descriptions isscale: The fine scale (microscopic) behaviors of atoms arenot important to an observer or to their manipulation ofa system; and the large scale (macroscopic) propertieswe observe and manipulate reflect average or aggregate
properties of atomic motion.
This approach was formalized in the 1800s throughstatistical physics. It appeared to solve the problem ofdetermining properties of a material in equilibrium byminimizing the free energy relative to the macroscopicvariables. This almost always works. However, in thestudy of phase transitions, e.g. between water and steamor between ferromagnet and paramagnet, properties werefound not to be correctly given by this method for specialconditions called second order phase transition points.This phenomenon proves to be a relatively simple illus-tration of a complex system, where the elements act nei-ther fully independently nor fully coherently, and the sep-aration of scales breaks down.
Consider the transition between water and steam. Ata particular pressure we can cause a transition betweenwater and steam by raising the temperature. At thetransition temperature the density changes abruptly—discontinuously. As we raise the pressure, we compressthe steam and the change in density at the transitiontemperature decreases (see Fig 2). There is a point wherethe transition stops, and there is no longer a distinctionbetween water and vapor. This end point is called asecond order transition point, at the end of the first or-der transition line. Near this point, the discontinuity ofthe density between liquid and gas phases becomes zero(hence the term second order transition). The way itdoes so has the form of a power law ρ ∝ xβ , where xis the distance along the transition line from the secondorder transition point. There are many other materi-als that have phase transitions lines that end at points,called second order phase transitions, or critical points.Power laws are ubiquitous near critical points. The expo-nent that was found empirically was β ≈ 0.33. The samevalue of the exponent is found in many cases, includingat critical points in both magnets and liquids [10–12].However, the theoretical prediction based upon free en-ergy minimization is found to be 0.5 [13]. The derivationstarts from an analytic expansion of the free energy in thedensity around the critical point, then setting its deriva-tive to zero to obtain the minimum (Landau theory).
This surprising discrepancy between observations andtheory compelled a dramatic change in our understand-ing. Our usual methods of calculus and statistics failat this point because their assumptions no longer holdtrue. Calculus assumes that matter is smooth and statis-tics assumes that averages over large numbers of objectsare well defined. Away from the critical point these as-sumptions are justified, since the microscopic behaviorof atoms is well separated from the macroscopic behav-ior of the material as a whole. Different parts of thematerial appear essentially the same, making it smooth,and any (local) average over atomic properties has a sin-gle well defined number. However, at the critical point,the density fluctuates—between water-like and vapor-likeconditions—so that the material is not smooth and theaverage taken of the material as a whole is not represen-tative of the density at any particular location or time.

4
Pres
ssur
e
Temperature
Solid (ice)
Liquid (water)
Gas (water vapor)
critical temperature
critical pressure
critical point
FIG. 2: The phase diagram of water. The line of transi-tions between liquid water and water vapor stops at the crit-ical point (red dot). At that point the fluctuations betweenliquid-like and vapor-like densities extend across the systemso that the system is not smooth (violating the assumptionsof calculus) and averages are not well behaved (violating theassumptions of statistics). A new method that considers be-haviors across scales, renormalization group, was developedto address this and similar questions.
Near the critical point, the matter is composed of patchesof lower and higher density, and this patchiness occurs onall scales, even at the macroscopic scale.
In order to mathematically solve this problem, therenormalization group was developed [5]. In the renor-malization group method, we consider the system at mul-tiple scales (levels of resolution). The spatially varyingmacroscopic density at one level of resolution is related tothat at a larger scale by performing local averages ratherthan a global average. This averaging relates the freeenergy at one scale of observation to the free energy at alarger scale. The properties of the system can be foundfrom how the behavior varies with scale, taking the limitof arbitrarily large (infinite) scales. The mathematicsis not easy, but it yields exponents that agree with thephenomenology [4, 5, 10]. Since its development, renor-malization methods have enabled many advances in ad-dressing questions about the structure and dynamics ofmaterials [16, 17].
The reason that different results were obtained is thatthe free energy in this case is not just a function of theaverage density. Still, it is not necessary to consider in-teractions among individual atoms. For a liquid under-going transition to a vapor, the free energy depends onthe spatial variation of the density, i.e. how the localdensities at different locations interact with each other.There are many possible interactions between local den-sities that could contribute to the free energy. However,only some of them are important. The renormalizationgroup is a method for determining which parameters de-scribing the interaction are important and which are not.“Relevant” parameters are those parameters of the free
energy that increase with scale; “irrelevant” parametersare those that decrease with scale. Because there are somany atoms in matter, the irrelevant parameters cannotaffect our observation. We can consider only the relevantparameters. We might measure irrelevant parameters mi-croscopically, but they won’t affect macroscopic changesin the material or our interactions with it near the criticalpoint.
IV. REPRESENTATIONS AND INFORMATIONAS A FUNCTION OF SCALE
Why does Landau theory, based upon calculus andstatistics, fail? The problem is not in the free energyminimization, the problem is in the representation of thematerial. Assuming that the free energy can be writtenas a function of the average density does not work. Asingle variable does not capture what is going on in thematerial. On the other hand, the positions of all of theatoms are not necessary. The spatial pattern of the den-sities is what we need. Moreover, the closer we look, themore values of the density we need. The way we representthe system is the crux of the matter—the sufficiency ofthe representation at the scale of observation we choose.
A representation is a map of the system onto math-ematical variables. More correctly, a representationshould be understood as a map of the set of possiblestates of the system onto the possible states of the math-ematical variables. A faithful representation must havethe same number of states as the system it is represent-ing. This enables the states of the representation to bemapped one to one to the states of the system. If a modelhas fewer states than the system, then it can’t representeverything that is happening in the system. If a modelhas more states, then it is representing things that can’thappen in the system. Conventional models often do nottake this into account and this results in a mismatch ofthe system and the model; they are unfaithful represen-tations and do not properly identify the behavior of thesystem, and thus ultimately its response to environmen-tal forces or interventions we might consider. Becausewe are interested in influencing the system, we only wantto know the distinctions that matter. We have to focusattention on those states that are distinguishable at aparticular scale of observation.
To formalize these ideas for complex systems, it is use-ful to understand information as related to scale. Wedefine the complexity profile [1, 14] as the amount of in-formation necessary to represent a system as a function ofscale. Information theory defines the amount of informa-tion in a message as the logarithm (base 2) of the numberof possibilities of the message—the number of bits neededto represent the set of possible messages. Thus, the com-plexity profile is given by the number of possible statesof the system at a particular scale. Typically, the finerthe scale of inquiry about a system, the more informa-tion is needed to describe it (Fig. 3). The complexity
5
Scale
Info
rmat
ion
Most important
large scale behavior
all t
he
det
ails
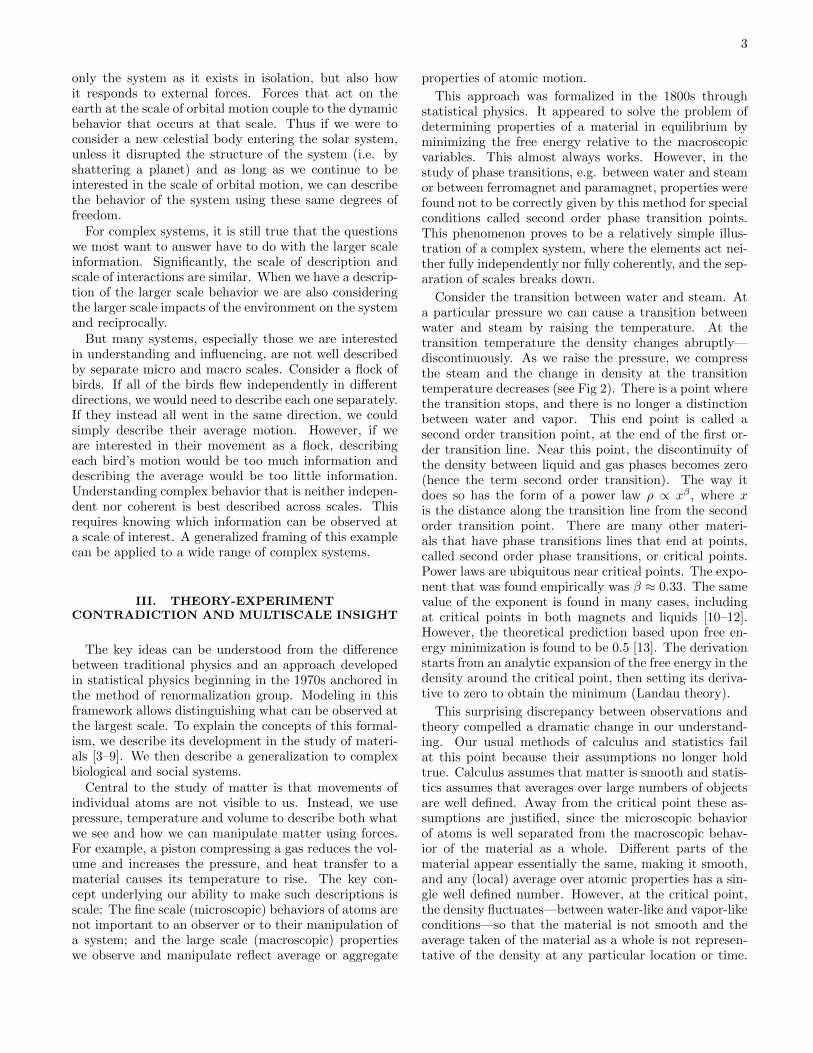
FIG. 3: The complexity profile is the amount of informationthat is required to describe a system as a function of the scaleof description. Typically, larger scales require fewer detailsand therefore smaller amounts of information. The most im-portant information about a system for informing action onthat system is the behavior at the largest scale.
at the finest scales is finite because of quantum uncer-tainty and is equal to a universal constant, 1/kB ln(2),times the entropy for a system in equilibrium, where kBis Boltzmann’s constant [15].
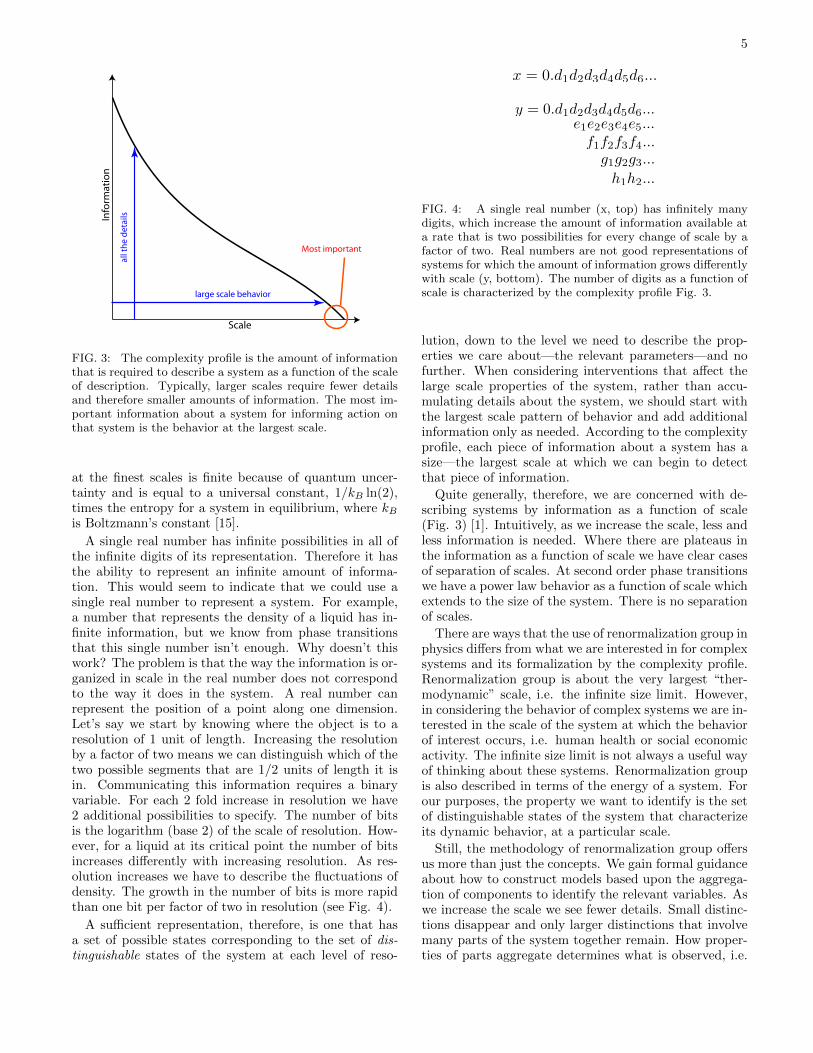
A single real number has infinite possibilities in all ofthe infinite digits of its representation. Therefore it hasthe ability to represent an infinite amount of informa-tion. This would seem to indicate that we could use asingle real number to represent a system. For example,a number that represents the density of a liquid has in-finite information, but we know from phase transitionsthat this single number isn’t enough. Why doesn’t thiswork? The problem is that the way the information is or-ganized in scale in the real number does not correspondto the way it does in the system. A real number canrepresent the position of a point along one dimension.Let’s say we start by knowing where the object is to aresolution of 1 unit of length. Increasing the resolutionby a factor of two means we can distinguish which of thetwo possible segments that are 1/2 units of length it isin. Communicating this information requires a binaryvariable. For each 2 fold increase in resolution we have2 additional possibilities to specify. The number of bitsis the logarithm (base 2) of the scale of resolution. How-ever, for a liquid at its critical point the number of bitsincreases differently with increasing resolution. As res-olution increases we have to describe the fluctuations ofdensity. The growth in the number of bits is more rapidthan one bit per factor of two in resolution (see Fig. 4).
A sufficient representation, therefore, is one that hasa set of possible states corresponding to the set of dis-tinguishable states of the system at each level of reso-
x = 0.d1d2d3d4d5d6...
y = 0.d1d2d3d4d5d6...e1e2e3e4e5...
f1f2f3f4...g1g2g3...
h1h2...
FIG. 4: A single real number (x, top) has infinitely manydigits, which increase the amount of information available ata rate that is two possibilities for every change of scale by afactor of two. Real numbers are not good representations ofsystems for which the amount of information grows differentlywith scale (y, bottom). The number of digits as a function ofscale is characterized by the complexity profile Fig. 3.
lution, down to the level we need to describe the prop-erties we care about—the relevant parameters—and nofurther. When considering interventions that affect thelarge scale properties of the system, rather than accu-mulating details about the system, we should start withthe largest scale pattern of behavior and add additionalinformation only as needed. According to the complexityprofile, each piece of information about a system has asize—the largest scale at which we can begin to detectthat piece of information.
Quite generally, therefore, we are concerned with de-scribing systems by information as a function of scale(Fig. 3) [1]. Intuitively, as we increase the scale, less andless information is needed. Where there are plateaus inthe information as a function of scale we have clear casesof separation of scales. At second order phase transitionswe have a power law behavior as a function of scale whichextends to the size of the system. There is no separationof scales.
There are ways that the use of renormalization group inphysics differs from what we are interested in for complexsystems and its formalization by the complexity profile.Renormalization group is about the very largest “ther-modynamic” scale, i.e. the infinite size limit. However,in considering the behavior of complex systems we are in-terested in the scale of the system at which the behaviorof interest occurs, i.e. human health or social economicactivity. The infinite size limit is not always a useful wayof thinking about these systems. Renormalization groupis also described in terms of the energy of a system. Forour purposes, the property we want to identify is the setof distinguishable states of the system that characterizeits dynamic behavior, at a particular scale.
Still, the methodology of renormalization group offersus more than just the concepts. We gain formal guidanceabout how to construct models based upon the aggrega-tion of components to identify the relevant variables. Aswe increase the scale we see fewer details. Small distinc-tions disappear and only larger distinctions that involvemany parts of the system together remain. How proper-ties of parts aggregate determines what is observed, i.e.

6
1
Wave
Gaussian
Navier-Stokes
1:10.2
1:10.3
1:20.2
A-S1:1
A-S1:2
A-S1:4
1:10.2
1:10.3
1:20.2
Fig. 7.2.13 (first)
Fig. 7.2.13 (second)
Fig. 7.2.14Fig. 7.2.15
FIg. 7.2.16 (first)Fig. 7.2.16 (second)
0
200
400
600
800
10,000
1:1
1:2
1:4
Turing patternsAttractors
Order to disorder
FIG. 5: When we focus on the largest scale, system behav-iors map onto simplified models, each of which applies to alarge set of possible systems with widely different microscopicdetails. Examples shown in this figure: the Gaussian distribu-tion, wave motion, order to disorder transitions (the subjectof phase transitions discussed in the text), Turing patterns,fluid flow described by Navier-Stokes equations, attractor dy-namics. The existence of only a few models that capturethe behavior of a wide range of systems underlies the idea ofuniversality—systems are members of universality classes ofbehavior.
what is important. By studying the way that propertiesaggregate we can identify the important larger scale sys-tem properties. Aggregation is determined by how theparts depend on each other.
The simplest cases are when parts are completely in-dependent or dependent; in the former case, aggregationis what we know from statistics that gives rise to theaverage and the random deviations described by the nor-mal (Gaussian) distribution, and in the latter a singlecoherent behavior arises. When there are other kinds ofdependencies, as explained in the next section, differentbehaviors occur. These include behaviors such as dynam-ical oscillations and spatial patterns (Figure. 5).
V. UNIVERSALITY, NORMALDISTRIBUTIONS AND BEYOND
When we go to the largest scale behaviors of a system,we simplify the mathematical description of the systembecause there are fewer distinguishable states, so thatthere are only a very limited set of possible behaviorsthat can happen. This also means that systems thatlook different on a microscopic scale may not look differ-ent at the macroscopic scale, because their mathematicaldescriptions become the same.
One example is that the transition when boiling a liq-uid to a gas has the same properties as the one thatoccurs when a heating a magnet up to the point where
it becomes non-magnetic (ferromagnet to paramagnetictransition). This is neither coincidence nor mere analogy,but a direct mathematical relationship. Magnets havelocal magnetizations that fluctuate at a magnetic criti-cal point just like the density at the water-vapor criticalpoint. Just as molecules of water undergo a transitionfrom order to disorder as the temperature increases, sodo the little magnets undergo an order-to-disorder tran-sition. The local magnetizations interact with each otherjust like the density fluctuations in water at the criticalpoint. The result is that these two seemingly differenttypes of systems map mathematically onto each other.
The mapping of water to vapor transitions onto mag-netic transitions illustrates how one type of behaviorcan describe many possible systems. As renormaliza-tion group was more widely applied, many instanceswere found of systems that have the same behavior eventhough they differ in detail, a concept that became re-ferred to as universality. Still, while many systems havethe same behavior, there are systems that have distinctbehaviors. Together this means that systems fall intoclasses of behaviors, leading to the term ‘universalityclass.’ Power laws often arise in the context of behav-iors that exist across scales, and the value of the expo-nent became used as a signature of the universality class[4, 5, 9, 10].
In a sense, the idea that many systems can be describedby the same large scale behavior is used in traditional the-ory. Scientists use the normal distribution for many dif-ferent biological and social systems. Any system havingsufficiently independent components satisfies the axiomsof the central limit theorem, and can be mathematicallydescribed by the same aggregate behavior, i.e. the nor-mal distribution. When there are dependencies, the nor-mal distribution no longer applies, but there are otherbehaviors that are characteristic of other kinds of depen-dencies. To study those behaviors, we have to determinethe way kinds of dependencies give rise to kinds of largescale behavior.
There are even more basic ways the common mathe-matical description of systems is used, i.e. point particlemotion is used to describe the motion of many distinctobjects, and wave equations are used to describe every-thing from music strings to water waves to light. Eventhough the specific systems are very different, the depen-dencies that give rise to their behaviors, and the behav-iors themselves, are related mathematically.
We can consider universality even more generally forcomplex systems. To generalize the ideas of universalityarising from renormalization group, we do not considerthe macroscopic limit of infinite system size and powerlaw exponent. Instead, the states of our representationmust correspond to the states of the system at the scaleof observation. Moreover, instead of using those statesto describe the free energy as is done in physics of phasetransitions, we use them to describe dynamics, and theresponse of the system to external forces. Underlyingany equation is an assumption that the variables that are

7
being used are a valid (sufficient) representation of thesystem. The relevant parameters are those that are im-portant at a particular scale of observation, determinedby distinguishability to an observer. The mathematicalrepresentation of one system at a particular scale mayalso correspond to the behavior of other systems. Thesystems may have quite different underlying components.This is a general concept of universality (Fig. 5).
What are the cases where the thermodynamic limitdoes not serve to expose universality? An importantexample is pattern formation, as found in Turing pat-terns [26], spatial arrays of roughly, but not exactly, pe-riodic spots or stripes. These patterns can arise in manyways, for example from the reaction of diffusing chemi-cal species [27]. At large enough scales, these patternslook only gray. This is a case where the system behavioroccurs over a limited range of scales, and the degrees offreedom disappear at large enough scale. Still, we canmap these descriptive variables from system to system.These patterns represent universal classes of behavior forsystems that have structure at a particular scale. Whatis important is that the patterns arise from a wide rangeof possible microscopic behaviors, but they are not sensi-tive to the details because the scale of the pattern is muchlarger and therefore separate. While there are parame-ters that are needed to describe the variety of patternsthat are formed, there are far fewer of those than in themicroscopic material details. Microscopic changes of thesubstances that comprise them only change the patternto the extent that they change the relevant parameters,and only in ways to be understood by how they affectthose relevant parameters.
Including Turing patterns in the concept of universal-ity is a natural and important generalization of the con-cepts of universality in statistical physics. The changesof these patterns with relevant parameters, and their re-sponse to environmental conditions, can be studied andrelated to phenomenological observations. There is pre-dictive capability for interactions at those scales of ob-servation. These issues are not trivial, as they presentchallenges for mathematical and observational studies.The adoption of Turing’s ideas in biology for the descrip-tion of patterns on animal skins and morphogenesis moregenerally has been controversial [28, 29] precisely becausethe pattern dynamics does not capture microscopic mech-anisms. This controversy misses the key point about uni-versality. Universality should be intuitive in this contextas the details of molecular processes are not necessaryto characterize the variation between individual animalswith similar patterns, or between species, or the dynam-ics of a pattern as it forms, and do not affect roles ofthese patterns in social and ecological interactions. Oncethe description of the behavior of the system is identi-fied in terms of relevant variables, any genetic or envi-ronmental influence on those patterns must affect thoserelevant variables. The behavior can be studied in termsof the relevant variables as well as the underlying mech-anisms that determine the origins and values of the rele-
vant variables. This is similar to the ability to describeplanetary motion without describing details of individualplanet structure.
The study of universality enables us to identify classesof systems whose behaviors can be described the sameway and can be captured by a common mathematicalmodel. This is the principle of universality that is for-malized by the analysis of renormalization group and gen-eralized by the application of multiscale information the-ory to the scientific study of complex systems. A goodway to think about this is that the mathematical modeldescribes one member of the class.
VI. DYNAMIC SENSITIVITY AND CHAOS
When we consider the scales of behavior of a system,we also have to address amplification and dissipation,which enable smaller scale changes to impact on largerscales (amplification), or larger scale behavior to becomeconfined to smaller scales (dissipation) over time. In suchcases, the amount of time over which a system is beingstudied determines the level of detail at one time that isneeded to describe the large scale behavior of the systemat a different time. The amplification or dissipation ratecan be related to the extent of additional informationthat is needed to describe the system at a particular scaleas a function of time scale of observation.
Deterministic chaos (e.g. Section 1.1 in [1]), popular-ized as the butterfly effect in meteorological systems, inwhich small initial differences diverge exponentially overtime, is a more specific way that scales mix over time[18]. The divergence of trajectories is often discussedin terms of the problem of predictability because thereis a limit to the accuracy of observation of a system.Limited information about initial conditions implies thatlater states of the system are not determined by obser-vations at the initial time even though the system is de-terministic. Chaotic systems have different degrees ofpredictability. Planetary orbits are chaotic [30], despitehigh levels of predictability. What is important for pre-dictability is the rate of divergence, which is measuredby the Luyaponov exponent, or the time scale at whichdivergence at the largest scales occurs. For planetaryorbits this time scale is millions of years.
From the point of view of multiscale information the-ory, amplification, dissipation and chaos are aspects ofthe mathematical models necessary for real systems.While some consider the purpose of modeling to be pre-diction, the purpose of a mathematical model shouldbe understood to be fidelity of the model to the sys-tem. Mathematical models of chaotic systems can beconstructed just as other models can be. The difficultythat is encountered with predictability is not the problemof the mathematical representation. The limits to predic-tion are inherent in the system behavior. The objectiveis to obtain the best understanding that is possible—recognizing inherent uncertainty is essential. The abil-
8
ity to obtain the best possible understanding should notbe confused with having complete predictability. (Moresubtly, the analytic representation of deterministic chaosassumes a set of real number parameters describing thesystem. However, as described in Fig. 3 the complex-ity profile generally implies that there are more degreesof freedom at finer scales, and therefore the standardmodel of chaotic behavior does not extend to finer scaledescriptions of a system. Well above the quantum limit,to which chaos does not apply, other models are likely tobe needed.)
Applying the complexity profile to biological and so-cial systems presents challenges associated with amplifi-cation (unrelated to chaos) that are important to recog-nize. Consider micro to macro connections in biology. Asingle genetic mutation in the β-globin gene, substitutingvaline for the glutamic acid at position 6 (or 7 includingthe start codon), causes abnormal hemoglobin molecules.One such mutation in an individual causes sickle celltrait, which provides resistance to malaria, while twosuch mutations lead to sickle cell disease. Consider mi-cro to macro connections in society. A single individual’sideas and influence can have dramatic effects, e.g. SteveJobs’ role in the development of modern devices from thepersonal computer to the iPhone, changing the way hun-dreds of millions of people work and play. These largescale differences in the physiology of an organism or asociety over time might seem to differentiate biologicaland social systems from physical ones, though similarsensitivities to small scale events affect physical systems.Significantly, the extent to which fine scale informationcan affect large scale behavior and the conditions underwhich it occurs are limited. Understanding these condi-tions and the details that can be influential is essentialto scientific understanding.
The large scale impacts of mutations and ideas arisefrom the possibility of amplification by informationalreplication over time that enables them to achieve largescale. Biological mutations can have large impacts be-cause of the replication of DNA throughout the cells ofthe body, and across populations, and through the subse-quent transcription of their information to many proteinsthat function in particular ways. Social systems have sen-sitivity to specific ideas as they are transmitted to others,embodied in machinery and organizational processes thatmass produce and distribute them widely. These are inmany ways similar to the butterfly effect attributed tometeorological systems. The conditions of amplificationrequire an available energy source in heated oceans andits ability to drive the creation of the highly redundantlarge scale motion of a hurricane.
These processes are not counter to the framing of in-formation importance. However, they do make its ap-plication more challenging as we need to understand theway that information is replicated over time. That thereis sensitivity to micro information does not mean that allmicro information can or will end up as large scale systembehaviors. Not all molecular changes, or genetic muta-
tions, have a large scale impact. Ideas and individualsthat can change society as a whole are rare compared tothe many that are present. Whether and to what extenta large scale behavior is sensitive over time to the impactof small scale events—which can have increasing impactas they are replicated—is part of the analysis of the scaleof information in the behavior of a complex system. Inevery case, identifying the large scale information is es-sential to the analysis and our eventual understanding ofthe system. Focusing on the large scale behaviors stillmust be done, as mapping all of the many fine scale de-tails at the atomic scale cannot ultimately be effective.Moreover, it is understanding which pieces of microscopicinformation are the ones that actually influence the largescale behavior that provides insight into the behavior ofthe system.
VII. COMPLEX SYSTEMS: EXAMPLES
The objective of the multiscale information approachis to represent correctly the largest scale behaviors ofthe system, leaving out microscopic details that are notessential to answer particular questions and for whichreliable representation is often impractical. Represent-ing the largest scale behaviors means identifying the setof states that are possible and their dynamics and influ-ence by external forces. The complexity profile provides ameasure of the number of states that are needed, howeverspecific methods may identify the correct model with orwithout its assistance. Because of universality, classes ofmacroscopic behavior previously found in the descriptionof physical systems may also be applicable to biologicaland social systems. Universality class analysis providesshortcuts to the characterization of either specific sys-tems or problem domains. The examples in this sectionlargely make use of universality classes and insights thathave been gained previously. Extending these approachesto a more complete set of social challenges and health in-terventions will require much greater efforts. Examplesprovided here are only first steps in the process.
A multiscale strategy that has been widely adoptedin the study of complex biological and social systems isthat of identifying power law scaling behavior in empir-ical data. This has been done in such wide ranging top-ics as economic time series, DNA sequence correlations,heart beat intervals, network connectivity, physiologicaland urban properties [19–25]. Because power laws arescale invariant, such multiscale behaviors can be identi-fied, and models developed for them, without referenceto much of the framework of renormalization methods.
The breakdown of spatial homogeneity, i.e. smooth-ness and averaging as mathematical approximations, inthe study of phase transitions is an insight that can beexpected wherever statistical averaging is being used todescribe the behavior of systems. We can consider aver-aging not as a failed approach, but as an approximation,which may or may not be valid, and may be useful even

9
when it isn’t strictly valid. This approximation is oftencalled a “mean field” approximation. The reason is thatthe local behavior of a system is a response to the forcesthat act upon it, which is called the local “field.” Ifwe have a model that uses the average of the local fieldsacross the material instead of the actual field everywhere,then not only the field but also the local behavior will bethe same in the model. This becomes an approximationto the large scale behaviors of the system. Indeed, thebreakdown of this approximation is a useful demarkationbetween systems that are describable within traditionalstatistical tools and those that require complex systemsmethods, i.e., where dependencies in the system give riseto multiscale behavior. Thus we can expect that in bio-logical and social systems there will be many cases wherethe breakdown of the “mean field” approximation pro-vides new insights.
The first example we give is to the mathematical anal-ysis of evolutionary theory in biology with implicationsfor biodiversity, altruism, speciation and longevity. Morespecific examples follow of applications to social systems,i.e., ethnic violence, global food prices, panic and orga-nizational effectiveness.
A. Evolutionary dynamics
Statistics was developed in conjunction with the Neo-Darwinian view of evolution by Fisher [31]. In the 1920s,statistics was a powerful new approach to describing howparental genomes combine to become those of offspring(Mendelian inheritance). In the approach he used, eachoffspring is treated as one instance of all possible combi-nations of parents. The mathematics he developed con-tinues to play a central role in the analysis of heredity andevolution of traits, i.e. population biology. However, thestatistical methods he used are an approximation whosesignificance is still not widely understood.
This statistical analysis in population biology can bemapped directly onto the mathematical issues discoveredin the study of phase transitions in physics. The analysisof evolutionary dynamics differs only in that there is a dy-namical equation instead of the equilibrium descriptionof materials. In each case the mathematics begins froma description of the probability of states of the system,and this is related to the states of the components.
Just like regions of a material can be in different states,e.g., {liquid, gas}, organisms in a population can havedifferent possible genomes, i.e. sets of alleles. The en-tire population is a combination of individual organisms,which are combinations of genes, each with its own state(one of several alleles). The assumption that Fisher madeis that one gene can be assigned an allele independentlyof the specific state of the other alleles of that organismand of other genomes. A subtle point is that it isn’t inde-pendent of the set of states of the genome of other genesof the same organism and other organisms (i.e. whichalleles are present in the population, which is essentially
the same as the probability of encountering them in a ran-dom sample). The state of one gene is independent of thespecific state of other genes or genomes. Mathematically,the probability of the genomes of all the organisms can bewritten as the product of the probability of the states ofindividual organisms, or even individual genes. This is ageneral way to make the separation of scales “mean field”approximation, i.e. P ({si}) = Πip(si), where P ({si}) isthe probability over the state of the system as a whole(the material, or the genomes of all organisms), and p(si)is the probability over the individual component (a smallarea of a material, or an individual gene) of taking a par-ticular state. This makes apparent that dependencies areapproximated: the specific state of one of the componentdoes not affect the state of another, only the probabil-ity of the states of the individual components affects theother components. This distinction is a subtle but essen-tial mathematical one.
To make the discussion easier to follow, we will usethe “rowers’ analogy” used by Dawkins in his book TheSelfish Gene [32] to explain both the statistical approxi-mation and its breakdown.
In the rowers analogy, we think about races betweenteams of rowers in boats. A rower is analogous to a gene,and a boat is analogous to an organism. There is a rowerpool, with rowers that are placed into boats, with allboats having the same number of rowers. The boats runheats against each other and the winners are placed backinto the rower pool to compete again. To make up for therowers that lost so that we always have the same num-ber of them, the rowers replicate, i.e., the the number ofsuccessful rowers are increased in number while retainingthe same qualities.
An example Dawkins describes is a competition be-tween English speaking and German speaking rowers.The languages affect the race because one-language boatshave an advantage—the rowers can understand eachother—and win. What will happen over time to the rowerpool? If there are more English speaking rowers, thereis a higher probability that a boat will have all Englishrowers. Moreover, German speaking rowers will tend tohave English speaking partners. This means that Englishspeaking rowers will win the race more often than Ger-man speaking rowers. Over time, the number of Englishspeaking rowers will grow and the number of Germanspeaking rowers will shrink. Eventually there will be anall English speaking rower pool. Alternatively, if we startout with a rower pool that has more German speakingrowers, over time the number of German speaking rowerswill grow, and we will end up with an all German speak-ing rower pool. In either case, we can think about thisas a competition between the rowers, with one type ofrower winning over the other type over time.
Dawkins’ argument seems reasonable, but a hiddenassumption has surprisingly far reaching consequences.The assumption is hidden in how rowers are placed intoand taken out of the rower pool. He assumed that thiswould be done at random. What happens if we don’t do

10
this? Consider, for example, what would happen if wehave a rower pool as a line of rowers. We take rowers outof the front of the line and put them into the boats, thenplace the rowers that win back into the rower pool at theback of the line. The dynamics would be very different.
At a certain place along the line of rowers, rowers willtend to become the same type, English or German speak-ers. However, the type that is found may be different inone part of the rower pool line than another. Patchesthat arise lead to a multiscale structure of the popula-tion! The existence of patches makes the process quitedifferent from the mixed rower pool. Moreover, in de-scribing the system it is not enough to recognize thatthe are patches, but also that the patches change overtime due to the movement of their boundaries. The dy-namical description of the system includes the multiscaledynamics of those patches.
One way that process is different is that both Englishand German speakers persist for a very long time. Itmight happen that one or the other of them will disap-pear eventually, but it will take many more generationsfor this to happen if we have a line as a rower pool thanif we mix them up every time. Interestingly, this mightalso be the reason that there are English and Germanspeaking people. If everyone was mixed frequently in theworld, then it would make sense to have only one lan-guage, but if people who speak German live in one partof the world, and people who speak English live in an-other part of the world, it is possible to have multiplelanguages, where some areas are English speaking andsome are German speaking. It makes sense that todaywhen people move more than in the past, there is more ofa tendency to speak a single language than when peopledidn’t move around as much.
The difference between taking the rowers at randomand not at random can be understood in terms of theprobability distribution of the rowers in the boats. Tak-ing them at random means that the likelihood of a partic-ular rower is given by the probability of the rower typein the rower pool, independent of other rower types inthat boat or other boats. This is exactly the mean fieldapproximation. When we take them from a particularpart of the rower line, the probability of one rower typeis not independent of the type of the previous and subse-quent rower that are chosen along the line because theyall come from the same part of the rower pool that ismuch more likely to have the same rower type than therower pool as a whole.
The biological analogy of the linear rower pool is themating of organisms that are nearby to each other geo-graphically (or alternatively mating according to traitsthat lead some organisms to be more likely to mate withothers of similar types, assortative mating). It is enoughfor animals or plants to reproduce near to the place wherethey were born to change dramatically the conclusions ofNeo-Darwinian theory. This change is surprising to manywho are not familiar with the difference between mean-field and non-mean-field behaviors.
A first result of realizing that biological populations arenot described by the mean field approximation, is thatpopulations can be much more diverse than is predictedby conventional population biology [43, 44]. Biodiver-sity was a central motivation of Fisher’s work, as priortheories could not describe the high level of biodiversityfound in nature [31]. Going beyond traditional statisticsimproves on his results, as even greater diversity arisesfrom the breakdown of the approximations he introduced.In a well mixed population the diversity disappears ex-ponentially fast. It persists much longer when it is notwell mixed. Interestingly, many of the experiments thattest population biology are done in a laboratory wherepopulations are mixed. So the assumptions of the theoryand the experimental conditions match. Laboratory pop-ulations are known to be very homogeneous in genotypeand natural populations, “wildtype,” are much more di-verse, consistent with the expectation that they are notwell mixed [33–36].
A second result has to do with a specific form of diver-sity, speciation, the separation of one species into two ormore species over time. The process by which this takesplace has been a subject of much controversy. This can beunderstood because if we start by considering the speciesto be mixed at every generation of mating, then how doesit stop being mixed? If on the other hand we include anon-mean field description of a species, then speciationresults from progressive separation of types that are morelikely to reproduce with those of the same type [37]. Thespatial population version of this idea has been shown todescribe natural biodiversity very well [38] by consideringspontaneous spatial pattern formation of patches of dif-ferent types that separate genetically to become speciesin a high dimensional type of Turing pattern.
A third result has to do with altruism and selfishness,and the primacy of competition over cooperation, in evo-lution. One of the key results that was gained fromFisher’s statistical methods is the idea that is popular-ized by Dawkins, the “selfish gene.” According to thisview an individual gene has traits that only benefit thelikelihood of its own reproductive success, and not, for ex-ample, that of the entire genome, family, or species. Theidea that genes are self-interested is proven using the sta-tistical assumptions of Fisher. An important question iswhether this conclusion is valid when those assumptionsdo not hold. The answer is that they do not [45–47].The self-generated patchiness of the population createsnew dynamical processes that are not described by self-ishness of genes. Thus, the breakdown of the mean fieldapproximation is important for understanding why com-petition between genes is not enough to describe evolu-tionary processes. This issue has taken the form of araging controversy about altruism. If the “selfish gene”view holds, then the only way that altruism among or-ganisms can arise is if they have the same alleles (oneorganism then helps another to increase the number ofits own alleles in the next generation) and the extent ofthat altruism is limited by the extent of the sharing of

11
alleles. Mathematically, this idea is embodied in a mech-anism called “kin selection” and there is a controversytoday about whether kin selection is enough to describeevolution, or whether the role of association in groups isneeded, a theory termed “group selection” [39–42]. Of-ten the controversy is discussed only in the mean-fieldapproximation, in which case the two theories are math-ematically equivalent and the argument becomes one ofconcept rather than mathematics. When we go beyondthe mean-field approximation we find that kin selectionis not sufficient.
We can see how this works from the rower pool idea.Consider a combination of altruistic and selfish rowers.If there are patches of altruistic and patches of selfishindividuals in a linear rower pool, the selfish individualsdo worse than the altruistic ones. This is because thealtruists are generally near altruists, and the selfish indi-viduals are near selfish individuals. Selfish individuals areunable to take advantage of the altruists as they are notnext to them in the rower pool and thus don’t end up inthe same boats. This would not be the case if the rowersare selected at random. Still, there must be boundarieswhere selfish individuals are near altruists, and we needto understand what happens at the boundaries. Thus theevolutionary dynamics is controlled in important ways bythe properties of boundaries, i.e. boundaries are “rele-vant,” which is not the case at all for the NeoDarwinianapproach that only focuses on the properties of alleles.Results that depend on how patches and boundaries workare not described by kin selection and lead to a differentunderstanding of altruistic behavior.
A fifth result has to do with the implications in thereal world of increasing rates of travel using airplanesand other means of transportation globally [48]. We sawthat mixing leads to mean field type of behavior that isvery different from the case of spatial models. Increasingtransportation brings us closer to the well mixed case.Biodiversity should decrease. We see this effect in thatinvasive species are eliminating local variation of species.Another effect is a change in the pathogens responsiblefor infectious diseases. When a pathogen can only spreadlocally, the most aggressive strains go extinct as they killoff the local hosts in their local patch. As transportationincreases patches become irrelevant and the successfulstrains are those that are more aggressive and deadly.The practical implications are present in the increasingprevalence of deadly pandemics. A theoretical analysis ofthe increase of long range transportation implies that theincreasing severity will lead to global extinction, wherelocal extinctions were present before. Implications forpandemic response are important for Ebola and othersevere diseases.
A sixth result is in the study of evolution of longevity,with implications for the ability to extend lifespans [49].In this case the mean field approximation suggests thatevolution cannot select for specific lifespans due to thebenefit to reproduction of living longer. However, lo-cal reproduction links organisms to their descendants so
that selection of lifespans is determined by ecological con-ditions affecting multiple generations such as the localavailability of resources. Because lifespans are selectedby ecological conditions, interventions in those mecha-nisms may result in extended lifespans.
Thus we see that there are many problems with theNeo-Darwinian view of evolution. It is a useful and pow-erful approximate way to think about evolution. How-ever, finding out that it is not always correct includesthe realization that biodiversity, speciation, altruism, dis-ease, longevity and other important domains of biologyare not fully described by it.
B. Multiscale biodiversity
A direct application of the complexity profile has beenmade to analysis of biodiversity. The evaluation of com-plexity and scale in this context has direct relevance toour understanding of the vulnerability of species whenthere are losses of diversity.
The loss of biodiversity is a current challenge for globalconservation efforts due to direct exploitation, reductionin natural habitats, and other effects such as global trans-portation of invasive species. Global efforts to conservespecies have been strongly influenced by the heteroge-neous distribution of species diversity across the Earth.This is manifest in conservation efforts focused on diver-sity hotspots [50–52]. The conservation of genetic diver-sity within an individual species [53, 54] is an importantfactor in its survival in the face of environmental changesand disease [55, 56]. A multiscale characterization ofbiodiversity has shown that diversity within species isalso unevenly distributed. Genetic distinctiveness hasa scale-free power-law distribution implying that a dis-proportionate fraction of the diversity is concentrated insmall sub-populations. Diversity has its own internaldynamics, which are distinct from possible outside in-fluences such as habitat change and species interactions.Increases happen only gradually, but large decreases mayoccur without an extrinsic perturbation due to death ofrare types.
To analyze the biodiversity it is helpful to consider notjust the variety of genomes present in a species, but thenumber of repetitions of a particular type. This is theconverse of the complexity profile, i.e. if the complexityprofile is the variety as a function of scale, the multiplicityof genomes is the scale (redundancy) as a function of thevariety. Multiplicity is a measure of the population struc-ture. Multiplicity can also be defined using the numberof members of a species, i.e. as a measure of the scale ofthe range of genotypes present in a species. Biodiversityis then evaluated either as a measure of the distributionof the multiplicity across species [57], or within a speciesacross types.
An example of the application of multiplicity in theevaluation of the importance of biodiversity in the ro-bustness of biodiversity to catastrophes. It has been sug-

12
gested that extinction of 95% of species would leave 80%of the tree of life (total diversity) retained, and that asa result ecological planning to preserve diversity is notconstructive[58]. These results were obtained becauserandom losses, even when high, are unlikely to remove allindividuals belonging to a deep branch of the tree evenwhen it forms a small proportion of the population, thuspreserving most of the diversity. In contrast, the analy-sis of multiplicity suggests that conservation planning isimportant and can enable substantial improvement of di-versity preservation. The small immediate loss is followedby a much greater loss over time due to the vulnerabilityof small residual populations to extinction. The vulner-ability of residual small groups of related organisms canbe seen from the multiplicity of the population—bothscale and diversity matter! The loss of a large fractionof a group of closely related species (or of closely relatedorganisms) leaves the remainder of the group highly vul-nerable to extinction. Thus, while the survival of at leastone organism of a group is probable, the viability of thattype is compromised and subsequent extinction is likely.This result arises because of the non-robustness of smallscale diversity in contrast to the robustness of larger scalediversity. It shows that ensuring the reproduction of raretypes by conservation planning [54, 55, 59, 60] during oreven just after an extinction episode can dramaticallyimprove diversity retention.
C. Ethnic violence
Complex socio-economic systems might seem to be dif-ficult to study using universality and renormalizationgroup / multiscale information methods. However, sev-eral examples exist that show that it is possible to applythese methods. The first example helps clarify the originsof ethnic violence and its prevention [61, 62].
Ethnic violence is often described in terms of historical,economic, political, leadership and various other socialaspects of the conditions of those who engage in violentconflict. Ethnic violence is typically a collective behav-ior involving multiple individuals that decide upon andengage in violence rather than due to an individual deci-sion maker such as a national political leader. This is asignature that an analysis of the relevant large scale (col-lective) parameters is useful. How might we apply thearguments of universality in this context? The objectiveis to determine a few measures of a social system thatare relevant to whether or not ethnic violence occurs andthus to help identify where or when it happens and howto prevent it.
This has been done by building a theoretical frame-work that considers solely the existence of distinct types,without explicitly treating other factors. Such a frame-work is consistent with reducing the analysis to only theessential descriptors of a problem, i.e. without distinc-tion between types there cannot be ethnic conflict, andthere is no other condition that is, a-priori, essential. The
other factors may play a role but they are assumed to belinked to the dynamics of the types. As discussed abovein the treatment of phase transitions, the presence ofspatial dimensions is also relevant and since human pop-ulations are found in an approximately two dimensionalspace, we include these dimensions.
The most general model with these attributes has typesthat are spatially distributed and follow a dynamics thatinvolves movement in space. There are then two differ-ent types of behavior, mixing and separation. Consid-ering only local movement the behavior is that found inalloys of materials. Alloys can mix or separate. Sepa-ration occurs because of an energetic (atoms) or social(human) preference for being near members of the sametype. Separation manifests in the existence of progres-sively larger groups over time. Universality means thatmicroscopic parameters do not influence the behavior ex-cept in a multiplicative constant that controls the rate atwhich the progressively larger groups form [63]. The onlydescriptive parameter of the system is the patch size. Forsystems where migration can lead to larger scale move-ments of individuals, those movements lead to the exis-tence of patches whose size is, for our purposes, extrinsi-cally imposed.
Given the existence of only a patch size as the relevantparameter, it is necessary to consider how ethnic violencemay be affected by this size. There is no prescriptionfrom physical law that specifies this dependence, but in-tuitively it has been argued that in either of two limitsviolence will not be present. First, when neighborhoodsare well mixed. This, in effect, reverts to the case whereindividuals do not choose to separate, or to conditions inwhich everyone knows members of the other groups per-sonally, and in this limit we can assume that widespreadviolence should not be present. In the opposite limitin which patches are large, the overall condition is thatindividuals do not see members of the other type andtherefore there should not be spontaneous violence. Thissuggests that violence will be present only at a partic-ular intermediate size of patches. Having identified asingle relevant parameter as a patch size that promotesviolence, it remains to validate the analysis against ob-servations of actual violence.
Comparison with data on ethnic violence in the formerYugoslavia (Fig. 6) and India confirms [61] that detectionof patches of size 20-60 km provides a high spatial corre-lation (e.g. 90%) with locations of ethnic violence. Theresults can be explained sociologically because separa-tion limits inter-group friction, while integration inhibitsinter-group alienation. In places where self-identifyinggroups separate into geographical patches of the criticalsize a group begins to impose its cultural norms, religiousvalues, language differences and in-group social signalingwithin public spaces. These spaces may include pub-lic squares, markets, restaurants, places of worship andschools. However, when social expectations are violatedby members of other groups, the resulting friction is likelyto cause radicalization of some members of the popu-

13
FIG. 6: Yugoslavian census data from 1991 were converted into a spatial representation [left] and used in an agent-basedsimulation to predict populations likely to be in conflict with neighboring groups [red overlay, left and right]. The predictionagrees well (90% correlation) with the location of cities reported as sites of major fights and massacres [yellow dots, right].
lation. For patches larger than the critical geographi-cal size, individuals remain largely within their own do-mains and de facto local sovereignty exists. If patches aresmaller than the critical size, ethnic groups cannot im-pose their own norms and expectations about behavior inpublic spaces, allowing for the peaceful coexistence of themultiple ethnic groups that are present. This discussionfurther suggests that natural and political boundaries canincrease autonomy to allow for separation that can pre-vent violence in areas where it would otherwise occur.An analysis of Switzerland shows that this is consistentwith both historical events leading to the formation ofits Canton based federal governance structure and withcurrent census geographical data about linguistic and re-ligious groups, including modern day peace and violence[62].
The agreement between theory and observations forYugoslavia, India and Switzerland provides an impor-tant confirmation of the approach we are using to identifyrelevant parameters in highly complex social systems toenable theories that can identify both the locations ofand mechanisms of ethnic violence and its prevention.The research further demonstrated that well-placed in-trastate political borders and well-situated topographicboundaries that promote local autonomy (as in Switzer-land) can reduce the propensity to violence, providing amethod for a more limited intervention than full integra-tion or separation to promote peaceful coexistence whenit is necessary [62], an approach that may be consideredin many violence prone areas of the world.
Other social and economic forces can be considered inthe context of the model. First, the identification of geo-graphic patch size as a relevant parameter allows not justfor violence to be associated with patch size but manyother social properties. Various economic and social con-ditions can be expected to be linked to the patch sizeas well. Correlations of these properties with violence aswell as with each other, can expose those dependencies ifthe patch size is used as an independent variable.
Second, just as migration and political barriers weretreated extrinsically, other external forces can affect thebehavior of the system. Such larger scale forces may sup-
press or promote violence. A relevant example is the roleof dictators, such as Tito in Yugoslavia, whose regimeinhibited the violence that arose afterwards. Anotherexternal force would be collective decisions to impose po-litical boundaries, as has been done in Switzerland, or de-cisions to enforce mixing in public housing in Singapore.These are not only extrinsic forces, they, in effect, makeuse of the understanding that is found in the theory toact on the system itself. As in physics, the understandingof system behavior enables interventions to modify thosebehaviors.
We note that the identification of a geographic patchsize of a population as a parameter relevant to ethnic vi-olence is a scientific hypothesis whose validation by em-pirical data is a confirmation of the validity of that hy-pothesis. However, the generation of that hypothesis bythe multiscale information (renormalization group) ap-proach is also a confirmation of that methodology as away of generating “hypotheses” for a wide range of com-plex systems. This approach is important precisely be-cause identifying the right (low dimensional) hypothesisfor testing in a complex system is itself a task whosesuccessful performance would be expected to be highlyimprobable, i.e. there are a large number of potentialhypotheses and testing each one of them would limit thevalidity of statistical tests due to the problem of spuriouscorrelations. In this case, as in other applications of mul-tiscale analysis, the identification of a unique hypothesisprovides a strong theoretical basis for complex systemsunderstanding.
D. Dynamics of market prices
For a first economic example of the multiscale informa-tion approach, we review a recent analysis of bubbles andcrashes in the commodity markets [64, 65] that matchedactual price behavior precisely.
The traditional theory of markets assumes that peo-ple decide on investments independently and rationally,and therefore predicts a supply and demand equilibrium.Interestingly, in a complex systems analysis of market

14
price
1. Trend followersbuy when theprice is rising.
2. Buying makesthe price rise
further.
3. At higher prices,buy-low-sell-high
investors sell, eventually reversing the trend & driving the price
back toward equilibrium.
4. As the price drops,trend followers sell,
driving the price further
down.
5. Eventually the priceovershoots
equilibrium.
time
6. Trend followingcontinues, leading to
an anti-bubble.
The cycle repeatsfor prices below
equilibium
7. Whether bubbles and crashesdecrease or increase in size depends on the amount of
trend following.
More
trend fo
llowin
g
Less
tren
d fo
llow
ing
Supply Demand Equilibrium
FIG. 7: Bubbles and crashes in market prices result from bandwagon effects when price changes themselves motivate traders,leading to mutual influence between traders. Thus, buying can cause more buying and selling can cause more selling. Moreprecisely, bubbles arise as an interplay between two different kinds of investors, trend-following speculators who buy whenprices are increasing and sell when they decrease, and fundamental investors who buy-low-and-sell-high based upon supply anddemand information.
bubbles, it is not so much the assumption of rationalitythat fails, but rather the independence. Due to trend-following in the commodity markets, actions of individ-uals are not fully independent; rather people make deci-sions that influence and are influenced by the decisionsof others. These influences lead individual actions tocombine into collective oscillations (Fig. 7). This ex-ample illustrates a case where the large scale model isof a time series, i.e. the dynamical behavior of a system.Renormalization group approaches to dynamical stochas-tic equations have been described in physics in the studyof material growth [17]. Our application is simpler thanthe physics problem since there is only a single dynam-ical variable and stochastic terms are not necessary inthis specific case, but the framing is the same.
To construct a dynamical model of food price changes,we write the incremental change in price as:
P (t+ 1)− P (t) = −ksd(P (t)− Pe(t))+ksp(P (t)− P (t− 1))
(1)
which is an expansion to first order in variables describ-ing the system; these are the largest terms affecting thebehavior. Using only the largest terms is justified by themultiscale information methodology as global food pricescan be affected only by many individual components act-ing collectively at the largest scales. The first term canbe identified with buy-low sell-high investors with a fun-damental price determined by supply and demand, Pe(t).The second term can be identified with trend followingspeculators, who buy when the price goes up and sell
when the price goes down. The first term gives a dynam-ical version of the traditional equilibrium market, and isextended to include relevant terms that lead to intrinsicself-generated dynamical price behaviors. In a more com-plete model, additional terms are added for the tendencyof trend followers to switch markets. When prices changedramatically, speculators move to the market with priceincreases, and away from one with price declines.
Without the trend following speculators, the action ofthe buy-low sell-high investors leads to an exponentialdecay toward the equilibrium price. With the trend fol-lowing speculators, the system has different behaviors de-pending on the extent to which they exist, i.e. the mag-nitude of the coefficient ksp. If the price of a commodityhappens to go up, trend followers who buy when prices goup push the price further away from equilibrium. How-ever, the further the price is from equilibrium the morethe conventional investors who “buy low and sell high”get involved, and their selling provides a force driving theprice back towards equilibrium. Indeed, the further theprice deviates from equilibrium, the more this force driv-ing back toward equilibrium (known in economics as a“Walrasian force”) strengthens, eventually reversing theupward trend. At this point, the trend following band-wagon effect drives the price down, eventually overshoot-ing equilibrium and restarting the cycle. This interplayresults in an oscillation of prices deviating from equilib-rium. Rather than calculating an unstable equilibriumprice, a methodology including interdependence identifiesthe large scale pattern of the system and accurately maps

15
it onto the bubble and crash dynamics seen in global foodprices [64, 65].
The very existence of bubbles and crashes has longbeen a subject of controversy in economic theory [66, 67],but a direct mathematical formulation of their dynamicshas not been framed. The breakdown of equilibrium dueto trend-following has been well-established since 1990[68]. However, the theory at that point did not rep-resent the bubble and crash dynamics of the system.Why didn’t traditional methodologies consider the dy-namic effects of interdependencies? As described ear-lier, a key limitation is that traditional mathematicalmethods in economics are applicable only to systemsin which there is a separation of behavior between themicro and macro scales. Interactions among the partsthat cause large scale behavior, like the trend-following-induced market bubbles, violate this separation. Instead,many papers noted the possible role of speculators butdid not model their effects mathematically. Recent workon agent modeling demonstrated that market dynamicscan deviate from equilibrium prices [69–72] but these ap-proaches were not used for modeling food prices, and themodeling of market agents generally results in a largenumber of parameters that describe many possible agentbehaviors. By including just the largest scale terms inthe dynamical expansion of the behavior of prices in Eq.1, and including terms that describe market switchingbehavior, accurate description of prices was achieved.
It is also important to recognize the difference betweenthis approach and time series analyses based upon cor-relations. In such an analysis multiple time series arecorrelated to a particular target time series, and the cor-relations are used as a measure of the influence (or atleast the association) of the time series to the target timeseries. Such analyses of correlations do not characterizethe scale of those effects, as a correlation is independentof the scale. This, combined with the statistics of correla-tions, i.e. given a large number of different times series itis a statistical certainty that some of them will be corre-lated even if they are unrelated, leads to many potentiallyfalse associations of quantities that are unrelated to eachother. Careful methodologies are needed to ensure thaterrors do not take place and multiple critiques of statisti-cally based experiments suggest that errors are commonin science [73–76]. In contrast an analysis of scale canrule out many of the potential relationships, especiallyat the largest scale of a system.
E. Network dynamics and collective behaviors:Panic and market prices
Other examples of application to market prices includea study of panic on the stock market. This analysis beganfrom a universal model of the dynamics of systems hav-ing a network of internal influences and external forces[78]. Its validation through application to markets [77]has been recently published.
Several strategies have been used to evaluate the be-havior of markets from a complex systems perspective.These include network topology models, agent basedmodels, and the approach we are discussing that focuseson large scale behaviors. We therefore provide extensivereferences in this case to illustrate and contrast differentmethodologies. We first introduce the essential questionsand motivation.
Panic is one of the important collective behaviors in so-cial systems with relevance to sociology and economics.In sociology [100–103], panic has been defined as a collec-tive flight from a real or imagined threat. In economics,bank runs occur at least in part because of the risk tothe individual from the bank run itself—and may betriggered by predisposing conditions, external (perhapscatastrophic) events, or even randomly [104, 105]. Whilemarket behavior is often considered to reflect externaleconomic news, empirical evidence suggests that exter-nal events are not the only cause of market panics[106].Although empirical studies of panic are difficult [107–109], efforts to distinguish endogenous (self-generated)and exogenous market panics from oscillations of marketindices have met with some success[110–114], though theconclusions have been debated[115–118].
The 2007-2008 financial crisis led to new interest inanalyzing the behavior of market crashes. Whether the2008 crash resulted from compelling economic news orpanic that may or may not have been linked to nega-tive news is an important question. In general, the be-havior of markets that fall rapidly then recover shortlyafterwards makes suspect the economic assumption thatmarkets reflect valid economic news. However, economictheory does not provide a solid basis for formalizingmarket behavior outside of the equilibrium concepts inwhich price is determined by fundamental value. This isnot surprising because the ideas of economic equilibriumare the same statistical concepts and mathematical opti-mization methods that are present in pre-renormalizationgroup thermodynamics and statistical mechanics. On theother hand, panic and other collective social behaviorsare to be understood as self-generated patterns of be-havior in which interactions between multiple individu-als give rise to large scale dynamics without necessitatingexternal forces. These kinds of ordered behaviors, andthe transition between disorder and order that might oc-cur in a panic, are precisely the conditions under whichthe statistical assumptions and optimization based uponaveraging assumptions over space (homogeneity acrossindividuals) and time (steady state) do not apply.
From the perspective of methods based on networktopology, the essential approach is to consider a systemcharacterized by sparse networks with heterogenous nodeconnectivities [79], and the dynamics of those connectiv-ities [80, 81]. To identify signatures of risk, financial net-works [82–85] have been defined primarily from correla-tions of prices of stocks. Stocks are linked when they havea correlation higher than a threshold, which is placedhigh enough so that the links are sparse [82, 86–92]. For
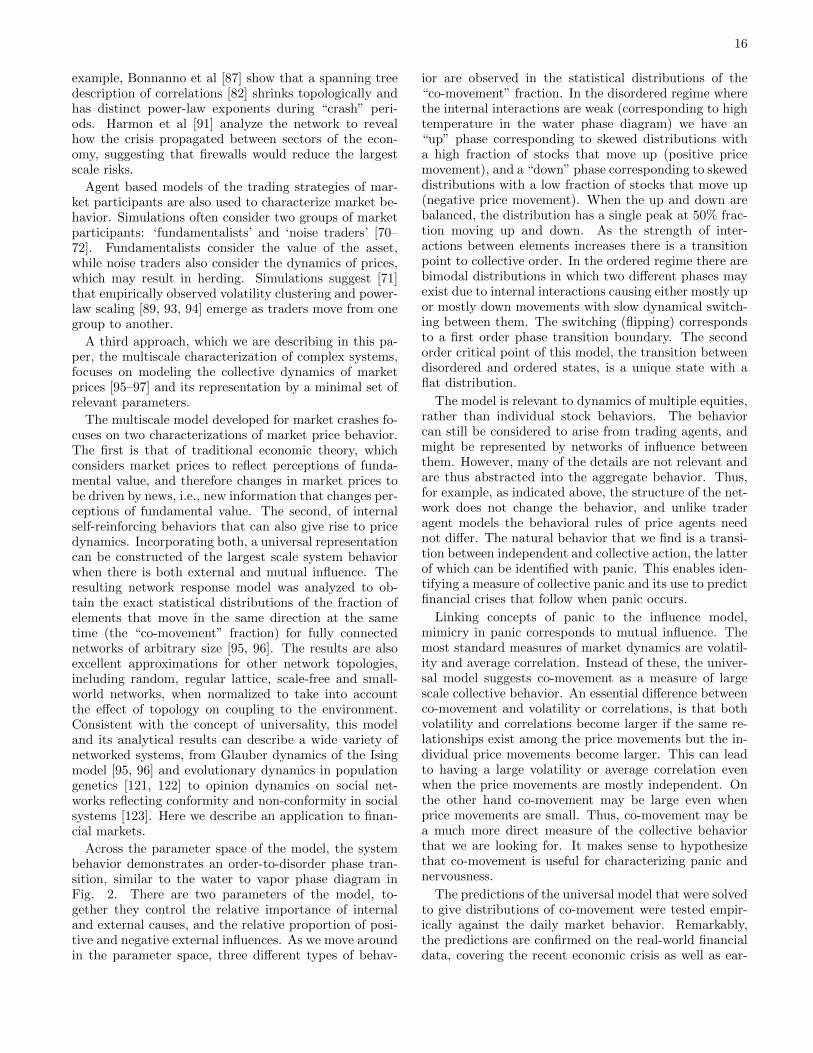
16
example, Bonnanno et al [87] show that a spanning treedescription of correlations [82] shrinks topologically andhas distinct power-law exponents during “crash” peri-ods. Harmon et al [91] analyze the network to revealhow the crisis propagated between sectors of the econ-omy, suggesting that firewalls would reduce the largestscale risks.
Agent based models of the trading strategies of mar-ket participants are also used to characterize market be-havior. Simulations often consider two groups of marketparticipants: ‘fundamentalists’ and ‘noise traders’ [70–72]. Fundamentalists consider the value of the asset,while noise traders also consider the dynamics of prices,which may result in herding. Simulations suggest [71]that empirically observed volatility clustering and power-law scaling [89, 93, 94] emerge as traders move from onegroup to another.
A third approach, which we are describing in this pa-per, the multiscale characterization of complex systems,focuses on modeling the collective dynamics of marketprices [95–97] and its representation by a minimal set ofrelevant parameters.
The multiscale model developed for market crashes fo-cuses on two characterizations of market price behavior.The first is that of traditional economic theory, whichconsiders market prices to reflect perceptions of funda-mental value, and therefore changes in market prices tobe driven by news, i.e., new information that changes per-ceptions of fundamental value. The second, of internalself-reinforcing behaviors that can also give rise to pricedynamics. Incorporating both, a universal representationcan be constructed of the largest scale system behaviorwhen there is both external and mutual influence. Theresulting network response model was analyzed to ob-tain the exact statistical distributions of the fraction ofelements that move in the same direction at the sametime (the “co-movement” fraction) for fully connectednetworks of arbitrary size [95, 96]. The results are alsoexcellent approximations for other network topologies,including random, regular lattice, scale-free and small-world networks, when normalized to take into accountthe effect of topology on coupling to the environment.Consistent with the concept of universality, this modeland its analytical results can describe a wide variety ofnetworked systems, from Glauber dynamics of the Isingmodel [95, 96] and evolutionary dynamics in populationgenetics [121, 122] to opinion dynamics on social net-works reflecting conformity and non-conformity in socialsystems [123]. Here we describe an application to finan-cial markets.
Across the parameter space of the model, the systembehavior demonstrates an order-to-disorder phase tran-sition, similar to the water to vapor phase diagram inFig. 2. There are two parameters of the model, to-gether they control the relative importance of internaland external causes, and the relative proportion of posi-tive and negative external influences. As we move aroundin the parameter space, three different types of behav-
ior are observed in the statistical distributions of the“co-movement” fraction. In the disordered regime wherethe internal interactions are weak (corresponding to hightemperature in the water phase diagram) we have an“up” phase corresponding to skewed distributions witha high fraction of stocks that move up (positive pricemovement), and a “down” phase corresponding to skeweddistributions with a low fraction of stocks that move up(negative price movement). When the up and down arebalanced, the distribution has a single peak at 50% frac-tion moving up and down. As the strength of inter-actions between elements increases there is a transitionpoint to collective order. In the ordered regime there arebimodal distributions in which two different phases mayexist due to internal interactions causing either mostly upor mostly down movements with slow dynamical switch-ing between them. The switching (flipping) correspondsto a first order phase transition boundary. The secondorder critical point of this model, the transition betweendisordered and ordered states, is a unique state with aflat distribution.
The model is relevant to dynamics of multiple equities,rather than individual stock behaviors. The behaviorcan still be considered to arise from trading agents, andmight be represented by networks of influence betweenthem. However, many of the details are not relevant andare thus abstracted into the aggregate behavior. Thus,for example, as indicated above, the structure of the net-work does not change the behavior, and unlike traderagent models the behavioral rules of price agents neednot differ. The natural behavior that we find is a transi-tion between independent and collective action, the latterof which can be identified with panic. This enables iden-tifying a measure of collective panic and its use to predictfinancial crises that follow when panic occurs.
Linking concepts of panic to the influence model,mimicry in panic corresponds to mutual influence. Themost standard measures of market dynamics are volatil-ity and average correlation. Instead of these, the univer-sal model suggests co-movement as a measure of largescale collective behavior. An essential difference betweenco-movement and volatility or correlations, is that bothvolatility and correlations become larger if the same re-lationships exist among the price movements but the in-dividual price movements become larger. This can leadto having a large volatility or average correlation evenwhen the price movements are mostly independent. Onthe other hand co-movement may be large even whenprice movements are small. Thus, co-movement may bea much more direct measure of the collective behaviorthat we are looking for. It makes sense to hypothesizethat co-movement is useful for characterizing panic andnervousness.
The predictions of the universal model that were solvedto give distributions of co-movement were tested empir-ically against the daily market behavior. Remarkably,the predictions are confirmed on the real-world financialdata, covering the recent economic crisis as well as ear-
17
lier market dynamics. The co-movement data then canbe used to evaluate whether the recent market crisis andhistorical one-day crashes are internally generated or ex-ternally triggered. Over the period of the analysis thereal world behavior narrowly adopts only the balancedpositive and negative news one-dimensional subspace ofthe parameter space. The critical point with high levelsof co-movement, i.e. panic, is found to uniquely identifythe 2008 market crash. Since the critical point is unique,no model parameters are adjusted to obtain this corre-spondence, so this can be considered as a zero parametertheory of the financial crisis. Moreover, a measure of co-movement increases well before one day market crashes,and there is significant advance warning to provide a clearindicator of an impending crash. Increasingly panickybehavior is thus an early warning sign of each marketcrashes. Predictive performance is exceptional—it antic-ipates the largest one-day crashes over 25 years, with nofalse positives or negatives. Other measures that mightbe used as predictors of market crises are volatility, corre-lations and covariance between equity prices. Of these in-dicators, volatility and correlations, the most commonlyused risk predictors, provide the least predictive abilitywith three errors and four correct predictions, covarianceis a comparatively better predictor with only one error,and the multiscale model provides the best predictiveutility with no errors [97].
We note that the distribution of sizes of the co-movement fraction (number of stock prices moving in thesame direction, i.e. aligned members) is a multiscale de-composition similar to the complexity profile.
F. Principles and multiscale analysis
In this section we review several general features andprinciples of multiscale analysis as embodied in the com-plexity profile for use in applications across complex sys-tems. A more extensive discussion of the principles ofmultiscale analysis and its use in framing a fundamentaltheory of structure, as well as other measures of multi-scale structure (the marginal utility of information), hasbeen provided elsewhere [124]. These principles also pro-vide a means of understanding a class of applications tosocial and biological systems that has been developedto understand the relationship of structure and functionacross a variety of systems. The development of mod-els using multiscale information requires specific datadescribing both the scale and dynamical behavior of asystem. There are circumstances, however, when theamount of information at a particular scale itself providesinsight into the behavior of a system. Here we focus ona few such examples in order to illustrate the utility ofthe complexity profile.
G. Sum rule: Elementary excitation strength
Multiscale analysis evaluates the behavior of systemsacross scales. The extent or number of degrees of free-dom at a particular scale is given by the complexity pro-file measured in the same way that the entropy describesthe degrees of freedom at microscopic scales. It can beshown that there is a fundamental tradeoff between thedegrees of freedom across scales [1, 14, 15]. This arisesbecause larger scale behaviors arise due to coherence, i.e.constraints, across microscopic degrees of freedom. Thelarger the number of components that are involved in abehavior, the larger the scale of that behavior and cor-respondingly the greater is the reduction in the degreesof freedom at smaller scales. This fundamental propertyof systems can be framed as a sum rule, i.e. the sum ofscale weighted degrees of freedom is independent of thestructure of the system but only dependent on the (num-ber of) components of which the system is composed.This sum rule can be seen to be similar to sum rules ofthe dielectric response function, i.e. that an excitationthat is a collective behavior, such as a plasmon, reducesthe contribution to response (weight) of single particleelementary excitations [125].
H. Ashby’s law and multiscale information
A central tenet in cybernetics is that the number ofpossible states of a control system—a biological or engi-neered system that strives to control its environment—has to match the set of possible states of the environmentin order for the control system to function successfully.The degree to which even an optimally designed systemmust fail, is related to the relative number of its avail-able states to the number of states of the environment.This is Ashby’s Law of Requisite Variety, which is provenfrom the assumption that each of the states of the envi-ronment must be matched to a different system state inorder for the impact of the environment to be mitigated.
This statement is, however, framed in a context whereenvironmental distinctions are essentially of the samescale and that scale is matched to the differences in stateof the system. A microscopic difference in state of theenvironment need not be met by a difference in the stateof a macroscopic control system. Also, a large force ex-erted by the environment may never be successfully metby a change of state of the system. To incorporate theseobservations, a multiscale generalization of Ashby’s Lawis needed in which scale of environmental and systembehaviors are recognized. A direct generalization wouldinvolve counting the sates of the system at the relevantscale of impact of the environment [14].
This directly connects the complexity profile as a mea-sure of multiscale variety with the effectiveness of thebehavior of a system.

18
I. Formal theorems about complexity profile
There are theorems proven about the complexity pro-file that aid in thinking about and approximating it forreal world systems. Specifically:
Independent component property—the complexityprofile is the sum over profiles of independent compo-nents, X:
CS(σ) =∑X
CX (2)
Fully dependent component property—the complexityprofile of n fully dependent components, X, add in scale:
CS(σ) = CX(σ/n) (3)
Combining these together we have that the complexityprofile can be given by fully independent and fully de-pendent components as
CS(σ) =∑X
CX(σ/n(X)) (4)
for this to hold, the distinct sets X of n(X) componentsmust be independent of each other. We can considern(X) to be the scale of sets of components X.
J. Calculations of multiscale information basedupon data
There are a number of formulas that have been devel-oped to calculate the complexity profile based upon dataabout a system behavior.
The first of these is obtained from the probability ofthe system across states of the system P (si). While thisformula has been proven to be unique, it is computa-tionally difficult due to combinatorial treatment of allsubsystems, and has been calculated for model systemsonly for systems of limited sizes including Ising models,Gaussian correlations, and a few other systems [126–128].
A much more computationally tractable method hasbeen developed to evaluate an approximation to the com-plexity profile based upon sampled data about the system[129]. This method considers the components of a systemthat are linked to each other and aggregates the numberof components that are linked to a certain degree at thescale of that number.
Even simpler approximations and calculations of thesystem are possible that are useful for applications toreal world problems. In particular, we can approximatethe complexity profile by considering sets of componentsthat are behaviorally linked. Counting the componentsof each set we approximate them as fully connected toeach other. Counting the number of sets of a certain sizeor larger gives the value of the complexity profile at thatsize. This is an approximation to the complexity profilebased upon the theorems of the previous section. This
construction can be helpful when there are sufficientlyclear distinctions between what constitutes dependentand independent components. Improved approximationsconsider the degree of dependency as given in Ref. [129].
K. Organizational response
A first approximation to the complexity profile of a so-cial system is to consider multiple individuals engagingin a particular activity, whose actions are linked to eachother as a measure of the scale of that activity. Eachactivity then is describable as a specific state of those in-dividuals. For example, two people using a crosscut sawmust adopt corresponding actions. Multiple two personteams may be working at the same time, but their ac-tions are not necessarily coordinated. The complexity ata particular scale of the system is the sum over the groups(possibly independent individuals) who are engaged incoordinated acts as part of a social organization. Thisapproximation can then be combined with the multiscalelaw of requisite variety to analyze the performance, orlack of performance, of specific organizations, i.e. socialsystems organized with the intention of performing par-ticular functions. In this context, we are interested inthe behavior across scales, ranging from individual to so-cietal. Despite their wide range of scales, these are alllarge scale behaviors from the point of view of funda-mental physics.
Thus, we can compare organizations that act basedupon individuals performing independent tasks, or largecoordinated groups performing a coordinated action.The multiscale version of Ashby’s Law now becomes thestatement that large scale tasks require large groups act-ing in a coordinated way, while comparatively small (in-dividual) scale high complexity tasks require independentindividuals performing distinct tasks. This is apparent inthe contrast between large scale military confrontation—such as during the gulf war, in which hundreds of thou-sands of individuals moved in a coordinated fashionduring the ground troop movements of February 24-281991—and normal diagnostic medical services—in whichhundreds of thousands of physicians perform medical di-agnoses on distinct individuals with diverse conditions.The recognition of the distinction of different types oftasks and the relationship of organizational structures tothe need to perform different tasks then serves as a basisfor developing principles of organizational structure formanagement.
General analyses of the relationship of structure andfunction can be inferred, specifically the limitation ofcentral control structures for performing highly complexcollective tasks [14]. This limitation arises because a hi-erarchy limits the extent of information that can be com-municated among the sub-groups of the hierarchy.
More specific insights can be obtained [131], these in-clude the recognition that the modern strategy of finan-cial management of medical services runs counter to the

19
ability of the medical system to provide small scale com-plex care to individuals [130], explaining the fundamentalfailure to provide high quality services. Similarly, thatthe education system, through centralization and stan-dardized testing, cannot match its actions to individualdifferences. In a military context, the ability to respondsuccessfully to highly complex military encounters is notpossible for conventional forces but is progressively moreeffectively met by individually trained marines and evenbetter, special forces [132]. Also, similarly, complex en-gineering projects cannot be performed by hierarchicaldecomposition as is described in the conventional water-fall process [133].
These observations can be inferred from the first or-der characterization of the complexity profile of differentsystems. They reflect on the overall functioning of socialsystems that are designed for performing different tasks.More detailed quantitative applications of the complexityprofile to such systems is possible. Essential insights intostructural ineffectiveness can be gained based upon man-ifest incompatibilities between the organizational struc-ture and the tasks using multiscale information theoryand the multiscale version of Ashby’s Law.
VIII. SUMMARY
We can expect that developing models of complex sys-tems will require major theoretical and experimental ef-forts for validation. It is not sufficient to create a model—it has to be analyzed for its ability to capture the behav-ior of the system and be robust to fine scale details. Thedifficulty is in recognizing universality classes and the de-pendencies on relevant parameters. These are technicallydemanding issues that require substantial care.
Why don’t we just include more details? If we includeenough, won’t a model be correct? The answer is no,for two reasons. The first is sufficient but the second ismore important. The first reason is that including manydetails without determining what is and is not importantcannot tell us whether we have included the details thatmatter. The second reason is that including many detailsthat don’t matter actually prevents us from addressingthe question we really want to answer: which levers areimportant? Determining the levers that are important isequivalent to determining what is important at the largerscales. Thus, the questions we really want to answerabout systems are exactly the same as the determinationof which variables are relevant.
Thus, this demanding process should not be avoided.The construction of large scale faithful models enables in-vestments in phenomenology to come to fruition in theirability to address key questions. The effort to createthem is therefore essential and worthwhile.
Considering systems in this way, we should recognizethat any mathematical model, and indeed any descrip-tion or characterization, whether from theory or phe-nomenology, in words, pictures, movies, numbers or equa-
tions, is “valid” only because of the irrelevance of details.Moreover, such information applies across different in-stances, because of the sufficiency of the representationhaving captured the important variables. Any two sys-tems we look at (or the same system at different momentsin time or different cases of the same system) are differentin detail. If we want to say anything meaningful about asystem—meaningful in the sense of scientific replicabilityor in terms of utility of knowledge—the only descriptionthat is important is one that has universality, i.e. is in-dependent of details. There is no utility to informationthat is only true in a particular instance. Thus, all of sci-entific inquiry should be understood as an inquiry intouniversality—the determination of the degree to whichinformation is general or specific.
IX. APPENDIX: TECHNICAL POINTS
While this paper is not intended as a “how to” pre-scription, there are several technical points that are rel-evant to applications in general. Moreover, the strategyof applications can be framed in a general way.
One of the keys to applying the analysis of large scalebehavior to complex physical, biological and social sys-tems quite generally is to recognize the importance ofidentifying the distinguishable states of the system atlarger scales of observation—and to be consistent aboutthe scale of observation at which we are describing thesystem, i.e. the level of uncertainty or error we can al-low in our description. A technical problem in this re-gard arises from the tendency to use real numbers thatdo not identify the number of distinct states they arerepresenting, or the relative size of different variables.This is apparent in the common use of algebraic trans-formation. For example, we often consider y or log(y) orey or 1/y to be equally valid variables. However, suchtransformations change the size of uncertainty of varia-tions at different values of the variable. Thus, using realnumbers without specifying the uncertainty and how itdepends on value of the variable, i.e. enumerating thedistinguishable values of the variable, obscures what weare trying to capture.
The second key is to understand how aggregationworks. As we increase the scale, or equivalently, reducethe level of resolution of our observations of a system,we see fewer details. Smaller distinctions disappear andonly larger distinctions that involve many parts of thesystem together remain. How properties aggregate de-termines what is observed, i.e. what is important. Usingthe inherent way that things aggregate enables us to fig-ure out what properties of a system are important atthe larger scale. Aggregation hinges on how the partsdepend on each other. The simplest case is when theyare either completely dependent or independent; in thiscase, aggregation is the averaging we know from statis-tics that gives rise to a normal (Gaussian) distribution.When elements are dependent, due to being influenced

20
by the same thing, or due to mutual interactions, thenthe aggregate of N elements scales as the system sizeN . When they are completely independent then the ag-gregate scales as the square-root of the system size
√N .
The key to understanding other kinds of systems andtheir scaling behavior is that the dependencies betweenthe parts due to interactions, constraints, and dynamics,give rise to different scaling behaviors.
The third key is recognizing that there is a universalway to represent the behavior of systems. Any systemcan be decomposed into components and an importantway of constructing a model is developing an understand-ing of how the behavior of the components in aggregatecomprise the behavior of the whole if their dependen-cies are properly accounted for. The property that isimportant to know about a component is the set of dis-tinguishable states it has. Similarly, the property thatis important to know about the system is the set of dis-tinguishable states it has. In addition, we need to knowhow external influences couple to these states. Thus, theprocess for developing a model is to: (a) identify the setof elements of a system to be described; (b) identify theset of distinguishable states they have; (c) identify thedependencies among these states; (d) analyze the distin-guishable states of the entire system as they arise fromthe distinguishable states of the components and theirdependencies; and (e) characterize the external influenceon the set of distinguishable states of the system.
Because of the pervasive use of calculus and statisticsin the analysis of systems today, we must watch out forthe inappropriate use of approximations that use thoseapproaches. Among these approximations are ad-hoc as-sumptions about which variables are the right variablesto describe a system, and the explicit or implicit use ofaveraging and smoothness in formulating the questions tobe analyzed. Such assumptions should be considered asapproximations, like the mean-field approximation whichassumes components are all subject to the same environ-mental conditions. This approximation, which returnsus to the smoothness and independence of calculus andstatistics, is often considered to be valid, but is not whenpatterns of behavior, in space or in time, arise in a systemthat lead to differences in local context and a need for ad-ditional variables. At the same time, we must not makethe error of considering the notion that “all data” shouldbe captured about a system, or identifying a-priori thedescription of the system to be used without perform-ing an analysis of which information is really important.Any such effort is incomplete as it is constrained by thenature of the information that is available.
Consider biological examples of what can be distin-guished: cell states, organ states, physiological states.Any model must start by identifying which are the statesthat are distinguishable. This should be done over amacroscopic range of scales that are relevant to obser-vation. This is not easy. Still, it is easier than the prob-lem of describing all of the fine scale details. To identifythe behavior of a tissue, we identify the distinguishable
states of the cells and the interactions between these dis-tinguishable states. We do not identify all of the detailsof cell function, only states that are distinguishable. Sim-ilarly, to model human beings in society, we only identifyhuman behavioral states that are distinguishable. Theremay be many reasons for specific individual states, butthose reasons are not relevant unless we are consideringa person in detail. This, therefore, is an entirely generalframework for modeling the behavior of complex systems.
Ultimately, however, the crux of the analysis that isto be performed is to identify the scale of information:how many components are doing the same thing. Thescientific question is to understand what controls howmany are doing the same thing. Among the issues thatare essential for this determination is identifying:
• External forces that act on the system, theirstrength and the way they influence the system.Barriers/boundaries that limit the influence canplay an important role, as well as the identificationof which components are directly affected.
• Internal mechanisms by which influence, contagion,mimicry, amplification as well as recovery affect thegrowth of the number of components that are doingthe same thing, or coupled things. The way compo-nents are connected to each other, across one, twoor three spatial dimensions, or more generally ina network, often matters. Also, influences amongcomponents can be simply reinforcing, or cause op-posing or other relationships that are behaviorallycoupled.
• Noise and its role in triggering new behaviors, aswell as independence and dissipation. Noise canbe considered as a kind of external force that sat-isfies the traditional statistical assumptions associ-ated with fine scale behaviors. Individual eventsare often approximated as having a localized andsmall scale influence, and independent events areoften considered to be pervasive across the system,affecting all components directly.
Isolated events arising from large scale external forceshave a trajectory of growth in size that is a cascade ofeffects. The accumulation of the effects of noise eventsare often key to power-law (fractal) scaling behaviors.Spatial patterns occur when influences are reinforcingover some distance and anti-reinforcing over a larger dis-tance. Oscillations occur when the same happens overtime. Identifying the specific behavior that occurs thenbecomes a task in characterizing only a few key aspectsof the external forces, internal mechanisms, and noise.
X. ACKNOWLEDGEMENTS
Many thanks to Maya Bialik for collaboration on anearlier version [134], and to Irving Epstein, Matthew

21
Hardcastle, Karla Z. Bertrand, Blake Stacey, Casey Friedman and Dominic Albino for helpful comments.
[1] Bar-Yam, Y. Dynamics of Complex Systems. PerseusPress: Reading, 1997.
[2] Sayama, H. Introduction to the Modeling and Analysisof Complex Systems, Open SUNY Textbooks, Binham-ton University, 2015.
[3] Domb, C. The Critical Point: A Historical IntroductionTo The Modern Theory of Critical Phenomena. Taylor& Francis: London, 1996.
[4] Levelt Sengers, J.M.H.; Greer, S.C. Thermodynamicanomalies near the critical point of steam. Intern J Heatand Mass Transfer 1972, 15, 1865-1886.
[5] Wilson, K.G. Renormalization group and critical phe-nomena. Phys Rev B 1971, 4, 3174-3205.
[6] Wilson, K.G. Problems in physics with many scales oflength. Sci Am 1979, 241, 140-157.
[7] Kadanoff, L. Scaling, universality and operator alge-bras. In: Phase Transitions and Critical Phenomena,Vol. 5a; Domb, C.; Green, M.S., Eds.; Academic: NewYork, 1978; pp 1-34.
[8] Nelson, D.R. Recent developments in phase transitionsand critical phenomena. Nature 1977, 269, 379-383.
[9] Kardar, M. Statistical Physics of Fields. CambridgeUniversity Press: Cambridge, 2007.
[10] Greer, S.C.; Moldover, M.R. Thermodynamic anomaliesat critical points of fluids. Annu Rev Phys Chem 1981,32, 233-265.
[11] Heller, P. Experimental investigations of critical phe-nomena. Rep Prog Phys 1967, 30, 731.
[12] Kadanoff, L.P.; Gotze, W.; Hamblen, D.; Hecht R.;Lewis, E.A.S.; Palciauskas, V.V.; et al. Static phenom-ena near critical points: Theory and experiment. RevMod Phys 1967, 39, 395-431.
[13] Landau, L.D. Men of Physics: L.D. Landau, Vol. 2; terHaar, D., Trans.; Pergamon: Oxford, 1969.
[14] Bar-Yam, Y. Multiscale variety in complex systems.Complexity 2004, 9, 37-45.
[15] Bar-Yam, Y. Multiscale complexity/entropy, Advancesin Complex Systems 2004, 7, 47-63.
[16] de Gennes, P.G. Scaling Concepts in Polymer Physics.Cornell University Press: Ithaca, 1979.
[17] Kardar, M.; Parisi, G.; Zhang, Y.C. Dynamic scaling ofgrowing interfaces. Phys Rev Lett 1986, 56, 889-892.
[18] Metzler, R, Bar-Yam, Y, Kardar, M. Information flowthrough a chaotic channel: prediction and postdiction atfinite resolution. Physical Review E 2004, 70, 2, 026205.
[19] Mandelbrot, BB, The fractal geometry of nature.Macmillan, 1983.
[20] Peng, CK, Buldyrev, SV, Goldberger, AL, Havlin, S,Sciortino, F, Simons, M,Stanley, HE, Long-range corre-lations in nucleotide sequences. Nature 1992; 356, 6365,168-170.
[21] Peng, CK, Havlin, S, Stanley, HE, Goldberger, AL.Quantification of scaling exponents and crossover phe-nomena in nonstationary heartbeat time series. Chaos:An Interdisciplinary Journal of Nonlinear Science, 1995;5, 1, 82-87.
[22] Mantegna, RN, Stanley, HE. Scaling behaviour in thedynamics of an economic index. Nature 1995; 376, 6535,
46-49.[23] Albert, R.; Barabasi, A.L. Statistical mechanics of com-
plex networks. Rev Mod Phys 2002, 74, 47-97.[24] West, G.B.; Brown, J.H.; Enquist, B.J. A general model
for the origin of allometric scaling laws in biology. Sci-ence 1997, 276, 122-126.
[25] Bettencourt, L, West, G, A unified theory of urban liv-ing. Nature 2010; 467, 7318, 912-913.
[26] Turing, A.M. The chemical basis of morphogenesis. BullMath Biol 1990, 52, 153-197.
[27] Lengyel, I.; Epstein, I.R. Turing structures in simplechemical reactions. Acc Chem Res 1993, 26, 235-240.
[28] Werner, E. All systems go. Nature 2007, 446, 493-494.[29] Kondo, S.; Miura, T. Reaction-diffusion model
as a framework for understanding biological pat-tern formation. Science 2010, 329, 1616-1620.doi:10.1126/science.1179047.
[30] Sussman, G.J.; Wisdom, J. Chaotic evolution of thesolar system. Science 1992, 257, 56-62.
[31] Fisher, R. A., The Genetical Theory of Natural Selec-tion (Clarendon Press, Oxford, 1930).
[32] Dawkins, R., The Selfish Gene, 2nd ed. (Oxford Univer-sity Press, 1989) p. 86.
[33] Whiteley AR, Bhat A, Martins EP, et al. Pop-ulation genomics of wild and laboratory zebrafish(Danio rerio). Molecular Ecology. 2011;20(20):4259-4276. doi:10.1111/j.1365-294X.2011.05272.x.
[34] Coe TS, Hamilton PB, Griffiths AM, et al. Geneticvariation in strains of zebrafish (Danio rerio) and theimplications for ecotoxicology studies. Ecotoxicology.2009;18:144150.
[35] Brown AR, Bickley LK, Le Page G, Hosken DJ, PaullGC, Hamilton PB, Owen SF, Robinson J, Sharpe AD,Tyler CR. Are Toxicological Responses in Laboratory(Inbred) Zebrafish Representative of Those in Outbred(Wild) Populations?? A Case Study with an EndocrineDisrupting Chemical. Environmental science & technol-ogy. 2011 Apr 6;45(9):4166-72.
[36] Miller RA, Austad S, Burke D, Chrisp C, Dysko R,Galecki A, Jackson A, Monnier V. Exotic mice as mod-els for aging research: polemic and prospectus. Neuro-biol Aging. 1999 Mar 1;20(2):217-31.
[37] Doebeli, M., Dieckmann, U., Speciation along environ-mental gradients. Nature 2003: 421, 259264.
[38] de Aguiar, M.A.M., Baranger, M., Baptestini, E.M.,Kaufman, L., Bar-Yam, Y. Global patterns of specia-tion and diversity. Nature 2009, 460, 384-387.
[39] Wild, G.; Gardner, A.; West, S.A. Adaptation and theevolution of parasite virulence in a connected world. Na-ture 2009, 459, 983-986.
[40] Wade, M.; Wilson, D.S.; Goodnight, C.; Taylor, D.;Bar-Yam, Y.; de Aguiar, M.A.M; et al. Multilevel andkin selection in a connected world. Nature 2010, 463,E8-E9.
[41] Nowak, M.A.; Tarnitam, C.E.; Wilson, E.O. The evolu-tion of eusociality. Nature 2010, 466, 1057-1062.
[42] Abbott, P.; Abe, J.; Alcock, J.; Alizon, S.; Alpedrinha,J.A.C.; Andersson, M.; et al. Inclusive fitness theory

22
and eusociality. Nature 2011, 471, E1-E4.[43] Bar-Yam, Y. Formalizing the gene-centered view of evo-
lution. Adv Complex Syst 1999, 2, 277-281.[44] Sayama, H.; Kaufman, L.; Bar-Yam, Y. Symmetry
breaking and coarsening in spatially distributed evo-lutionary processes including sexual reproduction anddisruptive selection. Phys Rev E 2000, 62, 7065-7069.
[45] Rauch, E.; Sayama, H.; Bar-Yam, Y. Relationship be-tween measures of fitness and time scale in evolution.Phys Rev Lett 2002, 88, 228101.
[46] Werfel, J.K.; Bar-Yam, Y. The evolution of reproductiverestraint through social communication. PNAS 2004,101, 11019-11024.
[47] Stacey, B.C.; Gros, A.; Bar-Yam, Y. Beyond themean field in host-pathogen spatial ecology. arXiv 2012,1110.3845 [nlin.CG].
[48] Rauch, E.M.; Bar-Yam, Y. Long-Range Interactionand Evolutionary Stability in a Predator-Prey System.Physical Review E 2006, 73, 020903.
[49] Werfel, J.; Ingber, D.E.; Bar-Yam, Y. Programeddeath is favored by natural selection in spatial systems.Phys Rev Lett 2015, 114, 238103. doi: 10.1103/Phys-RevLett.114.238103.
[50] Prendergast, JR, Quinn RM, Lawton, JH, Eversham,BC, Gibbons, DW, Rare species, the coincidence ofdiversity hotspots and conservation strategies. Nature1993: 365, 335-337.
[51] Myers, N., Mittermeier, RA, Mittermeier, CG, da Fon-seca, GAB, Kent, J. Biodiversity hotspots for conserva-tion priorities, Nature 2000: 403, 853-858 (2000).
[52] Gaston, K.J. Global patterns in biodiversity. Nature2000: 405, 220-227.
[53] Ehrlich, P.R. & Wilson, E.O. Biodiversity studies: sci-ence and policy. Science 1991:253, 758-761.
[54] Faith, D.P. Genetic diversity and taxonomic prioritiesfor conservation. Biol. Cons. 1994:68, 69-74.
[55] Amos, W, Balmford, A, When does conservation genet-ics matter? Heredity 2001:87, 257.
[56] Frankham, R, Lees, K, Montgomery, ME, England, PR,Lowe, EH, Briscoe, DA, Do population size bottlenecksreduce evolutionary potential? Anim. Cons. 1999:2,255-260.
[57] Allen B, Kon M, Bar-Yam Y. A new phyloge-netic diversity measure generalizing the Shannonindex and its application to phyllostomid bats.The American Naturalist. 2009 Aug;174(2):236-43.http://doi.org/10.1086/600101
[58] Nee, S, May, RM, Extinction and the Loss of Evolution-ary History. Science 1997:278, 692-694.
[59] Crozier, R.H. Preserving the information content ofspecies: genetic diversity, phylogeny, and conservationworth. Ann. Rev. Ecol. Syst. 1997:28, 243-268.
[60] Moritz, C. Defining evolutionarily significant units forconservation. Trends Ecol. Evol. 1994:9, 373-375.
[61] Lim, M.; Metzler, R.; Bar-Yam, Y. Global pattern for-mation and ethnic/cultural violence. Science 2007, 317,1540-1544. PMID: 17872443.
[62] Rutherford, A.; Harmon, D.; Werfel, J.K.; Bar-Yam, S.;Gard-Murray, A.; Gros, A.; et al. Good fences: The im-portance of setting boundaries for peaceful coexistence.arXiv 2011, 1110.1409.
[63] Bray, AJ, Theory of Phase Ordering Kinetics, Adv.Phys. 43, 357 (1994).
[64] Lagi, M,; Bar-Yam, Y.; Bertrand, K.; Bar-Yam, Y.
The food crises: A quantitative model of food prices in-cluding speculators and ethanol conversion. arXiv 2011:1109.4859 [q-fin.GN].
[65] Lagi, M.; Bar-Yam, Y.; Bertrand, K.; Bar-Yam, Y.Update February 2012: The food crises: Predictivevalidation of a quantitative model of food prices in-cluding speculators and ethanol conversion. arXiv 2012,1203.1313 [physics.soc-ph].
[66] Fama, E. Efficient capital markets: A review of the-ory and empirical work. J Finance 1970, 25, 383-417.doi:10.2307/2325486. JSTOR 2325486.
[67] Shiller, R. Irrational Exuberance. 2nd ed. PrincetonUniversity Press: Princeton, 2005. ISBN 0-691-12335-7.
[68] De Long, J.B.; Shleifer, A.; Summers, L.H.; Waldmann,R.J. Positive feedback investment strategies and desta-bilizing rational speculation. J Finance 1990, 45, 379-395.
[69] LeBaron, B.; Arthur, W.B.; Palmer, R. Time seriesproperties of an artificial stock market. J Econ Dyn andControl 1999, 23, 1487-1516.
[70] Muchnik, L.; Solomon, S. Statistical mechanics of con-ventional traders may lead to non-conventional marketbehavior. Physica Scripta 2003, T106, 41-47.
[71] Lux, T.; Marchesi, M. Scaling and criticality in astochastic multi-agent model of a financial market. Na-ture 1999, 397, 498-500.
[72] Hommes, C.; Wagener, F.O.O. Complex evolutionarysystems in behavioral finance. In: Handbook of Fi-nancial Markets: Dynamics and Evolution; Hens, T.;Schenk-Hoppe, K.R., Eds.; North Holland: Amsterdam,2009; pp 217-276.
[73] Prinz F, Schlange T, Asadullah K. Believe it or not:how much can we rely on published data on potentialdrug targets?. Nature reviews Drug discovery. 2011 Sep1;10(9):712-
[74] Ioannidis JPA, Why Most Published Research Find-ings Are False. PLoS Med 2005: 2(8): e124.doi:10.1371/journal.pmed.0020124
[75] Mobley A, Linder SK, Braeuer R, Ellis LM, ZwellingL. A Survey on Data Reproducibility in Cancer Re-search Provides Insights into Our Limited Abilityto Translate Findings from the Laboratory to theClinic. Arakawa H, ed. PLoS ONE. 2013;8(5):e63221.doi:10.1371/journal.pone.0063221.
[76] L.P. Freedman, I.M. Cockburn and T.S. Simcoe. Theeconomics of reproducibility in preclinical research.PLOS Biology. Vol. 13, June 9, 2015, p. 31002165. doi:10.1371/journal/pbio.1002165.
[77] Harmon, D.; Lagi, M.; de Aguiar, M.A.M.; Chinel-lato, D.; Braha, D.; Epstein, I.; Bar-Yam, Y., Antic-ipating economic market crises using measures of col-lective panic. PLoS ONE July 2015, 10(7): e0131871,doi:10.1371/journal.pone.0131871
[78] de Aguiar, M. A. M., Epstein, I., Bar-Yam, Y. Analyti-cally Solvable Model Of Probabilistic Network Dynam-ics. Physical Review E 2005, 72, 067102.
[79] Albert R, Barabasi AL. Statistical mechanics of complexnetworks. Rev. Mod. Phys. 2002; 74: 47-97.
[80] Braha D, Bar-Yam Y. From centrality to temporaryfame: dynamic centrality in complex networks. Com-plexity. 2006; 12: 59-63.
[81] Hill SA, Braha D. Dynamic model of time-dependentcomplex networks. Physical Review E. 2010; 82: 046105.

23
[82] Mantegna RN. Hierarchical structure in financial mar-kets. Euro. Phys. J. B. 1999; 11: 193-197.
[83] Garas A, Argyrakis P, Havlin S. The structural role ofweak and strong links in a financial market network.The European Physical Journal B-Condensed Matterand Complex Systems. 2008; 63: 265-271.
[84] Schweitzer F, et al. Economic networks: the new chal-lenges. Science. 2009; 325: 422-425.
[85] Emmert-Streib F, Dehmer M. Influence of the time scaleon the construction of financial networks. PloS one.2010; 5: e12884.
[86] Vandewalle N, Brisbois F, Tordoir X. Self-organizedcritical topology of stock markets; 2000, arXiv: cond-mat/0009245.
[87] Bonnanno G, Caldarelli G, Lillo F, Mantegna RN.Topology of correlation-based minimal spanning trees inreal and model markets. Phys. Rev. E. 2003; 68: 046103.
[88] Kenett DY, Tumminello M, Madi A, Gur-GershgorenG, Mantegna RN, Ben-Jacob E. Dominating clasp of thefinancial sector revealed by partial correlation analysisof the stock market. PloS one. 2010; 5: e15032.
[89] Mantegna RN, Stanley HE. An introduction to econo-physics. 1st ed. Cambridge: Cambridge UniversityPress; 2000.
[90] Onnela JP, Chakraborti A, Kaski K, Kertesz J, KantoA. Dynamics of market correlations: taxonomy andportfolio analysis. Phys. Rev. E. 2003; 68: 056110.
[91] Harmon D, Stacey B, Bar-Yam Y, Bar-Yam Y. Net-works of economic market interdependence and systemicrisk. arXiv: 2010, 1011.3707v2.
[92] Kenett DY, Preis T, Gur-Gershgoren G, Ben-Jacob E.Dependency network and node influence: application tothe study of financial markets. International Journal ofBifurcation and Chaos. 2012; 22: 1250181.
[93] Guillaume DM et al. From the bird’s eye to the micro-scope: a survey of new stylized facts of the intra-dailyforeign exchange markets. Fin. Stoch. 1997; 1: 95-129.
[94] Gopikrishnan P, Meyer M, Amaral LAN, Stanley HE.Inverse cubic law for the distribution of stock price vari-ations. Eur. Phys. J. B. 1998; 3: 139-140.
[95] Chinellato DD, de Aguiar MAM, Epstein IR, BrahaD, Bar Yam Y. Dynamical response of networks un-der external perturbations: exact results, arXiv 2007;0705.4607v2. .
[96] Chinellato DD, Epstein IR, Braha D, Bar Yam Y, deAguiar MAM. Dynamical response of networks underexternal perturbations: exact results. Journal of Statis-tical Physics. 2015; 159: 221-230.
[97] Harmon D, de Aguiar MAM, Chinellato DD, Braha D,Epstein IR, Bar-Yam Y. Predicting economic marketcrises using measures of collective panic, arXiv 2011;1102.2620 [q-fin.ST].
[98] Majdandzic A, et al. Spontaneous recovery in dynamicalnetworks. Nature Physics. 2014; 10: 34-38.
[99] Bury T. Predicting trend reversals using market instan-taneous state. Physica A: Statistical Mechanics and itsApplications. 2014; 404: 79-91.
[100] Wolfenstein M. Disaster. 1st ed. Glencoe, Illinois: FreePress; 1957.
[101] Smelser NJ. Theory of Collective Behavior. 1st ed. Glen-coe, Illinois: Free Press; 1963.
[102] Quarantelli EL. The sociology of panic. In: Smelser NJ,Baltes PB, editors. International Encyclopedia of theSocial and Behavioral Sciences. New York, NY: Elsevier;
2001. pp. 11020-11023.[103] Mawson AR. Understanding mass panic and other col-
lective responses to threat and disaster. Psychiatry.2005; 68: 95-113.
[104] Diamond DW, Dybvig PH. Bank runs, deposit insur-ance, and liquidity. Fed. Res. Bank. Minn. Quart. Rev.2000; 24: 14-23.
[105] Calomiris CW, Gorton G. The origins of banking panics:models, facts, and bank regulation. In: Hubbard RG,editor. Financial markets and financial crises. Chicago:National Bureau of Economic Research; 1990. pp. 109-175.
[106] Cutler D, Poterba J, Summers L. What moves stockprices? Journal of Portfolio Managment. 1989; 15: 4-12.
[107] Mann L, Nagel T, Dowling P. A study of economicpanic: The “run” on the Hindmarsh Building Society.Sociometry. 1976; 39: 223-235.
[108] Galbraith JK. The Great Crash 1929. 1st ed. New York,NY: Houghton Mifflin; 1954.
[109] Kindleberger C. Manias, panics, and crashes. 1st ed.New York, NY: John Wiley & Sons Inc; 1978.
[110] Sornette D, Johansen A, Bouchaud JP. Stock marketcrashes, precursors and replicas. Journal de Physique I(France). 1996; 6: 167-175.
[111] Feigenbaum JA, Freund PGO. Discrete scale invariancein stock markets before crashes. Int. J. Mod. Phys. B.1996; 10: 3737-3745.
[112] Sornette D, Johansen A. Large financial crashes. Phys-ica A. 1997; 245: 411-422.
[113] Sornette D, Stauffer D, Takayasu H. Market fluctuationsII: multiplicative and percolation models, size effects,and predictions. In: Bunde A, Kropp J, SchellnhuberHJ, editors. The science of disasters: climate disrup-tions, heart attacks, and market crashes. New York, NY:Springer;2002. pp. 411-433.
[114] Sornette D. Endogenous versus exogenous origins ofcrises. In: Albeverio S, Jentsch V, Kantz H, editors.Extreme events in nature and society. New York, NY:Springer; 2006. pp. 95-116.
[115] Bree DS, Joseph NL. Fitting the log periodic powerlaw to financial crashes: a critical analysis, arXiv 2010,1002.1010v1.
[116] Cho A. Econophysics: still controversial after all theseyears. Science. 2009; 325: 408.
[117] Feigenbaum JA. A statistical analysis of log-periodicprecursors to financial crashes. Quant. Finance. 2001;1: 346-360.
[118] Sornette D, Johansen A. Significance of log-periodic pre-cursors to financial crashes. Quant. Finance. 2001; 1:452-471.
[119] Scheffer M, et al. Early-warning signals for critical tran-sitions. Nature. 2009; 461: 53-59.
[120] Scheffer M, et al. Anticipating critical transitions. Sci-ence. 2012; 338: 344-348.
[121] Ewens WJ. Mathematical Population Genetics I. The-oretical Introduction. 1st ed. New York, NY: SpringerVerlag; 1979.
[122] de Aguiar MAM, Bar-Yam Y. Moran model as a dynam-ical process on networks and its implications for neutralspeciation. Phys. Rev. E. 2011; 84: 031901.
[123] Arthur WB. Self-reinforcing mechanisms in economics.In: Anderson PW, Arrow KJ, Pines D, editors. Theeconomy as an evolving complex system. New York, NY:

24
Westview Press; 1988. pp. 9-33.[124] Allen, B, Stacey, BC, Bar-Yam, Y. An Information-
Theoretic Formalism for Multiscale Structure in Com-plex Systems. arXiv 2014, 1409.4708.
[125] Mahan, GD, Many-particle physics. Springer Science &Business Media, 2013.
[126] Metzler, R, Bar-Yam, Y, Multiscale complexity of cor-related Gaussians, Phys. Rev. E 2005, 71, 046114.
[127] Gheorghiu-Svirschevski, S, Bar-Yam, Y, Multiscaleanalysis of information correlations in an infinite-range,ferromagnetic Ising system, Phys Rev E 2004, 70,066115.
[128] Bar-Yam, Y, A Mathematical Theory of Strong Emer-gence using Multiscale Variety, Complexity 2004, 9, 6,15-24.
[129] Bar-Yam, Yavni, Harmon, D, Bar-Yam, Yaneer, Com-putationally tractable pairwise complexity profile, Com-plexity 2013, 18, 5.
[130] Bar-Yam, Y, Improving the Effectiveness of Health Careand Public Health: A Multiscale Complex SystemsAnalysis, American Journal of Public Health 2006, 96,3, 459-466.
[131] Bar-Yam, Y, Making Things Work: Solving Com-plex Problems in a Complex World, NECSI KnowledgePress, 2005.
[132] Bar-Yam, Y, Global civilization and counterterrorism,CTC Sentinel 2015, 8, 7, 17-22.
[133] Bar-Yam, Y, When Systems Engineering Fails — To-ward Complex Systems Engineering in InternationalConference on Systems, Man & Cybernetics 2003 Vol.2, IEEE Press, Piscataway, NJ, 2003, 2021-2028.
[134] Bialik, M, Bar-Yam, Y, Beyond big data: Identify-ing important information for solving real world prob-lems. New England Complex Systems Institute http:
//necsi.edu/projects/yaneer/information/