Friend recommendation for cross marketing in online brand ...
12
HAL Id: hal-02383107 https://hal.inria.fr/hal-02383107 Submitted on 28 Nov 2019 HAL is a multi-disciplinary open access archive for the deposit and dissemination of sci- entific research documents, whether they are pub- lished or not. The documents may come from teaching and research institutions in France or abroad, or from public or private research centers. L’archive ouverte pluridisciplinaire HAL, est destinée au dépôt et à la diffusion de documents scientifiques de niveau recherche, publiés ou non, émanant des établissements d’enseignement et de recherche français ou étrangers, des laboratoires publics ou privés. Friend recommendation for cross marketing in online brand community based on intelligent attention allocation link prediction algorithm Shugang Li, Xuewei Song, Hanyu Lu, Linyi Zeng, Miaojing Shi, Fang Liu To cite this version: Shugang Li, Xuewei Song, Hanyu Lu, Linyi Zeng, Miaojing Shi, et al.. Friend recommendation for cross marketing in online brand community based on intelligent attention allocation link prediction algo- rithm. Expert Systems with Applications, Elsevier, 2019, 139, pp.1-11. 10.1016/j.eswa.2019.112839. hal-02383107
Transcript of Friend recommendation for cross marketing in online brand ...
HAL Id: hal-02383107https://hal.inria.fr/hal-02383107
Submitted on 28 Nov 2019
HAL is a multi-disciplinary open accessarchive for the deposit and dissemination of sci-entific research documents, whether they are pub-lished or not. The documents may come fromteaching and research institutions in France orabroad, or from public or private research centers.
L’archive ouverte pluridisciplinaire HAL, estdestinée au dépôt et à la diffusion de documentsscientifiques de niveau recherche, publiés ou non,émanant des établissements d’enseignement et derecherche français ou étrangers, des laboratoirespublics ou privés.
Friend recommendation for cross marketing in onlinebrand community based on intelligent attention
allocation link prediction algorithmShugang Li, Xuewei Song, Hanyu Lu, Linyi Zeng, Miaojing Shi, Fang Liu
To cite this version:Shugang Li, Xuewei Song, Hanyu Lu, Linyi Zeng, Miaojing Shi, et al.. Friend recommendation for crossmarketing in online brand community based on intelligent attention allocation link prediction algo-rithm. Expert Systems with Applications, Elsevier, 2019, 139, pp.1-11. �10.1016/j.eswa.2019.112839�.�hal-02383107�
Expert Systems With Applications 139 (2020) 112839
Contents lists available at ScienceDirect
Expert Systems With Applications
journal homepage: www.elsevier.com/locate/eswa
Friend recommendation for cross marketing in online brand
community based on intelligent attention allocation link prediction
algorithm
Shugang Li a , Xuewei Song
a , Hanyu Lu
a , Linyi Zeng
a , b , ∗, Miaojing Shi c , Fang Liu
a
a School of management, Shanghai University, Shanghai, 2004 4 4, PR China b Software Development Center, Industrial and Commercial Bank of China, Shanghai, 201206, PR China c Univ Rennes, Inria, CNRS, IRISA, 35042, France
a r t i c l e i n f o
Article history:
Received 17 August 2018
Revised 24 July 2019
Accepted 24 July 2019
Available online 25 July 2019
Keywords:
Friend recommendation
Link prediction
AAI
Mutually complementary indices
Cross marketing
a b s t r a c t
Circle structure of online brand communities allows companies to conduct cross-marketing activities by
the influence of friends in different circles and build strong and lasting relationships with customers.
However, existing works on the friend recommendation in social network do not consider establishing
friendships between users in different circles, which has the problems of network sparsity, neither do
they study the adaptive generation of appropriate link prediction algorithms for different circle features.
In order to fill the gaps in previous works, the intelligent attention allocation link prediction algorithm is
proposed to adaptively build attention allocation index (AAI) according to the sparseness of the network
and predict the possible friendships between users in different circles. The AAI reflects the amount of
attention allocated to the user pair by their common friend in the triadic closure structure, which is de-
cided by the friend count of the common friend. Specifically, for the purpose of overcoming the problem
of network sparsity, the AAIs of both the direct common friends and indirect ones are developed. Next,
the decision tree (DT) method is constructed to adaptively select the suitable AAIs for the circle struc-
ture based on the density of common friends and the dispersion level of common friends’ attention. In
addition, for the sake of further improving the accuracy of the selected AAI, its complementary AAIs are
identified with support vector machine model according to their similarity in value, direction, and rank-
ing. Finally, the mutually complementary indices are combined into a composite one to comprehensively
portray the attention distribution of common friends of users in different circles and predict their pos-
sible friendships for cross-marketing activities. Experimental results on Twitter and Google + show that
the model has highly reliable prediction performance.
© 2019 Elsevier Ltd. All rights reserved.
1
h
o
h
m
p
c
r
2
Z
c
e
t
b
v
&
(
m
A
l
h
0
. Introduction
With the rapid development of the Internet, the popularity of
igh-speed, stable Internet services and the increasing experiences
f online shopping, 80% of the top 500 companies in the world
ave established online brand communities. The online brand com-
unity brings together the scattered target customers of the com-
any accurately and has become a new platform for company to
arry out marketing activities as well as build strong and lasting
elationships with customers ( John, Mochon, Emrich, & Schwartz,
017 ).
∗ Corresponding author.
E-mail addresses: [email protected] (X. Song), [email protected] (L.
eng), [email protected] (M. Shi).
t
l
r
u
m
ttps://doi.org/10.1016/j.eswa.2019.112839
957-4174/© 2019 Elsevier Ltd. All rights reserved.
A large number of works have already shown that friend groups
an affect individual consumer decisions, for example, product
valuation, purchase possibility ( Whittler & Spira, 2002 ), and ac-
ual purchase behavior ( Li, Chou, & Lin, 2014 ). Moreover, when
rand preference conflicts between group and individuals, indi-
iduals may hide their consumption behavior ( Thomas, Jewell,
Jennifer, 2015 ). Some scholars in consumer behavior studies
Solomon, 2016 ) pointed out that the lower the user require-
ents for product, the higher the influence of the reference group.
ral (2013) studied the case of 1.4 million Facebook users down-
oading a movie application to find out the factors that affected
heir decision making. He randomly divided users who had down-
oaded the application into three groups: The first group had the
ight to invite their friends to try it on their own; friends of the
sers in the second group received an automatically generated
essage indicating that their friends were using the application;
2 S. Li, X. Song and H. Lu et al. / Expert Systems With Applications 139 (2020) 112839
n
u
m
c
o
t
o
e
S
f
S
S
2
p
w
s
g
B
l
a
e
i
2
o
r
c
(
l
s
l
a
s
i
t
t
m
t
n
m
a
t
a
a
m
s
t
l
A
S
(
(
2
fi
t
f
b
m
p
I
w
friends of the users in the third group did not receive any mes-
sages. As a result, 6% of the friends who received the unsolicited
invitation downloaded the application, compared with 2% of those
who received automatic tips. In addition, he also compared users
who actively sent invitations and successfully invited friends with
users who sent automatic tips to friends and invited friends. In the
long run, the former used the application for more time than the
latter.
Friends in online brand communities share their passion for
a specific brand as well as exchange information and knowledge,
and these social interactions positively influence the member loy-
alty to the brand ( Brogi, 2014 ). In addition, some members who
share a common interest or prefer the same product are further
gathered together to form different sub-groups, i.e. circles ( Wang
& Xue, 2010 ) in a brand community. Circle structure provides fer-
tile ground for cross-marketing, where sales are amplified with the
influence of friends though forming friendships between users in
different circles.
Scoring link prediction algorithm (SLPA) is the main approach
to predict whether there are links between node pairs in the social
network and recommend friendships between user nodes based
on network topology. So far, various SLPAs have been widely ap-
plied for the recommendation of friends, such as the Common
Neighbor index (CN), the Hub Promoted Index (HPI), and the Re-
source Allocation (RA) ( Lü & Zhou, 2011 ). However, existing works
on prediction friendships in social network do not consider es-
tablishing friendships between users in different circles, which
bears on the problem of network sparsity. What’s worse, there
is not yet an SLPA suitable for all network circle structures. So,
constructing the suitable SLPA based on circle structure charac-
teristics is of significant theoretical and practical value, which is
a complex work that requires a lot of expert experience. There-
fore, it is of great significance to develop method that relies solely
on network data to build appropriate SLPA, so that inexperienced
practitioners can easily use it to obtain highly reliable prediction
results.
To address these problems, this study proposes the intelligent
attention allocation link prediction algorithm (IAALP A) to pre-
dict the possible friendships between users in different circles by
adaptively building attention allocation index (AAI) for specific cir-
cles, and the AAI represents the amount of attention assigned to
the user pair by their common friend in the triadic closure struc-
ture, which is determined by the friend count of the common
friend.
Specifically, for the purpose of overcoming the network spar-
sity problem in predicting friendships between users in different
circles, the AAIs of both the direct common friends and indirect
ones are developed based on the principle of attention allocation
of common friends in triadic closure structure. Since it’s difficult
to build the AAI that fits all the structural characteristics of cir-
cles, in light of the characteristics of the density of common friends
and the dispersion level of common friends’ attention, the decision
tree (DT) method ( Wang, Wu, & Yao, 2017 ) is developed to adap-
tively select the AAI suitable for predicting possible links between
user nodes in different circles. In addition, although the combi-
nation of single AAI can help improve its link prediction perfor-
mance, the blind combination of AAIs cannot bring the expected
results ( Gomes, Barddal, Enembreck, & Bifet, 2017 ). To this end,
IAALPA applies the support vector machine (SVM) ( Shan, Kong,
Zhang, Li et al., 2018 ) model to identify the complementary AAIs of
the AAI selected by DT, which can improve the performance of the
selected AAI by combining them as a composite indicator. Finally,
the selected AAI and its complementary ones are used to design
the composite mutually complementary AAI to comprehensively
portray the attention allocated to user node pairs by their com-
mon friends and forecast the possible connections between user
odes in different circles. Consequently, the friendships between
sers in different circles are recommended and successfully cross-
arketing is achieved. Specifically, a group of users of one product
ircle are recommended to the target customers who are the users
f another circle in online brand community. Accordingly, when
he brand marketers are supported by the friend group’s influence
n individuals, they can significantly enhance the cross-marketing
fficiency of the product.
The remainder of this paper is organized as follows:
ection 2 introduces the link prediction; Section 3 offers
riend group recommendation; Section 4 explains the IAALPA;
ection 5 offers the experimental design and the results analysis;
ection 6 gives a summary of this study.
. Link prediction
Link prediction is a network-related problem, which consists of
redicting new connections and detecting hidden links in a net-
ork. It is an important task applicable to a wide variety of areas,
uch as bibliographic domain, molecule biology, criminal investi-
ations and recommending systems ( Lü & Zhou, 2011; Martínez,
erzal, & Cubero, 2017; Xiang, 2008 ). The link prediction prob-
em can be formally defined as follows. Given a snapshot of
social network at time t , we seek to accurately predict the
dges that will be added to the network at time t + � by defin-
ng a similarity or a probability index ( Liben-Nowell & Kleinberg,
007; Martínez et al., 2017 ). The existing link prediction meth-
ds can be divided into four categories: Link prediction algo-
ithms based on similarity measures, probabilistic and statisti-
al methods, algorithmic approaches and preprocessing methods
Martínez et al., 2017 ). Among these approaches to treat the prob-
em, the most widespread ones rely on the use of similarity mea-
ures between node pairs ( Lü & Zhou, 2011; Martínez et al., 2017 ).
The similarity measures proposed and evaluated in previous
iterature can be broadly categorized into two groups: semantic
nd topological measures ( Kaya & Poyraz, 2016 ). Semantic mea-
ures use the nodes’ content to survey similarity. For instance,
n a co-authorship network, the similarity between keywords ex-
racted from published papers were applied to predict future in-
eraction among the authors ( Xiang, 2008 ). Different from the se-
antic measures, the topological measures consist of deploying
he network structure to compute the similarity scores (e.g. the
umber of common neighbors that two nodes share). Topological
easures are more commonly adopted in the literature since they
re more general and do not require the definition of rich features
o describe content. In fact, rich features are not always available
nd depend on the social network considered.
Several topological measures are proposed in existing literature
nd mainly categorized into neighborhood-based and path-based
easures ( Kaya & Poyraz, 2016 ). The neighborhood-based mea-
ures take the nodes’ immediate neighbors into account. In general,
hese measures consider that two nodes are more likely to form a
ink if their sets of neighbors have a large overlap ( Xiang, 2008 ).
mong the neighborhood-based measures, Salton ( Newman, 2001 ),
orenson, HPI, Hub Depressed Index (HDI), Leicht–Holme–Newman
LHN), Preferential Attachment(PA) ( Barabâsi et al., 2002 ), RA
Adamic & Adar, 2003 ) and Jaccard’s coefficient ( Martínez et al.,
017 ) can be mentioned. The path-based measures in turn de-
ne the similarity between nodes by considering the paths be-
ween them. The basic idea is that two nodes are more likely to
orm a link if there are more short paths between them. The path-
ased measures range from the ordinary path-distance measures to
ore sophisticated measures that consider ensembles of different
aths, for instance, the Katz measure ( Soares & Prudêncio, 2013 ).
n comparative terms, the neighborhood-based methods are more
idespread, due to both their computational efficiency and great

S. Li, X. Song and H. Lu et al. / Expert Systems With Applications 139 (2020) 112839 3
p
&
p
o
n
g
b
M
b
a
t
w
a
n
F
c
s
c
i
t
a
t
t
i
t
l
m
l
s
s
c
p
s
d
A
v
i
a
n
f
t
i
r
t
i
s
w
t
o
l
t
o
M
t
w
m
i
r
s
p
i
s
3
3
t
i
u
p
p
p
t
c
g
(
c
T
f
a
n
a
t
t
n
t
p
f
d
A
d
i
i
1
S
g
T
e
c
a
t
p
3
n
t
p
i
o
o
m
o
s
i
3
H
s
A
a
b
b
erformance observed in experiments ( Huang, 2006; Liben-Nowell
Kleinberg, 2007; Murata & Moriyasu, 2008 ). The measures pro-
osed in this study can be categorized as neighborhood-based
nes, since they use information about the connections around
odes to assign scores to them. But the uniqueness of our al-
orithm is that it considers not only the direct common neigh-
ors of node pairs but also their indirect common neighbors.
oreover, the feature of attention allocation of common neigh-
ors, namely the friend count of common neighbors, is taken into
ccount.
Since a SLPA is not sufficient to fully characterize the network,
he combined link prediction algorithms are developed. On the
hole, there are many combined link prediction algorithms which
re built with a high degree of versatility to suit a variety of
etworks based on multiple network characteristics. For example,
an, Liu, Lu, Xiu, and Chen (2017) proposed a composite link fore-
asting index and took into account the node type effect and node
tructure similarity. Wu and Tang (2014) developed a directed so-
ial network link prediction method based on the topic model that
ntegrated node attributes and network structures for link predic-
ion. Muniz, Goldschmidt, and Choren (2018) used context (node
nd link attributes), temporal information (chronological interac-
ion data) and topology information to calculate link weights be-
ween nodes, and then applied weighted similarity function to
dentify potential links. Xiao, Li, Wang, Xu, and Liu (2018) studied
he internal and external factors that influenced the formation of
inks and developed a three-level hidden Bayesian link prediction
odel by combining the user behaviors and user relationships to
ink prediction.
Unlike existing works that focus on algorithm versatility, this
tudy tends to build the suitable algorithms for specific circle
tructures. Obviously, network structures are diverse and a SLPA
annot perform well in all networks. Accordingly, this study pro-
oses IAALPA to adaptively select AAIs suitable for the given circle
tructure according to the network features of common neighbor
ensity and attention dispersing. Additionally, the complementary
AIs of the selected AAI are screen out based on their similarity in
alue, direction, and ranking. Subsequently, the selected AAI and
ts complementary ones are combined into one composite index to
void the low prediction performance caused by the blind combi-
ation of AAIs.
In recent years, many scholars have done valuable works on
riend recommendation in social network based on link predic-
ion methods. Using the recommendation algorithm of data min-
ng, Liu, Yu, Wei, and Ning (2018) proposed an improved algo-
ithm to rank the recommended information with confidence in-
erval, and recommended friends with the same interest for users
n microblog. Yuan, Cheng, Zhang, Liu, and Lu (2015) designed a
ocial influence propagation method to mine user’s buddy (friends
ho had a great impact on user) and susceptibility (willingness
o be affected), and developed a recommendation model based
n the impact of social relations. He et al. (2017) integrated
ink and content information and developed the MapReduce dis-
ributed computing framework to implement the recommendation
f friends in large-scale online community network. Zhu, Lu, and
a (2015) mined user interests from short messages and proposed
he neighbor-based friend recommendation to recommend users
ith similar interests.
Despite intensive research efforts, there is a distinct lack of
ethodology for recommending friends in different social circles
n a social network, which is different from the traditional friend
ecommendation due to the problem of network sparseness. In this
tudy, IAALPA is constructed to recommend the user group in one
roduct circle to the target user in another product circle, and the
nfluence of the friend group is used to affect the purchase deci-
ion of the target user, so as to realize cross-selling.
. Friend group recommendation for cross-marketing
.1. Cross-marketing in a brand community
The online brand community is defined as D ( V, E ), where V is
he set of nodes representing the users in the community and E
s the set of edges representing the friend relationships between
sers. In a brand community, users will form a circle because they
refer the same type of product. The set of users in the circle of
roduct A is defined as V A and the set of users in the circle of
roduct B is defined as V B . In cross-marketing, if product A is sold
o users in the circle of product B, all users in the product A circle
an be recommended to users in the product B circle as the friend
roup, and vice versa.
Usually, the nodes in the same circle are closely connected
there are more common friends), while the nodes in different
ircles are sparsely connected (there are fewer common friends).
herefore, recommending users in different circles to become
riends often faces the problem of network sparsity, which is char-
cterized by the average degree of network being far less than the
umber of nodes ( Lei & Rinaldo, 2015 ). Since the topological char-
cteristics of social networks are all related to average degree, ei-
her directly or indirectly, sparsity will affect the performance of
he existing SLPAs because these algorithms heavily rely on the
etwork topology. Consequently, traditional SLPAs cannot guaran-
ee high prediction accuracy of friend recommendation in different
roduct circles. To address this problem, IAALPA is developed to
ully describe the possibility of connection between user nodes in
ifferent circles and construct a suitable mutually complementary
AI for the specific circle structure.
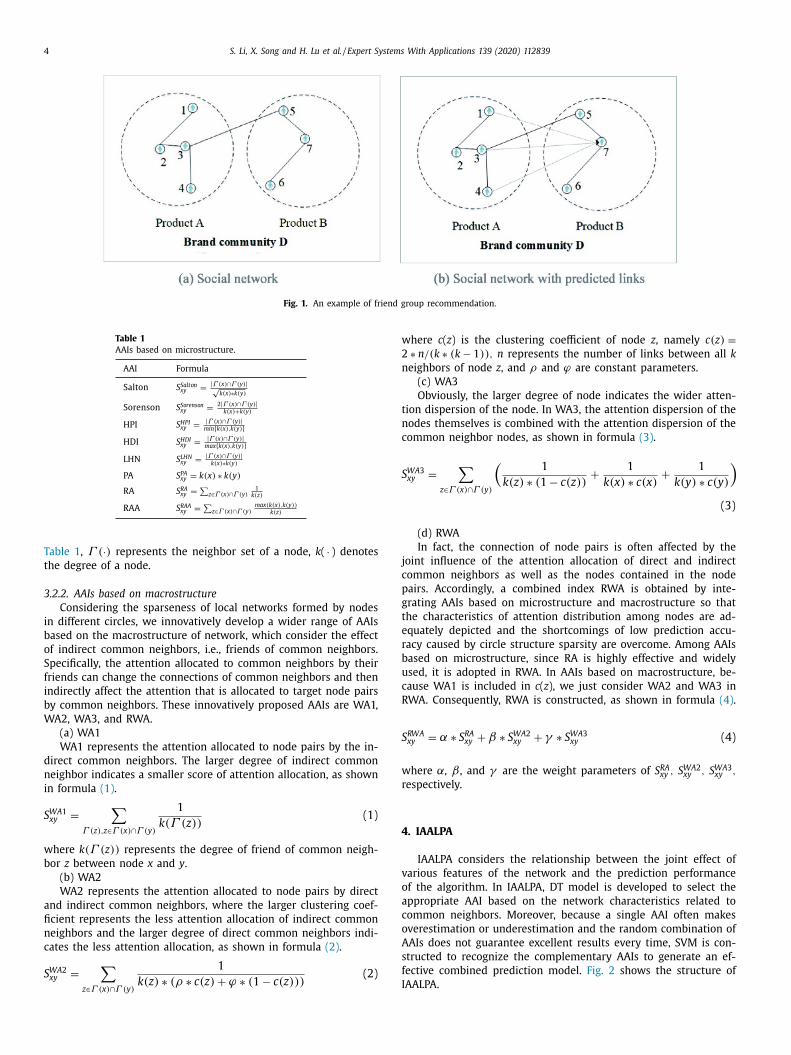
Fig. 1 shows an example of friend group recommendation in
ifferent circles in brand community D, where the initial network
s shown in Fig. 1 (a), the network with predicted links is described
n Fig. 1 (b). In Fig. 1 (a), users that belong to product A circle are
, 2, 3, and 4, users that belong to product B circle are 5,6, and 7.
uppose that user 7 is the target customer, the purpose of friend
roup recommendation is to enable him to purchase product A.
hrough the link prediction method, it is found that user 7 may
stablish a friend relationship with users 1, 3, and 4 in product A
ircle. Then the online brand managers can recommend users 1, 3,
nd 4 to become friends with user 7, as shown in Fig. 1 (b). When
hey become friends, the target customer 7 is encouraged to buy
roduct A using the impact of the friend group of 1, 3, and 4.
.2. AAI for friend group recommendation
In the triadic closure structure, the fewer friends a common
eighbor of a node pair has, that is, the smaller its degree is,
he more attention the common neighbor assigns to the node
air ( Backstrom, Bakshy, Kleinberg, Lento, & Rosenn, 2011 ), accord-
ngly, the more likely there is a link between the node pair. Based
n this principle, AAIs are constructed from the point of view
f microstructure (node pairs and their common neighbors), and
acrostructure (node pairs, their common neighbors, and friends
f common neighbors), as a result, the problem of network spar-
ity is overcome and the attention allocation between node pairs
s comprehensively depicted.
.2.1. AAIs based on microstructure
Seven most commonly used indices, such as Salton, Sorenson,
PI, HDI, LHN, PA , RA , and resource allocation average (RAA) are
elected ( Lü & Zhou, 2011 ) and adopted as microstructure based
AIs, which consider the microstructure consisting of node pairs
nd their common neighbors. As shown in Table 1 , the larger num-
er of common neighbors or the less degree of common neigh-
or indicates the larger scores of attention allocation, vice versa. In
4 S. Li, X. Song and H. Lu et al. / Expert Systems With Applications 139 (2020) 112839
Fig. 1. An example of friend group recommendation.
Table 1
AAIs based on microstructure.
AAI Formula
Salton S Salton xy =
| Γ (x ) ∩ Γ (y ) | √
k (x ) ∗k (y )
Sorenson S Sorenson xy =
2 | Γ (x ) ∩ Γ (y ) | k (x )+ k (y )
HPI S HPI xy =
| Γ (x ) ∩ Γ (y ) | min { k (x ) ,k (y ) }
HDI S HDI xy =
| Γ (x ) ∩ Γ (y ) | max { k (x ) ,k (y ) }
LHN S LHN xy =
| Γ (x ) ∩ Γ (y ) | k (x ) ∗k (y )
PA S PA xy = k (x ) ∗ k (y )
RA S RA xy =
∑
z∈ Γ (x ) ∩ Γ (y ) 1
k (z)
RAA S RAA xy =
∑
z∈ Γ (x ) ∩ Γ (y ) max (k (x ) ,k (y ))
k (z)
w
2
n
t
n
c
S
j
c
p
g
t
e
r
b
u
c
R
S
w
r
4
v
o
a
c
o
A
s
f
I
Table 1 , Γ (·) represents the neighbor set of a node, k ( · ) denotes
the degree of a node.
3.2.2. AAIs based on macrostructure
Considering the sparseness of local networks formed by nodes
in different circles, we innovatively develop a wider range of AAIs
based on the macrostructure of network, which consider the effect
of indirect common neighbors, i.e., friends of common neighbors.
Specifically, the attention allocated to common neighbors by their
friends can change the connections of common neighbors and then
indirectly affect the attention that is allocated to target node pairs
by common neighbors. These innovatively proposed AAIs are WA1,
WA2, WA3, and RWA.
(a) WA1
WA1 represents the attention allocated to node pairs by the in-
direct common neighbors. The larger degree of indirect common
neighbor indicates a smaller score of attention allocation, as shown
in formula (1) .
S WA 1 xy =
∑
Γ (z) ,z∈ Γ (x ) ∩ Γ (y )
1
k (Γ (z)) (1)
where k (Γ (z)) represents the degree of friend of common neigh-
bor z between node x and y .
(b) WA2
WA2 represents the attention allocated to node pairs by direct
and indirect common neighbors, where the larger clustering coef-
ficient represents the less attention allocation of indirect common
neighbors and the larger degree of direct common neighbors indi-
cates the less attention allocation, as shown in formula (2) .
S WA 2 xy =
∑
z∈ Γ (x ) ∩ Γ (y )
1
k (z) ∗ (ρ ∗ c(z) + ϕ ∗ (1 − c(z))) (2)
here c ( z ) is the clustering coefficient of node z , namely c(z) = ∗ n/ (k ∗ (k − 1)) , n represents the number of links between all k
eighbors of node z , and ρ and ϕ are constant parameters.
(c) WA3
Obviously, the larger degree of node indicates the wider atten-
ion dispersion of the node. In WA3, the attention dispersion of the
odes themselves is combined with the attention dispersion of the
ommon neighbor nodes, as shown in formula (3) .
WA 3 xy =
∑
z∈ Γ (x ) ∩ Γ (y )
(1
k (z) ∗ (1 − c(z)) +
1
k (x ) ∗ c(x ) +
1
k (y ) ∗ c(y )
)(3)
(d) RWA
In fact, the connection of node pairs is often affected by the
oint influence of the attention allocation of direct and indirect
ommon neighbors as well as the nodes contained in the node
airs. Accordingly, a combined index RWA is obtained by inte-
rating AAIs based on microstructure and macrostructure so that
he characteristics of attention distribution among nodes are ad-
quately depicted and the shortcomings of low prediction accu-
acy caused by circle structure sparsity are overcome. Among AAIs
ased on microstructure, since RA is highly effective and widely
sed, it is adopted in RWA. In AAIs based on macrostructure, be-
ause WA1 is included in c ( z ), we just consider WA2 and WA3 in
WA. Consequently, RWA is constructed, as shown in formula (4) .
RWA xy = α ∗ S RA
xy + β ∗ S WA 2 xy + γ ∗ S WA 3
xy (4)
here α, β , and γ are the weight parameters of S RA xy , S WA 2
xy , S WA 3 xy ,
espectively.
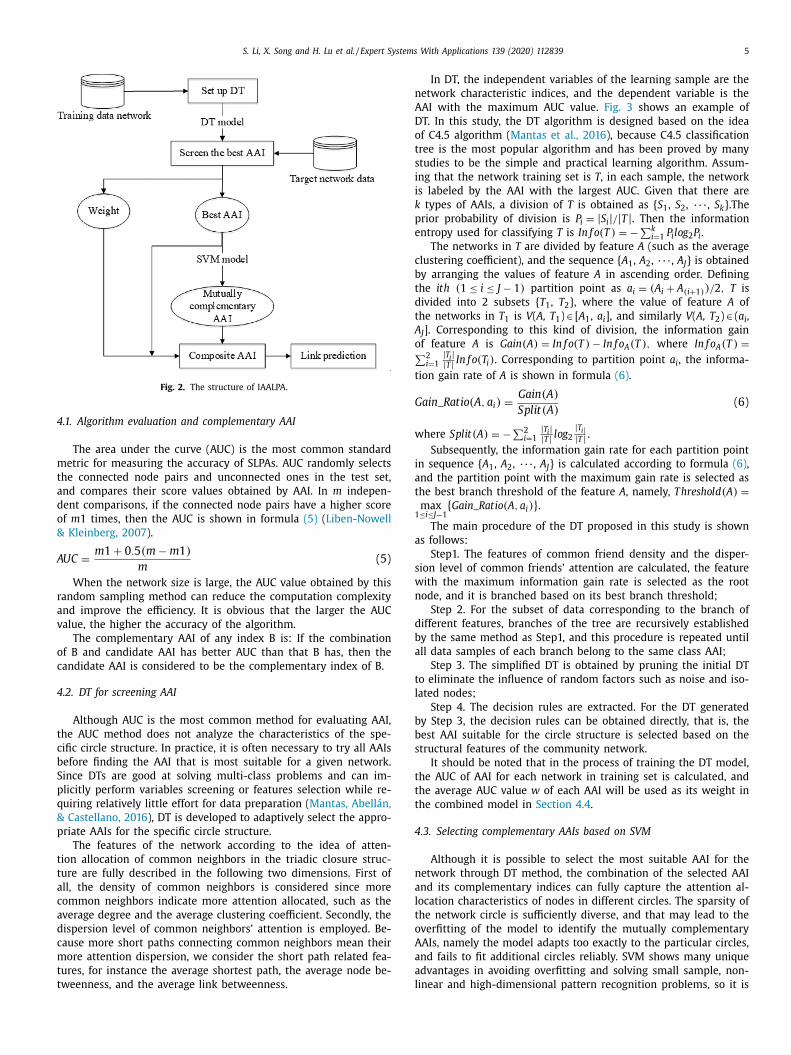
. IAALPA
IAALPA considers the relationship between the joint effect of
arious features of the network and the prediction performance
f the algorithm. In IAALPA, DT model is developed to select the
ppropriate AAI based on the network characteristics related to
ommon neighbors. Moreover, because a single AAI often makes
verestimation or underestimation and the random combination of
AIs does not guarantee excellent results every time, SVM is con-
tructed to recognize the complementary AAIs to generate an ef-
ective combined prediction model. Fig. 2 shows the structure of
AALPA.
S. Li, X. Song and H. Lu et al. / Expert Systems With Applications 139 (2020) 112839 5
Fig. 2. The structure of IAALPA.
4
m
t
a
d
o
&
A
r
a
v
o
c
4
t
c
b
S
p
q
&
p
t
t
a
c
a
d
c
m
t
t
n
A
D
o
t
s
i
i
k
p
e
c
b
t
d
t
A
o ∑
t
G
w
i
a
t
1
a
s
w
n
d
b
a
t
l
b
b
s
t
t
t
4
n
a
l
t
o
A
a
a
l
.1. Algorithm evaluation and complementary AAI
The area under the curve (AUC) is the most common standard
etric for measuring the accuracy of SLPAs. AUC randomly selects
he connected node pairs and unconnected ones in the test set,
nd compares their score values obtained by AAI. In m indepen-
ent comparisons, if the connected node pairs have a higher score
f m 1 times, then the AUC is shown in formula (5) ( Liben-Nowell
Kleinberg, 2007 ).
UC =
m 1 + 0 . 5(m − m 1)
m
(5)
When the network size is large, the AUC value obtained by this
andom sampling method can reduce the computation complexity
nd improve the efficiency. It is obvious that the larger the AUC
alue, the higher the accuracy of the algorithm.
The complementary AAI of any index B is: If the combination
f B and candidate AAI has better AUC than that B has, then the
andidate AAI is considered to be the complementary index of B.
.2. DT for screening AAI
Although AUC is the most common method for evaluating AAI,
he AUC method does not analyze the characteristics of the spe-
ific circle structure. In practice, it is often necessary to try all AAIs
efore finding the AAI that is most suitable for a given network.
ince DTs are good at solving multi-class problems and can im-
licitly perform variables screening or features selection while re-
uiring relatively little effort for data preparation ( Mantas, Abellán,
Castellano, 2016 ), DT is developed to adaptively select the appro-
riate AAIs for the specific circle structure.
The features of the network according to the idea of atten-
ion allocation of common neighbors in the triadic closure struc-
ure are fully described in the following two dimensions. First of
ll, the density of common neighbors is considered since more
ommon neighbors indicate more attention allocated, such as the
verage degree and the average clustering coefficient. Secondly, the
ispersion level of common neighbors’ attention is employed. Be-
ause more short paths connecting common neighbors mean their
ore attention dispersion, we consider the short path related fea-
ures, for instance the average shortest path, the average node be-
weenness, and the average link betweenness.
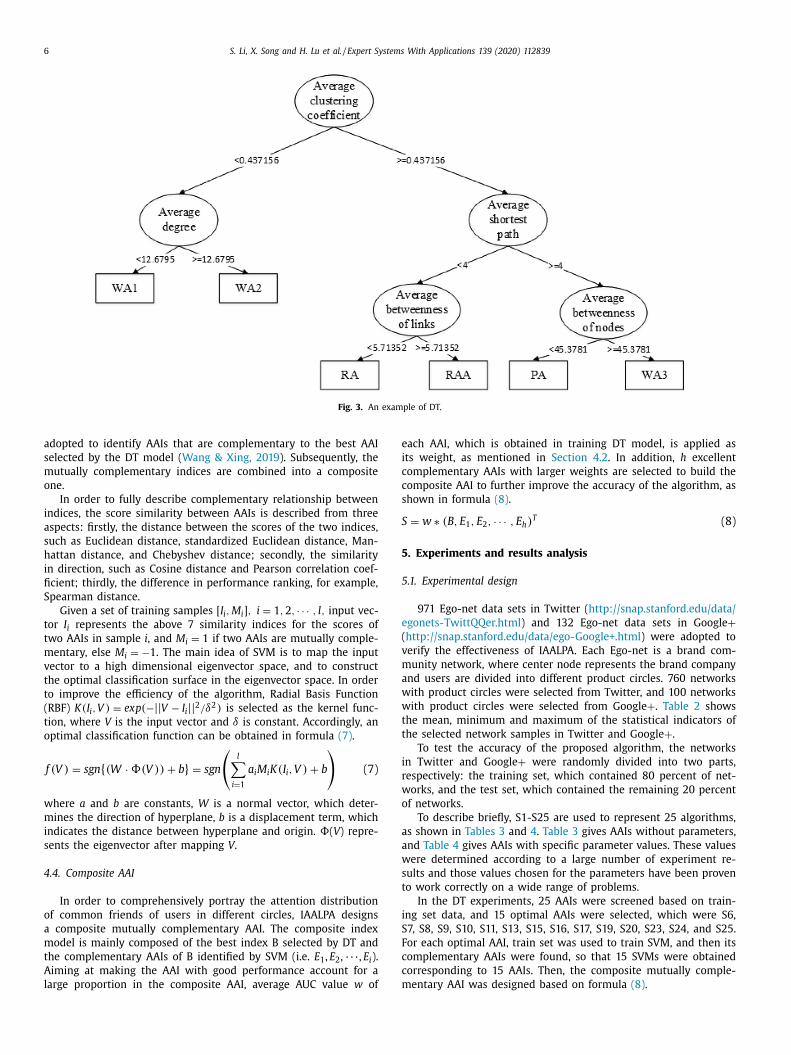
In DT, the independent variables of the learning sample are the
etwork characteristic indices, and the dependent variable is the
AI with the maximum AUC value. Fig. 3 shows an example of
T. In this study, the DT algorithm is designed based on the idea
f C4.5 algorithm ( Mantas et al., 2016 ), because C4.5 classification
ree is the most popular algorithm and has been proved by many
tudies to be the simple and practical learning algorithm. Assum-
ng that the network training set is T , in each sample, the network
s labeled by the AAI with the largest AUC. Given that there are
types of AAIs, a division of T is obtained as { S 1 , S 2 , ���, S k }.The
rior probability of division is P i = | S i | / | T | . Then the information
ntropy used for classifying T is In f o(T ) = − ∑ k i =1 P i log 2 P i .
The networks in T are divided by feature A (such as the average
lustering coefficient), and the sequence { A 1 , A 2 , ���, A J } is obtained
y arranging the values of feature A in ascending order. Defining
he ith (1 ≤ i ≤ J − 1) partition point as a i = (A i + A (i +1) ) / 2 , T is
ivided into 2 subsets { T 1 , T 2 }, where the value of feature A of
he networks in T 1 is V ( A, T 1 ) ∈ [ A 1 , a i ], and similarly V ( A, T 2 ) ∈ ( a i ,
J ]. Corresponding to this kind of division, the information gain
f feature A is Gain (A ) = In f o(T ) − In f o A (T ) , where In f o A (T ) = 2 i =1
| T i | | T | In f o(T i ) . Corresponding to partition point a i , the informa-
ion gain rate of A is shown in formula (6) .
ain _ Ratio(A, a i ) =
Gain (A )
Split(A ) (6)
here Split(A ) = − ∑ 2 i =1
| T i | | T | log 2 | T i | | T | .
Subsequently, the information gain rate for each partition point
n sequence { A 1 , A 2 , ���, A J } is calculated according to formula (6) ,
nd the partition point with the maximum gain rate is selected as
he best branch threshold of the feature A , namely, T hreshold(A ) =max ≤i ≤J−1
{ Gain _ Ratio(A, a i ) } . The main procedure of the DT proposed in this study is shown
s follows:
Step1. The features of common friend density and the disper-
ion level of common friends’ attention are calculated, the feature
ith the maximum information gain rate is selected as the root
ode, and it is branched based on its best branch threshold;
Step 2. For the subset of data corresponding to the branch of
ifferent f eatures, branches of the tree are recursively established
y the same method as Step1, and this procedure is repeated until
ll data samples of each branch belong to the same class AAI;
Step 3. The simplified DT is obtained by pruning the initial DT
o eliminate the influence of random factors such as noise and iso-
ated nodes;
Step 4. The decision rules are extracted. For the DT generated
y Step 3, the decision rules can be obtained directly, that is, the
est AAI suitable for the circle structure is selected based on the
tructural features of the community network.
It should be noted that in the process of training the DT model,
he AUC of AAI for each network in training set is calculated, and
he average AUC value w of each AAI will be used as its weight in
he combined model in Section 4.4 .
.3. Selecting complementary AAIs based on SVM
Although it is possible to select the most suitable AAI for the
etwork through DT method, the combination of the selected AAI
nd its complementary indices can fully capture the attention al-
ocation characteristics of nodes in different circles. The sparsity of
he network circle is sufficiently diverse, and that may lead to the
verfitting of the model to identify the mutually complementary
AIs, namely the model adapts too exactly to the particular circles,
nd fails to fit additional circles reliably. SVM shows many unique
dvantages in avoiding overfitting and solving small sample, non-
inear and high-dimensional pattern recognition problems, so it is
6 S. Li, X. Song and H. Lu et al. / Expert Systems With Applications 139 (2020) 112839
Fig. 3. An example of DT.
e
i
c
c
s
S
5
5
e
(
v
m
a
w
w
t
t
i
r
w
o
a
a
w
s
t
i
S
F
c
c
m
adopted to identify AAIs that are complementary to the best AAI
selected by the DT model ( Wang & Xing, 2019 ). Subsequently, the
mutually complementary indices are combined into a composite
one.
In order to fully describe complementary relationship between
indices, the score similarity between AAIs is described from three
aspects: firstly, the distance between the scores of the two indices,
such as Euclidean distance, standardized Euclidean distance, Man-
hattan distance, and Chebyshev distance; secondly, the similarity
in direction, such as Cosine distance and Pearson correlation coef-
ficient; thirdly, the difference in performance ranking, for example,
Spearman distance.
Given a set of training samples [ I i , M i ] , i = 1 , 2 , · · · , l, input vec-
tor I i represents the above 7 similarity indices for the scores of
two AAIs in sample i , and M i = 1 if two AAIs are mutually comple-
mentary, else M i = −1 . The main idea of SVM is to map the input
vector to a high dimensional eigenvector space, and to construct
the optimal classification surface in the eigenvector space. In order
to improve the efficiency of the algorithm, Radial Basis Function
(RBF) K(I i , V ) = exp(−|| V − I i || 2 /δ2 ) is selected as the kernel func-
tion, where V is the input vector and δ is constant. Accordingly, an
optimal classification function can be obtained in formula (7) .
f (V ) = sgn { (W · (V )) + b} = sgn
(
l ∑
i =1
a i M i K(I i , V ) + b
)
(7)
where a and b are constants, W is a normal vector, which deter-
mines the direction of hyperplane, b is a displacement term, which
indicates the distance between hyperplane and origin. ( V ) repre-
sents the eigenvector after mapping V .
4.4. Composite AAI
In order to comprehensively portray the attention distribution
of common friends of users in different circles, IAALPA designs
a composite mutually complementary AAI. The composite index
model is mainly composed of the best index B selected by DT and
the complementary AAIs of B identified by SVM (i.e. E 1 , E 2 , ���, E i ).
Aiming at making the AAI with good performance account for a
large proportion in the composite AAI, average AUC value w of
ach AAI, which is obtained in training DT model, is applied as
ts weight, as mentioned in Section 4.2 . In addition, h excellent
omplementary AAIs with larger weights are selected to build the
omposite AAI to further improve the accuracy of the algorithm, as
hown in formula (8) .
= w ∗ (B, E 1 , E 2 , · · · , E h ) T (8)
. Experiments and results analysis
.1. Experimental design
971 Ego-net data sets in Twitter ( http://snap.stanford.edu/data/
gonets-TwittQQer.html ) and 132 Ego-net data sets in Google + http://snap.stanford.edu/data/ego-Google+.html ) were adopted to
erify the effectiveness of IAALPA. Each Ego-net is a brand com-
unity network, where center node represents the brand company
nd users are divided into different product circles. 760 networks
ith product circles were selected from Twitter, and 100 networks
ith product circles were selected from Google + . Table 2 shows
he mean, minimum and maximum of the statistical indicators of
he selected network samples in Twitter and Google + .
To test the accuracy of the proposed algorithm, the networks
n Twitter and Google + were randomly divided into two parts,
espectively: the training set, which contained 80 percent of net-
orks, and the test set, which contained the remaining 20 percent
f networks.
To describe briefly, S1-S25 are used to represent 25 algorithms,
s shown in Tables 3 and 4 . Table 3 gives AAIs without parameters,
nd Table 4 gives AAIs with specific parameter values. These values
ere determined according to a large number of experiment re-
ults and those values chosen for the parameters have been proven
o work correctly on a wide range of problems.
In the DT experiments, 25 AAIs were screened based on train-
ng set data, and 15 optimal AAIs were selected, which were S6,
7, S8, S9, S10, S11, S13, S15, S16, S17, S19, S20, S23, S24, and S25.
or each optimal AAI, train set was used to train SVM, and then its
omplementary AAIs were found, so that 15 SVMs were obtained
orresponding to 15 AAIs. Then, the composite mutually comple-
entary AAI was designed based on formula (8) .
S. Li, X. Song and H. Lu et al. / Expert Systems With Applications 139 (2020) 112839 7
Table 2
Statistical information of network samples in Twitter and Google+.
Statistical indicators Twitter Google +
Minimum Mean Maximum Minimum Mean Maximum
Number of nodes 4 40.35 230 4 222.11 962
Number of edges 4 398.06 5137 8 1.23 56330
Average degree 1.66 13.55 64.50 2 37.89 143.11
Average shortest path 0.44 1.64 3.65 0.34 1.81 3.20
Average node betweenness 1 33.38 330.04 1 205.73 1.15
Average link betweenness 0.44 1.64 3.65 0.34 1.81 3.20
Average clustering coefficient 0.12 0.66 1 0.24 0.66 0.87
Table 3
AAIs without parameters.
AAI abbreviation S1 S2 S3 S4 S5 S6 S7 S8 S12 S13
AAI name Salton Sorenson HPI HDI LHN PA RA WA1 RAA WA3
Table 4
AAIs with parameters.
Algorithm AAI Parameter Algorithm AAI Parameter
S9 WA2 ρ = 1 , φ = 4 S19 RWA ρ = 1 , φ = 1 , α = 4 , β = 1 , γ = 1
S10 WA2 ρ = 1 , φ = 1 S20 RWA ρ = 1 , φ = 1 , α = 1 , β = 4 , γ = 1
S11 WA2 ρ = 4 , φ = 1 S21 RWA ρ = 1 , φ = 1 , α = 1 , β = 1 , γ = 4
S14 RWA ρ = 1 , φ = 4 , α = 1 , β = 1 , γ = 1 S22 RWA ρ = 4 , φ = 1 , α = 1 , β = 1 , γ = 1
S15 RWA ρ = 1 , φ = 4 , α = 4 , β = 1 , γ = 1 S23 RWA ρ = 4 , φ = 1 , α = 4 , β = 1 , γ = 1
S16 RWA ρ = 1 , φ = 4 , α = 1 , β = 4 , γ = 1 S24 RWA ρ = 4 , φ = 1 , α = 1 , β = 4 , γ = 1
S17 RWA ρ = 1 , φ = 4 , α = 1 , β = 1 , γ = 4 S25 RWA ρ = 4 , φ = 1 , α = 1 , β = 1 , γ = 4
S18 RWA ρ = 1 , φ = 1 , α = 1 , β = 1 , γ = 1
Table 5
The performance of all algorithms in the Twitter experiments.
Algorithm Average AUC Algorithm Average AUC Algorithm Average AUC
S1 0.78543 S10 0.819112 S19 0.81563
S2 0.78078 S11 0.815698 S20 0.815624
S3 0.737871 S12 0.822598 S21 0.800107
S4 0.767094 S13 0.793013 S22 0.80673
S5 0.622253 S14 0.806359 S23 0.814921
S6 0.775256 S15 0.814763 S24 0.811521
S7 0.819129 S16 0.810858 S25 0.798743
S8 0.799544 S17 0.798534 IAALPAa 0.822624
S9 0.820377 S18 0.809194 IAALPAb 0.8158
Single DT 0.811517 SVM 0.656711
Table 6
The performance of all algorithms in the Google + experiments.
Algorithm Average AUC Algorithm Average AUC Algorithm Average AUC
S1 0.66928 S10 0.84928 S19 0.841492
S2 0.644073 S11 0.845608 S20 0.841461
S3 0.727259 S12 0.882082 S21 0.813375
S4 0.622012 S13 0.803694 S22 0.825926
S5 0.387874 S14 0.824811 S23 0.840444
S6 0.873019 S15 0.840224 S24 0.835089
S7 0.849222 S16 0.832744 S25 0.811044
S8 0.884159 S17 0.810624 IAALPAa 0.892791
S9 0.85096 S18 0.830051 IAALPAb 0.87925
Single DT 0.857105 SVM 0.688149
c
v
r
c
u
s
d
I
b
w
s
i
a
c
t
Since quite a few composite link prediction algorithms were
onstructed based on SVM, another composite algorithm was de-
eloped with SVM to evaluate whether IAALPA outperformed the
ecently developed other composite algorithms. In the SVM based
omposite algorithm, the links between node pairs were predicted
sing 8 AAIs in Table 1 . All algorithms were applied in MATLAB
oftware with default settings.
The average AUCs for Twitter and Google + dataset in 100 ran-
om experiments are shown in Tables 5 and 6 , respectively, where
AALPAa represents the combination of the optimal AAI selected
y the DT model and two complementary AAIs with the largest
eights. IAALPAb represents the combination of the optimal AAI
elected by the DT model and its all complementary AAIs.
Figs. 4 and 5 show performance comparison of various AAIs
n the Twitter and Google + experiments, respectively. Figs. 6
nd 7 show the performance comparison of single DT and non-
ombination AAIs in the Twitter and Google + experiments, respec-
ively.
8 S. Li, X. Song and H. Lu et al. / Expert Systems With Applications 139 (2020) 112839
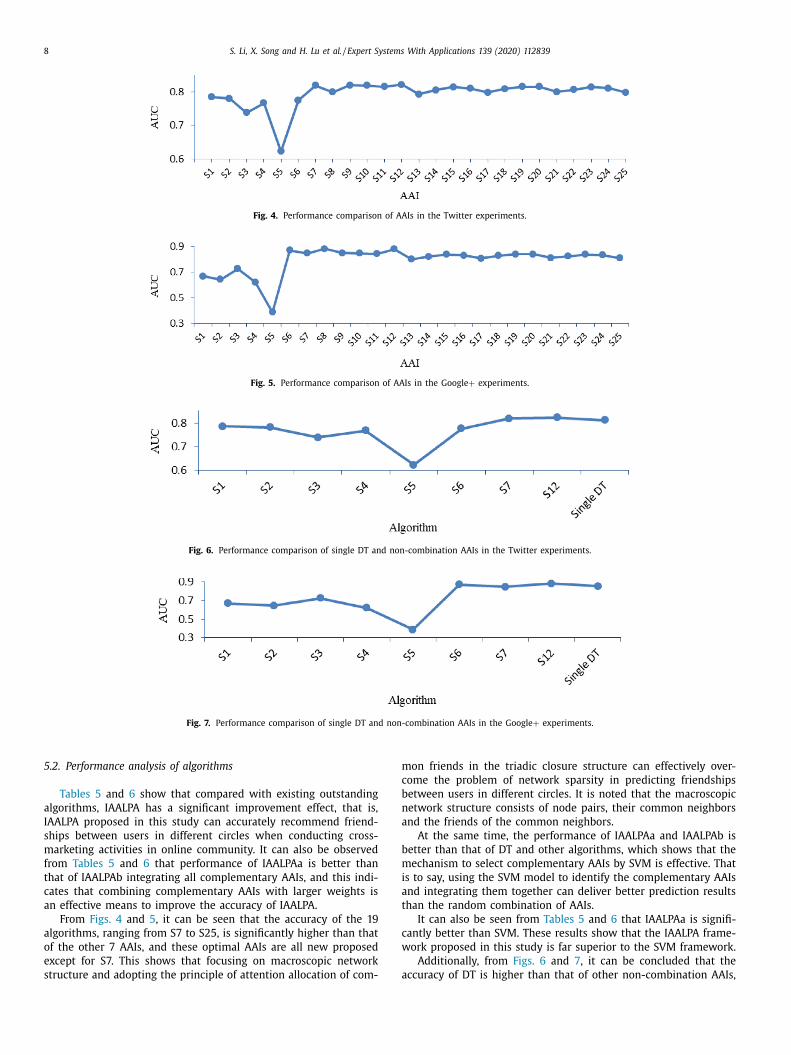
Fig. 4. Performance comparison of AAIs in the Twitter experiments.
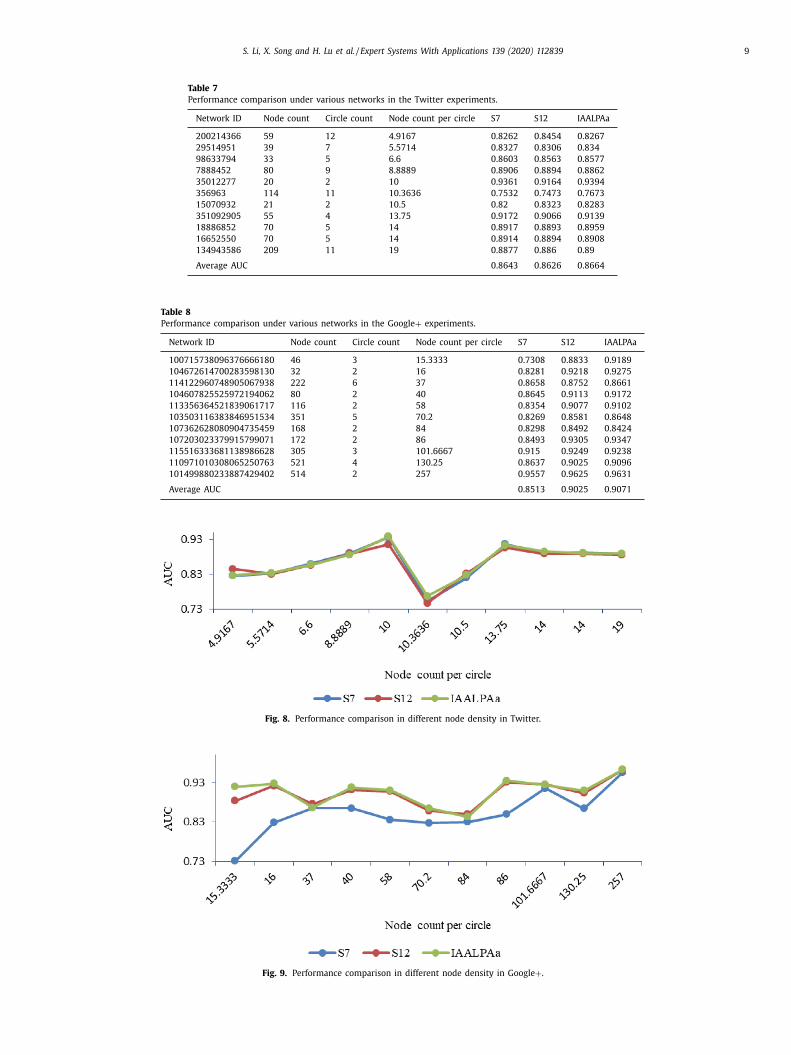
Fig. 5. Performance comparison of AAIs in the Google + experiments.
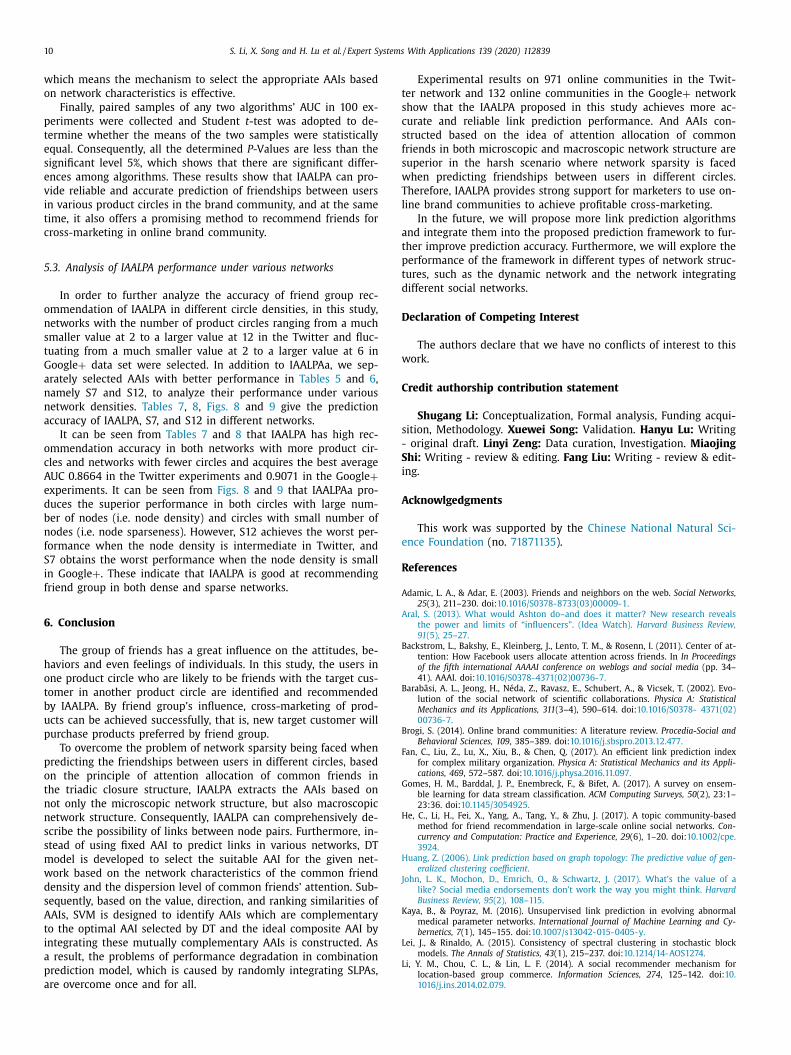
Fig. 6. Performance comparison of single DT and non-combination AAIs in the Twitter experiments.
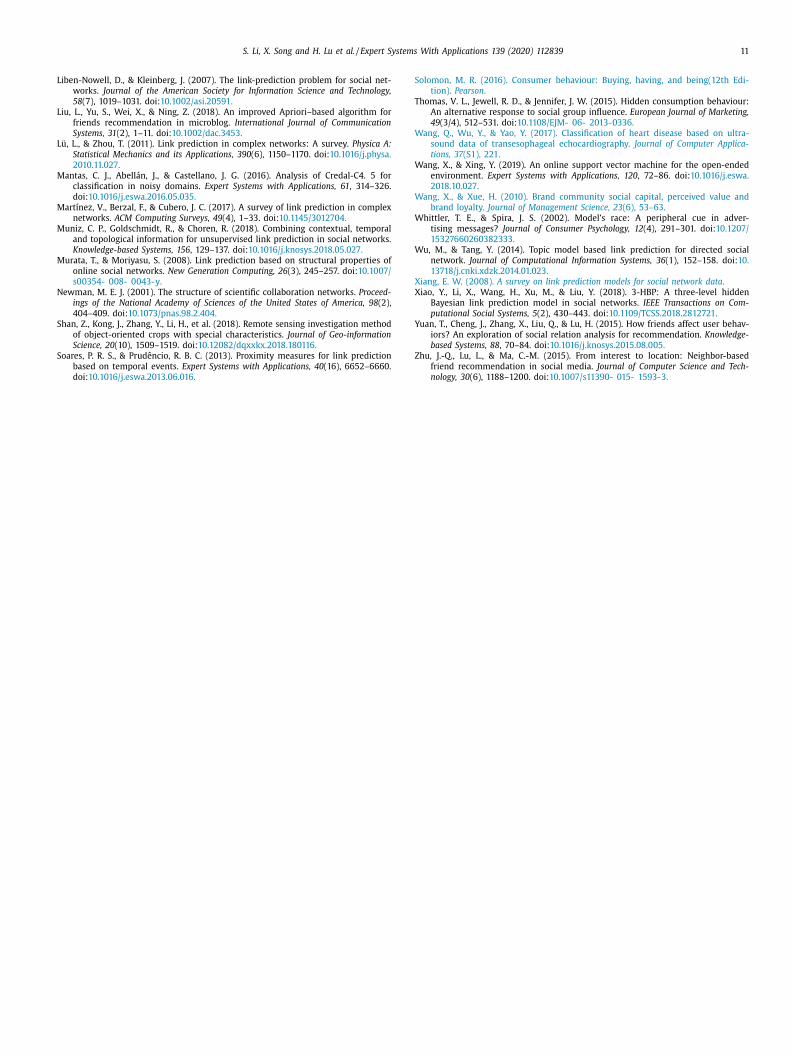
Fig. 7. Performance comparison of single DT and non-combination AAIs in the Google + experiments.
m
c
b
n
a
b
m
i
a
t
c
w
a
5.2. Performance analysis of algorithms
Tables 5 and 6 show that compared with existing outstanding
algorithms, IAALPA has a significant improvement effect, that is,
IAALPA proposed in this study can accurately recommend friend-
ships between users in different circles when conducting cross-
marketing activities in online community. It can also be observed
from Tables 5 and 6 that performance of IAALPAa is better than
that of IAALPAb integrating all complementary AAIs, and this indi-
cates that combining complementary AAIs with larger weights is
an effective means to improve the accuracy of IAALPA.
From Figs. 4 and 5 , it can be seen that the accuracy of the 19
algorithms, ranging from S7 to S25, is significantly higher than that
of the other 7 AAIs, and these optimal AAIs are all new proposed
except for S7. This shows that focusing on macroscopic network
structure and adopting the principle of attention allocation of com-
on friends in the triadic closure structure can effectively over-
ome the problem of network sparsity in predicting friendships
etween users in different circles. It is noted that the macroscopic
etwork structure consists of node pairs, their common neighbors
nd the friends of the common neighbors.
At the same time, the performance of IAALPAa and IAALPAb is
etter than that of DT and other algorithms, which shows that the
echanism to select complementary AAIs by SVM is effective. That
s to say, using the SVM model to identify the complementary AAIs
nd integrating them together can deliver better prediction results
han the random combination of AAIs.
It can also be seen from Tables 5 and 6 that IAALPAa is signifi-
antly better than SVM. These results show that the IAALPA frame-
ork proposed in this study is far superior to the SVM framework.
Additionally, from Figs. 6 and 7 , it can be concluded that the
ccuracy of DT is higher than that of other non-combination AAIs,
S. Li, X. Song and H. Lu et al. / Expert Systems With Applications 139 (2020) 112839 9
Table 7
Performance comparison under various networks in the Twitter experiments.
Network ID Node count Circle count Node count per circle S7 S12 IAALPAa
200214366 59 12 4.9167 0.8262 0.8454 0.8267
29514951 39 7 5.5714 0.8327 0.8306 0.834
98633794 33 5 6.6 0.8603 0.8563 0.8577
7888452 80 9 8.8889 0.8906 0.8894 0.8862
35012277 20 2 10 0.9361 0.9164 0.9394
356963 114 11 10.3636 0.7532 0.7473 0.7673
15070932 21 2 10.5 0.82 0.8323 0.8283
351092905 55 4 13.75 0.9172 0.9066 0.9139
18886852 70 5 14 0.8917 0.8893 0.8959
16652550 70 5 14 0.8914 0.8894 0.8908
134943586 209 11 19 0.8877 0.886 0.89
Average AUC 0.8643 0.8626 0.8664
Table 8
Performance comparison under various networks in the Google + experiments.
Network ID Node count Circle count Node count per circle S7 S12 IAALPAa
100715738096376666180 46 3 15.3333 0.7308 0.8833 0.9189
104672614700283598130 32 2 16 0.8281 0.9218 0.9275
114122960748905067938 222 6 37 0.8658 0.8752 0.8661
104607825525972194062 80 2 40 0.8645 0.9113 0.9172
113356364521839061717 116 2 58 0.8354 0.9077 0.9102
103503116383846951534 351 5 70.2 0.8269 0.8581 0.8648
107362628080904735459 168 2 84 0.8298 0.8492 0.8424
107203023379915799071 172 2 86 0.8493 0.9305 0.9347
115516333681138986628 305 3 101.6667 0.915 0.9249 0.9238
110971010308065250763 521 4 130.25 0.8637 0.9025 0.9096
101499880233887429402 514 2 257 0.9557 0.9625 0.9631
Average AUC 0.8513 0.9025 0.9071
Fig. 8. Performance comparison in different node density in Twitter.
Fig. 9. Performance comparison in different node density in Google + .
10 S. Li, X. Song and H. Lu et al. / Expert Systems With Applications 139 (2020) 112839
t
s
c
s
f
s
w
T
l
a
t
p
t
d
D
w
C
s
-
S
i
A
e
R
A
A
B
B
F
H
H
J
K
which means the mechanism to select the appropriate AAIs based
on network characteristics is effective.
Finally, paired samples of any two algorithms’ AUC in 100 ex-
periments were collected and Student t -test was adopted to de-
termine whether the means of the two samples were statistically
equal. Consequently, all the determined P -Values are less than the
significant level 5%, which shows that there are significant differ-
ences among algorithms. These results show that IAALPA can pro-
vide reliable and accurate prediction of friendships between users
in various product circles in the brand community, and at the same
time, it also offers a promising method to recommend friends for
cross-marketing in online brand community.
5.3. Analysis of IAALPA performance under various networks
In order to further analyze the accuracy of friend group rec-
ommendation of IAALPA in different circle densities, in this study,
networks with the number of product circles ranging from a much
smaller value at 2 to a larger value at 12 in the Twitter and fluc-
tuating from a much smaller value at 2 to a larger value at 6 in
Google + data set were selected. In addition to IAALPAa, we sep-
arately selected AAIs with better performance in Tables 5 and 6 ,
namely S7 and S12, to analyze their performance under various
network densities. Tables 7 , 8 , Figs. 8 and 9 give the prediction
accuracy of IAALPA, S7, and S12 in different networks.
It can be seen from Tables 7 and 8 that IAALPA has high rec-
ommendation accuracy in both networks with more product cir-
cles and networks with fewer circles and acquires the best average
AUC 0.8664 in the Twitter experiments and 0.9071 in the Google +experiments. It can be seen from Figs. 8 and 9 that IAALPAa pro-
duces the superior performance in both circles with large num-
ber of nodes (i.e. node density) and circles with small number of
nodes (i.e. node sparseness). However, S12 achieves the worst per-
formance when the node density is intermediate in Twitter, and
S7 obtains the worst performance when the node density is small
in Google + . These indicate that IAALPA is good at recommending
friend group in both dense and sparse networks.
6. Conclusion
The group of friends has a great influence on the attitudes, be-
haviors and even feelings of individuals. In this study, the users in
one product circle who are likely to be friends with the target cus-
tomer in another product circle are identified and recommended
by IAALPA. By friend group’s influence, cross-marketing of prod-
ucts can be achieved successfully, that is, new target customer will
purchase products preferred by friend group.
To overcome the problem of network sparsity being faced when
predicting the friendships between users in different circles, based
on the principle of attention allocation of common friends in
the triadic closure structure, IAALPA extracts the AAIs based on
not only the microscopic network structure, but also macroscopic
network structure. Consequently, IAALPA can comprehensively de-
scribe the possibility of links between node pairs. Furthermore, in-
stead of using fixed AAI to predict links in various networks, DT
model is developed to select the suitable AAI for the given net-
work based on the network characteristics of the common friend
density and the dispersion level of common friends’ attention. Sub-
sequently, based on the value, direction, and ranking similarities of
AAIs, SVM is designed to identify AAIs which are complementary
to the optimal AAI selected by DT and the ideal composite AAI by
integrating these mutually complementary AAIs is constructed. As
a result, the problems of performance degradation in combination
prediction model, which is caused by randomly integrating SLPAs,
are overcome once and for all.
Experimental results on 971 online communities in the Twit-
er network and 132 online communities in the Google + network
how that the IAALPA proposed in this study achieves more ac-
urate and reliable link prediction performance. And AAIs con-
tructed based on the idea of attention allocation of common
riends in both microscopic and macroscopic network structure are
uperior in the harsh scenario where network sparsity is faced
hen predicting friendships between users in different circles.
herefore, IAALPA provides strong support for marketers to use on-
ine brand communities to achieve profitable cross-marketing.
In the future, we will propose more link prediction algorithms
nd integrate them into the proposed prediction framework to fur-
her improve prediction accuracy. Furthermore, we will explore the
erformance of the framework in different types of network struc-
ures, such as the dynamic network and the network integrating
ifferent social networks.
eclaration of Competing Interest
The authors declare that we have no conflicts of interest to this
ork.
redit authorship contribution statement
Shugang Li: Conceptualization, Formal analysis, Funding acqui-
ition, Methodology. Xuewei Song: Validation. Hanyu Lu: Writing
original draft. Linyi Zeng: Data curation, Investigation. Miaojing
hi: Writing - review & editing. Fang Liu: Writing - review & edit-
ng.
cknowlgedgments
This work was supported by the Chinese National Natural Sci-
nce Foundation (no. 71871135 ).
eferences
damic, L. A., & Adar, E. (2003). Friends and neighbors on the web. Social Networks,25 (3), 211–230. doi: 10.1016/S0378-8733(03)0 0 0 09-1 .
ral, S. (2013). What would Ashton do–and does it matter? New research reveals
the power and limits of “influencers”. (Idea Watch). Harvard Business Review,91 (5), 25–27 .
ackstrom, L., Bakshy, E., Kleinberg, J., Lento, T. M., & Rosenn, I. (2011). Center of at-tention: How Facebook users allocate attention across friends. In In Proceedings
of the fifth international AAAAI conference on weblogs and social media (pp. 34–41). AAAI. doi: 10.1016/S0378-4371(02)00736-7 .
arabâsi, A. L., Jeong, H., Néda, Z., Ravasz, E., Schubert, A., & Vicsek, T. (2002). Evo-
lution of the social network of scientific collaborations. Physica A: StatisticalMechanics and its Applications, 311 (3–4), 590–614. doi: 10.1016/S0378- 4371(02)
00736-7 . Brogi, S. (2014). Online brand communities: A literature review. Procedia-Social and
Behavioral Sciences, 109 , 385–389. doi: 10.1016/j.sbspro.2013.12.477 . an, C., Liu, Z., Lu, X., Xiu, B., & Chen, Q. (2017). An efficient link prediction index
for complex military organization. Physica A: Statistical Mechanics and its Appli-
cations, 469 , 572–587. doi: 10.1016/j.physa.2016.11.097 . Gomes, H. M., Barddal, J. P., Enembreck, F., & Bifet, A. (2017). A survey on ensem-
ble learning for data stream classification. ACM Computing Surveys, 50 (2), 23:1–23:36. doi: 10.1145/3054925 .
e, C., Li, H., Fei, X., Yang, A., Tang, Y., & Zhu, J. (2017). A topic community-basedmethod for friend recommendation in large-scale online social networks. Con-
currency and Computation: Practice and Experience, 29 (6), 1–20. doi: 10.1002/cpe.
3924 . uang, Z. (2006). Link prediction based on graph topology: The predictive value of gen-
eralized clustering coefficient . ohn, L. K. , Mochon, D. , Emrich, O. , & Schwartz, J. (2017). What’s the value of a
like? Social media endorsements don’t work the way you might think. HarvardBusiness Review, 95 (2), 108–115 .
aya, B., & Poyraz, M. (2016). Unsupervised link prediction in evolving abnormalmedical parameter networks. International Journal of Machine Learning and Cy-
bernetics, 7 (1), 145–155. doi: 10.1007/s13042- 015- 0405- y .
Lei, J., & Rinaldo, A. (2015). Consistency of spectral clustering in stochastic blockmodels. The Annals of Statistics, 43 (1), 215–237. doi: 10.1214/14-AOS1274 .
Li, Y. M., Chou, C. L., & Lin, L. F. (2014). A social recommender mechanism forlocation-based group commerce. Information Sciences, 274 , 125–142. doi: 10.
1016/j.ins.2014.02.079 .
S. Li, X. Song and H. Lu et al. / Expert Systems With Applications 139 (2020) 112839 11
L
L
L
M
M
M
M
N
S
S
S
T
W
W
W
W
W
X
X
Y
Z
iben-Nowell, D., & Kleinberg, J. (2007). The link-prediction problem for social net-works. Journal of the American Society for Information Science and Technology,
58 (7), 1019–1031. doi: 10.1002/asi.20591 . iu, L., Yu, S., Wei, X., & Ning, Z. (2018). An improved Apriori–based algorithm for
friends recommendation in microblog. International Journal of CommunicationSystems, 31 (2), 1–11. doi: 10.1002/dac.3453 .
ü, L., & Zhou, T. (2011). Link prediction in complex networks: A survey. Physica A:Statistical Mechanics and its Applications, 390 (6), 1150–1170. doi: 10.1016/j.physa.
2010.11.027 .
antas, C. J., Abellán, J., & Castellano, J. G. (2016). Analysis of Credal-C4. 5 forclassification in noisy domains. Expert Systems with Applications, 61 , 314–326.
doi: 10.1016/j.eswa.2016.05.035 . artínez, V., Berzal, F., & Cubero, J. C. (2017). A survey of link prediction in complex
networks. ACM Computing Surveys, 49 (4), 1–33. doi: 10.1145/3012704 . uniz, C. P., Goldschmidt, R., & Choren, R. (2018). Combining contextual, temporal
and topological information for unsupervised link prediction in social networks.
Knowledge-based Systems, 156 , 129–137. doi: 10.1016/j.knosys.2018.05.027 . urata, T., & Moriyasu, S. (2008). Link prediction based on structural properties of
online social networks. New Generation Computing, 26 (3), 245–257. doi: 10.1007/s0 0354- 0 08- 0 043-y .
ewman, M. E. J. (2001). The structure of scientific collaboration networks. Proceed-ings of the National Academy of Sciences of the United States of America, 98 (2),
404–409. doi: 10.1073/pnas.98.2.404 .
han, Z., Kong, J., Zhang, Y., Li, H., et al. (2018). Remote sensing investigation methodof object-oriented crops with special characteristics. Journal of Geo-information
Science, 20 (10), 1509–1519. doi: 10.12082/dqxxkx.2018.180116 . oares, P. R. S., & Prudêncio, R. B. C. (2013). Proximity measures for link prediction
based on temporal events. Expert Systems with Applications, 40 (16), 6652–6660.doi: 10.1016/j.eswa.2013.06.016 .
olomon, M. R. (2016). Consumer behaviour: Buying, having, and being(12th Edi-tion). Pearson .
homas, V. L., Jewell, R. D., & Jennifer, J. W. (2015). Hidden consumption behaviour:An alternative response to social group influence. European Journal of Marketing,
49 (3/4), 512–531. doi: 10.1108/EJM- 06- 2013-0336 . ang, Q. , Wu, Y. , & Yao, Y. (2017). Classification of heart disease based on ultra-
sound data of transesophageal echocardiography. Journal of Computer Applica-tions, 37 (S1), 221 .
ang, X., & Xing, Y. (2019). An online support vector machine for the open-ended
environment. Expert Systems with Applications, 120 , 72–86. doi: 10.1016/j.eswa.2018.10.027 .
ang, X. , & Xue, H. (2010). Brand community social capital, perceived value andbrand loyalty. Journal of Management Science, 23 (6), 53–63 .
hittler, T. E., & Spira, J. S. (2002). Model’s race: A peripheral cue in adver-tising messages? Journal of Consumer Psychology, 12 (4), 291–301. doi: 10.1207/
15327660260382333 .
u, M., & Tang, Y. (2014). Topic model based link prediction for directed socialnetwork. Journal of Computational Information Systems, 36 (1), 152–158. doi: 10.
13718/j.cnki.xdzk.2014.01.023 . iang, E. W. (2008). A survey on link prediction models for social network data .
iao, Y., Li, X., Wang, H., Xu, M., & Liu, Y. (2018). 3-HBP: A three-level hiddenBayesian link prediction model in social networks. IEEE Transactions on Com-
putational Social Systems, 5 (2), 430–443. doi: 10.1109/TCSS.2018.2812721 .
uan, T., Cheng, J., Zhang, X., Liu, Q., & Lu, H. (2015). How friends affect user behav-iors? An exploration of social relation analysis for recommendation. Knowledge-
based Systems, 88 , 70–84. doi: 10.1016/j.knosys.2015.08.005 . hu, J.-Q., Lu, L., & Ma, C.-M. (2015). From interest to location: Neighbor-based
friend recommendation in social media. Journal of Computer Science and Tech-nology, 30 (6), 1188–1200. doi: 10.1007/s11390- 015- 1593-3 .