A History of Anti-sAtellite ProgrAms - Union of Concerned Scientists

ExEcutivE Summary
Freshwater Use by U.S. Power PlantsElEctricit y’S thirSt for a PrEciouS rESourcE
A Report of the Energy and Water in a Warming World Initiative
In 2005, the nation’s thermoelectric power plants—which boil wa-ter to create steam, which in turn drives turbines to produce electric-ity—withdrew as much water as farms did, and more than four times
as much as all U.S. residents. That means lighting rooms, powering com-puters and TVs, and running appliances requires more water, on average, than the total amount we use in our homes—washing dishes and clothes, showering, flushing toilets, and watering lawns and gardens.
This tremendous volume of water has to come from somewhere.
iSto
ckph
oto.
com
/ AV
TG

A cross the country, water demand from power plants is combining with pressure from growing populations and other needs and straining water
resources—especially during droughts and heat waves:
• The 2011 drought in Texas created tension among farm-ers, cities, and power plants across the state. At least one plant had to cut its output, and some plants had to pipe in water from new sources. The state power authority warned that several thousand megawatts of electrical ca-pacity might go offline if the drought persists into 2012.
• As drought hit the Southeast in 2007, water providers from Atlanta to Raleigh urged residents to cut their water use. Power plants felt the heat as well. In North Carolina, customers faced blackouts as water woes forced Duke Energy to cut output at its G.G. Allen and Riverbend coal plants on the Catawba River. Meanwhile the utility was scrambling to keep the water intake system for its McGuire nuclear plant underwa-ter. In Alabama, the Browns Ferry nuclear plant had to drastically cut its output (as it has in three of the last five years) to avoid exceeding the temperature limit on discharge water and killing fish in the Tennessee River.
• A 2006 heat wave forced nuclear plants in the Midwest to reduce their output when customers needed power most. At the Prairie Island plant in Minnesota, for example, the high temperature of the Mississippi River forced the plant to cut electricity generation by more than half.
• In the arid Southwest, power plants have been con-tributing to the depletion of aquifers, in some cases without even reporting their water use.
• On New York’s Hudson River, the cooling water intakes of the Indian Point nuclear plant kill millions
of fish annually, including endangered shortnose sturgeon. This hazard to aquatic life now threatens the plant as well. Because operators have not built a new cooling system to protect fish, state regulators have not yet approved the licenses the operators need to keep the plant’s two reactors running past 2013 and 2015.
• Proposed power plants have also taken hits over water needs. Local concerns about water use have scuttled planned facilities in Arizona, Idaho, Virginia, and else-where. Developers of proposed water-cooled concentrat-ing solar plants in California and Nevada have run into opposition, driving them toward dry cooling instead.
This report—the first on power plant water use and relat-ed water stress from the Energy and Water in a Warming World initiative—is the first systematic assessment of both the effects of power plant cooling on water resources across the United States and the quality of information available to help public- and private-sector decision mak-ers make water-smart energy choices.
Our analysis starts by profiling the water use char-acteristics of virtually every electricity generator in the United States. Then, applying new analytical approaches, we conservatively estimate the water use of those genera-tors in 2008, looking across the range of fuels, power plant
Flickr/Williams_Jt
take the average amount of water flow-ing over Niagara falls in a minute. Now triple it. that’s almost how much water power plants in the united States take in for cooling each minute, on average.
choices about the mix of plants used to generate electricity can ease the tension between energy and water, or exacerbate it.
Drought, heat, and high power demand make for an energy-water collision: amid the texas drought of 2011, the shores of martin creek lake—the primary source of cooling water for the luminant plant pictured here—receded to precariously low levels. to keep the plant operating, luminant had to import water from the Sabine river. if the drought persists into 2012, operators of the electricity grid have warned that power cuts on the scale of thousands of megawatts are possible.
Lon
gvie
w N
ews-
Jour
nal/
Kevi
n G
reen
2 Energy and Water in a Warming World Initiative

technologies, and cooling systems. We then use those results to assess the stress that power plant water use placed on water systems across the country. We also compare our results with those reported by power plant operators to the U.S. Energy Information Administration (EIA) for 2008.
We examine both the withdrawal and consumption of freshwater. Withdrawal is the total amount of water a power plant takes in from a source such as a river, lake, or aquifer, some of which is returned. Consumption is the amount lost to evaporation during the cooling process.
Withdrawal is important for several reasons. Water intake systems can trap fish and other aquatic wildlife. Water withdrawn for cooling but not consumed returns to the environment at a higher temperature, potentially harming fish and other wildlife. And when power plants tap groundwater for cooling, they can deplete aquifers critical for meeting many different needs. Consumption is important because it too reduces the amount of water available for other uses, including sustaining ecosystems.
While our analysis focuses on the effects of water use by power plants today, we also consider how conditions are likely to change in the future. In the short run, our choices for what kind of power plants we build can contribute to freshwater-supply stress (by consigning an imbalanced share of the available water to power plant use) and can affect water quality (by increasing water temperatures to levels that harm local ecosystems, for example). Over a longer time frame, those choices can fuel climate change, which in turn may also affect water quantity (through drought and other extreme weather events) and quality (by raising the temperature of lakes, streams, and rivers). Population growth and rising demand for water also promise to worsen water stress in many regions of the country already under stress from power plant use and other uses.
Electricity’s Water ProfileOur findings on the water profile of power plants in 2008 show that:
• Power plants are thirsty. Every day in 2008, on aver-age, water-cooled thermoelectric power plants in the United States withdrew 60 billion to 170 billion gal-lons (180,000 to 530,000 acre-feet) of freshwater from rivers, lakes, streams, and aquifers, and consumed 2.8 billion to 5.9 billion gallons (8,600 to 18,100 acre-feet) of that water. Our nation’s large coal fleet alone was responsible for 67 percent of those withdrawals, and 65 percent of that consumption.
• Where that water comes from is important. In the Southwest, where surface water is relatively scarce, power plants withdrew an average of 125 million to 190 million gallons (380 to 590 acre-feet) of ground-water daily, tapping many aquifers already suffering from overdraft. By contrast, power plants east of the Mississippi relied overwhelmingly on surface water.
• East is not west: water intensity varies regionally. Power plant owners can reduce their water intensity—the amount of water plants use per unit of electric-ity generated. Plants in the East generally withdrew more water for each unit of electricity produced than plants in the West, because most have not been fitted
FIgurE 1. Sources of Water used by Power Plantsin 2008, power plants withdrew 84 percent of their cooling water from rivers and lakes. the balance came mainly from the ocean in coastal regions. most water that power plants consumed simi-larly came from surface sources. however, in some regions—notably the arid Southwest—cooling water came from a broader array of sources, including groundwater and wastewater.
Surface water
Ocean
Groundwater
Mixed sources
Wastewater
Municipal
Unknown freshwater
Withdrawal
National
Surface water
Ocean
Groundwater
Mixed sources
Wastewater
Municipal
Unknown freshwater
Withdrawal
National
Surface water
Ocean
Groundwater
Mixed sources
Wastewater
Municipal
Unknown freshwater
Withdrawal
National
Surface water
Groundwater
Ocean
Wastewater
Municipal
Unknown freshwater
Mixed sources
Consumption
National
Surface water
Groundwater
Ocean
Wastewater
Municipal
Unknown freshwater
Mixed sources
Consumption
National
FIgurE 2. variations in Water-use intensity across the Power Plant fleetamong power plants using freshwater for cooling in 2008, nuclear power plants used more water per unit of electricity produced. the average nuclear plant withdrew nearly eight times as much freshwater as the average natural gas plant, and 11 percent more than the average coal plant. Nuclear plants also consumed three times as much fresh water as natural gas per unit of electricity produced, and about 4 percent more freshwater than coal plants.
Note: Boxes show the range of water-use values for various technologies from the National Renewable Energy Laboratory (NREL). Comparisons are based on median water-use values.
Nucle
ar
Coal
Natur
al g
as
Nucle
ar
Coal
Natur
al g
as
Nuclear
Coal
Natural gas
30
25
20
15
10
5
0
Withdrawal Intensity(gallons/kWh)
0.80.70.60.50.40.30.20.1
0
Consumption Intensity(gallons/kWh)
median
Nucle
ar
Coal
Natur
al g
as
Nucle
ar
Coal
Natur
al g
as
Nuclear
Coal
Natural gas
30
25
20
15
10
5
0
Withdrawal Intensity(gallons/kWh)
0.80.70.60.50.40.30.20.1
0
Consumption Intensity(gallons/kWh)
median
Water Withdrawals
Water Consumptionmedian
3Freshwater use by u.S. Power Plants: Electricity’s Thirst for a Precious resource

with recirculating, dry cooling, or hybrid cooling technologies. Freshwater withdrawal intensity was 41 to 55 times greater in Virginia, North Carolina, Michigan, and Missouri than in Utah, Nevada, and California. Freshwater consumption intensity was similar in those sets of states.
• Low-carbon electricity technologies are not necessarily low-water. On average in 2008, plants in the U.S. nuclear fleet withdrew nearly eight times more freshwater than natural gas plants per unit of electricity generated, and 11 percent more than coal plants. The water intensity of renewable energy technologies varies. Some concentrating solar power plants consume more water per unit of electricity than the average coal plant, while wind farms use essentially no water.
under Pressure: Stress on Water SystemsWater supply is said to be stressed in watersheds when demand for water—by power plants, agriculture, and municipalities, for example—exceeds a critical threshold of the available supply provided by local sources, typically surface and groundwater. Water quality can be similarly stressed when, for example, water users raise temperatures or discharge pollutants. Our findings on the impact of power plant cooling on water stress in 2008 show that:
FIgurE 3. how Power Plants use Watermost u.S. power plants create steam to drive the turbines that generate elec-tricity. after the steam passes through a turbine, it is cooled, condensed, and reused. Steam cooling accounts for virtually all the water that most power plants use, which they often draw from rivers, lakes, or aquifers. how much water a power plant uses depends on which cooling technology it uses. once-through cooling systems (a) withdraw large amounts of water, but return most of it—at a higher tem-perature—to the source. recirculating systems (B) take in much less water, but can consume twice as much of it or more, because they evaporate much of the water to condense the steam.
once-through cooling
recirculating cooling
B
A
evaporation
warm cooling water
cool cooling water
generator
turbine
boiler
boiler water
high- pressure
steam
low- pressure
steam
condenserheat source
cooling tower
ambient air
B
• Power plants across the country contribute to water-supply stress. Based on our analysis, in 2008, 400 out of 2,106 watersheds across the country were experiencing water-supply stress. Power plants, by tap-ping this overstretched resource for cooling purposes, contributed to water-supply stress in one-fifth of those. We focused on 25 watersheds in 17 states in which power plants were the primary driver of water-supply stress based on our analysis. Several states includ-ing North Carolina, South Carolina, Missouri, and Michigan had more than one of those watersheds, including the Catawba and Seneca Rivers.
• High-temperature water discharges are common. Peak summer temperatures for return flows from more than 350 power plants across the country exceeded 90°F. Some 14 states prohibit such discharges, which can harm fish and other wildlife.
Inset adapted from GAO 2009.
4 Energy and Water in a Warming World Initiative
• Discrepancies stemmed from a range of causes. Some power plant operators are exempt from reporting their water use based on plant size or technology. Many operators appeared to report peak rates of water use rather than the requested annual average rate, leading to overestimates. Other operators reported zero water use.
• The mix of power plants in the nation’s fleet mat-ters. The power plant portfolios of U.S. companies have widely varying water-use and carbon emissions profiles. Utilities with lower-water plants place less stress on local water sources. Utilities with carbon-intensive power plants contribute to long-term water stress by exacerbating climate change.
gaps and Errors in Information on Power Plant Water useCollisions and near-misses between energy and water needs point to the importance of accurate, up-to-date informa-tion on power plant water demand. Our analysis reveals, however, a number of gaps and apparent inaccuracies in federal data reported for 2008. As a result, analyses based on that information would have overlooked regions facing water stress. We found:
• Gaps add up. Power plants that did not report their water use to the EIA accounted for 28 to 30 percent of freshwa-ter withdrawals by the electricity sector, and at least 24 to 31 percent of freshwater consumption by the sector, ac-cording to our calculations. Gaps in the 2008 informa-tion included all water use by nuclear power plants.
• Discrepancies are widespread. Reported freshwater use by power plants across the country fell outside the bounds suggested by our analysis, including plants in 22 states for withdrawal, and 38 states for consump-tion. The discrepancies were especially large in the Lower Colorado River and Southeast-Gulf regions, where plant operators reported consumption five times greater—and withdrawals 30 percent less—than me-dian water-use values would suggest.
Habitat and hot water: rivers and lakes used for power plant cooling can also be prime habitat for prized sportfishing species, including cold-water species such as trout. yet in 2008 power plant operators reported discharging water to rivers at peak tempera-tures above 110°f. those temperatures can be lethal to wildlife, and are far in excess of limits set by many states.
Flic
kr/A
ndy
Shap
iro
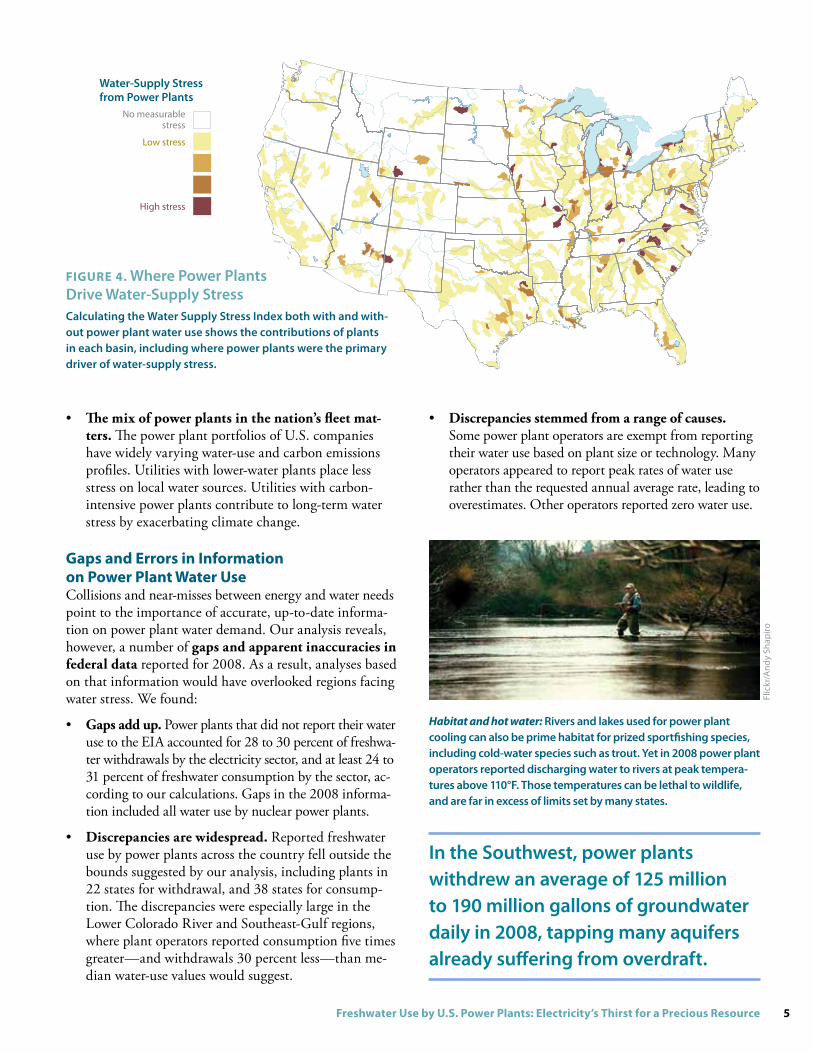
Water-Supply Stress from Power Plants
No measurable stress
Low stress
High stress
FIgurE 4. Where Power Plants Drive Water-Supply Stresscalculating the Water Supply Stress index both with and with-out power plant water use shows the contributions of plants in each basin, including where power plants were the primary driver of water-supply stress.
in the Southwest, power plants withdrew an average of 125 million to 190 million gallons of groundwater daily in 2008, tapping many aquifers already suffering from overdraft.
5Freshwater use by u.S. Power Plants: Electricity’s Thirst for a Precious resource

• Good analysis requires good information. Using the available data masks existing water stress. Several of the 25 watersheds identified did not show up when we analyzed EIA-compiled information.
Toward a Water-Smart Energy Future Averting energy-water collisions requires that power plant operators regularly report accurate information on their water use to the EIA and state agencies. The EIA has been working to improve such reporting, to better meet the
needs of public- and private-sector decision makers. The agency may therefore remedy many of the problems we identified with the 2008 data shortly.
However, providing better information is only the first critical step. Decision makers must then put that information—coupled with sound analyses of water stress—to work in curbing electricity’s thirst, especially in water-stressed regions. Our analysis provides a strong ini-tial basis for making water-smart energy choices. Here are some ways to do so:
Power plant under reporting of water use: Drought and rising demand for water have stressed the catawba river, the source of cooling water for Duke Ener-gy’s marshall Steam Station and several other plants. these power plants underreported the amount of river water they used in 2008, according to our analysis. in its 2009 report on energy and water, the u.S. Gov-ernment accountability office explicitly recognized the impor-tance of providing better infor-mation on power plant water use, to improve planning and management.
Cata
wba
Riv
er K
eepe
rs
FIgurE 5. Power companies, freshwater, and carbonthe nation’s 15 largest electricity producers—which accounted for 50 percent of all u.S. power generated in 2008—varied widely in their water use and carbon emissions. Producers with a large proportion of nuclear plants that used freshwater for once-through cooling had high freshwater withdrawal intensities but low carbon intensi-ties. Producers using seawater to cool nuclear facilities had low freshwater and carbon intensities. Producers with a large proportion of wind or solar photovoltaic plants had low water and carbon intensities.
Note: Based on minimum, median, and maximum water-use values from NREL.
0.20
0
0.40
0.60
0.80
1.00
60,000 50,000 40,000 30,000 20,000 10,000
Withdrawal Intensity (gallons/MWh)
tons
of C
O2/
MW
h
tons
of C
O2 /
MW
h
0.20
0.40
0.60
0.80
1.00
0 100 200 300 400 500 600 700 800 900
Consumption Intensity (gallons/MWh)
Entergy
Ameren
NextEra
Exelon
Xcel
American Electric Power
NRG
Dominion
FirstEnergy Corp.
Southern
Progress
Calpine
Tennessee Valley AuthorityDuke
Entergy
Ameren
NextEra
Exelon
Xcel
American Electric Power
NRG
Dominion
FirstEnergy Corp.
Southern
Progress
Calpine
Tennessee Valley AuthorityDuke
PPL PPL
6 Energy and Water in a Warming World Initiative6
• Get it right the first time. Developing new resources for meeting electricity demand provides a critical oppor-tunity for reducing water risks for both power plant op-erators and other users. Utilities and other power plant developers would be well advised to prioritize low-water or no-water cooling options, particularly in regions of current and projected high water stress.
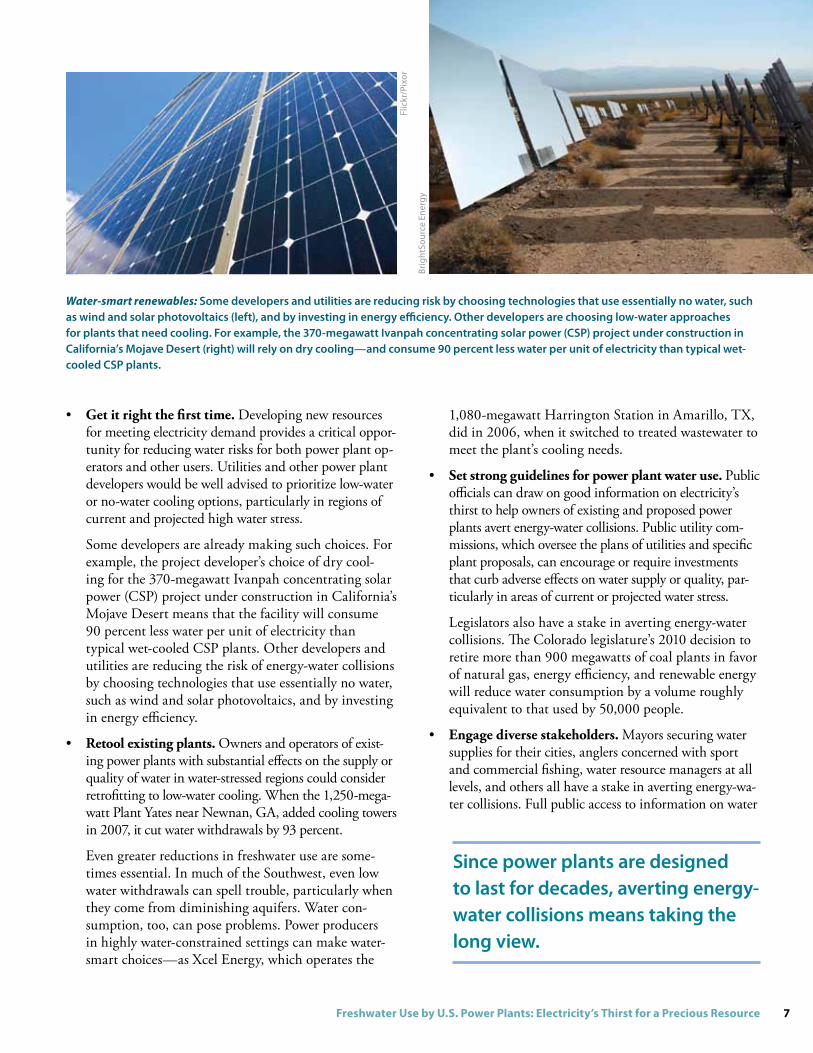
Some developers are already making such choices. For example, the project developer’s choice of dry cool-ing for the 370-megawatt Ivanpah concentrating solar power (CSP) project under construction in California’s Mojave Desert means that the facility will consume 90 percent less water per unit of electricity than typical wet-cooled CSP plants. Other developers and utilities are reducing the risk of energy-water collisions by choosing technologies that use essentially no water, such as wind and solar photovoltaics, and by investing in energy efficiency.
• Retool existing plants. Owners and operators of exist-ing power plants with substantial effects on the supply or quality of water in water-stressed regions could consider retrofitting to low-water cooling. When the 1,250-mega-watt Plant Yates near Newnan, GA, added cooling towers in 2007, it cut water withdrawals by 93 percent.
Even greater reductions in freshwater use are some-times essential. In much of the Southwest, even low water withdrawals can spell trouble, particularly when they come from diminishing aquifers. Water con-sumption, too, can pose problems. Power producers in highly water-constrained settings can make water-smart choices—as Xcel Energy, which operates the
1,080-megawatt Harrington Station in Amarillo, TX, did in 2006, when it switched to treated wastewater to meet the plant’s cooling needs.
• Set strong guidelines for power plant water use. Public officials can draw on good information on electricity’s thirst to help owners of existing and proposed power plants avert energy-water collisions. Public utility com-missions, which oversee the plans of utilities and specific plant proposals, can encourage or require investments that curb adverse effects on water supply or quality, par-ticularly in areas of current or projected water stress.
Legislators also have a stake in averting energy-water collisions. The Colorado legislature’s 2010 decision to retire more than 900 megawatts of coal plants in favor of natural gas, energy efficiency, and renewable energy will reduce water consumption by a volume roughly equivalent to that used by 50,000 people.
• Engage diverse stakeholders. Mayors securing water supplies for their cities, anglers concerned with sport and commercial fishing, water resource managers at all levels, and others all have a stake in averting energy-wa-ter collisions. Full public access to information on water
Water-smart renewables: Some developers and utilities are reducing risk by choosing technologies that use essentially no water, such as wind and solar photovoltaics (left), and by investing in energy efficiency. other developers are choosing low-water approaches for plants that need cooling. for example, the 370-megawatt ivanpah concentrating solar power (cSP) project under construction in california’s mojave Desert (right) will rely on dry cooling—and consume 90 percent less water per unit of electricity than typical wet-cooled cSP plants.
Brig
htSo
urce
Ene
rgy
Flic
kr/P
ixor
Since power plants are designed to last for decades, averting energy-water collisions means taking the long view.
7Freshwater use by u.S. Power Plants: Electricity’s Thirst for a Precious resource
use by existing and proposed power plants will enable these and other local stakeholders to become informed about the benefits of water-smart energy choices.
• Reduce power plant carbon emissions. Because hu-man-caused climate change is worsening water stress across much of the United States, water-smart energy choices should include investing in resources that are also low-carbon. The new cooling towers for the coal-burning Plant Yates reduce its impact on water stress but not its carbon emissions.
The coal-burning generators at Harrington Station in Amarillo, although relying on treated wastewater, still emit prodigious quantities of carbon. Of course, not all low-carbon options are water-smart. Some, such as wind power and energy efficiency, are inherently low-water. Others, such as the proposed carbon capture and storage for coal plants, are not, and could worsen energy-water collisions if used in regions with water stress.
Averting energy-water collisions means taking a long view. Power plants are designed to last for decades, and much of our existing infrastructure will continue operating for years. Our nation’s precious freshwater resources will face ever more stress from growing populations, a changing climate, and other trends over the next several decades.
The typically high cost of retrofitting power plants means that decisions on the water impact of today’s plants should consider the risks they pose to freshwater resources and energy reliability throughout their expected lifetime.
The next report from the Energy and Water in a Warming World initiative will take up this challenge by exploring how energy choices affect the resilience of our energy sector in the face of both periodic drought and long-term changes in water availability. Zooming in on key regions of the country will yield a more robust un-derstanding of how the energy technologies we choose to power tomorrow’s world would affect water resources.
Decisions made today about which power plants to build, which to retire, and which energy or cooling technol-ogies to deploy and develop matter greatly. Understanding how these choices affect water use and water stress will help ensure that the dependence of power plants on water does not compromise that resource, the plants themselves, or the energy we rely on them to provide.
Energy choices that phase out the power sector’s decades-old water dependence can help ensure reliable electricity while protecting our freshwater resources.Ec
olog
ypre
ss.c
om
Texa
s Pa
rks
and
Wild
life
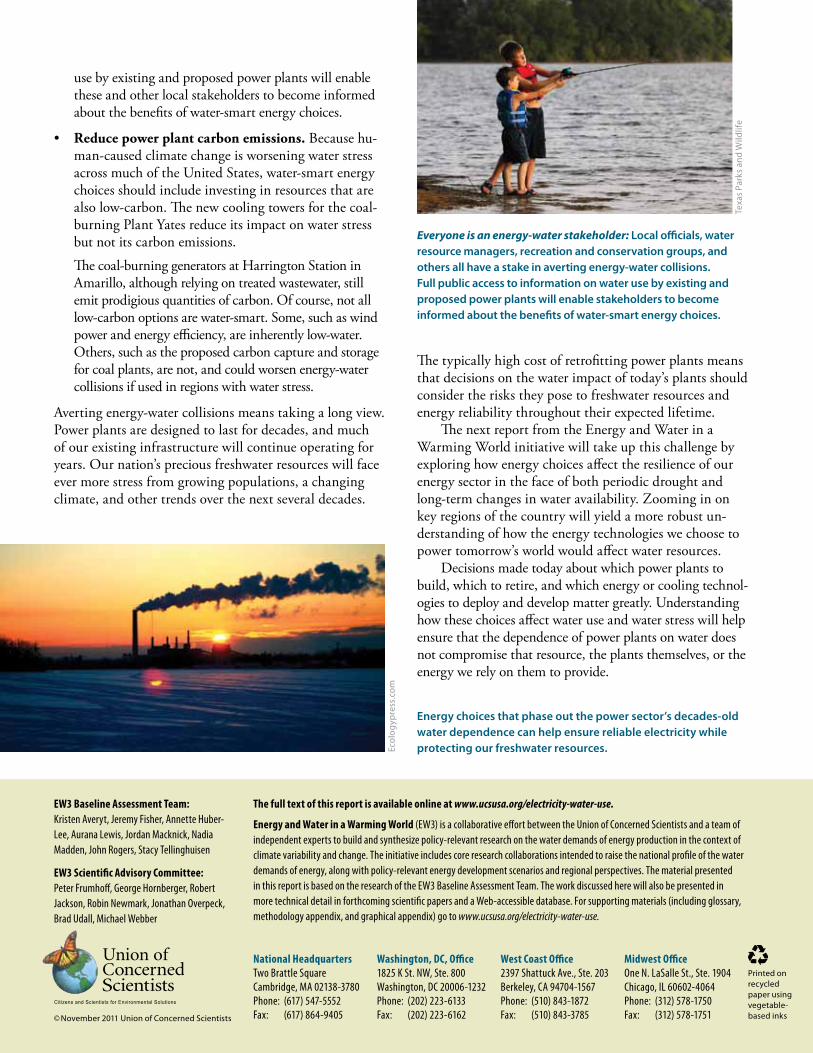
Everyone is an energy-water stakeholder: local officials, water resource managers, recreation and conservation groups, and others all have a stake in averting energy-water collisions. full public access to information on water use by existing and proposed power plants will enable stakeholders to become informed about the benefits of water-smart energy choices.
The full text of this report is available online at www.ucsusa.org/electricity-water-use.
Energy and Water in a Warming World (EW3) is a collaborative effort between the Union of Concerned Scientists and a team of independent experts to build and synthesize policy-relevant research on the water demands of energy production in the context of climate variability and change. The initiative includes core research collaborations intended to raise the national profile of the water demands of energy, along with policy-relevant energy development scenarios and regional perspectives. The material presented in this report is based on the research of the EW3 Baseline Assessment Team. The work discussed here will also be presented in more technical detail in forthcoming scientific papers and a Web-accessible database. For supporting materials (including glossary, methodology appendix, and graphical appendix) go to www.ucsusa.org/electricity-water-use.
EW3 Scientific Advisory Committee: Peter Frumhoff, George Hornberger, Robert Jackson, Robin Newmark, Jonathan Overpeck, Brad Udall, Michael Webber
EW3 Baseline Assessment Team: Kristen Averyt, Jeremy Fisher, Annette Huber-Lee, Aurana Lewis, Jordan Macknick, Nadia Madden, John Rogers, Stacy Tellinghuisen
© November 2011 Union of Concerned Scientists
National HeadquartersTwo Brattle SquareCambridge, MA 02138-3780Phone: (617) 547-5552Fax: (617) 864-9405
Washington, DC, Office1825 K St. NW, Ste. 800Washington, DC 20006-1232Phone: (202) 223-6133Fax: (202) 223-6162
West Coast Office2397 Shattuck Ave., Ste. 203 Berkeley, CA 94704-1567Phone: (510) 843-1872Fax: (510) 843-3785
Midwest Office One N. LaSalle St., Ste. 1904 Chicago, IL 60602-4064 Phone: (312) 578-1750 Fax: (312) 578-1751
Printed on recycled paper using vegetable-based inks