Commodity Specific Food Safety Guidelines for the Fresh Tomato ...
Fresh Tomato Trends in the N.
American Market
DR. ROBERTA COOK Dept. of Ag and Resource Economics
University of California Davis for
America Trades Produce Conference Tubac, AZ
March 13, 2014

Agenda • Overview of US fresh tomato market supply
and consumption • Retail market shares by key tomato type • Historical trends • Update on US fresh tomato imports • Canadian greenhouse tomato trends • Protected culture in Mexico changes market
dynamics

Important Considerations • Comparing trends DOES NOT necessarily imply
causality. • Concept of with and without analysis. • Too soon to draw conclusions about the impact
of the higher prices under the new suspension agreement (in effect since March 2013)
• Restricting supply can lead to higher prices (due to relatively inelastic demand) but these may be difficult to sustain without acreage controls due to “supply response” dynamics; barriers to entry play a role

0
1000
2000
3000
4000
5000
6000
7000
1990
19
91
1992
19
93
1994
19
95
1996
19
97
1998
19
99
2000
20
01
2002
20
03
2004
20
05
2006
20
07
2008
20
09
2010
20
11
2012
20
13P
U.S. Fresh Tomatoes: Production, Consumption, Imports, and Exports, 1990-2013p
million pounds
Consumption
Production
Imports Exports
Sources: USDA/ERS, Vegetables and Pulses Yearbook Data May 31, 2013 and unpublished update for 2013. (includes estimate of US GH production)

Pounds per capita
P=Preliminary Sources: USDA/ERS, Vegetables and Pulses Yearbook Data May 31, 2013 and unpublished update for 2013.
0
5
10
15
20
25
US Per Capita Utilization/Consumption of Fresh Tomatoes (1985-2013P)
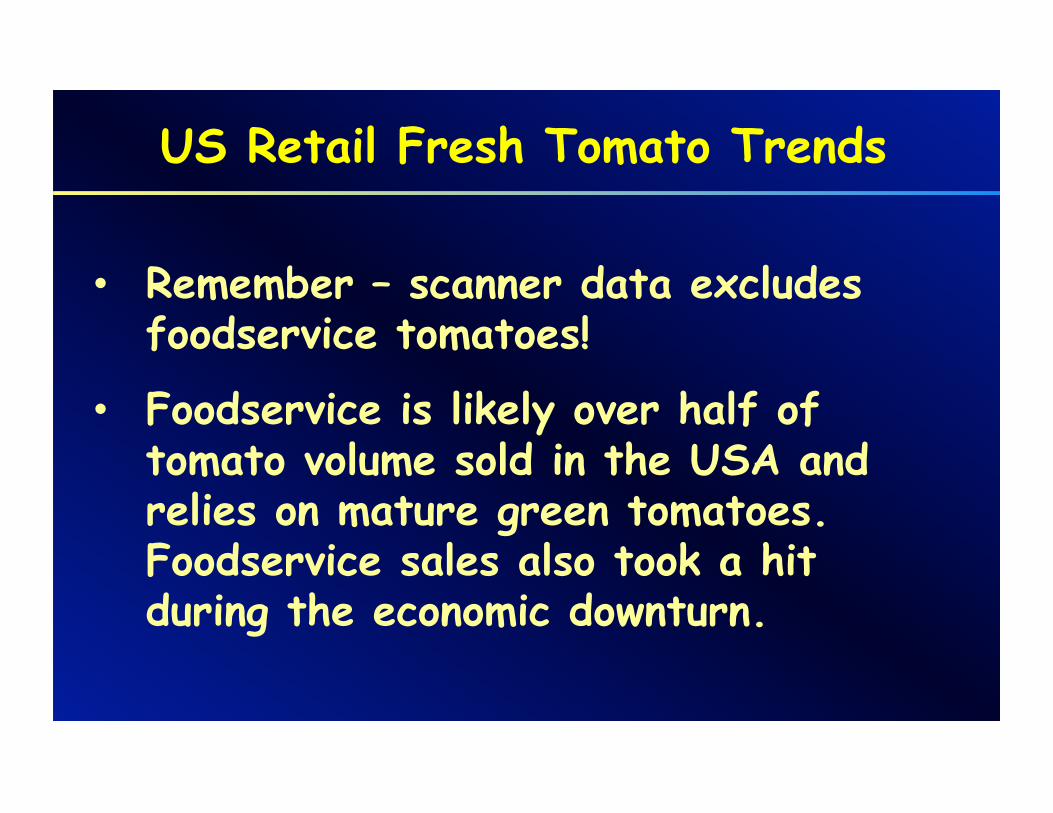
US Retail Fresh Tomato Trends
• Remember – scanner data excludes foodservice tomatoes!
• Foodservice is likely over half of tomato volume sold in the USA and relies on mature green tomatoes. Foodservice sales also took a hit during the economic downturn.
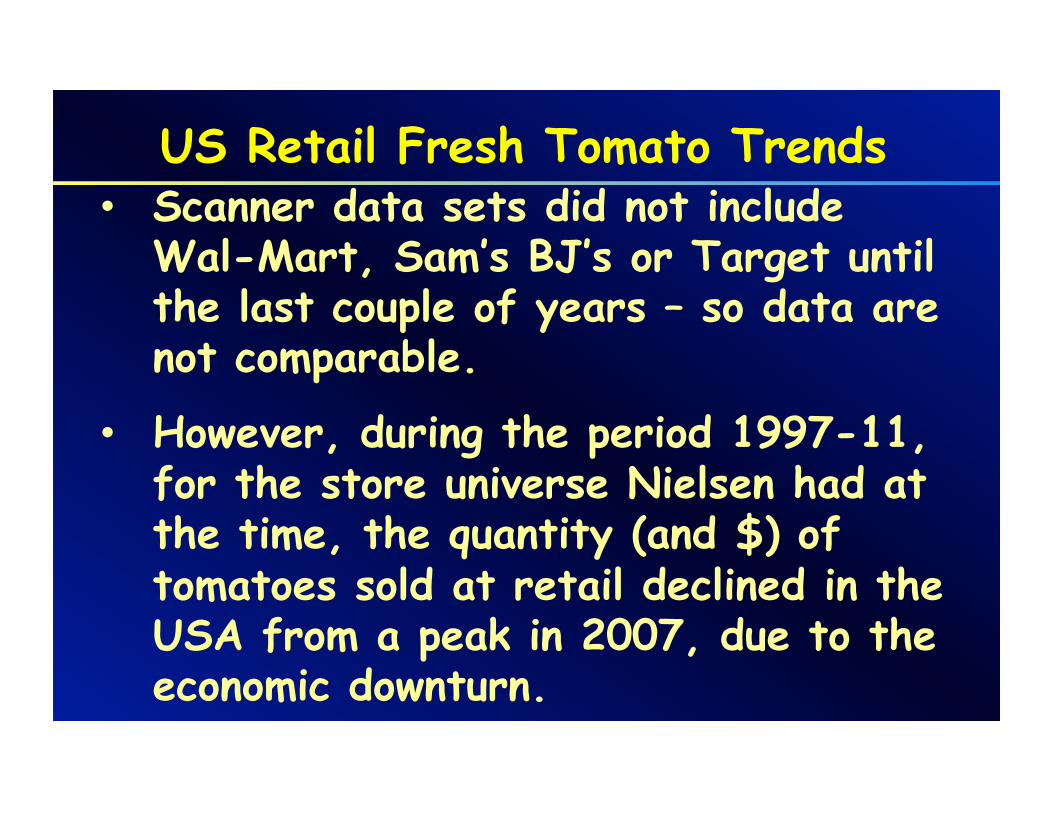
US Retail Fresh Tomato Trends • Scanner data sets did not include
Wal-Mart, Sam’s BJ’s or Target until the last couple of years – so data are not comparable.
• However, during the period 1997-11, for the store universe Nielsen had at the time, the quantity (and $) of tomatoes sold at retail declined in the USA from a peak in 2007, due to the economic downturn.

US Fresh Tomato Retail Market Shares (in Lbs) by Key Type, 2013
Source: FreshLook Marketing
Roma 27%
TOV 22% Grape
14%
Vine Ripe 12%
GH 9%
[CATEGORY NAME] [VALUE]
[CATEGORY NAME] [VALUE]
[CATEGORY NAME] [VALUE]

US Fresh Tomato Retail Market Shares (in $) by Key Type, 2013
Source: FreshLook Marketing
TOV 23%
Grape 22%
Roma 16%
Vine Ripe 11%
Mini, excl grape 10%
[CATEGORY NAME] [VALUE]
[CATEGORY NAME] [VALUE]
[CATEGORY NAME] [VALUE]
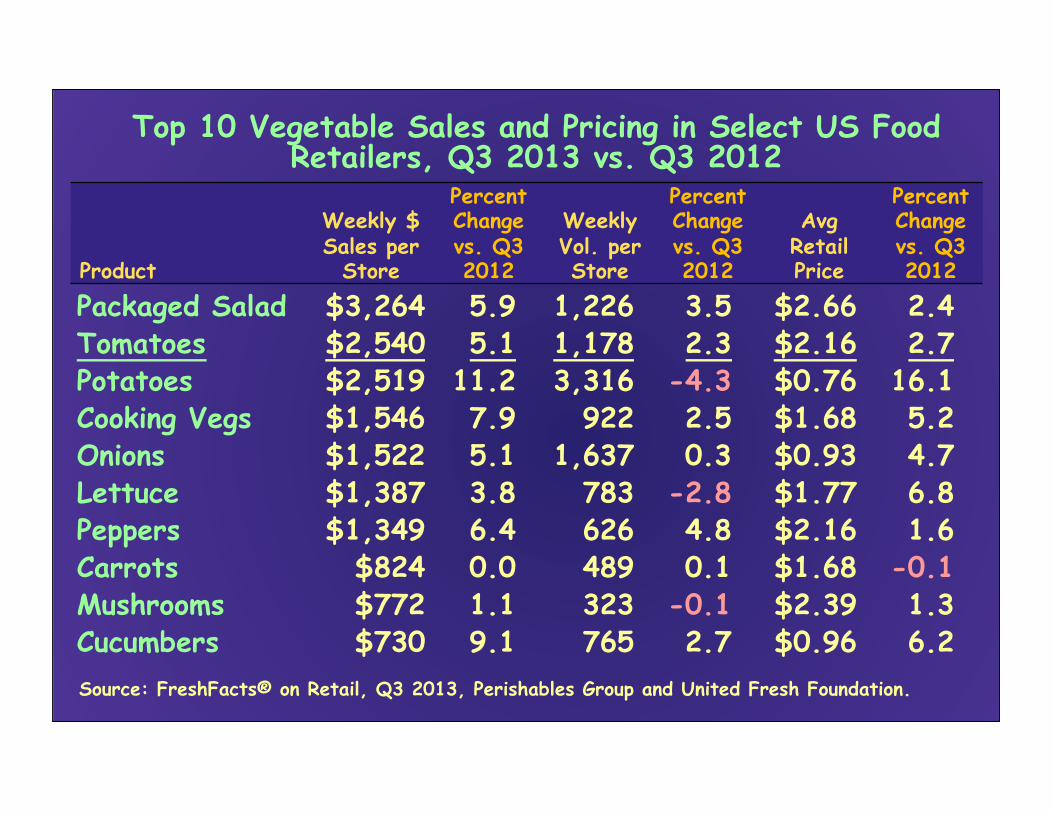
Top 10 Vegetable Sales and Pricing in Select US Food Retailers, Q3 2013 vs. Q3 2012
Product
Weekly $ Sales per
Store
Percent Change vs. Q3 2012
Weekly Vol. per Store
Percent Change vs. Q3 2012
Avg
Retail Price
Percent Change vs. Q3 2012
Packaged Salad $3,264 5.9 1,226 3.5 $2.66 2.4 Tomatoes $2,540 5.1 1,178 2.3 $2.16 2.7 Potatoes $2,519 11.2 3,316 -4.3 $0.76 16.1 Cooking Vegs $1,546 7.9 922 2.5 $1.68 5.2 Onions $1,522 5.1 1,637 0.3 $0.93 4.7 Lettuce $1,387 3.8 783 -2.8 $1.77 6.8 Peppers $1,349 6.4 626 4.8 $2.16 1.6 Carrots $824 0.0 489 0.1 $1.68 -0.1 Mushrooms $772 1.1 323 -0.1 $2.39 1.3 Cucumbers $730 9.1 765 2.7 $0.96 6.2 Source: FreshFacts® on Retail, Q3 2013, Perishables Group and United Fresh Foundation.

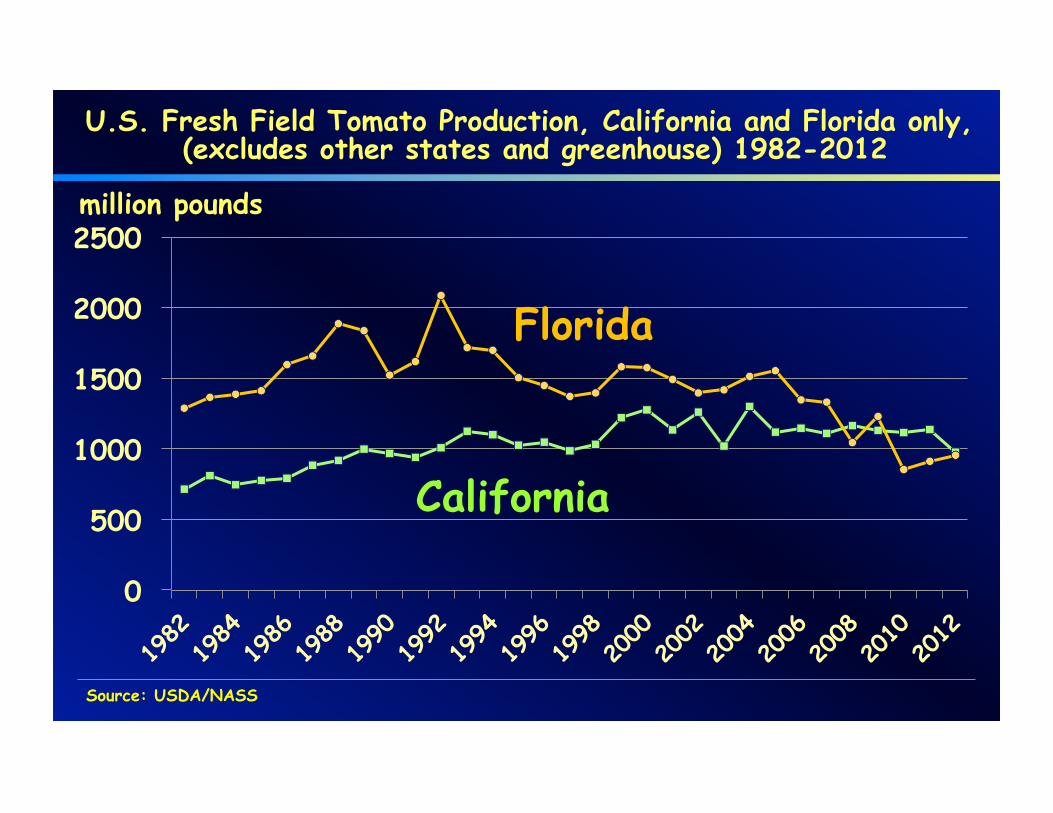
Historical Perspective
0
500
1000
1500
2000
2500
U.S. Fresh Field Tomato Production, California and Florida only, (excludes other states and greenhouse) 1982-2012
million pounds
Florida
California
Source: USDA/NASS
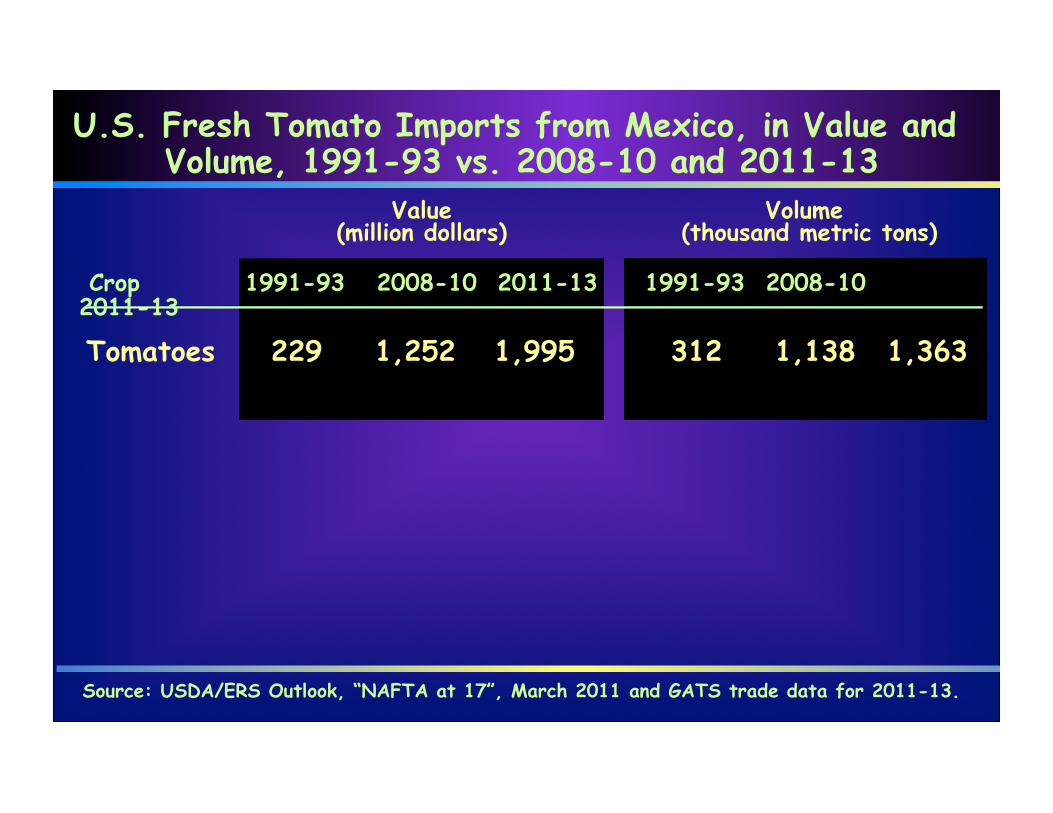
Source: USDA/ERS Outlook, “NAFTA at 17”, March 2011 and GATS trade data for 2011-13.
Tomatoes 229 1,252 1,995 312 1,138 1,363
U.S. Fresh Tomato Imports from Mexico, in Value and Volume, 1991-93 vs. 2008-10 and 2011-13
Crop 1991-93 2008-10 2011-13 1991-93 2008-10 2011-13
Volume (thousand metric tons)
Value (million dollars)
0
100,000
200,000
300,000
400,000
500,000
600,000
700,000
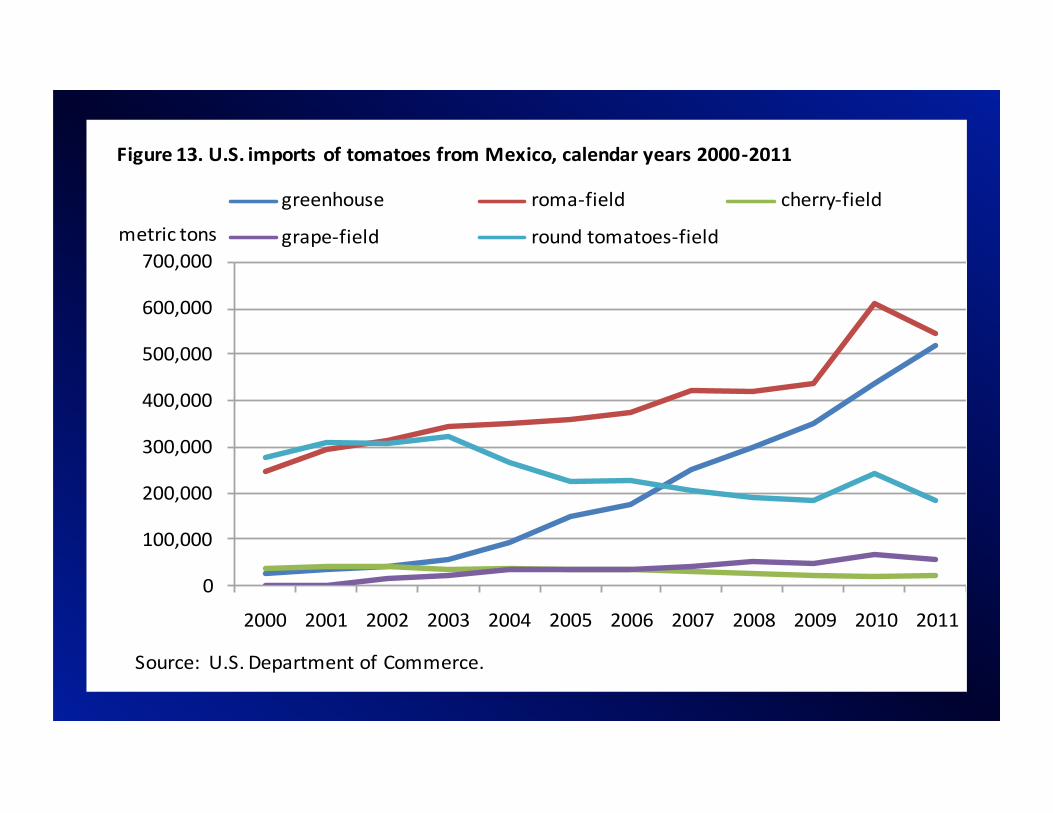
2000 2001 2002 2003 2004 2005 2006 2007 2008 2009 2010 2011
Figure 13. U.S. imports of tomatoes from Mexico, calendar years 2000-‐2011
greenhouse roma-‐field cherry-‐field
grape-‐field round tomatoes-‐fieldmetric tons
Source: U.S. Department of Commerce.
0
20
40
60
80
100
120
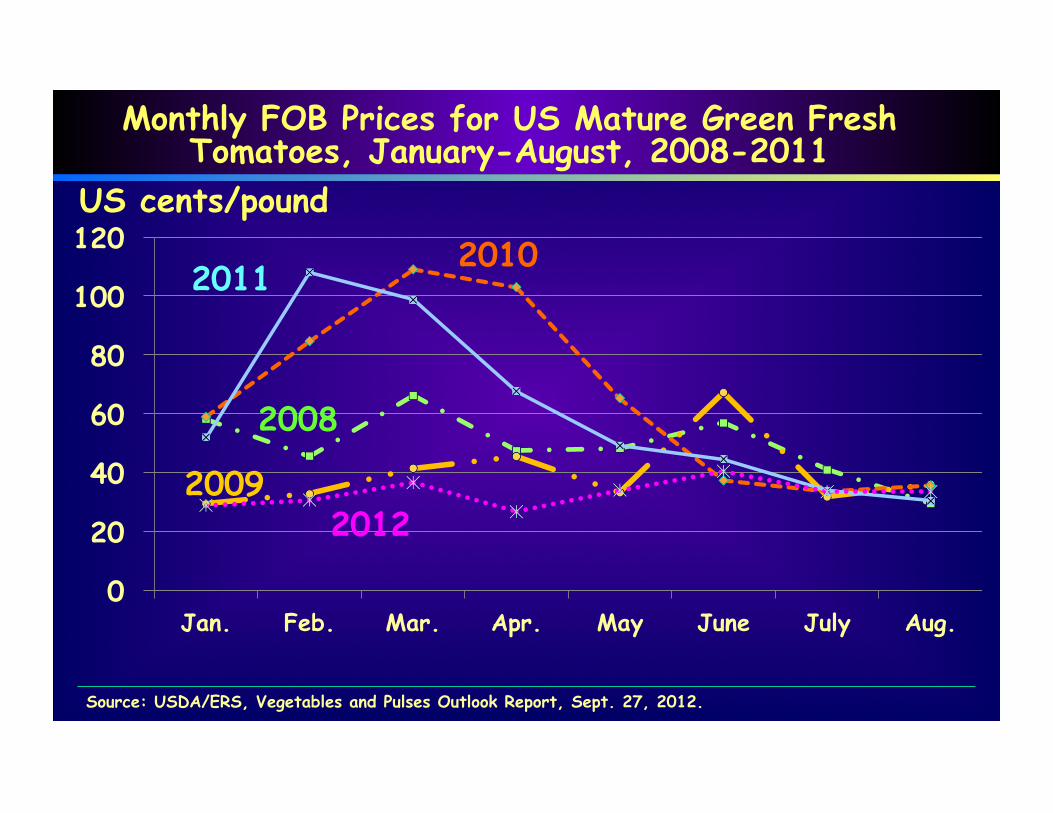
Jan. Feb. Mar. Apr. May June July Aug.
2012
Monthly FOB Prices for US Mature Green Fresh Tomatoes, January-August, 2008-2011
US cents/pound
2011
2008
2009
2010
Source: USDA/ERS, Vegetables and Pulses Outlook Report, Sept. 27, 2012.
0
100,000
200,000
300,000
400,000
500,000
600,000
700,000
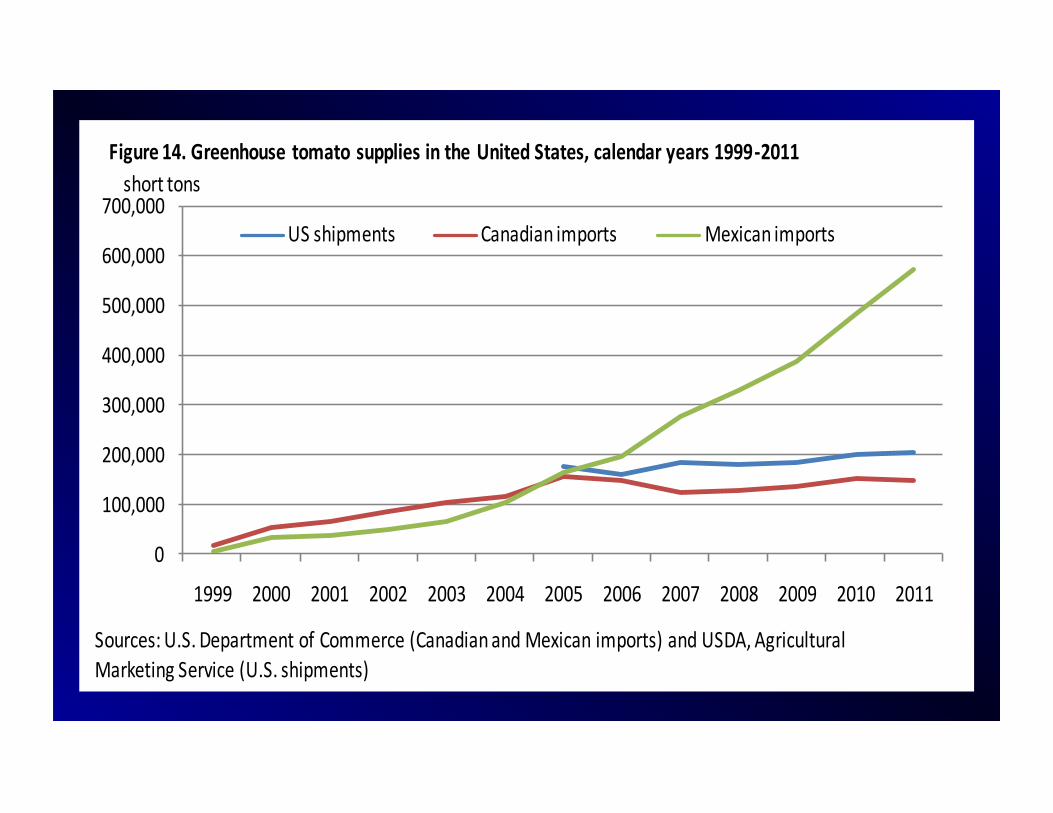
1999 2000 2001 2002 2003 2004 2005 2006 2007 2008 2009 2010 2011
Figure 14. Greenhouse tomato supplies in the United States, calendar years 1999-‐2011
US shipments Canadian imports Mexican imports
short tons
Sources: U.S. Department of Commerce (Canadian and Mexican imports) and USDA, Agricultural Marketing Service (U.S. shipments)

Update on US Fresh Greenhouse Industry
Over 1100 acres in 2013 among the main players, Eurofresh Farms, Village Farms, Windset Farms, Houweling’s, and Backyard Farms. Part of capacity not utilized in 2013 (Eurofresh, Village, Backyard Farms). Latter two will be back up but Eurofresh will be down more in 2014. Some growth in controlled environment among major players, and small urban players – “local.”
Update on US Fresh Tomato Imports

US Fresh Tomato Imports, All Types, by Key Country, 2009-2013, million pounds
0
500
1,000
1,500
2,000
2,500
3,000
3,500
4,000
Mexico Canada Other Countries Total
Millions
2009 2010 2011 2012 2013
Sources: US Department of Commerce. US Census Bureau, Foreign Trade Statistics and ERS calculations.

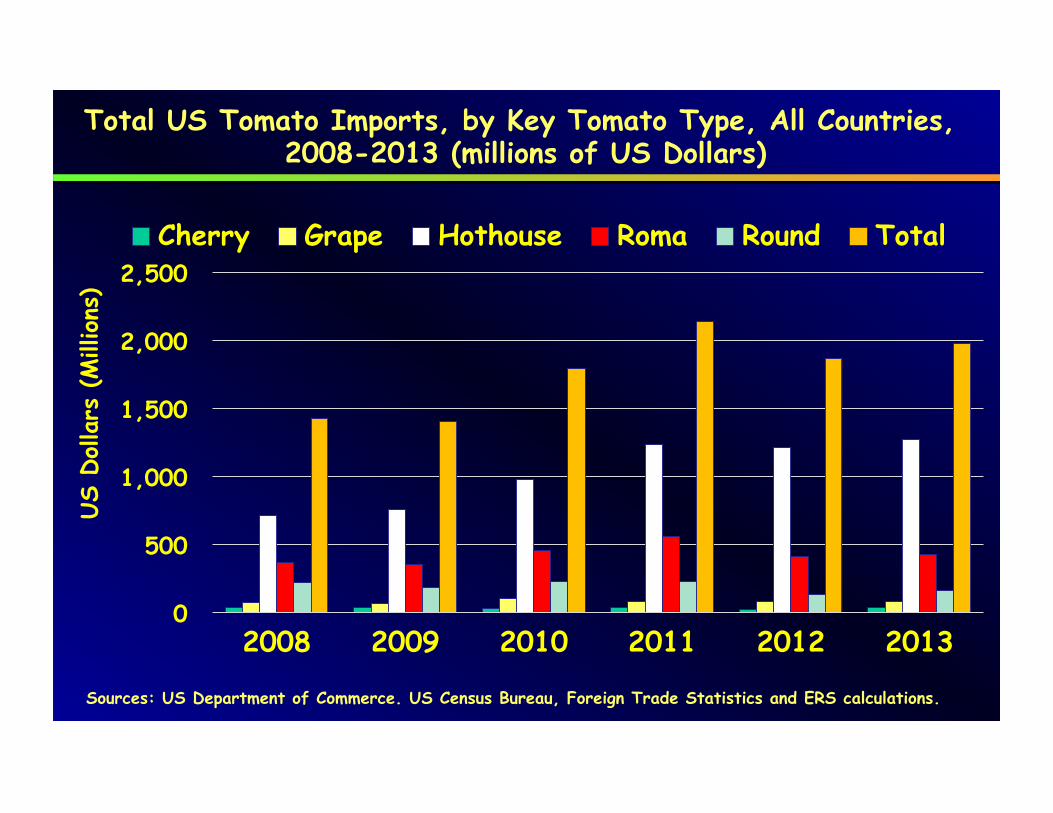
US Fresh Tomato Imports, All Types, by Key Country, 2008-2013, million dollars
0
500
1,000
1,500
2,000
2,500
Mexico Canada Other countries Total
Millions
2008 2009 2010 2011 2012 2013
Sources: US Department of Commerce.
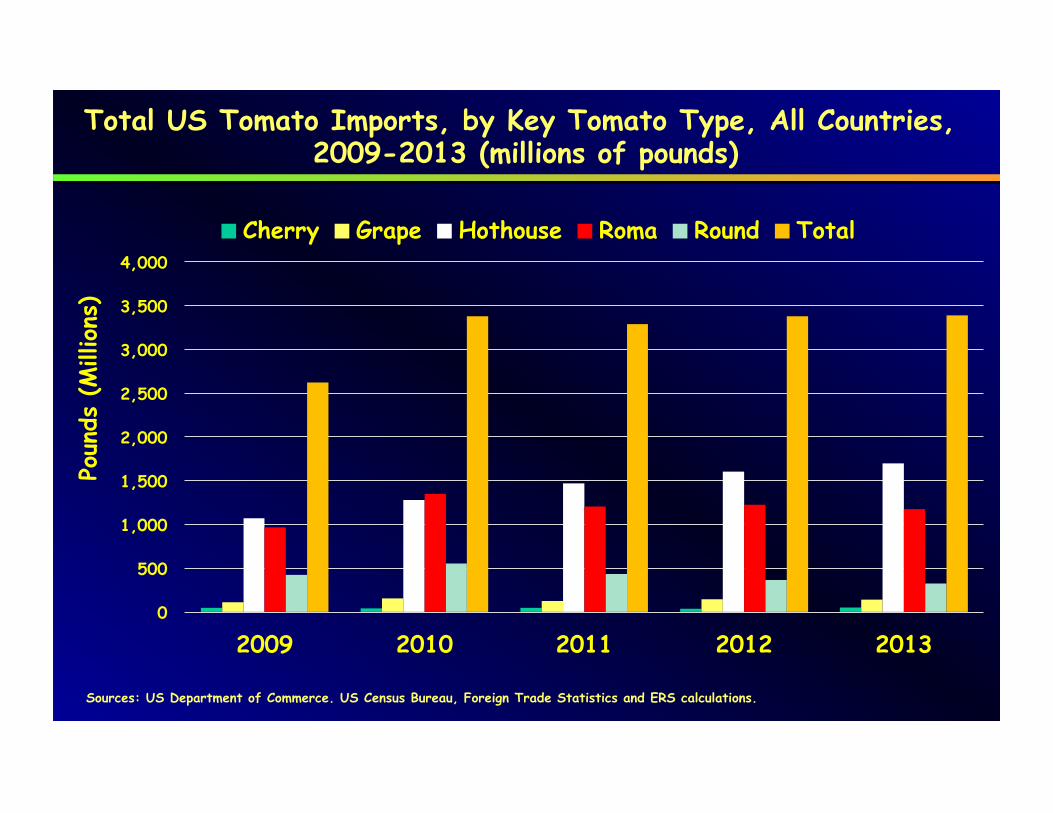
0
500
1,000
1,500
2,000
2,500
3,000
3,500
4,000
2009 2010 2011 2012 2013
Poun
ds (M
illions
)
Cherry Grape Hothouse Roma Round Total
Sources: US Department of Commerce. US Census Bureau, Foreign Trade Statistics and ERS calculations.
Total US Tomato Imports, by Key Tomato Type, All Countries, 2009-2013 (millions of pounds)
0
500
1,000
1,500
2,000
2,500
2008 2009 2010 2011 2012 2013
US
Dollars
(M
illions
)
Cherry Grape Hothouse Roma Round Total
Sources: US Department of Commerce. US Census Bureau, Foreign Trade Statistics and ERS calculations.
Total US Tomato Imports, by Key Tomato Type, All Countries, 2008-2013 (millions of US Dollars)
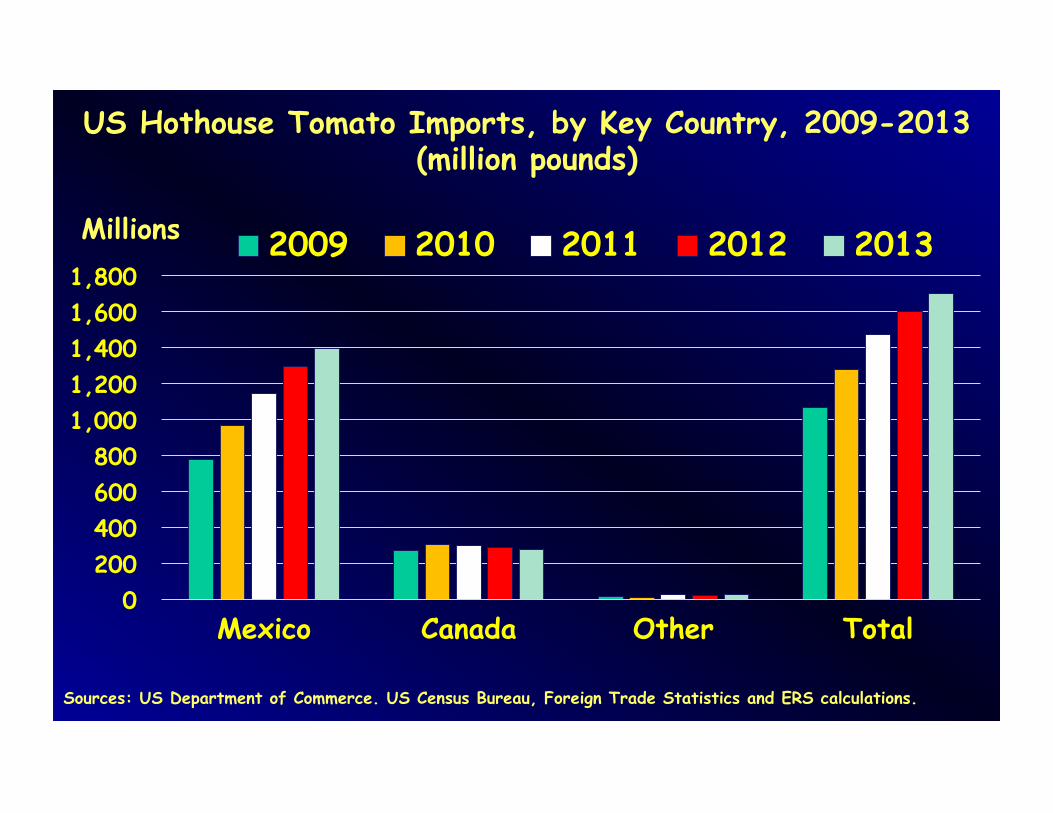
US Hothouse Tomato Imports, by Key Country, 2009-2013 (million pounds)
0 200 400 600 800
1,000 1,200 1,400 1,600 1,800
Mexico Canada Other Total
Millions 2009 2010 2011 2012 2013
Sources: US Department of Commerce. US Census Bureau, Foreign Trade Statistics and ERS calculations.

0
100
200
300
400
500
600
Mexico Canada Other Total
Millions
2009 2010 2011 2012 2013
Sources: US Department of Commerce. US Census Bureau, Foreign Trade Statistics and ERS calculations.
US Round Tomato Imports, by Key Country, 2009-2013 (million pounds)

Import volume by country, Roma Tomatoes 2009-2013 (million pounds)
0
200
400
600
800
1,000
1,200
1,400
1,600
Mexico Other Countries Total
Millions 2009 2010 2011 2012 2013
Sources: US Department of Commerce. US Census Bureau, Foreign Trade Statistics and ERS calculations.

0
10
20
30
40
50
60
Mexico Canada Other Total
Millions 2009 2010 2011 2012 2013
Sources: US Department of Commerce. US Census Bureau, Foreign Trade Statistics and ERS calculations.
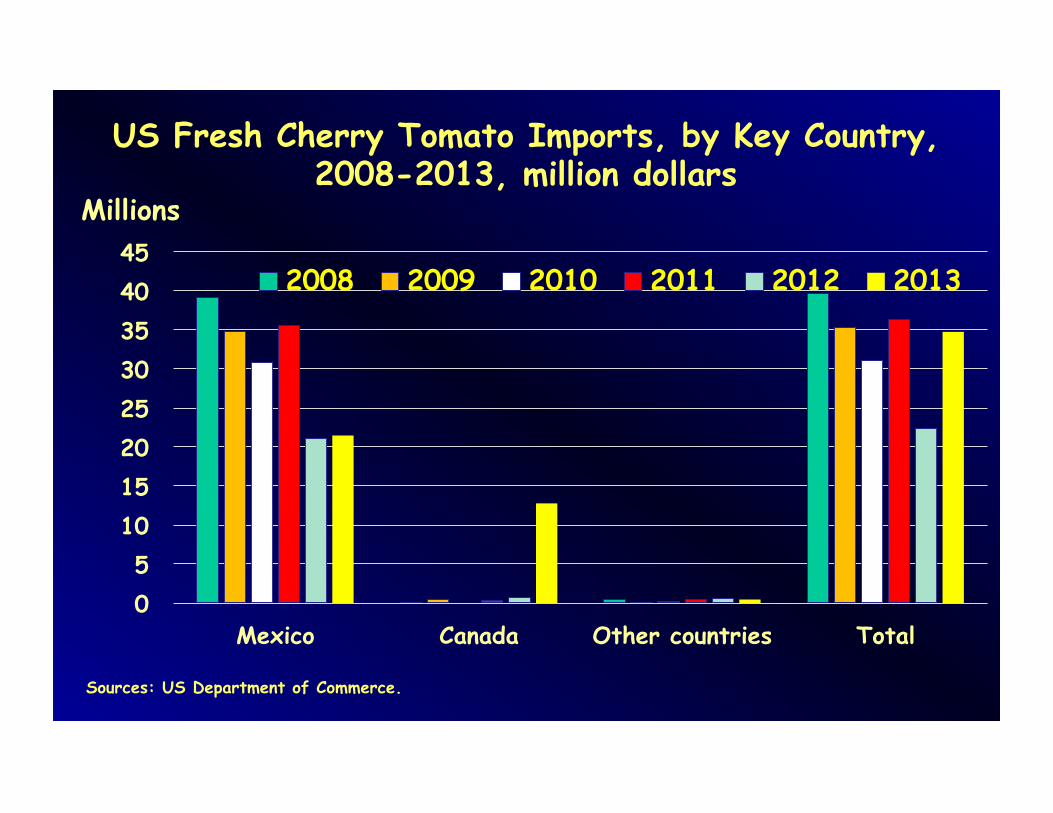
US Cherry Tomato Imports, by Key Country, 2009-2013 million pounds
0 20 40 60 80
100 120 140 160 180
Mexico Other Total
Millions 2009 2010 2011 2012 2013
Sources: US Department of Commerce. US Census Bureau, Foreign Trade Statistics and ERS calculations.
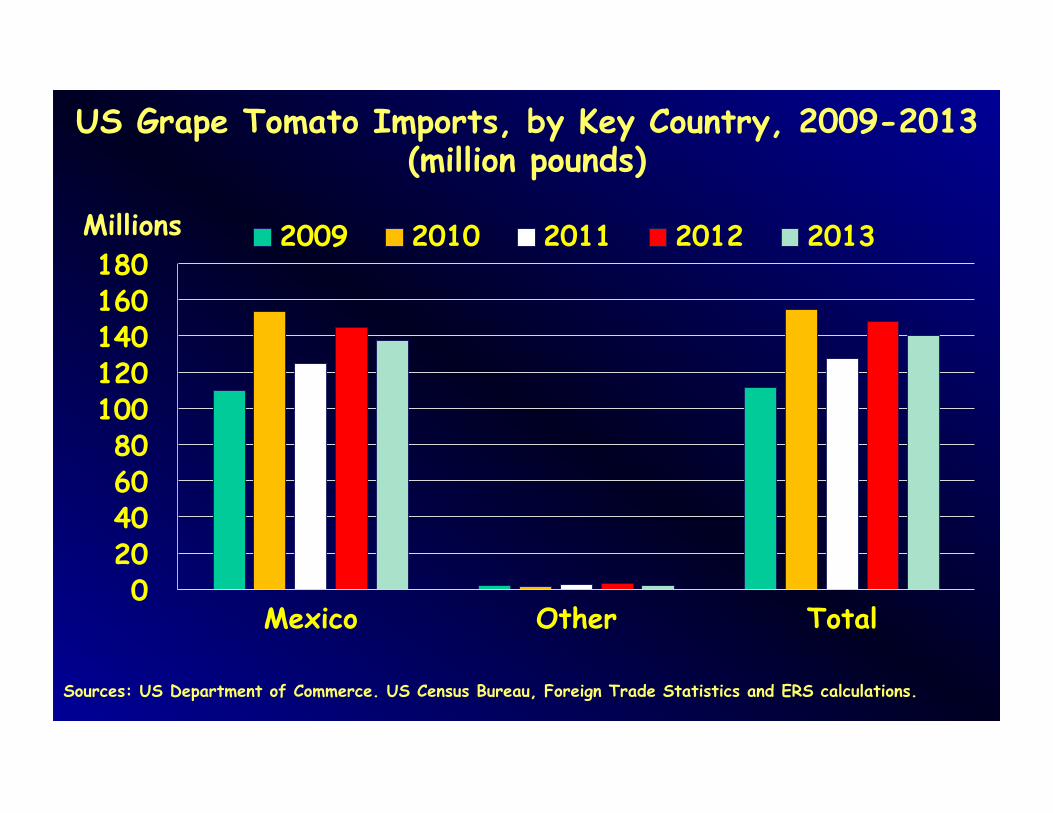
US Grape Tomato Imports, by Key Country, 2009-2013 (million pounds)

Average annual import unit value by fresh tomato variety, 2009-2013, US Dollars per pound
0.00
0.20
0.40
0.60
0.80
1.00
Cherry Grape Hothouse Roma Round
2009 2010 2011 2012 2013
Sources: US Department of Commerce. US Census Bureau, Foreign Trade Statistics and ERS calculations.

Canada: Greenhouse Tomato Trends • Interviews indicate that acreage in BC is
stable while it grows in Ontario. • In Jan. 2011 according to the OGVG, there
were 404 acres of clusters/specialties in Ont. plus 378 acres of beefs (total 782), vs in Jan. 2014 there were 543 plus 378 acres, respectively, (total 920). Specialties! And over half is high tech glass.
• Following trends are from Statistics Canada, 2013 data not yet available.
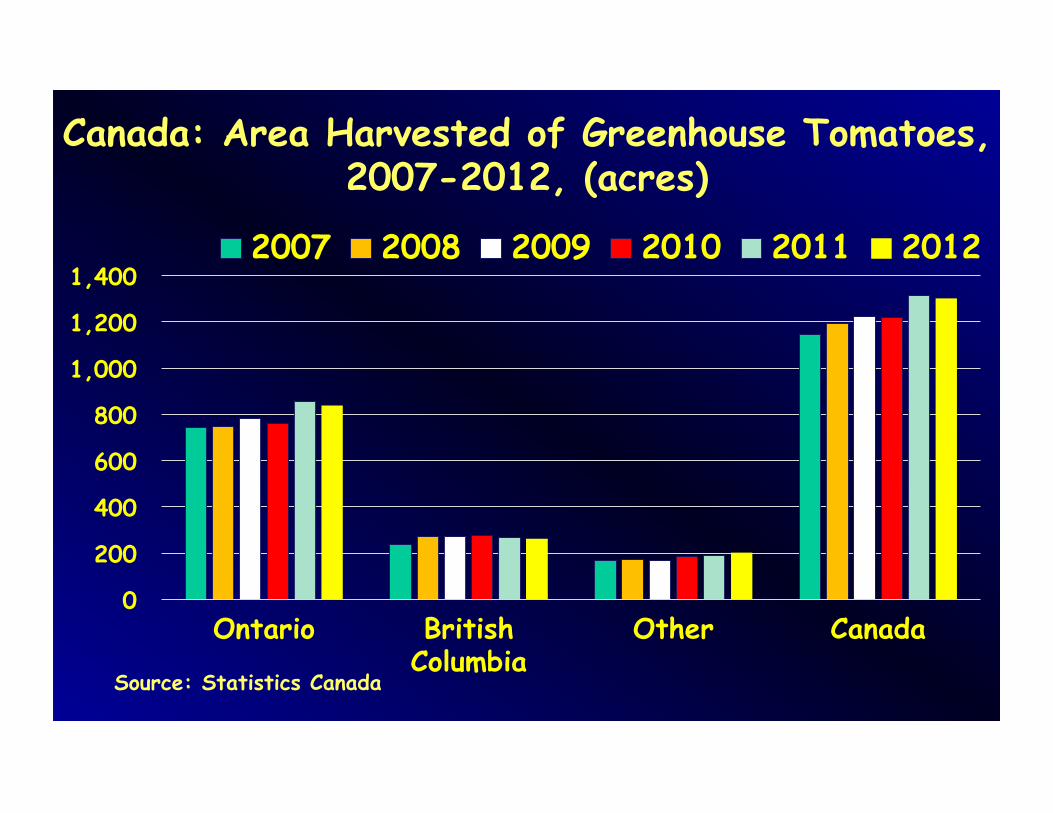
Canada: Area Harvested of Greenhouse Tomatoes, 2007-2012, (acres)
0
200
400
600
800
1,000
1,200
1,400
Ontario British Columbia
Other Canada
2007 2008 2009 2010 2011 2012
Source: Statistics Canada
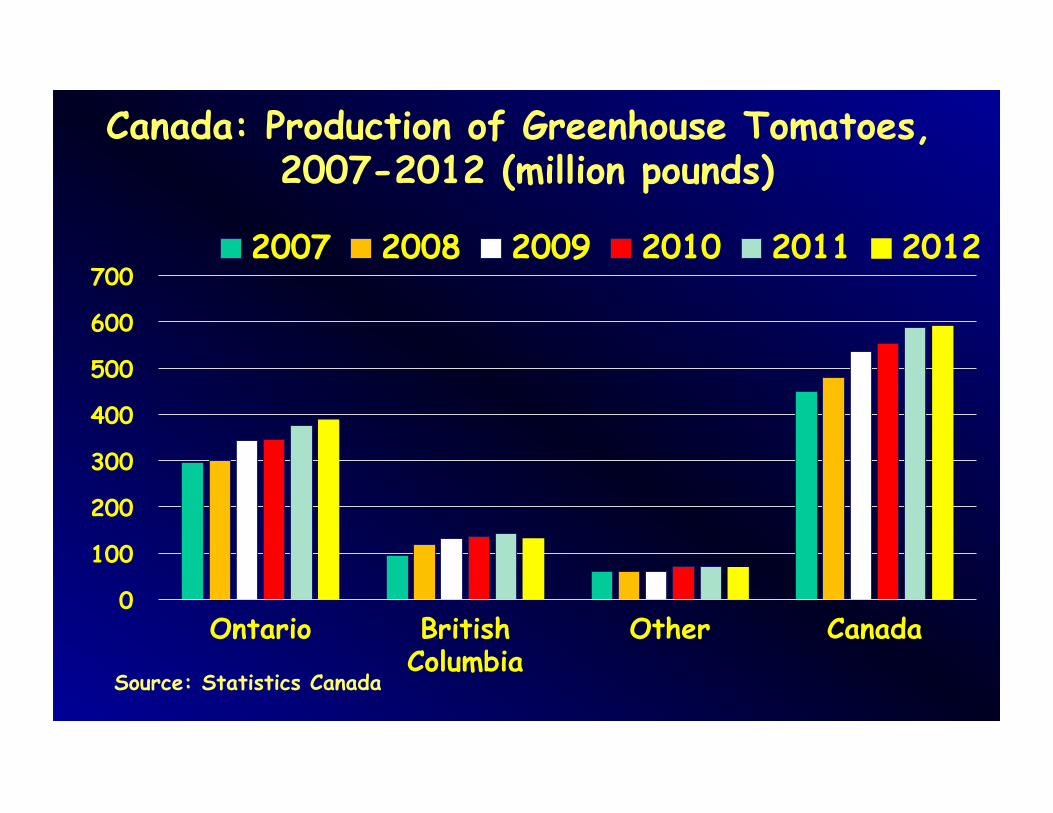
Canada: Production of Greenhouse Tomatoes, 2007-2012 (million pounds)
0
100
200
300
400
500
600
700
Ontario British Columbia
Other Canada
2007 2008 2009 2010 2011 2012
Source: Statistics Canada
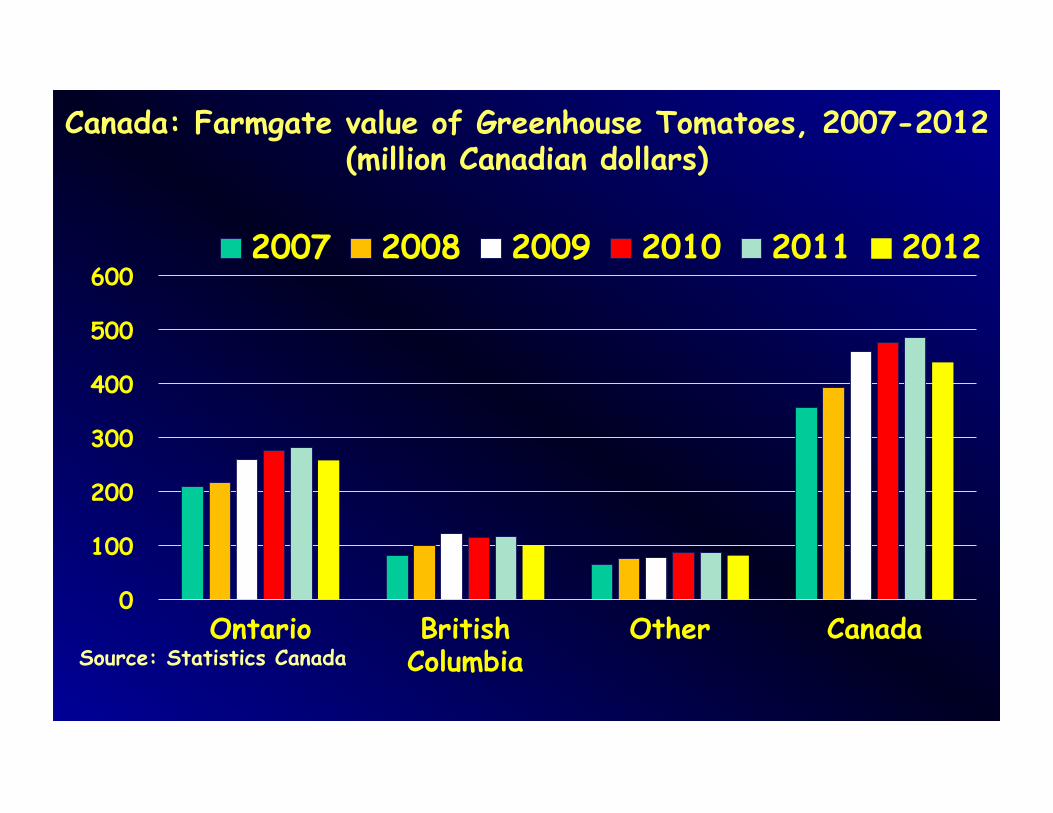
Canada: Farmgate value of Greenhouse Tomatoes, 2007-2012 (million Canadian dollars)
0
100
200
300
400
500
600
Ontario British Columbia
Other Canada
2007 2008 2009 2010 2011 2012
Source: Statistics Canada
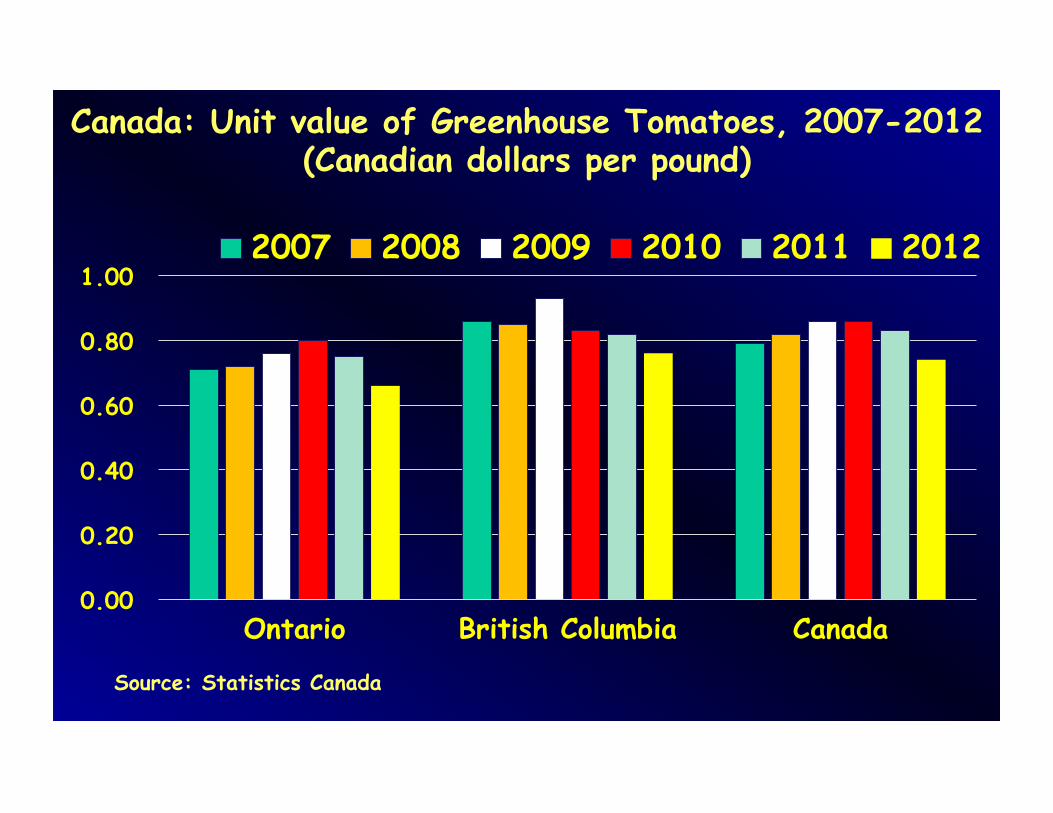
Canada: Unit value of Greenhouse Tomatoes, 2007-2012 (Canadian dollars per pound)
0.00
0.20
0.40
0.60
0.80
1.00
Ontario British Columbia Canada
2007 2008 2009 2010 2011 2012
Source: Statistics Canada

• The relatively strong competitiveness of the US veg industry is because more than being labor-intensive, fruit/veg are knowledge, technology, capital, and marketing-intensive.
• However, protected culture, which is technology and capital-intensive is emerging elsewhere.
• US growers face an ever more complex regulatory environment. • Labor availability is increasingly problematic, everywhere.
Relative Competitiveness of US Veg Industry
Mexico
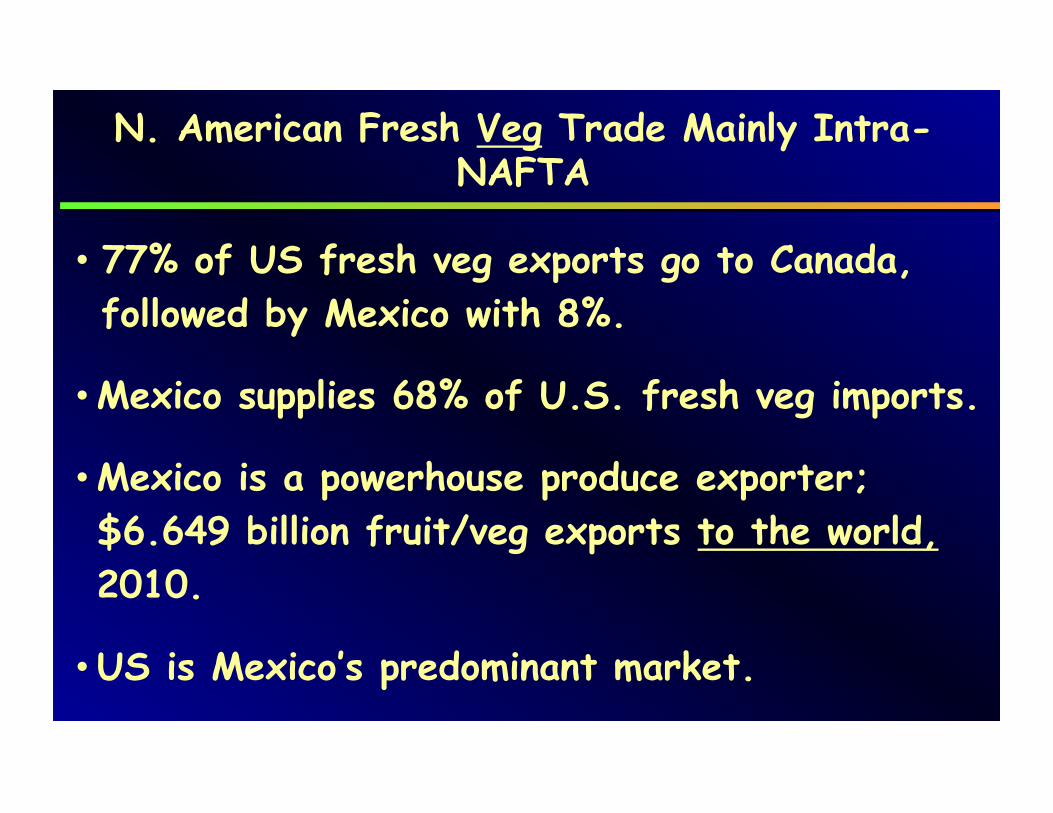
• 77% of US fresh veg exports go to Canada, followed by Mexico with 8%.
• Mexico supplies 68% of U.S. fresh veg imports.
• Mexico is a powerhouse produce exporter; $6.649 billion fruit/veg exports to the world, 2010.
• US is Mexico’s predominant market.
N. American Fresh Veg Trade Mainly Intra-NAFTA
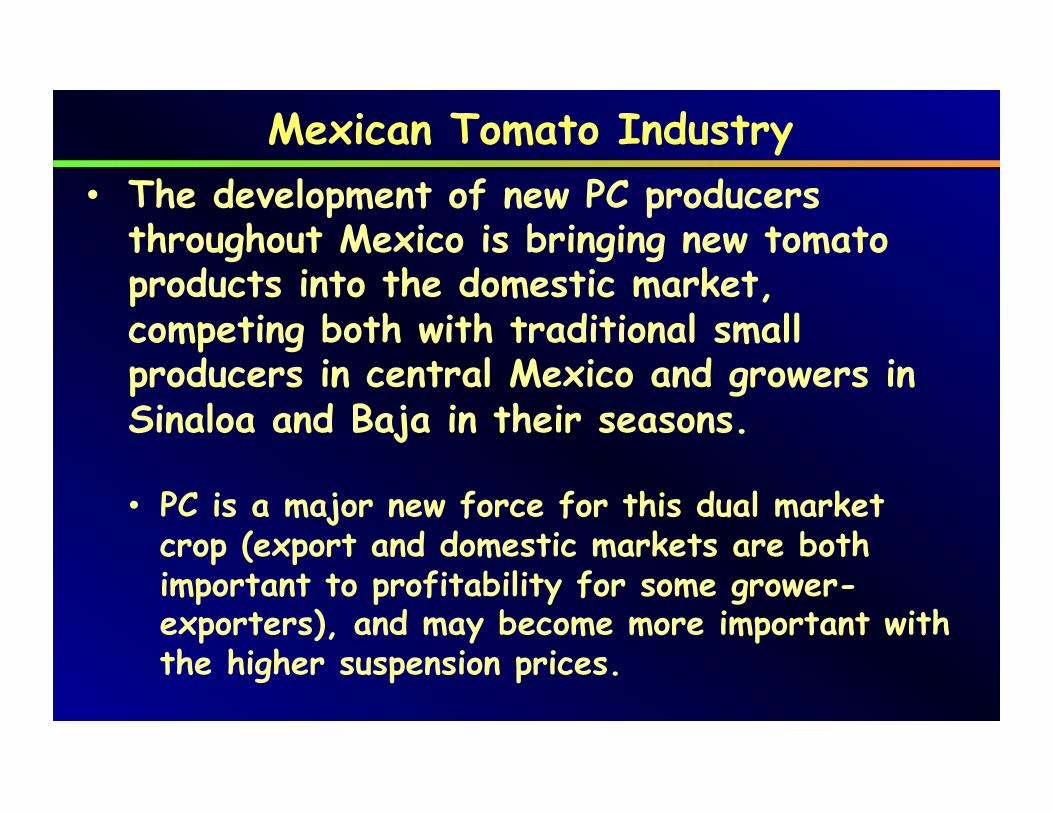
Mexican Tomato Industry • The development of new PC producers
throughout Mexico is bringing new tomato products into the domestic market, competing both with traditional small producers in central Mexico and growers in Sinaloa and Baja in their seasons.
• PC is a major new force for this dual market
crop (export and domestic markets are both important to profitability for some grower-exporters), and may become more important with the higher suspension prices.

Protected Culture in Mexico
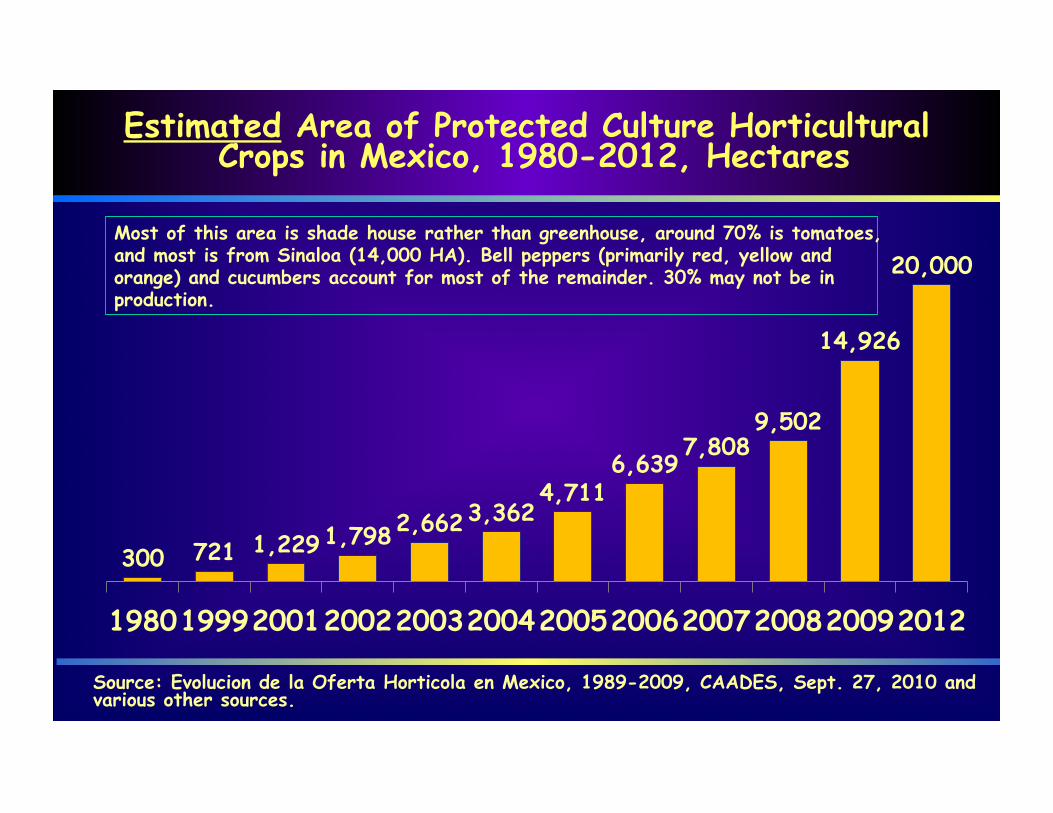
Estimated Area of Protected Culture Horticultural Crops in Mexico, 1980-2012, Hectares
300 721 1,229 1,798 2,662 3,362
4,711 6,639
7,808 9,502
14,926
20,000
1980 1999 2001 2002 2003 2004 2005 2006 2007 2008 2009 2012
Most of this area is shade house rather than greenhouse, around 70% is tomatoes, and most is from Sinaloa (14,000 HA). Bell peppers (primarily red, yellow and orange) and cucumbers account for most of the remainder. 30% may not be in production.
Source: Evolucion de la Oferta Horticola en Mexico, 1989-2009, CAADES, Sept. 27, 2010 and various other sources.
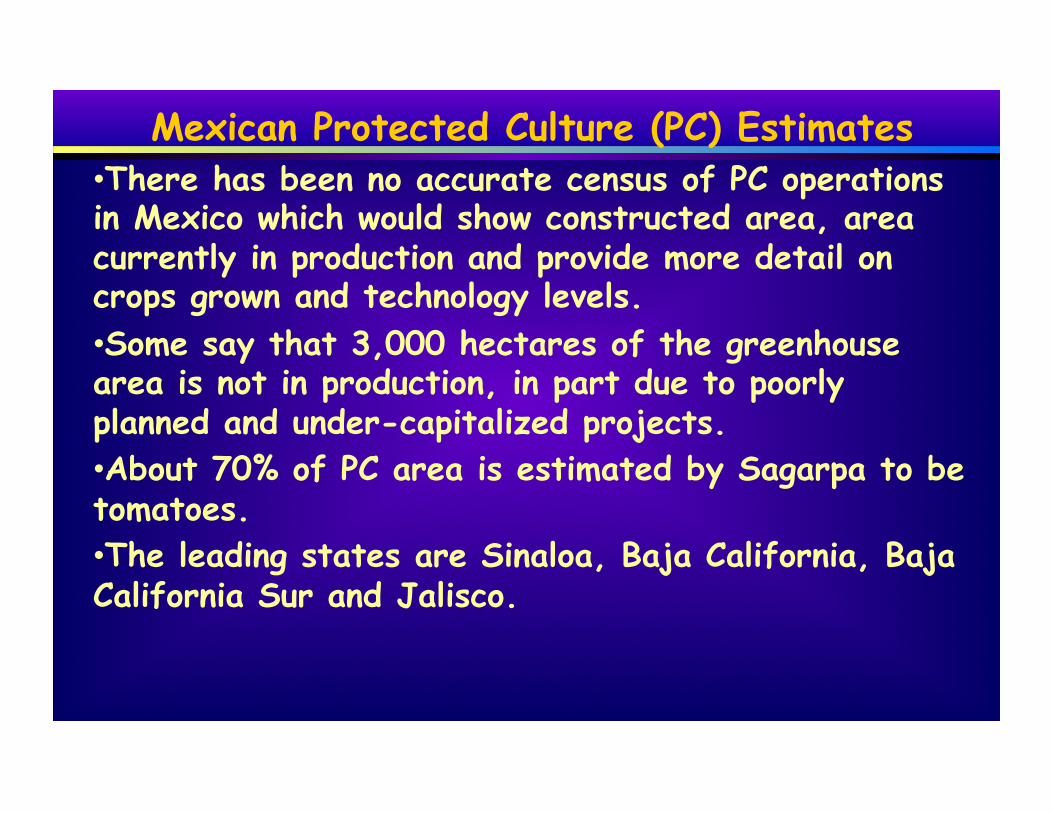
Mexican Protected Culture (PC) Estimates • There has been no accurate census of PC operations in Mexico which would show constructed area, area currently in production and provide more detail on crops grown and technology levels. • Some say that 3,000 hectares of the greenhouse area is not in production, in part due to poorly planned and under-capitalized projects. • About 70% of PC area is estimated by Sagarpa to be tomatoes. • The leading states are Sinaloa, Baja California, Baja California Sur and Jalisco.

Mexico’s Farm Workforce Has Declined between 1995 and 2010 – No panacea there either
Source: ARE Update May/Apr 2013 16(4):1-4
7.9
7.7
8.7
7.4
7.9
7.1 7.1
7.2
6.8
6.9
6.4
6.3
6.1 6.1 6.1 6.2
1995
1996
1997
1998
1999
2000
2001
2002
2003
2004
2005
2006
2007
2008
2009
2010
Workforce in millions

Conclusions • Tomato market focusing more on quality, with
emphasis on flavor, aided by seed innovation • Export marketing from Mexico still too
fragmented, remainder of N. American industry, whether GH or open field is relatively concentrated
• Growers must be market-driven in their planting decisions
• Higher suspension prices may impose more market orderliness, to the benefit of most

Conclusions • Producers must think carefully about scaling
their operations to meet market demand • Foodservice is beginning to take more PC
tomatoes, if successful this could offer another period of expansion in demand at the expense of mature green (cost and food safety both important factors weighed by operators)
• Demand is maturing for tomatoes and cannibalization is rampant, across tomato types and sectors

Conclusions • Ongoing retail consolidation is leading to even
fewer, larger buyers, often seeking secure sources of year-round supply and contracts
• Growing use of contracts may smooth out the highs and lows of market prices
• Seems to be some growing consumer awareness of the term greenhouse and association with environmental sustainability, may follow organic trend/cache among same consumer segment (18% of households)
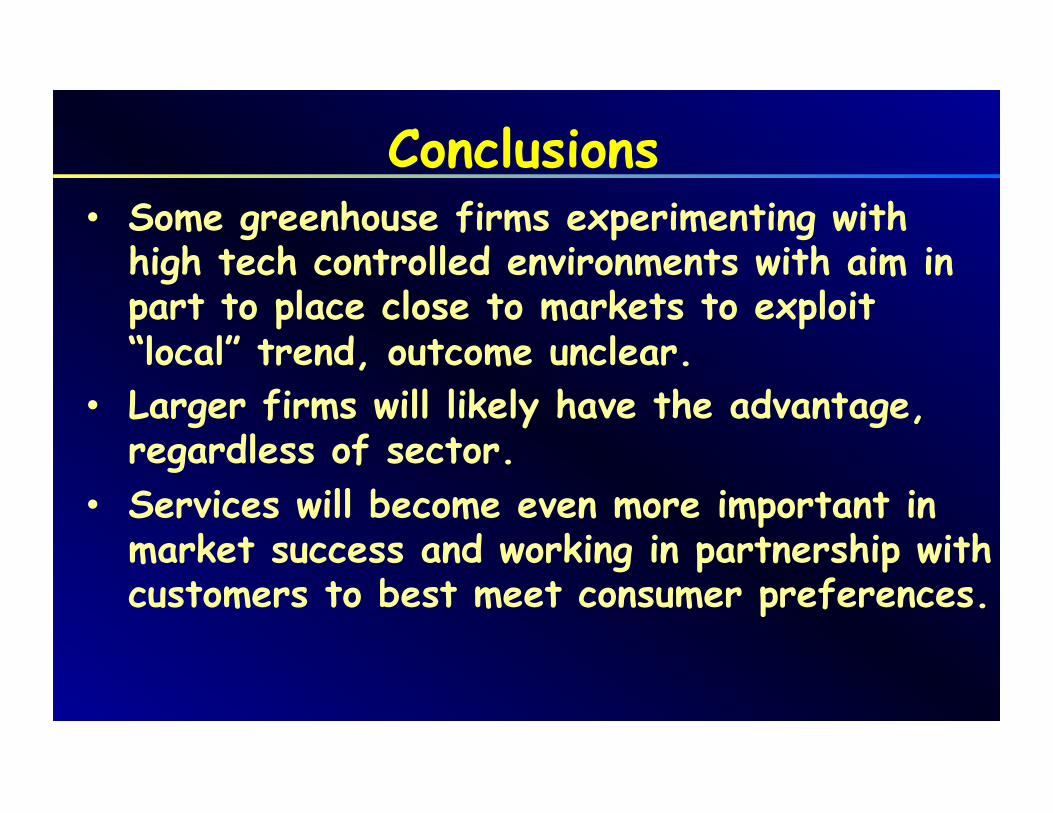
Conclusions • Some greenhouse firms experimenting with
high tech controlled environments with aim in part to place close to markets to exploit “local” trend, outcome unclear.
• Larger firms will likely have the advantage, regardless of sector.
• Services will become even more important in market success and working in partnership with customers to best meet consumer preferences.

Supplemental Information
US Fresh Cherry Tomato Imports, by Key Country, 2008-2013, million dollars
0 5
10 15 20 25 30 35 40 45
Mexico Canada Other countries Total
Millions
2008 2009 2010 2011 2012 2013
Sources: US Department of Commerce.

US Fresh Grape Tomato Imports, by Key Country, 2008-2013, million dollars
0
20
40
60
80
100
120
Mexico Canada Other countries Total
Millions
2008 2009 2010 2011 2012 2013
Sources: US Department of Commerce.
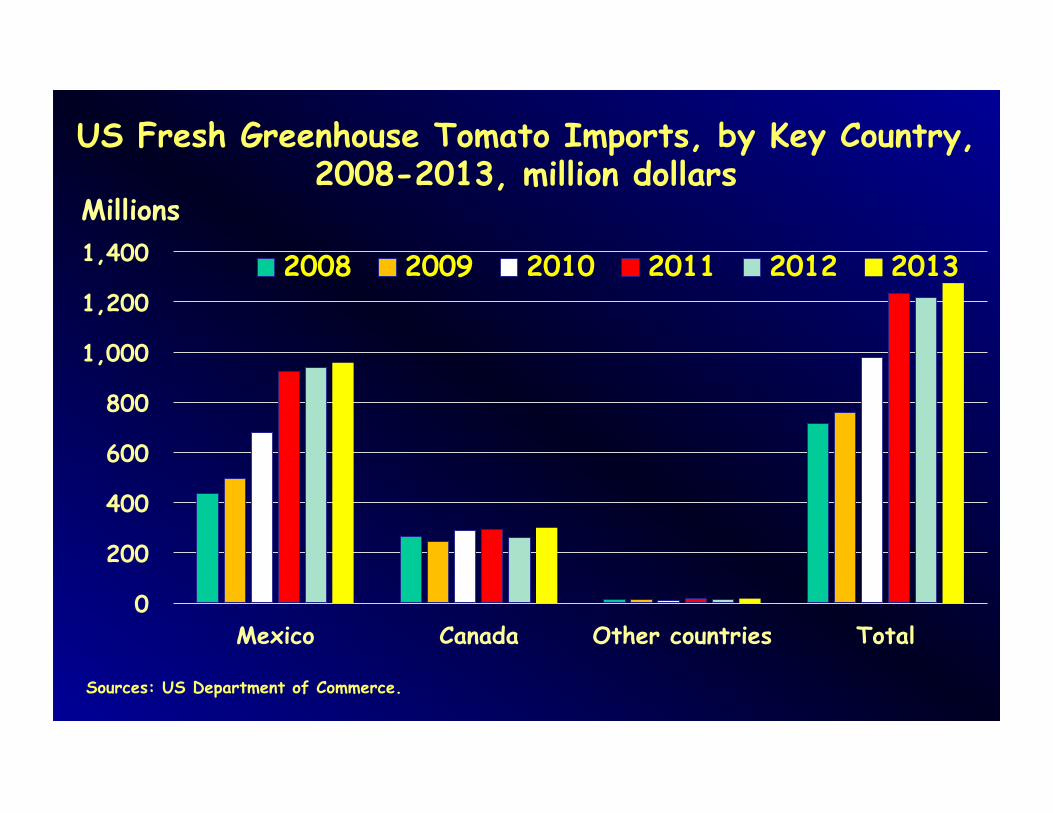
US Fresh Greenhouse Tomato Imports, by Key Country, 2008-2013, million dollars
0
200
400
600
800
1,000
1,200
1,400
Mexico Canada Other countries Total
Millions
2008 2009 2010 2011 2012 2013
Sources: US Department of Commerce.

US Fresh Roma Tomato Imports, by Key Country, 2008-2013, million dollars
0
100
200
300
400
500
600
Mexico Canada Other countries Total
Millions
2008 2009 2010 2011 2012 2013
Sources: US Department of Commerce.

US Fresh Round Tomato Imports, by Key Country, 2008-2013, million dollars
0
50
100
150
200
250
Mexico Canada Other countries Total
Millions
2008 2009 2010 2011 2012 2013
Sources: US Department of Commerce.