Fresenius 2013 06 20 Barclays European Select Conference · Medical Devices/ Transfusion Technology...
27
Barclays European Select Conference 2013 June 20 − 21, 2013
Transcript of Fresenius 2013 06 20 Barclays European Select Conference · Medical Devices/ Transfusion Technology...

Barclays European Select Conference 2013
June 20 − 21, 2013

Page 2
Safe Harbor Statement
Barclays European Select Conference 2013, Fresenius SE & Co. KGaA, Investor Relations © Copyright, June 20 − 21, 2013
This presentation contains forward-looking statements that are subject to various risks and uncertainties. Future results could differ materially from those described in these forward-looking statements due to certain factors, e.g. changes in business, economic and competitive conditions, regulatory reforms, results of clinical trials, foreign exchange rate fluctuations, uncertainties in litigation or investigative proceedings, and the availability of financing. Fresenius does not undertake any responsibility to update the forward-looking statements contained in this presentation.

Page 3
Fresenius: 100 Years of Forward Looking Healthcare
1996
No. 1 in German hospital operations
2005
2008
IPO
1986
Introduction ofdialysis machines
and dialyzers
1966
Oct. 1 - the day it all began
1912
1955 1977
1996
No. 1 in TransfusionTechnologyworldwide
2012
1999
No. 1 in dialysisworldwide
Expansion into hospital projects and
services
Top 5 in generic IV drugs
worldwide
Expansion of the infusion solutions
productrange
Entry into emerging markets (Brazil)
No. 1 in Infusion and Nutrition Therapy
in Europe
Barclays European Select Conference 2013, Fresenius SE & Co. KGaA, Investor Relations © Copyright, June 20 − 21, 2013
1994: Sales
>€1 bn
2006: Sales
>€10 bn
2013e: Sales
>€20 bn

Page 4Barclays European Select Conference 2013, Fresenius SE & Co. KGaA, Investor Relations © Copyright, June 20 − 21, 2013
Sales
Fresenius Group: A Decade of Consistent Growth
19.3
16.516.0
14.2
12.311.4
10.8
7.97.37.1
2003 2004 2005 2006 2007 2008 2009 2010 2011 2012
€bn
115
168
222
330
410450
514
660
770
938
2003 2004 2005 2006 2007 2008 2009 2010 2011 2012
€m
Sales Net Income
CAGR 12% CAGR 26%

Page 5
0 4 8 12 16 20 24 28
DAX30
Fresenius
Fresenius Group: Attractive Long-term Shareholder Returns
20th consecutive dividend increase2012: +16% Fresenius outperforms index
Source: Bloomberg; dividends reinvested
0.07
0.380.41
0.450.49
0.57
0.660.70
0.75
0.86
0.95
1.10
'93 '02 '03 '04 '05 '06 '07 '08 '09 '10 '11 '12
€
24.02% p.a.
10.15% p.a.
%
1 Before one-time items
CAGR 16%
New dividend policy –align dividend growth with EPS1 growth –
broadly maintain current pay-out ratio
Compounded annual total return Dec 31, 2002 − Dec 31, 2012
Barclays European Select Conference 2013, Fresenius SE & Co. KGaA, Investor Relations © Copyright, June 20 − 21, 2013

Page 6Barclays European Select Conference 2013, Fresenius SE & Co. KGaA, Investor Relations © Copyright, June 20 − 21, 2013
Achieving Profitable Growth in Attractive Health Care Segments
Fresenius Medical Care is fully consolidated in the financial statements of Fresenius SE & Co. KGaA
FreseniusBiotech
Hospital Operations
Sales 2012: €3,200 mEBIT 2012: €322 m
Engineering and Servicesfor Hospitals and
Other Health Care Facilities
Sales 2012: €846 mEBIT 2012: €51 m
Dialysis Products,Dialysis Care
Sales 2012: US$13,800 mEBIT 2012: US$2,329 m
Infusion Therapy, IV Drugs,Clinical Nutrition, Medical Devices/
Transfusion Technology
Sales 2012: €4,539 mEBIT 2012: €934 m
Oncology and Immunology TherapiesEBIT 2012: -€27 m
FreseniusHelios
FreseniusVamed
Fresenius Medical Care
FreseniusKabi
Frankfurt listing (DAX30): FREUS ADR program (OTC): FSNUY
31% 100% 100% 77%
100%
Sales 2012: €19.3 bnEBIT 2012: €3,075 m
Page 7
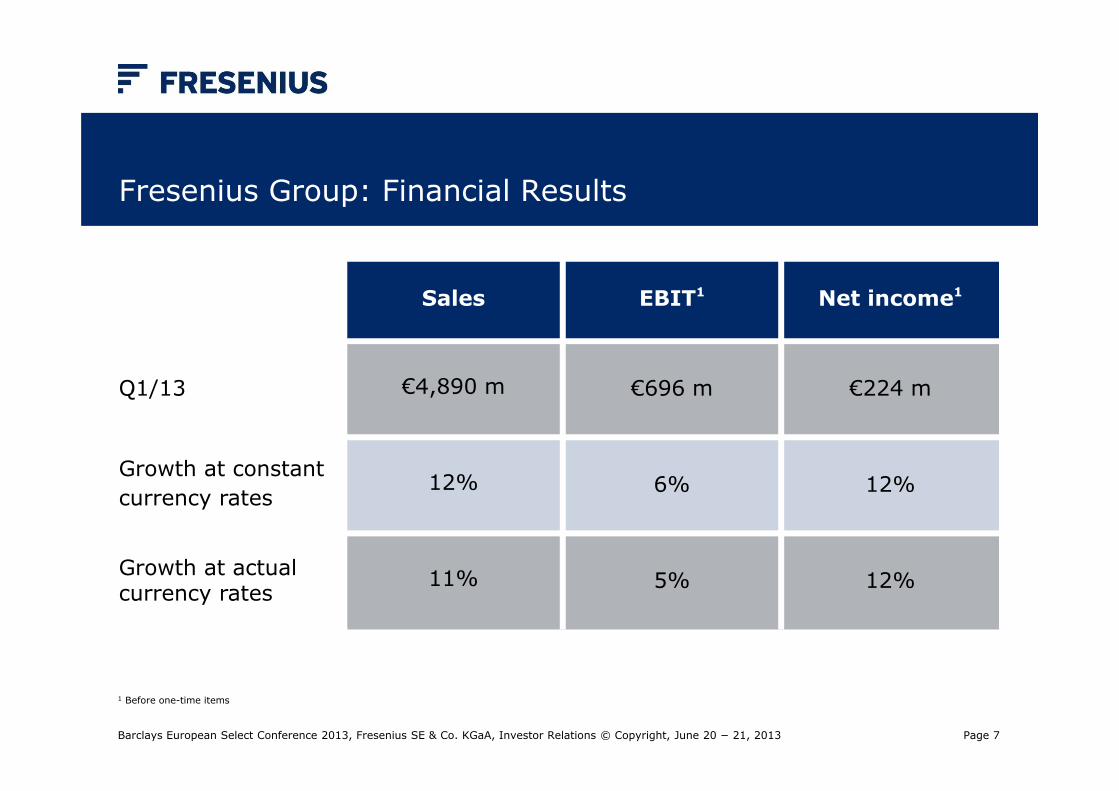
Fresenius Group: Financial Results
Barclays European Select Conference 2013, Fresenius SE & Co. KGaA, Investor Relations © Copyright, June 20 − 21, 2013
1 Before one-time items
Sales EBIT1 Net income1
Q1/13 €4,890 m €696 m €224 m
Growth at constantcurrency rates
12% 6% 12%
Growth at actualcurrency rates
11% 5% 12%

Page 8
Fresenius Group: Financial Results by Business Segment
Barclays European Select Conference 2013, Fresenius SE & Co. KGaA, Investor Relations © Copyright, June 20 − 21, 2013
Q1/13 FreseniusMedical Care
FreseniusKabi
FreseniusHelios
FreseniusVamed
SalesGrowth
US$3,464 m 7%
€1,260 m15%
€841 m18%
€184 m23%
EBITGrowth
US$493 m -2%
€237 m 10%
€87 m 28%
€5 m 0%

Page 9
293323
366
427
523556
639
738770
660
514
450
410
115168
222
330
938
870
770
2003 2004 2005 2006 2007 2008 2009 2010 2011 2012
Fresenius Group: Distribution and Development of Net Income
Fresenius Medical Care
KabiHeliosVamed- Corporate
Net income
44%29%
56%
71%
2008 2012
450
938€m €m
Net Income Fresenius Group andFresenius Medical Care
Fresenius Medical Care
Fresenius Group
Barclays European Select Conference 2013, Fresenius SE & Co. KGaA, Investor Relations © Copyright, June 20 − 21, 2013

Page 10
14%
9%
2%
Europe Asia-Pacific North America
Fresenius Kabi: Update Q1/13
Barclays European Select Conference 2013, Fresenius SE & Co. KGaA, Investor Relations © Copyright, June 20 − 21, 2013
- Excellent start into the year- 7% organic sales growth; 20.0% EBIT margin excl. Fenwal
- Europe- 2% organic growth on shortage-inflated Q1/12 base;
Clinical Nutrition growth expected to accelerate
- I.V. drug launch schedule backloaded in 2013, frontloaded in 2012
- Expect mid single-digit growth in FY/2013
- Asia-Pacific- 9% organic growth on top of strongest 2012 quarter
- Back to double-digit growth in FY/2013
- North America- 14% organic growth – strong start
- Expect to maintain majority Propofol market share in 2013
- Shortage situation unchanged – gradual easing assumed
- FY/2013: expect low to mid single-digit percent sales decrease – fully baked into Kabi 2013 guidance
Organic Sales Growth
Q1/2013 FY/2013 guidance

Page 11
Fresenius Helios: Update Q1/13
Barclays European Select Conference 2013, Fresenius SE & Co. KGaA, Investor Relations © Copyright, June 20 − 21, 2013
- 5% organic sales growth – at upper end of guidance
- Excellent EBIT margin increase to 11.2% (+140 bps) in established clinics
- Wage contracts in place for >80% of HELIOS employees until end of 2013 and for ~40% until end of 2014; average increase of <3% p.a. fully in line with budget assumptions
- Hospital transaction market – awarded/acquired revenue YTD: ~€200 m; projects ~€120 million in revenue pending
HELIOS Endo Klinik Hamburg

Page 12
Fresenius Vamed: Update Q1/13
- Excellent quarter with 10% organic sales growth; EBIT fully in line with expectations
- 15% organic sales growth in service business, now serving 355 health care facilities with >100,000 beds
- Update on Italian market expansion – 5 new contracts for maintenance/technical management of medical equipment, serving ~3,800 hospital beds
- Further expansion into CIS countries- €48 million turnkey project in Moscow
- €11 million medical equipment contracts in Turkmenistan
Barclays European Select Conference 2013, Fresenius SE & Co. KGaA, Investor Relations © Copyright, June 20 − 21, 2013
International Diagnostic Center, Moscow

Page 13
Fresenius Group: Financial Outlook by Business Segment Fully Confirmed
FreseniusKabi
Sales growth ccSales growth organic
EBIT margin excl. Fenwal
EBIT margin incl. Fenwal
12% – 14%3% – 5%19% – 20%18% – 19%
FreseniusHelios
Sales growth organic
EBIT 3% – 5%€360 – €380 m
FreseniusVamed
Sales growth EBIT growth
8% – 12%5% – 10%
Barclays European Select Conference 2013, Fresenius SE & Co. KGaA, Investor Relations © Copyright, June 20 − 21, 2013
Page 14
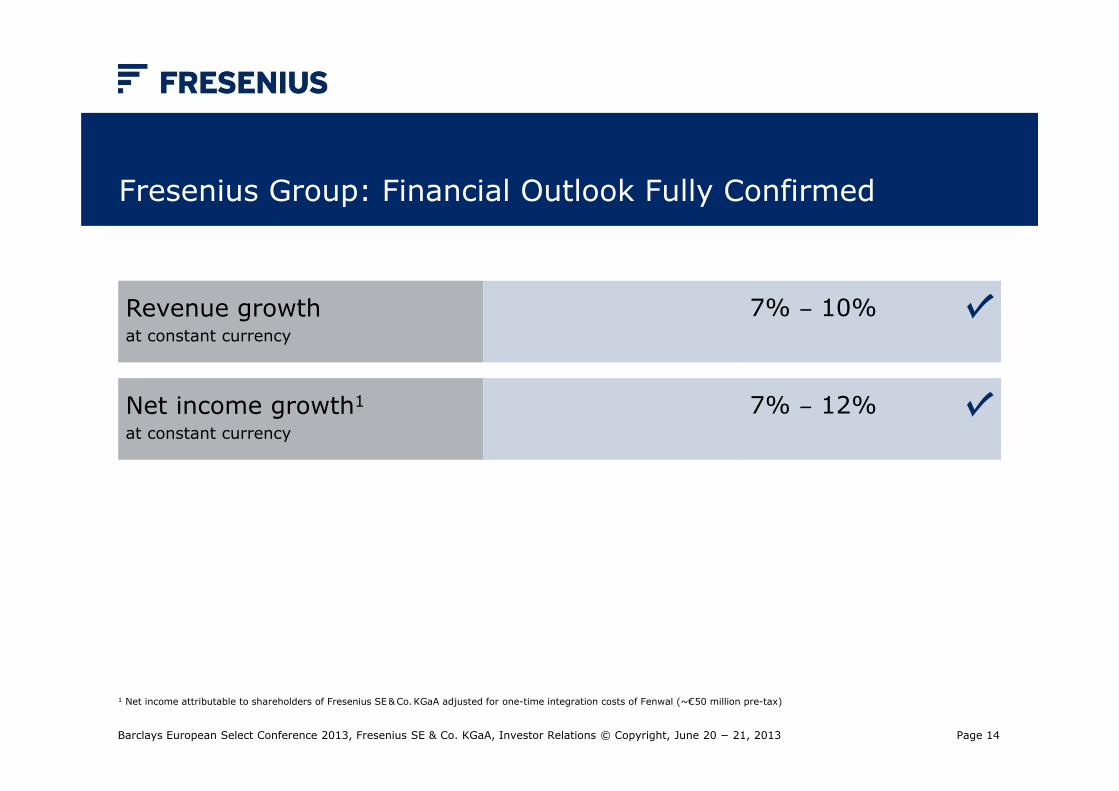
Fresenius Group: Financial Outlook Fully Confirmed
Revenue growthat constant currency
7% ‒ 10%
Net income growth1
at constant currency
7% ‒ 12%
1 Net income attributable to shareholders of Fresenius SE & Co. KGaA adjusted for one-time integration costs of Fenwal (~€ 50 million pre-tax)
Barclays European Select Conference 2013, Fresenius SE & Co. KGaA, Investor Relations © Copyright, June 20 − 21, 2013

Page 15
Untertitel der Kapiteltrennseite
Maximal zweizeilig, 18 pt
Barclays European Select Conference 2013, Fresenius SE & Co. KGaA, Investor Relations © Copyright, June 20 − 21, 2013
Attachments

Page 16
Fresenius Group: Profit and Loss Statement
Barclays European Select Conference 2013, Fresenius SE & Co. KGaA, Investor Relations © Copyright, June 20 − 21, 2013
€m Q1/13 Q1/12 Growth Q1/13 YoYactualrates
constantrates
Sales
EBIT1
Net interest
Income taxes
Net income2
4,890
696
-163
-155
224
4,419
661
-147
-156
200
11%
5%
-11%
1%
12%
12%
6%
-12%
0%
12%
1 2013 adjusted for one-time integration costs of Fenwal of €7 million 2 Net income attributable to shareholders of Fresenius SE & Co. KGaA, 2013 adjusted for one-time integration costs of Fenwal of €5 million, 2012 adjusted for a non-taxable
investment gain of €30 million at Fresenius Medical Care.

Page 17
5.24.84.74.7
6.26.2
5.6
4.54.2
4.8
3
4
5
6
7
2003 2004 2005 2006 2007 2008 2009 2010 2011 2012
7.7
5.7
7.4
6.3
2.7
5.6
4.5
5.76.4
7.8
2
4
6
8
10
2003 2004 2005 2006 2007 2008 2009 2010 2011 2012
Fresenius Group: Consistent Cash Generation and Proven Track Record of Deleveraging
12.6
10.3
12.0
11.0
8.7
11.4
9.89.9
11.711.0
8
9
10
11
12
13
14
2003 2004 2005 2006 2007 2008 2009 2010 2011 2012
%
CFFO margin%
FCF margin (before acquisitions & dividends)
%
Capex in % of sales
2.56
2.832.62
3.01
3.64
2.63
3.00
2.282.24
2.73
2
3
4
2003 2004 2005 2006 2007 2008 2009 2010 2011 2012
Net Debt / EBITDA
Barclays European Select Conference 2013, Fresenius SE & Co. KGaA, Investor Relations © Copyright, June 20 − 21, 2013
Page 18
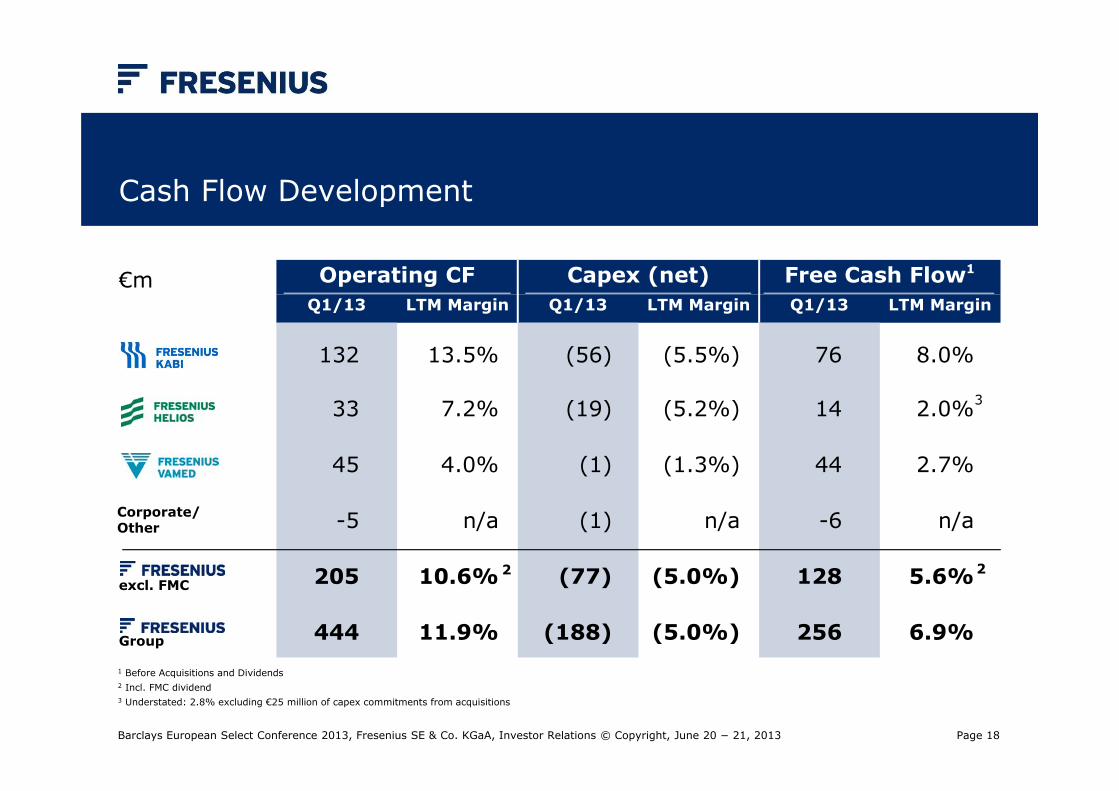
Cash Flow Development
Barclays European Select Conference 2013, Fresenius SE & Co. KGaA, Investor Relations © Copyright, June 20 − 21, 2013
€m Operating CF Capex (net) Free Cash Flow1
Q1/13 LTM Margin Q1/13 LTM Margin Q1/13 LTM Margin
132
33
45
-5
205
444
13.5%
7.2%
4.0%
n/a
10.6%
11.9%
(56)
(19)
(1)
(1)
(77)
(188)
(5.5%)
(5.2%)
(1.3%)
n/a
(5.0%)
(5.0%)
76
14
44
-6
128
256
8.0%
2.0%
2.7%
n/a
5.6%
6.9%
Corporate/Other
excl. FMC
1 Before Acquisitions and Dividends2 Incl. FMC dividend3 Understated: 2.8% excluding €25 million of capex commitments from acquisitions
Group
2 2
3

Page 19
Fresenius Group: Debt and Interest Ratios
Barclays European Select Conference 2013, Fresenius SE & Co. KGaA, Investor Relations © Copyright, June 20 − 21, 2013
1 Pro forma Fenwal2 Adjusted for one-time costs (€6 million) related to the offer to the shareholders of RHÖN-KLINIKUM AG, for other one-time costs (€86 million) at Fresenius Medical Care as well as
one-time integration costs (€7 million) at Fenwal3 Pro forma including Liberty Dialysis Holdings, Inc., Damp Group, and Fenwal4 Adjusted for one-time costs (€6 million) related to the offer to the shareholders of RHÖN-KLINIKUM AG and for other one-time costs (€86 million) at Fresenius Medical Care.
Mar 31,2013
Dec 31,2012
Debt (€m)thereof 54% US$denominated
11,024 11,028
Net debt (€m) 10,174 10,143
Net debt/EBITDA 2.571,2 2.563,4
EBITDA/Interest 5.5 5.8
Net debt/EBITDA
2.562.60
2.53
2.65
2.95
2.722.65
2.75
2.63
2.63
3.07
3.51
YE/0
8YE
/09
YE/1
0Q1/
11Q2/
11Q3/
11YE
/11
Q1/12
Q2/12
Q3/12
YE/1
2Q1/
13
Target 2013YE:
2.5 to 3.0(lower end)
at actualat identical FX-rates

Page 20
€m Q1/13 Q1/12 OrganicGrowth
Infusion Therapy
I.V. Drugs
Clinical Nutrition
Medical Devices/Transfusion Technology
250
460
326
224
246
410
316
120
5%
13%
5%
-1%
Total sales 1,260 1,092 7%
Fresenius Kabi: Strong Organic Sales Growth
Barclays European Select Conference 2013, Fresenius SE & Co. KGaA, Investor Relations © Copyright, June 20 − 21, 2013

Page 21
Fresenius Kabi: Strong Organic Sales Growth
Barclays European Select Conference 2013, Fresenius SE & Co. KGaA, Investor Relations © Copyright, June 20 − 21, 2013
€m Q1/13 Q1/12 OrganicGrowth
Europe
North America
Asia-Pacific
Latin America/Africa
517
401
223
119
487
292
199
114
2%
14%
9%
9%
Total sales 1,260 1,092 7%

Page 22
€m Q1/13 Q1/12 Growth
EuropeMargin
North AmericaMargin
Asia-Pacific/Latin America/AfricaMargin
Corporate and Corporate R&D
8416.2%
15438.4%
6519.0%
-66
9619.7%
11439.0%
5818.5%
-53
-13%
35%
12%
-25%
Total EBIT (incl. Fenwal)Margin
23718.8%
21519.7%
10%
Total EBIT (excl. Fenwal)Margin
23120.0%
21519.7%
7%
Fresenius Kabi: EBIT Margin at Upper End of Guidance
Barclays European Select Conference 2013, Fresenius SE & Co. KGaA, Investor Relations © Copyright, June 20 − 21, 2013

Page 23
Fresenius Helios: Excellent Sales and EBIT Growth
Barclays European Select Conference 2013, Fresenius SE & Co. KGaA, Investor Relations © Copyright, June 20 − 21, 2013
€m Q1/13 Q1/12 Growth
Total sales
EBIT
Established clinic portfolioMargin
Acquisitions / Divestitures(consolidation / deconsolidation <1 yr)
841
8311.2%
4
710
699.8%
-1
18%
20%
Total EBIT
Margin
87
10.3%
68
9.6%
28%
2012 adjusted for post-acute care clinic Zihlschlacht – transferred to Fresenius Vamed.

Page 24
Fresenius Helios: 2012 Clinic Development Plan
Years in portfolio<1 1 2 3 4 5 >5 Total
No. of clinics 6 2 1 - 6 4 31 50
Revenue (€m) 227 155 36 - 192 294 1,910 2,814
Target
EBITDA margin (%) - 3.0 6.0 9.0 12.0 15.0 15.0
EBITDA (€m) - 4.7 2.2 - 23.0 44.1 286.5 360.5
Reported
EBITDA margin (%) - -3.3 7.4 - 11.0 15.4 17.5 14.1
EBITDA (€m) -1.1 -5.2 2.7 - 21.2 45.1 334.8 397.5
No. of clinics > target - 1 1 - 3 3 19 27
No. of clinics < target - 1 - - 3 1 12 17
IFRS
Barclays European Select Conference 2013, Fresenius SE & Co. KGaA, Investor Relations © Copyright, June 20 − 21, 2013

Page 25
Fresenius Vamed: Excellent Sales Growth, EBIT Fully in Line with Expectations
Barclays European Select Conference 2013, Fresenius SE & Co. KGaA, Investor Relations © Copyright, June 20 − 21, 2013
€m Q1/13 Q1/12 Growth
Project business
Service business
82
102
77
72
6%
42%
Total sales
Total EBIT
Margin
Order intake1
Order backlog1
184
5
2.7%
93
998
149
5
3.4%
104
987
23%
0%
-11%
1%
1 Project business only2 December 31, 2012
2012 adjusted for post-acute care clinic Zihlschlacht
2

Page 26
Share Information
Barclays European Select Conference 2013, Fresenius SE & Co. KGaA, Investor Relations © Copyright, June 20 − 21, 2013
Share key factsNumber of shares1 178,307,893WKN / ISIN 578560 / DE0005785604Ticker symbol FREBloomberg symbol FRE GRReuters symbol FREG.de
ADR key factsRatio 8 ADRs = 1 ordinary shareADR CUSIP / ISIN 35804M105 / US35804M1053Ticker symbol FSNUYExchange OTC-marketStructure Sponsored Level I ADRDepositary bank Deutsche Bank1 As of April 30, 2013
Page 27
Financial Calendar
Barclays European Select Conference 2013, Fresenius SE & Co. KGaA, Investor Relations © Copyright, June 20 − 21, 2013
30.07.2013 Report on 1st half 2013
05.11.2013 Report on 1st – 3rd quarter 2013
Contact
Birgit Grund SVP Investor Relations Fresenius SE & Co. KGaA
Telephone: +49 6172 608-2485e-mail: [email protected]
For further information and current news: http://www.fresenius.com