
Freezability Biomarkers in Boar Seminal Plasma Metabolomic ...
22
Page 1/22 Metabolomic Analysis and Identication of Sperm Freezability Biomarkers in Boar Seminal Plasma Yu-ting Zhang Northeast Agricultural University Han-lin Liang Northeast Agricultural University Yan Liu Northeast Agricultural University Meng Zhao Northeast Agricultural University Qian-qian Xu Northeast Agricultural University Zhong-hua Liu Northeast Agricultural University Xiao-gang Weng ( [email protected] ) Northeast Agricultural University https://orcid.org/0000-0002-7474-8447 Research Keywords: Pig, Sperm, Freezability, Seminal plasma, Metabolome Posted Date: April 14th, 2021 DOI: https://doi.org/10.21203/rs.3.rs-402774/v1 License: This work is licensed under a Creative Commons Attribution 4.0 International License. Read Full License
Transcript of Freezability Biomarkers in Boar Seminal Plasma Metabolomic ...

Page 1/22
Metabolomic Analysis and Identi�cation of SpermFreezability Biomarkers in Boar Seminal PlasmaYu-ting Zhang
Northeast Agricultural UniversityHan-lin Liang
Northeast Agricultural UniversityYan Liu
Northeast Agricultural UniversityMeng Zhao
Northeast Agricultural UniversityQian-qian Xu
Northeast Agricultural UniversityZhong-hua Liu
Northeast Agricultural UniversityXiao-gang Weng ( [email protected] )
Northeast Agricultural University https://orcid.org/0000-0002-7474-8447
Research
Keywords: Pig, Sperm, Freezability, Seminal plasma, Metabolome
Posted Date: April 14th, 2021
DOI: https://doi.org/10.21203/rs.3.rs-402774/v1
License: This work is licensed under a Creative Commons Attribution 4.0 International License. Read Full License
Page 2/22
AbstractBackground: In the freezing process of boar sperm, there are obvious differences of freezability betweenindividuals. Studies suggest that speci�c freezability markers might be useful in good (GFE) and poorfreezabitity ejaculates (PFE) selection prior to cryopreservation. Some potential markers of boar spermfreezability have been found from spermatozoa, little attention has been paid to seminal plasma. Theseminal plasma is composed of secretions from testis, epididymis, and accessory sex glands, and theexposure of spermatozoa to small molecules such as metabolites can affect the sperm functions.However, details and signi�cance of the seminal plasma metabolome related to boar sperm freezabilityare unknown. Therefore, the main aim of this study was to explore the difference in the metabolic level ofseminal plasma between boars with differential freezability, and to explore the biomarkers of semenfreezing tolerance.
Results: A total of 953 metabolites were identi�ed in boar semen plasma by UHPLC-qTOF-MS analysis,and 50 metabolites show signi�cant change between GFE group and PFE group. Further, twelve metabolites were subjected to metabolic target analysis and three metabolites (D-Aspartic acid, N-Acetyl-L-glutamate (NAG), and Inosine) show differences.
Conclusions: There is signi�cant differece on metabolome of seminal plasma between GFE and PFEindividuals. The D-Aspartic acid, NAG, and Inosine in seminal plasma may be potential markers forassessing sperm cryopreservation resistance in boars.
BackgroundArti�cial insemination has been widely used in pig production worldwide. However, frozen–thawed boarsemen account for less than 1% of the semen for insemination [1]. On one hand, boar spermatozoa ingenerally presents low freezability because of their high cold shock sensitivity[2, 3]. On the other hand, thequality of frozen-thawed boar semen shows strong variability associated with differences in freezabilitybetween individuals[4]. Therefore, it is meaningful to distinguish high and low freezability individualsbefore cryopreservation procedures, and choose the high freezability individuals for cryopreservation toimprove the e�ciency of arti�cial insemination utilizing post-thawed sperm. To solve this issue,researchers are engaged in a lot of work to distinguish good (GFE) and poor freezabitity ejaculates (PFE)[5–7].
Previous researches on the boar ejaculate freezability biomarkers mainly focused on proteomics.Numbers of proteins from sperm or seminal plasma, such as heat-shock protein 90 (HSP90AA1)[8],acrosin-binding protein (ACRBP)[9], triosephosphate isomerase (TPI)[9], and �bronectin 1 (FN1) [10] havebeen reported as markers for predicting boar ejaculate freezability[11]. In addition, a study demonstratedthat genomic differences existed between good and poor freezers in the sequences of polymorphismrestriction fragments of 16 candidate genetic markers[6]. Other freezability markers include patterns of
Page 3/22
sperm motile subpopulations in extended semen[12], speci�c kinetic parameters evaluated at the coolingstep[13], and acrosin activity [14, 15].
Sperm freezability is a complex phenotype, and it cannot be accurately predicted just based onconventional parameters [13, 16]. Current knowledge implies that the seminal plasma is much more thana nutrient medium. The seminal plasma is composed of secretions from testis, epididymis, andaccessory sex glands. Seminal plasma contains a variety of substances, such as proteins, ions, andmetabolites including amino acids, lipids, nucleosides, minerals, electrolytes, and steroid hormones[17,18]. As metabolites are the �nal products of metabolism, the changes in the composition and content ofwhich can re�ect the state of sperm and individual metabolic timely[19]. Recent studies report thatmetabolites involve in sperm energy production, motility, protection, pH control and regulation ofmetabolic activity [20]. Furthermore, metabolites in seminal plasma may affect downstream andcomplementary changes in gene/protein expression[21]. Thus, we hypothesized that some particularmetabolites in seminal plasma could be considered as markers of sperm freezability.
Therefore, the aims of this study were to compare metabolome of seminal plasma between GFE and PFE,and to identify potential metabolites as biomarkers of freezability. We used an Ultra-high PerformanceLiquid Chromatography-Quadrupole Time-of-Flight Mass Spectrometry (UHPLC-qTOF-MS) basedmetabolomics approach to obtain the metabolic pro�le of seminal plasma from boars with good andpoor sperm freezability. Furthermore, the potential metabolites were con�rmed by targeted metabolomicsanalysis. The �ndings in the present study will provide a new perspective for boar sperm freezabilitypredicting.
Materials And Methods
Sample collection and preparation of seminal plasmaThe boars (n=15) were chosen based on production records during 2-years. All boars were Landraceraised under the same management conditions and received the same nutrition, and they were stalled incommercial herds. Semen was collected using the gloved hand method. The semen collection rhythmwas twice a week and one single ejaculate per boar was used in this study.
After collection, the spermatozoa-rich fraction of each ejaculate (80–100 mL) was �ltered through gauzeand subsequently divided into two aliquots of equal volume. The �rst one was used for seminal plasmaseparation from spermatozoa through centrifugation at 500×g and 4 °C for 30 min. Seminal plasmapreparations were then examined using phase microscopy to ensure no spermatozoa remained. Cleanseminal plasma samples were then stored in liquid nitrogen. The other spermatozoa-rich fraction aliquotwas diluted in Androhep Plus (Minitube, Germany) at 2×10⁸, and then used to cryopreserve.
Cryopreservation and thawing of sperm samples
Page 4/22
Fifteen ejaculates (> 2×10⁸ spermatozoa/mL; > 75% motility) were chosen to cryopreserve. Firstly, thesemen samples were stored at 17 °C to cool, then the semen was centrifuged at 500×g for 10 min. Softsperm pellets were subsequently diluted to 2×10⁹ spermatozoa/mL in Androstar® Cryo Plus (Minitube,Germany) containing 20% egg yolk. Then the spermatozoa were cooled slowly to 5ºC for 5 h andsubsequently diluted to 1 × 10⁹ spermatozoa/mL with freezing medium containing 6% glycerol (Sigma–Aldrich, MO) at 5ºC. Afterward, sperm samples were packed in 0.5 mL labeled plastic straws (Minitube,Germany). The straws were then transferred to a programmable freezer CryoMed 7457 (Thermo Fisher,MA). The cooling ramp was as follows: Wait at 4°C→2°C /min to 2°C→Hold for 1 min at 2°C→35°C /minto -30°C→Hold for 1 min at -30°C→35°C /min to -150°C→ Hold for 4 min at -150°C. The straws were�nally plunged into liquid nitrogen and stored before use.
Assessment of sperm qualitySperm motility parameters obtained were those described by Yeste et al[22]. Sperm motility assessmentwas carried out utilizing a commercial computer assisted sperm analysis (CASA) system (CASAS-QH-III,Tsinghua Tongfang Co., Ltd.). After evaluating three replicates per sample (a minimum of 1000spermatozoa was counted per replicate), the corresponding mean standard error of the mean (SEM) wascalculated.
Sample classi�cation into GFEs and PFEsTo classify seminal plasma samples into two groups (GFEs vs. PFEs), spermatozoa were cryopreservedand thawed and sperm quality assessments were carried out at three different points: pre-freeze,refrigerated semen at 17 °C and frozen–thawed spermatozoa at 30 min post thawing. To distinguishseminal plasma samples between two groups of good (GFE) and poor (PFE) freezability, Boar sperm werecharacterized by the reduced of sperm motility.
Ultra-high Performance Liquid Chromatography-Quadrupole Time-of-Flight Mass Spectrometry (UHPLC-qTOF-MS) data acquisitionAnalysis data was acquired using a UHPLC-high de�nition quadrupole time-of-�ight MS instrument(UHPLC-qTOF SYNAPT G1 HD-MS system, Waters) equipped with TripleTOF 6600 (Q-TOF, AB Sciex). Abinary solvent method consisting of eluent A (25mM NH4Ac and 25mM NH4OH in water pH=9.75) andacetonitrile (B) was carried with elution gradient as follows: 0 min, 95% B; 0.5 min, 95% B; 7 min, 65% B; 8min, 40% B; 9 min, 40% B; 9.1 min, 95% B; 12 min, 95% B, delivered at 0.5mL min-1. The Triple TOF massspectrometer was used for its ability to acquire MS/MS spectra on an information-dependent basis (IDA)during an LC/MS experiment. In this mode, the acquisition software (Analyst TF 1.7, AB Sciex)continuously evaluates the full scan survey MS data as it collects and triggers the acquisition of MS/MSspectra depending on preselected criteria. In each cycle, 12 precursor ions whose intensity greater than
Page 5/22
100 were chosen for fragmentation at collision energy (CE) of 30 V (15 MS/MS events with product ionaccumulation time of 50 msec each). ESI source conditions were set as following: Ion source gas 1 as 60Psi, Ion source gas 2 as 60 Psi, Curtain gas as 35 Psi, source temperature 600°C, Ion Spray VoltageFloating (ISVF) 5000 V or -4000 V in positive or negative modes, respectively.
Multivariate data (MVD) analysisUHPLC-qTOF-MS data was analyzed using SIMCA 13 software (Umetrics, Umea, Sweden) and interactiveXCMS (version 3.2). Before exporting the data to SIMCA for visualization and biomarker selection, the LC-MS raw data was �rstly processed (noise elimination, peak picking, alignment and retention timecorrection) with MarkerLynxTM software (version 4.1, Waters Corporation, Milford, MA, USA). Thefollowing parameters were used for data processing: retention time (Rt) range of 2.5-11 min, mass rangeof 100-1000 Da, mass tolerance of 0.02 Da, Rt window of 0.2 min. The data matrix obtained fromMarkerLynxTM processing was then exported into SIMCA 13 for PCA and OPLS-DA analyses. The datawere Pareto-scaled and no transformation was used. For the XCMS analyses, the MassLynxTM raw data(.raw) were converted to NetCDF format using the DataBridge application in MassLynxTM (Waters, MA,USA). The converted data (NetCDF format) were then use XCMS for processing, statistical analysis,visualization and biomarker identi�cation as described by [23]. The parameters were as follows: featuredetection set as centWave method, minimum peak width = 5, maximum peak width = 20, retention timecorrection set as Obiwarp method, Profstep = 1, alignment set as m/z width = 0.015, min fraction = 0.5,bw = 5, and statistics set as statistical test = unpaired parametric t-test (Welch t-test), paired t-test andposthoc analysis with the threshold p-value = 0.01 and fold-change = 1.5.
Relative distribution and statistical analysisTotal intensity values (integrated area under the peak) from MarkerLynxTM XS software (WatersCorporation, Manchester, UK) pre-processed data matrixes were used for univariate statistical analyses.SPSS software (IBM SPSS Statistics for Windows, Version 22. Armonk, NY: IBM Corp.) was used for suchdescriptive statistics. Here, Univariate Analysis of Variance (ANOVA) was performed as 2-tailed completerandomized blocks, and used to compare the nontreated with the different time points of treated cells.ANOVA was followed by the Bonferroni post hoc test where differences between the means wereconsidered signi�cant at p < 0.05, and indicated in the Box-and-Whiskers plots.
Targeted metabolomics analysisTargeted metabolomics analysis was performed using QTRAP 5500 (AB SCIEX), The targetmetabolomics metabolite extraction method is as same as UHPLC-qTOF-MS data acquisition. Weperform absolute quanti�cation of candidate differential metabolites based on standard products, andthe standard products are purchased from Yuanye Biological Technology Co., Ltd.
Page 6/22
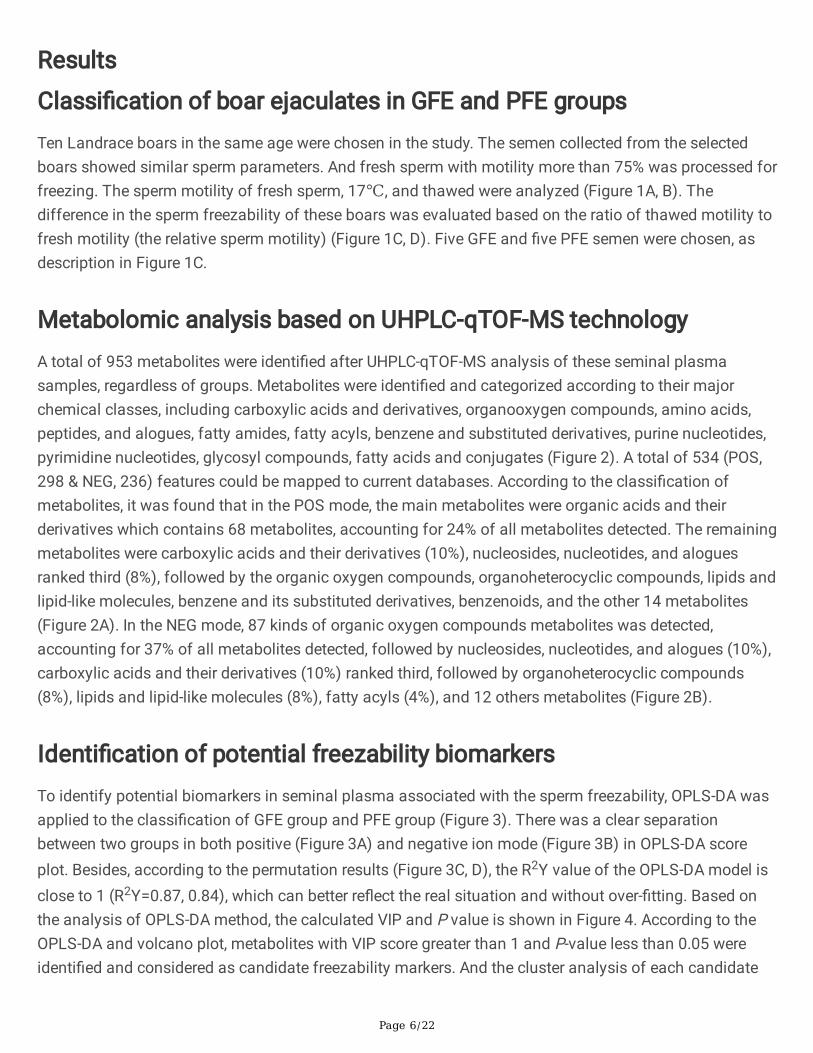
Results
Classi�cation of boar ejaculates in GFE and PFE groupsTen Landrace boars in the same age were chosen in the study. The semen collected from the selectedboars showed similar sperm parameters. And fresh sperm with motility more than 75% was processed forfreezing. The sperm motility of fresh sperm, 17℃, and thawed were analyzed (Figure 1A, B). Thedifference in the sperm freezability of these boars was evaluated based on the ratio of thawed motility tofresh motility (the relative sperm motility) (Figure 1C, D). Five GFE and �ve PFE semen were chosen, asdescription in Figure 1C.
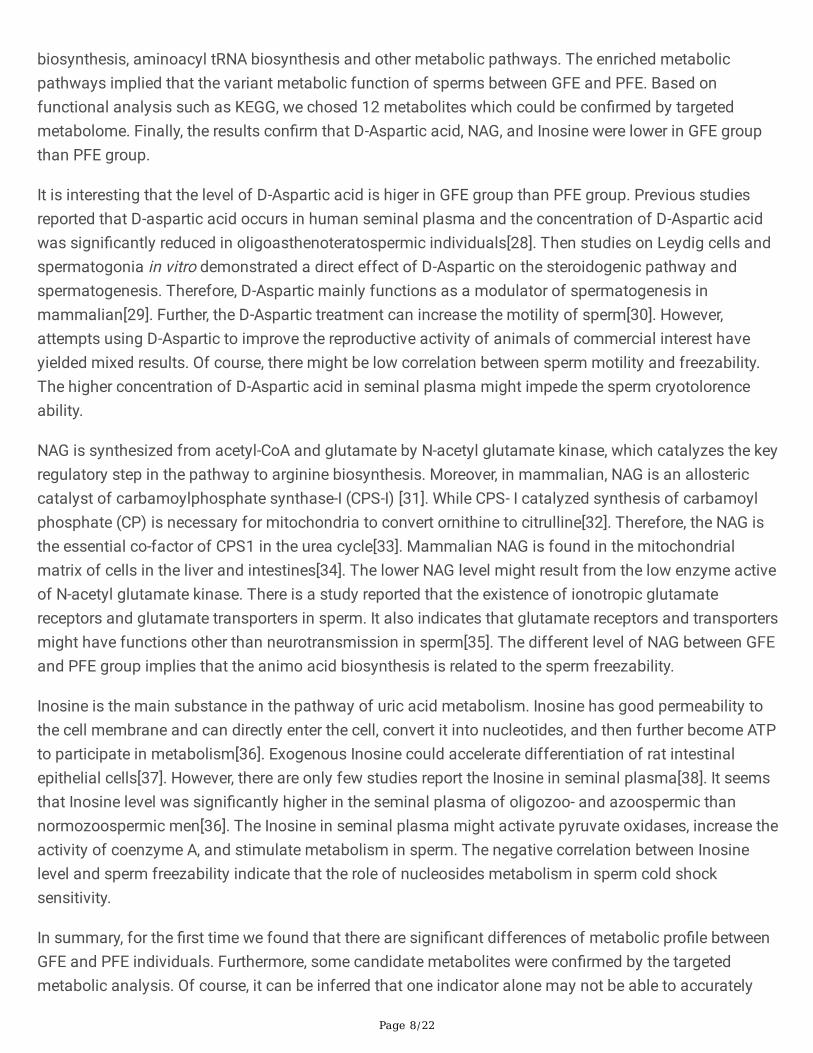
Metabolomic analysis based on UHPLC-qTOF-MS technologyA total of 953 metabolites were identi�ed after UHPLC-qTOF-MS analysis of these seminal plasmasamples, regardless of groups. Metabolites were identi�ed and categorized according to their majorchemical classes, including carboxylic acids and derivatives, organooxygen compounds, amino acids,peptides, and alogues, fatty amides, fatty acyls, benzene and substituted derivatives, purine nucleotides,pyrimidine nucleotides, glycosyl compounds, fatty acids and conjugates (Figure 2). A total of 534 (POS,298 & NEG, 236) features could be mapped to current databases. According to the classi�cation ofmetabolites, it was found that in the POS mode, the main metabolites were organic acids and theirderivatives which contains 68 metabolites, accounting for 24% of all metabolites detected. The remainingmetabolites were carboxylic acids and their derivatives (10%), nucleosides, nucleotides, and aloguesranked third (8%), followed by the organic oxygen compounds, organoheterocyclic compounds, lipids andlipid-like molecules, benzene and its substituted derivatives, benzenoids, and the other 14 metabolites(Figure 2A). In the NEG mode, 87 kinds of organic oxygen compounds metabolites was detected,accounting for 37% of all metabolites detected, followed by nucleosides, nucleotides, and alogues (10%),carboxylic acids and their derivatives (10%) ranked third, followed by organoheterocyclic compounds(8%), lipids and lipid-like molecules (8%), fatty acyls (4%), and 12 others metabolites (Figure 2B).
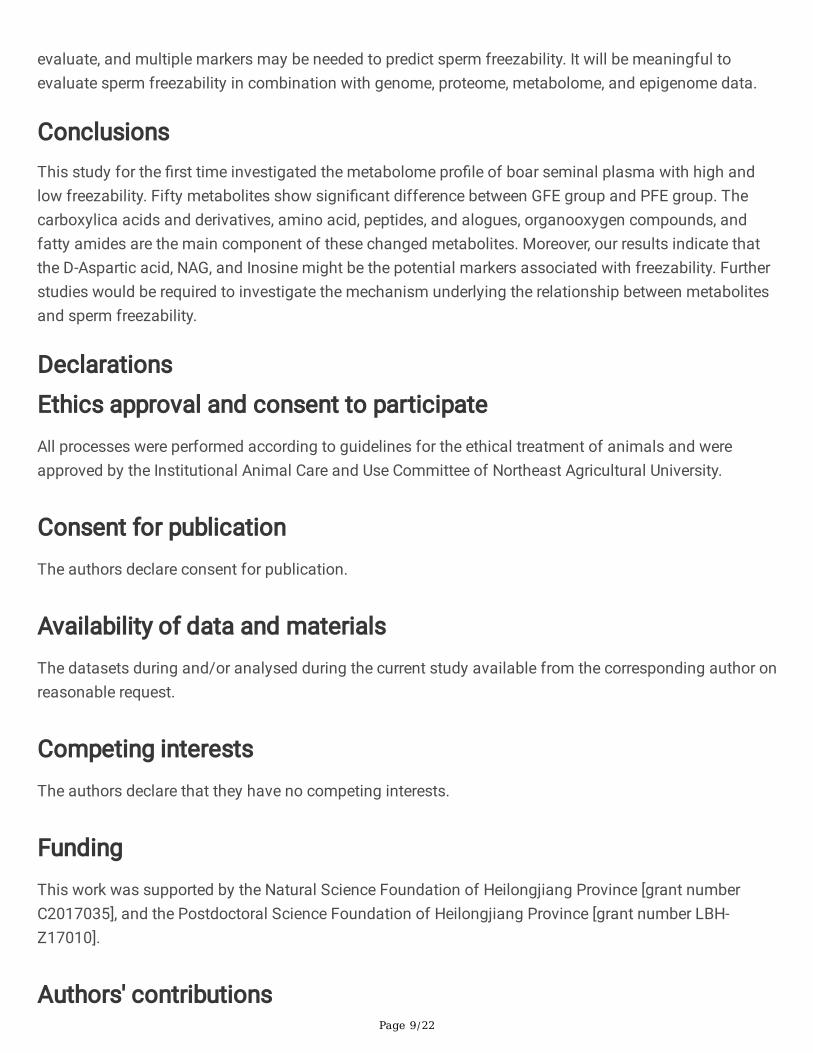
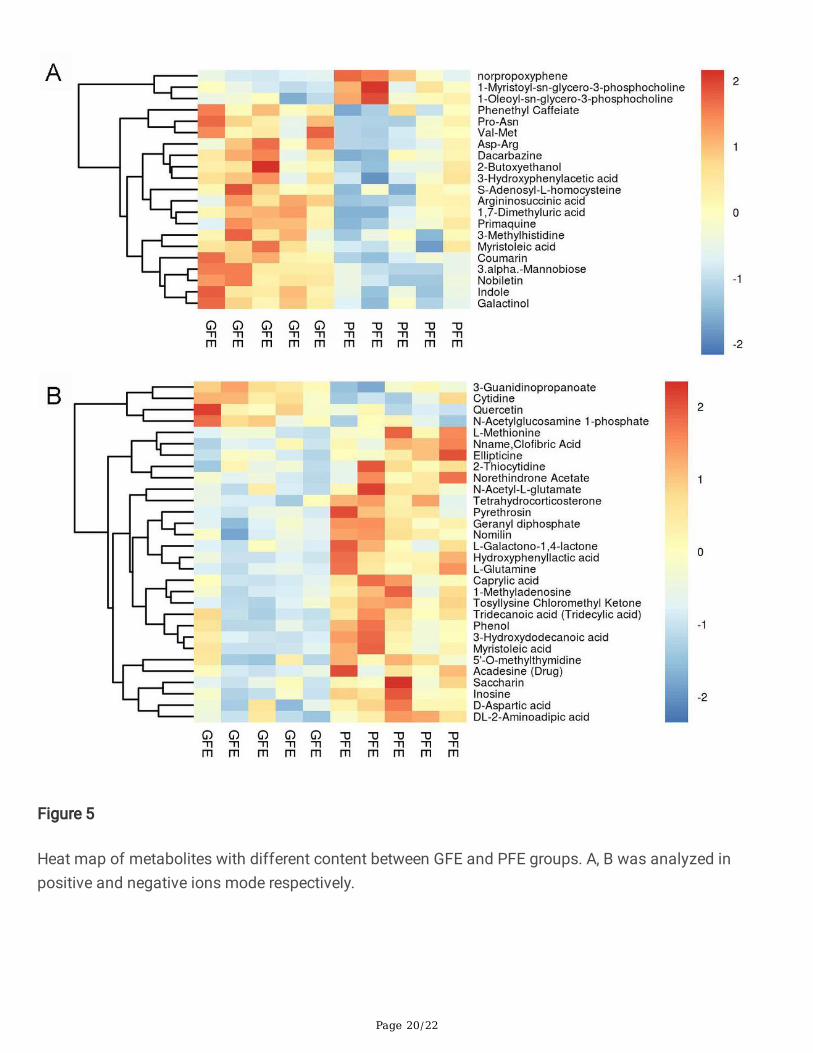
Identi�cation of potential freezability biomarkersTo identify potential biomarkers in seminal plasma associated with the sperm freezability, OPLS-DA wasapplied to the classi�cation of GFE group and PFE group (Figure 3). There was a clear separationbetween two groups in both positive (Figure 3A) and negative ion mode (Figure 3B) in OPLS-DA scoreplot. Besides, according to the permutation results (Figure 3C, D), the R2Y value of the OPLS-DA model isclose to 1 (R2Y=0.87, 0.84), which can better re�ect the real situation and without over-�tting. Based onthe analysis of OPLS-DA method, the calculated VIP and P value is shown in Figure 4. According to theOPLS-DA and volcano plot, metabolites with VIP score greater than 1 and P-value less than 0.05 wereidenti�ed and considered as candidate freezability markers. And the cluster analysis of each candidate

Page 7/22
metabolite is shown in the Figure 5A, B. Finally, A total of 50 metabolites show signi�cant differencebetween GFE group and PFE group (Table 1, 2).
Pathway analysis of metabolitesWe analyzed these metabolites by KEGG pathways analysis of the differential metabolites pathway(Table 3). These differential metabolites were mainly enriched in amino acids biosynthetic metabolicpathways such as alanine, aspartic acid, glutamic acid, arginine, proline, cysteine, and methioninebiosynthetic metabolic pathways, some of the metabolites are enriched in purine metabolism, pyrimidinemetabolism, terpenoid backbone biosynthesis, aminoacyl tRNA biosynthesis and other metabolicpathways (Figure 6A, B).
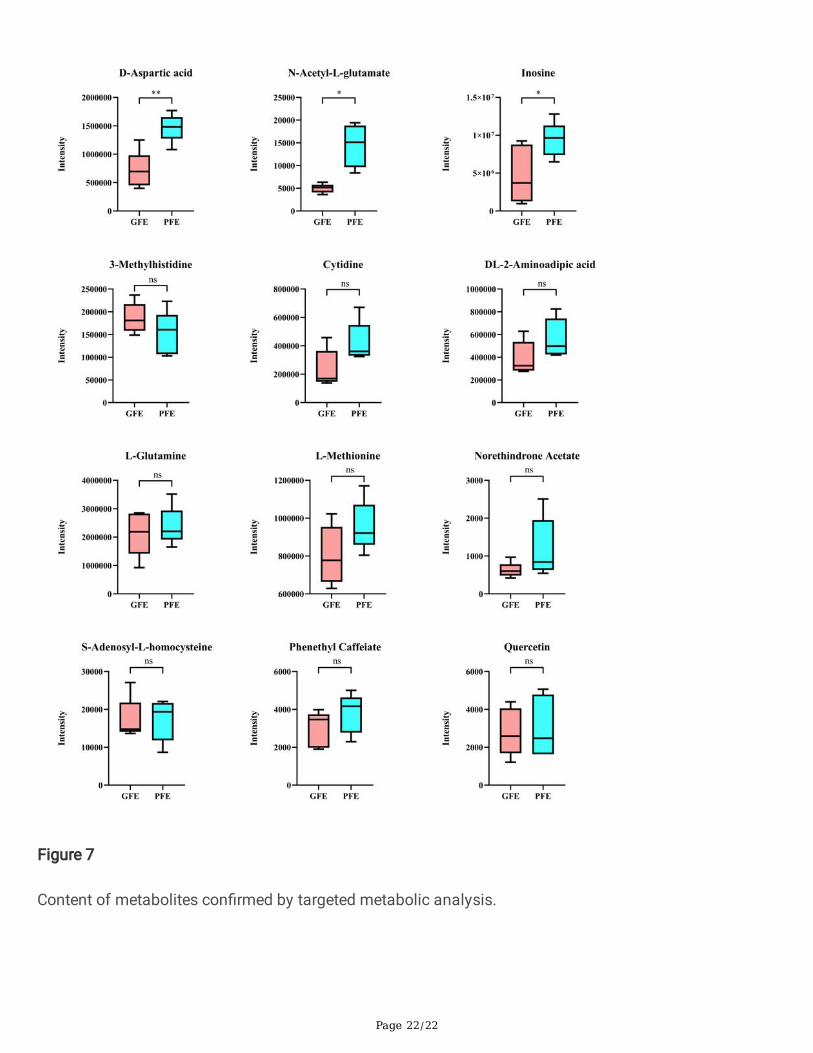
Con�rmation of freezability biomarkers by targeted metabolicanalysisAmong the 50 candidate metabolites obtained from the above analysis, 3-Methylhistidine (P = 0.036),Phenethyl Caffeiate (P = 0.049), S-Adenosyl-L-homocysteine (P = 0.049), D-Aspartic acid (P = 0.031), L-Methionine (P = 0.018), DL-2-Aminoadipic acid (P = 0.014), L-Glutamine (P = 0.009), N-Acetyl-L-glutamate(NAG) (P = 0.009), Cytidine (P = 0.023), Inosine (P = 0.012), Quercetin (P = 0.034), and NorethindroneAcetate (P = 0.024) were chosen and further veri�ed by targeted metabolism. The result reveals that D-Aspartic acid, NAG, and Inosine show signi�cant difference between GFE and PFE (P < 0.05) (Figure 7).
DiscussionCryopreservation of sperm is important for preservation of the boar sperm. In general, 40%-50% of thesperm population can not survive after cryopreservation process, even when “optimized” cooling/thawingprotocols are used[16, 24, 25]. There is a considerable variability between and within ejaculates in theirability to withstand cryopreservation procedures. Mammalian seminal plasma is mainly formed bysecretions of the epididymis and accessory sex glands[26]. Seminal plasma contains large spectra ofmetabolites and the current concept states that seminal plasma can modulate sperm function.Previously, metabolites have been identi�ed in the bull and boar seminal plasma and attempts weremade for exploring the candidate biomarker of fertility[27]. The current study aimed to �nd a speci�cmetabolomics signature in the seminal plasma of high freezability boars. Our study is in fact the �rst tocompare the seminal plasma metabolome of boars between GFE and PFE. This model gives a globalview of the metabolites in boar seminal plasma with high freezability and low freezability. Moreover, wecon�rmed the candidate metabolite biomarkers utilizing targeted metabolome method. In general, themain compounds in boar seminal plasma in the present study were carboxylic acids and derivatives,organonitrogen compounds, amino acids, peptides, and their alogues, fatty acyls, purine nucleosides,pyrimidine nucleosides, fatty acids and their conjugates. The changed 50 metabolites enriched in aminoacids biosynthetic metabolic pathways, purine metabolism, pyrimidine metabolism, terpenoid backbone
Page 8/22
biosynthesis, aminoacyl tRNA biosynthesis and other metabolic pathways. The enriched metabolicpathways implied that the variant metabolic function of sperms between GFE and PFE. Based onfunctional analysis such as KEGG, we chosed 12 metabolites which could be con�rmed by targetedmetabolome. Finally, the results con�rm that D-Aspartic acid, NAG, and Inosine were lower in GFE groupthan PFE group.
It is interesting that the level of D-Aspartic acid is higer in GFE group than PFE group. Previous studiesreported that D-aspartic acid occurs in human seminal plasma and the concentration of D-Aspartic acidwas signi�cantly reduced in oligoasthenoteratospermic individuals[28]. Then studies on Leydig cells andspermatogonia in vitro demonstrated a direct effect of D-Aspartic on the steroidogenic pathway andspermatogenesis. Therefore, D-Aspartic mainly functions as a modulator of spermatogenesis inmammalian[29]. Further, the D-Aspartic treatment can increase the motility of sperm[30]. However,attempts using D-Aspartic to improve the reproductive activity of animals of commercial interest haveyielded mixed results. Of course, there might be low correlation between sperm motility and freezability.The higher concentration of D-Aspartic acid in seminal plasma might impede the sperm cryotolorenceability.
NAG is synthesized from acetyl-CoA and glutamate by N-acetyl glutamate kinase, which catalyzes the keyregulatory step in the pathway to arginine biosynthesis. Moreover, in mammalian, NAG is an allostericcatalyst of carbamoylphosphate synthase-I (CPS-I) [31]. While CPS- I catalyzed synthesis of carbamoylphosphate (CP) is necessary for mitochondria to convert ornithine to citrulline[32]. Therefore, the NAG isthe essential co-factor of CPS1 in the urea cycle[33]. Mammalian NAG is found in the mitochondrialmatrix of cells in the liver and intestines[34]. The lower NAG level might result from the low enzyme activeof N-acetyl glutamate kinase. There is a study reported that the existence of ionotropic glutamatereceptors and glutamate transporters in sperm. It also indicates that glutamate receptors and transportersmight have functions other than neurotransmission in sperm[35]. The different level of NAG between GFEand PFE group implies that the animo acid biosynthesis is related to the sperm freezability.
Inosine is the main substance in the pathway of uric acid metabolism. Inosine has good permeability tothe cell membrane and can directly enter the cell, convert it into nucleotides, and then further become ATPto participate in metabolism[36]. Exogenous Inosine could accelerate differentiation of rat intestinalepithelial cells[37]. However, there are only few studies report the Inosine in seminal plasma[38]. It seemsthat Inosine level was signi�cantly higher in the seminal plasma of oligozoo- and azoospermic thannormozoospermic men[36]. The Inosine in seminal plasma might activate pyruvate oxidases, increase theactivity of coenzyme A, and stimulate metabolism in sperm. The negative correlation between Inosinelevel and sperm freezability indicate that the role of nucleosides metabolism in sperm cold shocksensitivity.
In summary, for the �rst time we found that there are signi�cant differences of metabolic pro�le betweenGFE and PFE individuals. Furthermore, some candidate metabolites were con�rmed by the targetedmetabolic analysis. Of course, it can be inferred that one indicator alone may not be able to accurately
Page 9/22
evaluate, and multiple markers may be needed to predict sperm freezability. It will be meaningful toevaluate sperm freezability in combination with genome, proteome, metabolome, and epigenome data.
ConclusionsThis study for the �rst time investigated the metabolome pro�le of boar seminal plasma with high andlow freezability. Fifty metabolites show signi�cant difference between GFE group and PFE group. Thecarboxylica acids and derivatives, amino acid, peptides, and alogues, organooxygen compounds, andfatty amides are the main component of these changed metabolites. Moreover, our results indicate thatthe D-Aspartic acid, NAG, and Inosine might be the potential markers associated with freezability. Furtherstudies would be required to investigate the mechanism underlying the relationship between metabolitesand sperm freezability.
Declarations
Ethics approval and consent to participateAll processes were performed according to guidelines for the ethical treatment of animals and wereapproved by the Institutional Animal Care and Use Committee of Northeast Agricultural University.
Consent for publicationThe authors declare consent for publication.
Availability of data and materialsThe datasets during and/or analysed during the current study available from the corresponding author onreasonable request.
Competing interestsThe authors declare that they have no competing interests.
FundingThis work was supported by the Natural Science Foundation of Heilongjiang Province [grant numberC2017035], and the Postdoctoral Science Foundation of Heilongjiang Province [grant number LBH-Z17010].
Authors' contributions
Page 10/22
Experiments were designed by X.G. Weng, and Z.H. Liu. Data were collected by Y.T. Zhang. Statisticalanalyses were performed by Y.T. Zhang. The manuscript was drafted by X.G. Weng and Y.T. Zhang withinput from all authors.
AcknowledgementsWe thanks to BIOTREE and Shanghai Biopro�le Technology Company Ltd. for assisting in data analysis.
References1. Rodríguez-Gil JE, Estrada E. Arti�cial insemination in boar reproduction. In: Bonet S, Casas I, Holt WV,
Yeste M, editors. Boar Reproduction. Berlin: Heidelberg; 2013. pp. 589–607.
2. Casas I, Flores E. Gene banking: the freezing strategy. In: Bonet S, Casas I, Holt WV, Yeste M, editors.Boar Reproduction. Berlin: Heidelberg; 2013. pp. 551–88.
3. Parks JE, Lynch DV. Lipid composition and thermotropic phase behavior of boar, bull, stallion, androoster sperm membranes. Cryobiology. 1992;29(2):255–66.
4. Yeste M, Estrada E, Casas I, Bonet S, Rodriguez-Gil JE. Good and bad freezability boar ejaculatesdiffer in the integrity of nucleoprotein structure after freeze-thawing but not in ROS levels.Theriogenology. 2013;79(6):929–39.
5. Hernandez M, Ekwall H, Roca J, Vazquez JM, Martinez E, Rodriguez-Martinez H. Cryo-scanningelectron microscopy (Cryo-SEM) of semen frozen in medium-straws from good and sub-standardfreezer AI-boars. Cryobiology. 2007;54(1):63–70.
�. Thurston LM, Siggins K, Mileham AJ, Watson PF, Holt WV. Identi�cation of ampli�ed restrictionfragment length polymorphism markers linked to genes controlling boar sperm viability followingcryopreservation. Biol Reprod. 2002;66(3):545–54.
7. Nikbin S, Panandam JM, Yaakub H, Murugaiyah M, Sazili AQ. Novel SNPs in heat shock protein 70gene and their association with sperm quality traits of Boer goats and Boer crosses. Anim ReprodSci. 2014;146(null):176–81.
�. Casas I, Sancho S, Ballester J, Briz M, Pinart E, Bussalleu E, et al. The HSP90AA1 sperm content andthe prediction of the boar ejaculate freezability. Theriogenology. 2010;74(6):940–50.
9. Vilagran I, Castillo J, Bonet S, Sancho S, Yeste M, Estanyol JM, et al. Acrosin-binding protein (ACRBP)and triosephosphate isomerase (TPI) are good markers to predict boar sperm freezing capacity.Theriogenology. 2013;80(5):443–50.
10. Vilagran I, Yeste M, Sancho S, Castillo J, Oliva R, Bonet S. Comparative analysis of boar seminalplasma proteome from different freezability ejaculates and identi�cation of Fibronectin 1 as spermfreezability marker. Andrology. 2015;3(2):345–56.
11. Liu H, Li XT, Hu B, Deng XY, Zhang L, Lian SZ, et al. Outbreak of severe pseudorabies virus infectionin pig-offal-fed farmed mink in Liaoning Province, China. Arch Virol. 2017;162(3):863–6.

Page 11/22
12. Flores E, Fernández-Novell JM, Pena A, Rodríguez-Gil JE. The degree of resistance to freezing-thawing is related to speci�c changes in the structures of motile sperm subpopulations andmitochondrial activity in boar spermatozoa. Theriogenology. 2009;72(6):784–97.
13. Casas I, Sancho S, Briz M, Pinart E, Bussalleu E, Yeste M, et al. Freezability prediction of boarejaculates assessed by functional sperm parameters and sperm proteins. Theriogenology.2009;72(7):930–48.
14. Estrada E, Rodriguez-Gil JE, Rivera Del Alamo MM, Pena A, Yeste M. Effects of reduced glutathioneon acrosin activity in frozen-thawed boar spermatozoa. Reprod Fertil Dev. 2017;29(2):283–93.
15. Pinart E, Yeste M, Bonet S. Acrosin activity is a good predictor of boar sperm freezability.Theriogenology. 2015;83(9):1525–33.
1�. Yeste M. Recent Advances in Boar Sperm Cryopreservation: State of the Art and Current Perspectives.Reprod Domest Anim. 2015;50(Suppl 2(Supplement S2):71–9.
17. Egea RR, Puchalt NG, Escrivá MM, Varghese AC. OMICS: Current and future perspectives inreproductive medicine and technology. J Hum Reprod Sci. 2014;7(2):73–92.
1�. Cheng YD, Yang X, Deng XH, Zhang XL, Li PC, Tao J, et al. Metabolomics in bladder cancer: asystematic review. Int J Clin Exp Med. 2015;8(7):11052–63.
19. Ugur MR, Dinh T, Hitit M, Kaya A, Topper E, Didion B, et al. Amino Acids of Seminal PlasmaAssociated With Freezability of Bull Sperm. Front Cell Dev Biol. 2019;7:347.
20. Goodson SG, Qiu Y, Sutton KA, Xie G, Jia W, O'Brien DA. Metabolic substrates exhibit differentialeffects on functional parameters of mouse sperm capacitation. Biol Reprod. 2012;87(3):75.
21. Jurewicz J, Radwan M, Sobala W, Ligocka D, Radwan P, Bochenek M, et al. Human urinary phthalatemetabolites level and main semen parameters, sperm chromatin structure, sperm aneuploidy andreproductive hormones. Reprod Toxicol. 2013;42:232–41.
22. Yeste M, Briz M, Pinart E, Sancho S, Garcia-Gil N, Badia E, et al. Boar spermatozoa and prostaglandinF2alpha Quality of boar sperm after the addition of prostaglandin F2alpha to the short-term extenderover cooling time. Anim Reprod Sci. 2008;108(1–2):180–95.
23. Chang Y, Zhang L, Lu X, Zhao C, Zhu Z, Wang F, et al. A simultaneous extraction method formetabolome and lipidome and its application in cry1Ac and sck-transgenic rice leaf treated withinsecticide based on LC–MS analysis. Metabolomics. 2014;10(6):1197–209.
24. Yeste M. Sperm cryopreservation update: Cryodamage, markers, and factors affecting the spermfreezability in pigs. Theriogenology. 2016;85(1):47–64.
25. Grtter LG, Cattaneo L, Marini PE, Kjelland ME, Ferré LB. Recent advances in bovine spermcryopreservation techniques with a focus on sperm post-thaw quality optimization. Reprod DomestAnim. 2019;54(4):655–65.
2�. Sancho S, Vilagran I. The Boar Ejaculate: Sperm Function and Seminal Plasma Analyses. In: Bonet S,Casas I, Holt WV, Yeste M, editors. Boar Reproduction. Berlin: Heidelberg; 2013. pp. 471–516.

Page 12/22
27. Velho ALC, Menezes E, Dinh T, Kaya A, Topper E, Moura AA, et al. Metabolomic markers of fertility inbull seminal plasma. PloS one. 2018;13(4):e0195279.
2�. D'Aniello G, Ronsini S, Guida F, Spinelli P, D'Aniello A. Occurrence of D-aspartic acid in human seminalplasma and spermatozoa: possible role in reproduction. Fertil Steril. 2005;84(5):1444–9.
29. Tomita K, Tanaka H, Kageyama S, Nagasawa M, Wada A, Murai R, et al. The Effect of D-Aspartate onSpermatogenesis in Mouse Testis. Biol Reprod. 2016;94:30.
30. Barbato V, Talevi R, Braun S, Merolla A, Sudhakaran S, Longobardi S, et al. Supplementation of spermmedia with zinc, D-aspartate and co-enzyme Q10 protects bull sperm against exogenous oxidativestress and improves their ability to support embryo development. Zygote. 2017;25(02):168–75.
31. Morizono H, Caldovic L, Shi D, Tuchman M. Mammalian N-acetylglutamate synthase. Mol GenetMetab. 2004;81(Suppl 1):4–11.
32. Tujioka K, Lyou S, Hirano E, Sano A, Hayase K, Yoshida A, et al. Role of N-AcetylglutamateConcentration and Ornithine Transport into Mitochondria in Urea Synthesis of Rats Given Proteins ofDifferent Quality. J Agric Food Chem. 2002;50(25):7467–71.
33. Yu YG, Turner GE, Weiss RL. Acetylglutamate synthase from Neurospora crassa: structure andregulation of expression. Mol Microbiol. 2010;22(3):545–54.
34. Caldovic L, Morizono H, Panglao MG, Gallegos R, Yu X, Shi D, et al. Cloning and expression of thehuman N-acetylglutamate synthase gene. Biochem Biophys Res Commun. 2002;299(4):581–6.
35. Hu JH, Yang N, Ma YH, Jiang J, Zhang JF, Fei J, et al. Identi�cation of Glutamate Receptors andTransporters in Mouse and Human Sperm. J Androl. 2004;25(1):140–6.
3�. Fabiani R, Ronquist G. Abundance of guanine, guanosine, inosine and adenosine in human seminalplasma. Int J Clin Lab Res. 1995;25(1):47–51.
37. Maria Vieites J, Torre Rde L, Ramirez Mdel C, Torres MI, Sanchez-Pozo A, Gil A, et al. Exogenousnucleosides accelerate differentiation of rat intestinal epithelial cells. Br J Nutr. 2008;99(4):732–8.
3�. Gudkov SV, Shtarkman IN, Smirnova VS, Chernikov AV, Bruskov VI. Guanosine and inosine displayantioxidant activity, protect DNA in vitro from oxidative damage induced by reactive oxygen species,and serve as radioprotectors in mice. Radiat Res. 2006;165(5):538–45.
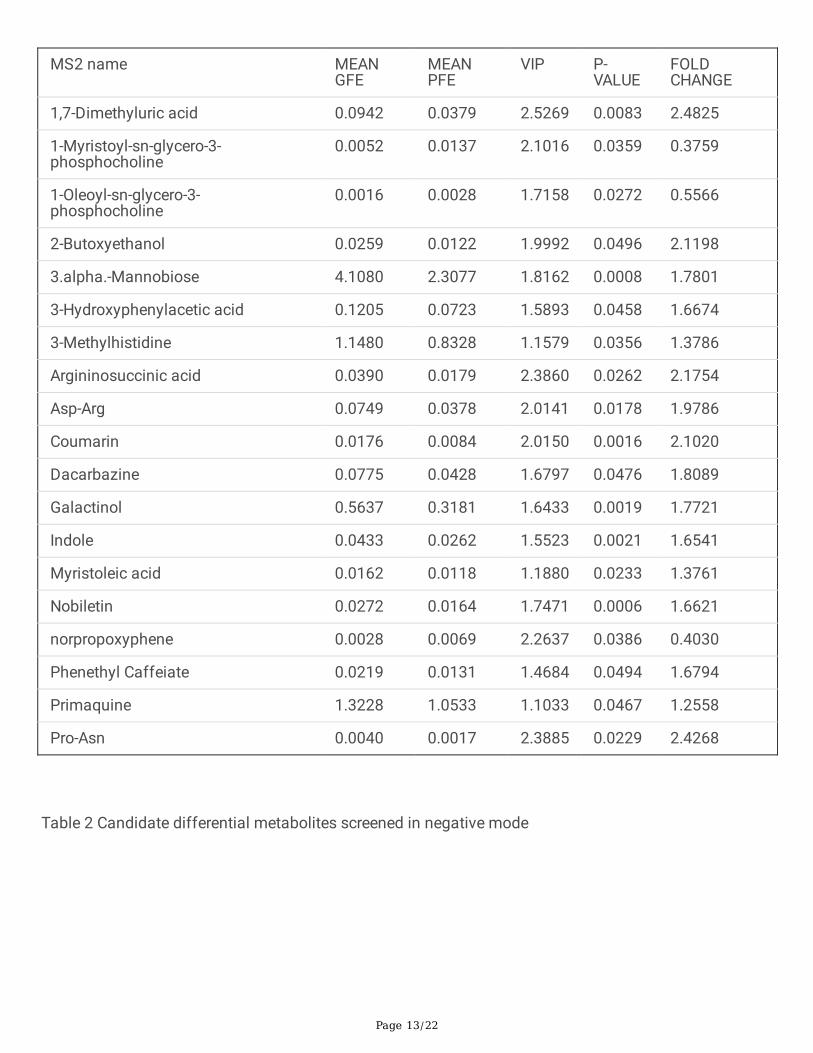
TablesTable 1 Candidate differential metabolites screened in positive mode
Page 13/22
MS2 name MEANGFE
MEANPFE
VIP P-VALUE
FOLDCHANGE
1,7-Dimethyluric acid 0.0942 0.0379 2.5269 0.0083 2.4825
1-Myristoyl-sn-glycero-3-phosphocholine
0.0052 0.0137 2.1016 0.0359 0.3759
1-Oleoyl-sn-glycero-3-phosphocholine
0.0016 0.0028 1.7158 0.0272 0.5566
2-Butoxyethanol 0.0259 0.0122 1.9992 0.0496 2.1198
3.alpha.-Mannobiose 4.1080 2.3077 1.8162 0.0008 1.7801
3-Hydroxyphenylacetic acid 0.1205 0.0723 1.5893 0.0458 1.6674
3-Methylhistidine 1.1480 0.8328 1.1579 0.0356 1.3786
Argininosuccinic acid 0.0390 0.0179 2.3860 0.0262 2.1754
Asp-Arg 0.0749 0.0378 2.0141 0.0178 1.9786
Coumarin 0.0176 0.0084 2.0150 0.0016 2.1020
Dacarbazine 0.0775 0.0428 1.6797 0.0476 1.8089
Galactinol 0.5637 0.3181 1.6433 0.0019 1.7721
Indole 0.0433 0.0262 1.5523 0.0021 1.6541
Myristoleic acid 0.0162 0.0118 1.1880 0.0233 1.3761
Nobiletin 0.0272 0.0164 1.7471 0.0006 1.6621
norpropoxyphene 0.0028 0.0069 2.2637 0.0386 0.4030
Phenethyl Caffeiate 0.0219 0.0131 1.4684 0.0494 1.6794
Primaquine 1.3228 1.0533 1.1033 0.0467 1.2558
Pro-Asn 0.0040 0.0017 2.3885 0.0229 2.4268
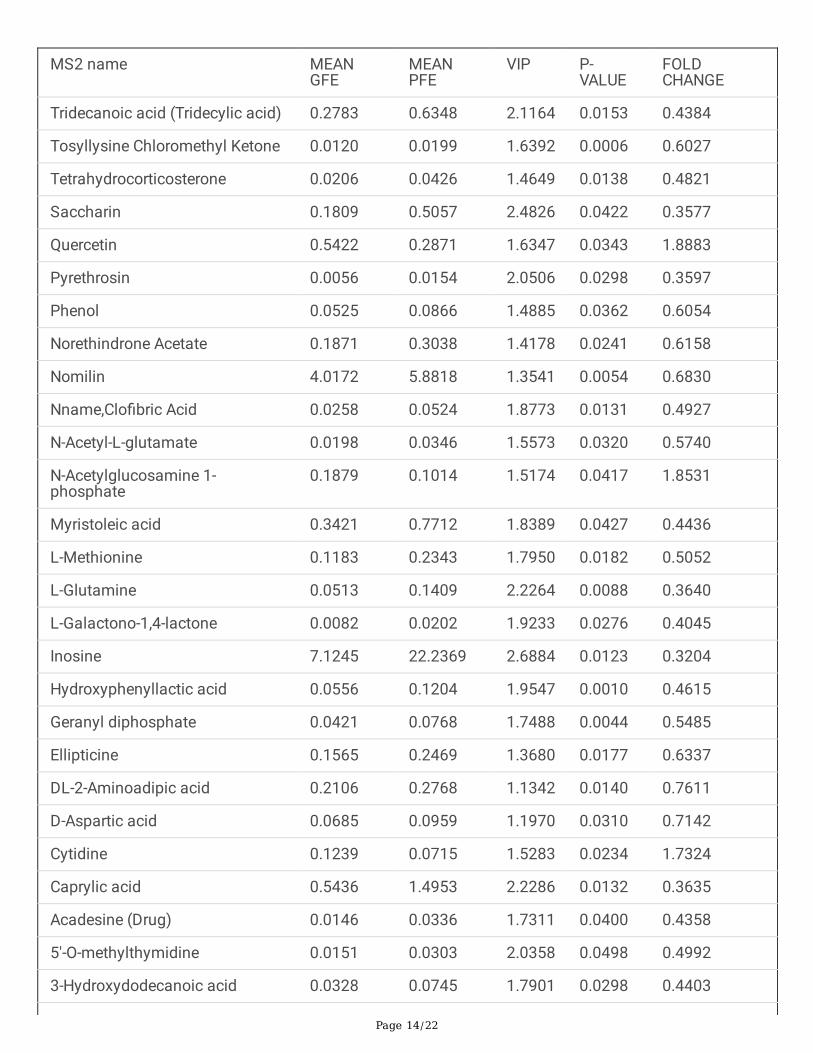
Table 2 Candidate differential metabolites screened in negative mode
Page 14/22
MS2 name MEANGFE
MEANPFE
VIP P-VALUE
FOLDCHANGE
Tridecanoic acid (Tridecylic acid) 0.2783 0.6348 2.1164 0.0153 0.4384
Tosyllysine Chloromethyl Ketone 0.0120 0.0199 1.6392 0.0006 0.6027
Tetrahydrocorticosterone 0.0206 0.0426 1.4649 0.0138 0.4821
Saccharin 0.1809 0.5057 2.4826 0.0422 0.3577
Quercetin 0.5422 0.2871 1.6347 0.0343 1.8883
Pyrethrosin 0.0056 0.0154 2.0506 0.0298 0.3597
Phenol 0.0525 0.0866 1.4885 0.0362 0.6054
Norethindrone Acetate 0.1871 0.3038 1.4178 0.0241 0.6158
Nomilin 4.0172 5.8818 1.3541 0.0054 0.6830
Nname,Clo�bric Acid 0.0258 0.0524 1.8773 0.0131 0.4927
N-Acetyl-L-glutamate 0.0198 0.0346 1.5573 0.0320 0.5740
N-Acetylglucosamine 1-phosphate
0.1879 0.1014 1.5174 0.0417 1.8531
Myristoleic acid 0.3421 0.7712 1.8389 0.0427 0.4436
L-Methionine 0.1183 0.2343 1.7950 0.0182 0.5052
L-Glutamine 0.0513 0.1409 2.2264 0.0088 0.3640
L-Galactono-1,4-lactone 0.0082 0.0202 1.9233 0.0276 0.4045
Inosine 7.1245 22.2369 2.6884 0.0123 0.3204
Hydroxyphenyllactic acid 0.0556 0.1204 1.9547 0.0010 0.4615
Geranyl diphosphate 0.0421 0.0768 1.7488 0.0044 0.5485
Ellipticine 0.1565 0.2469 1.3680 0.0177 0.6337
DL-2-Aminoadipic acid 0.2106 0.2768 1.1342 0.0140 0.7611
D-Aspartic acid 0.0685 0.0959 1.1970 0.0310 0.7142
Cytidine 0.1239 0.0715 1.5283 0.0234 1.7324
Caprylic acid 0.5436 1.4953 2.2286 0.0132 0.3635
Acadesine (Drug) 0.0146 0.0336 1.7311 0.0400 0.4358
5'-O-methylthymidine 0.0151 0.0303 2.0358 0.0498 0.4992
3-Hydroxydodecanoic acid 0.0328 0.0745 1.7901 0.0298 0.4403

Page 15/22
3-Guanidinopropanoate 0.2673 0.1166 1.9724 0.0098 2.2931
2-Thiocytidine 0.5193 0.9476 1.5898 0.0415 0.5480
1-Methyladenosine 0.0051 0.0090 1.7015 0.0122 0.5626
Table 3 KEGG pathways analysis of the differential metabolites pathway

Page 16/22
Pathway model
Metabolic pathways - Sus scrofa (pig) POS
Biosynthesis of amino acids - Sus scrofa (pig) POS
Caffeine metabolism - Sus scrofa (pig) POS
Galactose metabolism - Sus scrofa (pig) POS
Histidine metabolism - Sus scrofa (pig) POS
Phenylalanine metabolism - Sus scrofa (pig) POS
Phenylalanine, tyrosine and tryptophan biosynthesis - Sus scrofa (pig) POS
Tryptophan metabolism - Sus scrofa (pig) POS
2-Oxocarboxylic acid metabolism - Sus scrofa (pig) NEG
ABC transporters - Sus scrofa (pig) NEG
Aminoacyl-tRNA biosynthesis - Sus scrofa (pig) NEG
AMPK signaling pathway - Sus scrofa (pig) NEG
Antifolate resistance - Sus scrofa (pig) NEG
Ascorbate and aldarate metabolism - Sus scrofa (pig) NEG
Biosynthesis of amino acids - Sus scrofa (pig) NEG
Central carbon metabolism in cancer - Sus scrofa (pig) NEG
D-Glutamine and D-glutamate metabolism - Sus scrofa (pig) NEG
Fatty acid biosynthesis - Sus scrofa (pig) NEG
GABAergic synapse - Sus scrofa (pig) NEG
Glutamatergic synapse - Sus scrofa (pig) NEG
Glyoxylate and dicarboxylate metabolism - Sus scrofa (pig) NEG
Lysine degradation - Sus scrofa (pig) NEG
Metabolic pathways - Sus scrofa (pig) NEG
Mineral absorption - Sus scrofa (pig) NEG
Nitrogen metabolism - Sus scrofa (pig) NEG
Proximal tubule bicarbonate reclamation - Sus scrofa (pig) NEG
Purine metabolism - Sus scrofa (pig) NEG
Pyrimidine metabolism - Sus scrofa (pig) NEG

Page 17/22
Terpenoid backbone biosynthesis - Sus scrofa (pig) NEG
Ubiquinone and other terpenoid-quinone biosynthesis - Sus scrofa (pig) NEG
Alanine, aspartate and glutamate metabolism - Sus scrofa (pig) both
Arginine biosynthesis - Sus scrofa (pig) both
Cysteine and methionine metabolism - Sus scrofa (pig) both
Protein digestion and absorption - Sus scrofa (pig) both
Tyrosine metabolism - Sus scrofa (pig) both
Figures
Figure 1
Screening semen for differential freezability.
Figure 2

Page 18/22
Metabolites and chemical class of seminal plasma. A, B was detected in positive and negative ions moderespectively.
Figure 3
Metabolomics pro�le of GFE and PFE group. OPLS-DA scores plots based on the data from in positive (A)v.s. in negative mode (B). Permutation test of OPLS-DA model for group GFE v.s. PFE in positive mode (C)and negative mode (D).

Page 19/22
Figure 4
VIP value and volcano maps of metabolites. VIP scores of metabolites in GFE and PFE (TOP15) obtainedin positive (A) and negative mode (B). Heat map with red or green boxes on the right indicates high andlow abundance ratio, respectively, of the corresponding metabolite in GFE and PFE. Volcano maps ofmetabolites in the positive (C) and negative (D) mode.
Page 20/22
Figure 5
Heat map of metabolites with different content between GFE and PFE groups. A, B was analyzed inpositive and negative ions mode respectively.

Page 21/22
Figure 6
Metabolic pathway analysis of changed metabolites identi�ed in boar seminal plasma. A, B wasanalyzed in positive and negative ions mode respectively.
Page 22/22
Figure 7
Content of metabolites con�rmed by targeted metabolic analysis.


![Systems Metabolomic Lecture[1]](https://static.fdocuments.in/doc/165x107/546af5e0b4af9f486b8b45b1/systems-metabolomic-lecture1.jpg)


