Freestanding palladium nanosheets with plasmonic and ... · Freestanding palladium nanosheets with...
27
SUPPLEMENTARY INFORMATION DOI: 10.1038/NNANO.2010.235 NATURE NANOTECHNOLOGY | www.nature.com/naturenanotechnology 1 Freestanding palladium nanosheets with plasmonic and catalytic properties Xiaoqing Huang, Shaoheng Tang, Xiaoliang Mu, Yan Dai, Guangxu Chen, Zhiyou Zhou, Fangxiong Ruan, Zhilin Yang, & Nanfeng Zheng * * Email: [email protected] Experimental Details Reagents: Pd(acac) 2 (99%) was purchased from Alfa Aesar, PVP (MW=30000), N,N- dimethylformamide (DMF), N,N-dimethylpropionamide (DMP), benzyl alcohol , 2- phenylethanol, Cetyltrimethylammonium bromide (CTAB), tetrabutylammonium bromide (TBAB), NaCl, NaBr and NaI were purchased from Sinopharm Chemical Reagent Co. Ltd. (Shanghai, China). Carbon nanotubes were purchased from Shenzhen Nanotech Port Co. Ltd. Human hepatoma cells (QGY-7703) and human hepatocytes (QSG-7701) were purchased from cell storeroom of Chinese Academy of Science. The water used in all experiments was ultrapure (18.2 MΩ). All reagents were used as received without further purification. Synthesis of 35 nm hexagonal Pd nanoplates: Pd(II) acetylacetonate (Pd(acac) 2 , 50.0 mg), poly(vinylpyrrolidone) (PVP, MW=30000, 160.0 mg) and CTAB (185 mg) were mixed together with N,N-dimethylpropionamide (10 mL) and water (2 mL). The resulting homogeneous yellow solution was transferred to a glass pressure vessel. The vessel was then charged with CO to 1 bar and heated at 100 °C for 3.0 h before it was © 2010 Macmillan Publishers Limited. All rights reserved.
Transcript of Freestanding palladium nanosheets with plasmonic and ... · Freestanding palladium nanosheets with...

SUPPLEMENTARY INFORMATIONdoi: 10.1038/nnano.2010.235
nature nanotechnology | www.nature.com/naturenanotechnology 1S1
Supplementary information for
Freestanding palladium nanosheets with plasmonic and catalytic properties
Xiaoqing Huang, Shaoheng Tang, Xiaoliang Mu, Yan Dai, Guangxu Chen, Zhiyou
Zhou, Fangxiong Ruan, Zhilin Yang, & Nanfeng Zheng*
* Email: [email protected]
Experimental Details
Reagents: Pd(acac)2 (99%) was purchased from Alfa Aesar, PVP (MW=30000), N,N-
dimethylformamide (DMF), N,N-dimethylpropionamide (DMP), benzyl alcohol , 2-
phenylethanol, Cetyltrimethylammonium bromide (CTAB), tetrabutylammonium
bromide (TBAB), NaCl, NaBr and NaI were purchased from Sinopharm Chemical
Reagent Co. Ltd. (Shanghai, China). Carbon nanotubes were purchased from Shenzhen
Nanotech Port Co. Ltd. Human hepatoma cells (QGY-7703) and human hepatocytes
(QSG-7701) were purchased from cell storeroom of Chinese Academy of Science. The
water used in all experiments was ultrapure (18.2 MΩ). All reagents were used as
received without further purification.
Synthesis of 35 nm hexagonal Pd nanoplates: Pd(II) acetylacetonate (Pd(acac)2, 50.0
mg), poly(vinylpyrrolidone) (PVP, MW=30000, 160.0 mg) and CTAB (185 mg) were
mixed together with N,N-dimethylpropionamide (10 mL) and water (2 mL). The
resulting homogeneous yellow solution was transferred to a glass pressure vessel. The
vessel was then charged with CO to 1 bar and heated at 100 °C for 3.0 h before it was
© 2010 Macmillan Publishers Limited. All rights reserved.

2 nature nanotechnology | www.nature.com/naturenanotechnology
SUPPLEMENTARY INFORMATION doi: 10.1038/nnano.2010.235
S2
cooled to room temperature. The dark blue products were precipitated by acetone,
separated via centrifugation and further purified by an ethanol-acetone mixture.
Synthesis of 60 nm hexagonal Pd nanoplates: Pd(II) acetylacetonate (Pd(acac)2, 50.0
mg), poly(vinylpyrrolidone) (PVP, MW=30000, 160.0 mg) and CTAB (185 mg) were
mixed together with N,N-dimethylformamide (10 mL) and water (2 mL). The resulting
homogeneous yellow solution was transferred to a glass pressure vessel. The vessel was
then charged with CO to 1 bar and heated at 100 °C for 3.0 h before it was cooled to
room temperature. The dark blue products were precipitated by acetone, separated via
centrifugation and further purified by an ethanol-acetone mixture.
Synthesis of 125 nm hexagonal Pd nanoplates: Pd(II) acetylacetonate (Pd(acac)2, 50.0
mg), poly(vinylpyrrolidone) (PVP, MW=30000, 160.0 mg) and CTAB (185 mg) were
mixed together with 2-phenylethanol (10 mL). The resulting homogeneous yellow
solution was transferred to a glass pressure vessel. The vessel was then charged with
CO to 1 bar and heated at 100 °C for 3.0 h before it was cooled to room temperature.
The dark blue products were precipitated by acetone, separated via centrifugation and
further purified by an ethanol-acetone mixture.
Synthesis of 160 nm hexagonal Pd nanoplates: Pd(II) acetylacetonate (Pd(acac)2, 50.0
mg), poly(vinylpyrrolidone) (PVP, MW=30000, 160.0 mg) and CTAB (185 mg) were
mixed together with benzyl alcohol (10 mL). The resulting homogeneous yellow
solution was transferred to a glass pressure vessel. The vessel was then charged with
CO to 1 bar and heated at 100 °C for 3.0 h before it was cooled to room temperature.
The dark blue products were precipitated by acetone, separated via centrifugation and
further purified by an ethanol-acetone mixture.
© 2010 Macmillan Publishers Limited. All rights reserved.

nature nanotechnology | www.nature.com/naturenanotechnology 3
SUPPLEMENTARY INFORMATIONdoi: 10.1038/nnano.2010.235
S3
Synthesis of 21 nm hexagonal Pd nanoplates: Pd(II) acetylacetonate (Pd(acac)2, 50.0
mg), poly(vinylpyrrolidone) (PVP, MW=30000, 160.0 mg) and NaBr (51.5 mg) were
mixed together with N,N-dimethylpropionamide (10 mL) and water (2 mL). The
resulting homogeneous yellow solution was transferred to a glass pressure vessel. The
vessel was then charged with CO to 1 bar and heated at 100 °C for 3.0 h before it was
cooled to room temperature. The dark blue products were precipitated by acetone,
separated via centrifugation and further purified by an ethanol-acetone mixture.
Synthesis of 27 nm hexagonal Pd nanoplates: Pd(II) acetylacetonate (Pd(acac)2, 50.0
mg), poly(vinylpyrrolidone) (PVP, MW=30000, 160.0 mg) and NaBr (51.5 mg) were
mixed together with N,N-dimethylformamide (10 mL) and water (2 mL). The resulting
homogeneous yellow solution was transferred to a glass pressure vessel. The vessel was
then charged with CO to 1 bar and heated at 100 °C for 3.0 h before it was cooled to
room temperature. The dark blue products were precipitated by acetone, separated via
centrifugation and further purified by an ethanol-acetone mixture.
Synthesis of 41 nm hexagonal Pd nanoplates: Pd(II) acetylacetonate (Pd(acac)2, 50.0
mg), poly(vinylpyrrolidone) (PVP, MW=30000, 160.0 mg) and TBAB (161 mg) were
mixed together with N,N-dimethylformamide (10 mL) and water (2 mL). The resulting
homogeneous yellow solution was transferred to a glass pressure vessel. The vessel was
then charged with CO to 1 bar and heated at 100 °C for 3.0 h before it was cooled to
room temperature. The dark blue products were precipitated by acetone, separated via
centrifugation and further purified by an ethanol-acetone mixture.
Synthesis of 51 nm hexagonal Pd nanoplates: 51 nm hexagonal Pd nanoplates are
obtained by using the Pd nanosheets (41 nm) as the seed. Typically, Pd(II)
© 2010 Macmillan Publishers Limited. All rights reserved.

4 nature nanotechnology | www.nature.com/naturenanotechnology
SUPPLEMENTARY INFORMATION doi: 10.1038/nnano.2010.235
S4
acetylacetonate (Pd(acac)2, 25.0 mg) were directly mixed together with the 41 nm Pd
nanosheets obtained above. The resulting homogeneous solution was transferred to a
glass pressure vessel. The vessel was then charged with CO to 1 bar and heated at 60 °C
for 3.0 h before it was cooled to room temperature. The dark blue products were
precipitated by acetone, separated via centrifugation and further purified by an ethanol-
acetone mixture.
TEM Analysis: TEM (including high-resolution transmission electron microscopy,
HRTEM) studies were performed on a TECNAI F-30 high-resolution transmission
electron microscopy operating at 300 kV. The samples were prepared by dropping
ethanol dispersion of samples onto 300-mesh carbon-coated copper grids and
immediately evaporating the solvent. For the direct measurements of the thicknesses,
carbon nanotubes were added into ethanol dispersions of the Pd nanosheets to allow the
attachment of Pd nanosheets on the outer surface of the nanotubes.
Quantitative Elemental Analysis of Pd nanosheets: The Pd and Br contents in the Pd
nanosheets (edge length 41 nm) were quantitatively analyzed by inductively coupled
plasma mass spectrometry (ICP) and ion chromatography, respectively. In a typical 12-
mL reaction of the Pd nanosheets (edge length 41 nm), 50.0 mg of Pd(acac)2 were used.
At the end of reaction, 0.35 mL solution was extracted and purified for analysis. To
prepare solution for ICP measurements, the purified Pd nanosheets were digested by
1mL aqua regia and then diluted by ultrapure water into a 1000 mL solution for the ICP
analysis. Based on the amount of Pd(acac)2 used, the Pd content in the solution was
calculated as 50.8 ppb. The actual concentration by ICP was 45.2 ppb. Therefore, the
recovery yield in a typical synthesis of the Pd nanosheets (edge length 41 nm) was 89%.
© 2010 Macmillan Publishers Limited. All rights reserved.

nature nanotechnology | www.nature.com/naturenanotechnology 5
SUPPLEMENTARY INFORMATIONdoi: 10.1038/nnano.2010.235
S5
UV-Vis- near IR absorption spectra measurements: All the UV-Vis- near IR
absorption spectra of Pd nanoplates were taken on a CARY 5000 Scan UV-Vis-near IR
spectrophotometer (Varian) using ethanol as the solvent. The measured solutions
contained 30 ppm Pd.
Electrochemical Measurements:
Pd-nanosheet-modified working electrodes were fabricated by depositing ethanolic
dispersion of purified nanosheets onto a glassy carbon electrode followed by drying
under an IR lamp. A saturated calomel electrode (SCE) and a platinum foil were used as
the reference and counter electrode, respectively. To measure the electrochemically
active surface area of Pd nanosheets, cyclic voltammetry (CV) measurements were
carried out in 0.5 M H2SO4 solutions at a sweep rate of 50 mV/s. The electrochemically
active surface area of the nanosheets was calculated, from the hydrogen adsorption /
desorption charge in the CV curve, by assuming a charge of 210 μC/cm2 for hydrogen
adsorption on Pd (111). For the electrooxidation of formic acid, the cyclic
voltammgrams were recorded at a sweep rate of 50 mV/s in 0.5 M H2SO4 + 0.25 M
formic acid. Before cyclic voltammetry measurements, two cycles of potential sweeps
between -0.2 V and 1.2 V at a sweep rate of 250 mV/s were applied in order to clean the
Pd surface in-situ.
For the CO stripping voltammetry measurements, CO gas (99.99%) was bubbled for 15
minutes through a 0.1 M H2SO4 or 0.1M HClO4 solution in which the electrode was
immersed. The electrode was quickly moved to a fresh solution and the CO stripping
voltammetry was recorded at a sweep rate of 2 mV/s. To investigate the CO adsorption
on the freshly-prepared Pd nanosheets, the CO stripping voltammogram was recorded in
0.1 M H2SO4 at a sweep rate of 2 mV/s without introducing any additional CO.
© 2010 Macmillan Publishers Limited. All rights reserved.

6 nature nanotechnology | www.nature.com/naturenanotechnology
SUPPLEMENTARY INFORMATION doi: 10.1038/nnano.2010.235
S6
Photothermal Effect Measurement:
To study the photothermal effect induced by the near IR SPR absorption, 1mL aqueous
solutions containing different concentration ( 0, 7, 14 and 27 ppm) of the Pd nanosheets
(side length 41nm) were irradiated by a near IR laser (808nm, 1W). The temperatures of
the solutions were monitored by a thermocouple microprobe (φ = 0.5 mm) submerged in
the solution in a 1-cm square cuvette. The probe was placed at such a position that the
direct irradiation of the laser on the probe was avoided. The tip of the thermocouple was
~5 mm above the bottom of the cuvette. The photothermal stability of the Pd
nanosheets was studied by irradiating the Pd solution with a 2 W 808 nm laser for 30
min.
Apoptosis assay:
Human healthy liver cells (QSG-7701) were cultured in RPMI 1640 medium in 24-well
plates. The cell density was 1×10⁵ cells/well. After being seeded for 18 h, the media
were replaced by culture media containing different concentration of the Pd nanosheets
(side length 41nm). The incubations were carried out at 37 °C in 5% CO2 atmosphere
for 48 h. After incubation for 48 h, cell viabilities were measured by standard MTT
assay, a colorimetric assay based on the ability of viable cells to reduce 3-[4,5-
dimethylthiazol-2-yl]-2, 5-diphenyltetrazolium bromide.
In Vitro Photothermal Therapy:
Surface modification of Pd nanosheets with polyethyleneimine (PEI). 0.5 mL
solution of purified Pd nanosheets (200μg/mL, side length 41nm) was mixed with 0.5
mL PEI (5 mg/mL). The mixture was kept at 4°C overnight before centrifugation. The
© 2010 Macmillan Publishers Limited. All rights reserved.

nature nanotechnology | www.nature.com/naturenanotechnology 7
SUPPLEMENTARY INFORMATIONdoi: 10.1038/nnano.2010.235
S7
particles were then washed with water at least 5 times and then dispersed in 5 mL RPMI
1640 culture medium.
Cancer cells culture and their incubation with Pd nanosheets. Human hepatoma
cells (QGY-7703) were cultured in RPMI 1640 medium in 24-well plates. The density
was 1×10⁵ cells/well. Before incubation with Pd nanosheets, the cells were seeded for
18 h. 0.5 mL of PEI-modified Pd nanosheets in water were added to each well at a
concentration of 20 μg/mL. The incubations were carried out at 37 °C in 5% CO2
atmosphere for 12 h. After incubation, the cell medium was removed, and the cells were
washed before PBS buffer solution was added.
Photothermal killing of cancer cells incubated with Pd nanosheets. After incubation
with Pd nanosheets, human hepatoma cells were exposed to a 2 W 808-nm laser for
various periods to induce photothermal cell damage. To identify the cell viability, the
dead cells were stained with Trypan Blue. Cell viabilities were also measured by the
standard MTT assay.
© 2010 Macmillan Publishers Limited. All rights reserved.

8 nature nanotechnology | www.nature.com/naturenanotechnology
SUPPLEMENTARY INFORMATION doi: 10.1038/nnano.2010.235
S8
30 40 50 60 70 80
(222)
(311)
(220)(200)
Inte
nsity
(a.u
.)
2θ (degree)
(111)
JCPDS:05-0681
Figure S1. The XRD pattern of the obtained Pd nanosheets produced from 3-hr
reactions in the presence of both PVP and CTAB.
© 2010 Macmillan Publishers Limited. All rights reserved.

nature nanotechnology | www.nature.com/naturenanotechnology 9
SUPPLEMENTARY INFORMATIONdoi: 10.1038/nnano.2010.235
S9
Figure S2. CO stripping voltammetry of (a) the as-prepared uniform hexagonal Pd
nanosheets (edge length 60 nm) and (b) the irregular Pd nanosheets (prepared in the
presence of PVP but in the absence of halide) in 0.1 M H2SO4 solution at a scan rate of
2 mV/s. CO was dosed for 15 minutes before measurements. The peaks observed in CO
stripping curve (a) can be assigned to the CO stripping on Pd (100) and Pd (111) facets.
In comparison, the only CO stripping peak for the irregular nanosheets shown in
Fig.S2b is attributed to Pd (111). (Hara, M.; Linke, U.; Wandlowski, T. Electrochim.
Acta. 2007, 52, 5733–5748.)
© 2010 Macmillan Publishers Limited. All rights reserved.

10 nature nanotechnology | www.nature.com/naturenanotechnology
SUPPLEMENTARY INFORMATION doi: 10.1038/nnano.2010.235
S10
Figure S3. Comparison studies of the reactions in the presence and in the absence of CO. The reactions were carried out in the presence
of PVP and CTAB using DMF as the solvent.
© 2010 Macmillan Publishers Limited. All rights reserved.

nature nanotechnology | www.nature.com/naturenanotechnology 11
SUPPLEMENTARY INFORMATIONdoi: 10.1038/nnano.2010.235
S11
0.4 0.6 0.8 1.0 1.2
0.2
0.4
0.6
0.8
Cur
rent
/(m
A/m
g)
Potential/ V(RHE)
1.035 V
2100 2050 2000 1950 1900
Inte
nsity
/ a.
u.
Wavelength / cm-1
1960cm-1 bridge-bonded CO
2046cm-1 linear-bonded CO
(a)
(b)
Figure S4. Characterization of CO adsorption on the as-prepared Pd nanosheets
without introducing additional CO after the synthesis: (a) CO stripping voltammetry of
freshly-prepared Pd nanosheets in 0.1 M H2SO4 solution at a scan rate of 2 mV/s. The
major peak observed in CO stripping curve is attributed to the CO adsorption on the
(111) facets of the as-prepared Pd nanosheets; (b) FTIR spectrum of the as-prepared Pd
nanosheets dispersed in DMF.
© 2010 Macmillan Publishers Limited. All rights reserved.

12 nature nanotechnology | www.nature.com/naturenanotechnology
SUPPLEMENTARY INFORMATION doi: 10.1038/nnano.2010.235
S12
Figure S5. Representative TEM of stacked Pd nanosheets collected from different reaction times using DMF as the solvent and CTAB as
the Br- source (left) and the thickness distribution of the nanosheets (right). (a) 0.5 h, (b) 1.5 h, (c) 2.5 h, and (d) 3.0 h.
© 2010 Macmillan Publishers Limited. All rights reserved.

nature nanotechnology | www.nature.com/naturenanotechnology 13
SUPPLEMENTARY INFORMATIONdoi: 10.1038/nnano.2010.235
S13
Figure S6. Representative TEM images of Pd nanosheets obtained from the reactions
under different conditions: (a-b) in absence of both PVP and CTAB; (c-d) in the
presence of CTAB but the absence of PVP; (e-f) in the presence of PVP but the absence
of CTAB .
© 2010 Macmillan Publishers Limited. All rights reserved.
14 nature nanotechnology | www.nature.com/naturenanotechnology
SUPPLEMENTARY INFORMATION doi: 10.1038/nnano.2010.235
S14
330 335 340 345
Cou
nts
Binding Energy / eV
Pd(0)
340.1 eV(Pd 3d3/2)
(Pd 3d5/2)335.1 eV
60 65 70 75
Cou
nts
Binding Energy / eV
Br-
(Br 3d5/2)67.1 eV
(Br 3d3/2)68.1 eV
0 1 2 3 4 5 6 7
-1
0
1
2
3
4
5
Inte
nsity
/ μS
Retention Time / min
reference Purified Pd nanosheets
Br-
-150 -100 -50 0 50 100 150
-0.5 mV
Inte
nsity
/ a.
u.Zeta potential / mV
without Br-
with Br-
-25 mV
(a) (b)
(c) (d)
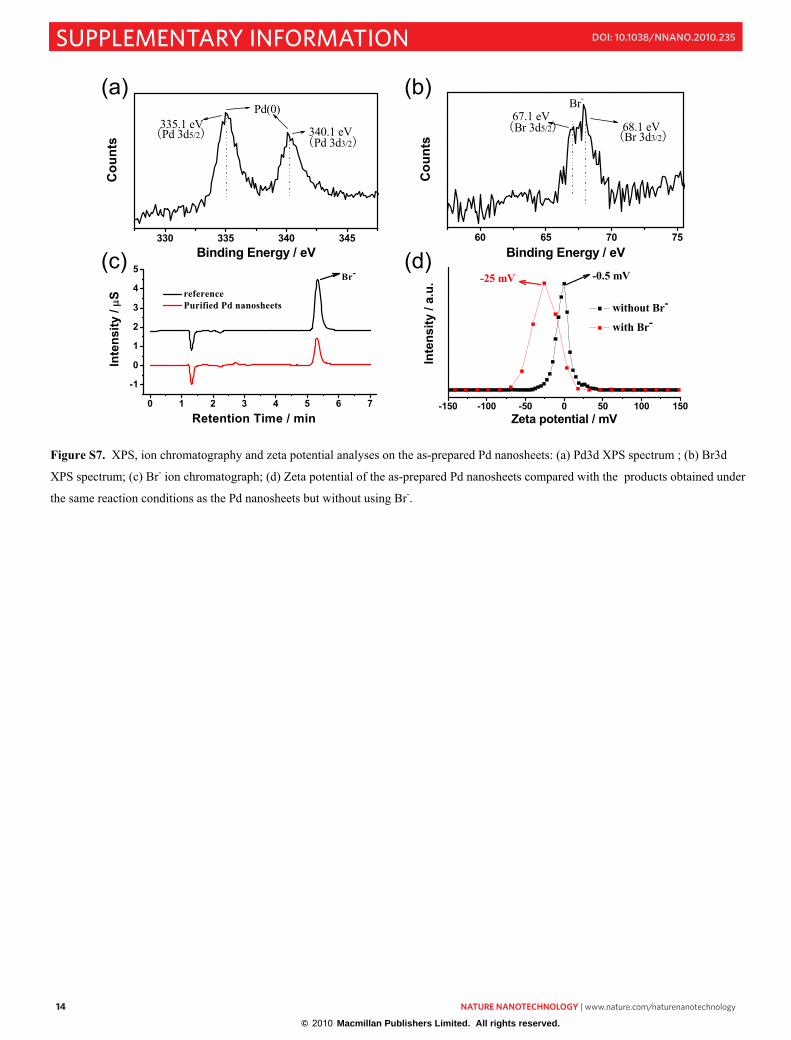
Figure S7. XPS, ion chromatography and zeta potential analyses on the as-prepared Pd nanosheets: (a) Pd3d XPS spectrum ; (b) Br3d
XPS spectrum; (c) Br- ion chromatograph; (d) Zeta potential of the as-prepared Pd nanosheets compared with the products obtained under
the same reaction conditions as the Pd nanosheets but without using Br-.
© 2010 Macmillan Publishers Limited. All rights reserved.
nature nanotechnology | www.nature.com/naturenanotechnology 15
SUPPLEMENTARY INFORMATIONdoi: 10.1038/nnano.2010.235
S15
(a)
(c)
(b)
(d)
(e) (f)
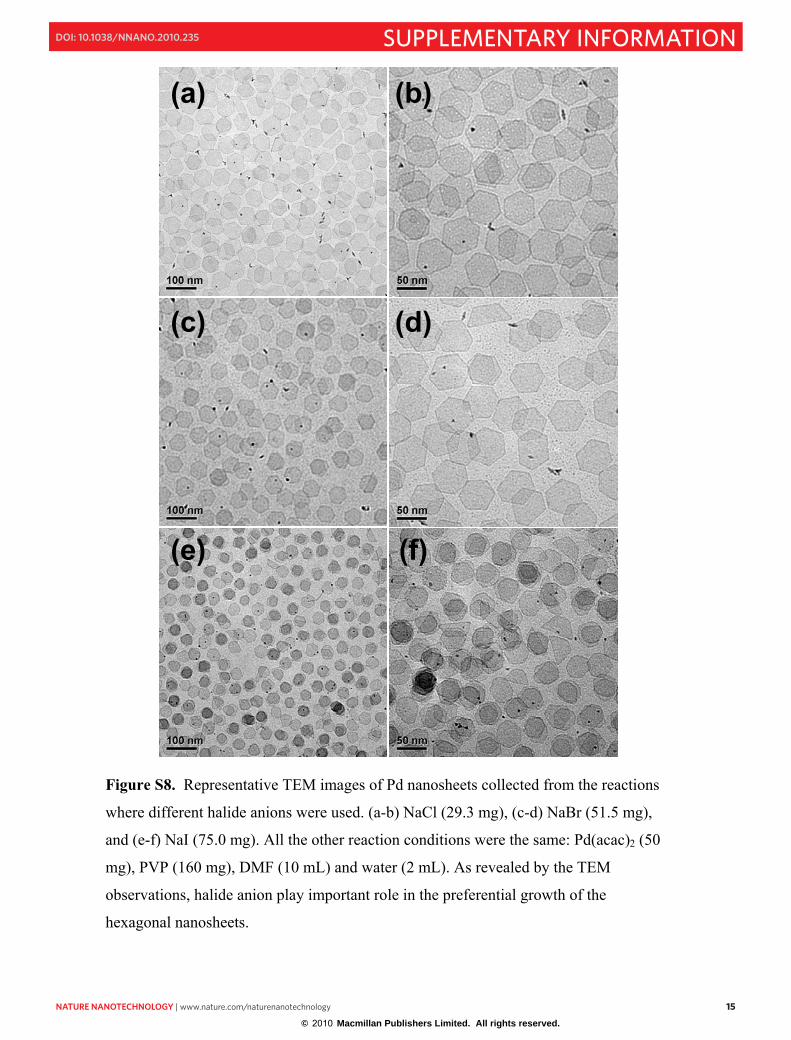
Figure S8. Representative TEM images of Pd nanosheets collected from the reactions
where different halide anions were used. (a-b) NaCl (29.3 mg), (c-d) NaBr (51.5 mg),
and (e-f) NaI (75.0 mg). All the other reaction conditions were the same: Pd(acac)2 (50
mg), PVP (160 mg), DMF (10 mL) and water (2 mL). As revealed by the TEM
observations, halide anion play important role in the preferential growth of the
hexagonal nanosheets.
© 2010 Macmillan Publishers Limited. All rights reserved.
16 nature nanotechnology | www.nature.com/naturenanotechnology
SUPPLEMENTARY INFORMATION doi: 10.1038/nnano.2010.235
S16
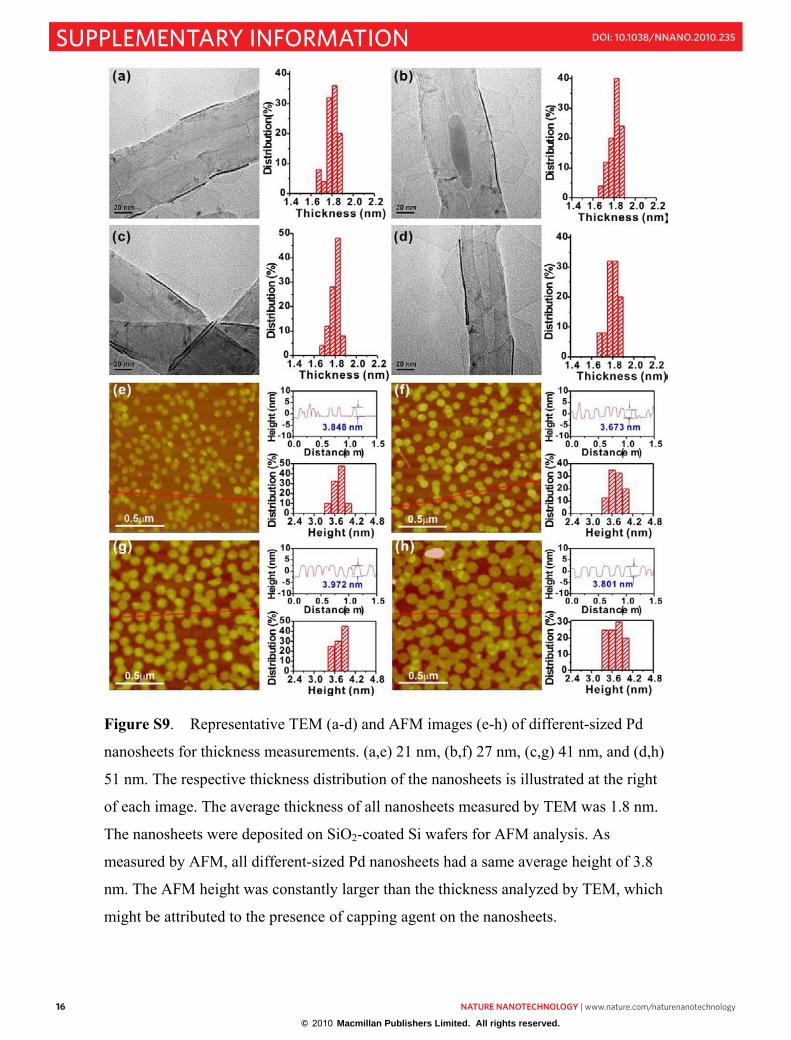
Figure S9. Representative TEM (a-d) and AFM images (e-h) of different-sized Pd
nanosheets for thickness measurements. (a,e) 21 nm, (b,f) 27 nm, (c,g) 41 nm, and (d,h)
51 nm. The respective thickness distribution of the nanosheets is illustrated at the right
of each image. The average thickness of all nanosheets measured by TEM was 1.8 nm.
The nanosheets were deposited on SiO2-coated Si wafers for AFM analysis. As
measured by AFM, all different-sized Pd nanosheets had a same average height of 3.8
nm. The AFM height was constantly larger than the thickness analyzed by TEM, which
might be attributed to the presence of capping agent on the nanosheets.
© 2010 Macmillan Publishers Limited. All rights reserved.

nature nanotechnology | www.nature.com/naturenanotechnology 17
SUPPLEMENTARY INFORMATIONdoi: 10.1038/nnano.2010.235
S17
Figure S10. Representative TEM images of Pd nanosheets prepared from the reactions
using different solvents: (a) dimethylpropionamide, (b) dimethylformamide, (c) 2-
phenylethanol, and (d) benzyl alcohol. All the other reaction conditions were the same:
the solvent (10 mL), Pd(acac)2 (50 mg), PVP (160 mg), and water (2 mL). The average
edge lengths are 35, 60, 125 and 160 nm, respectively.
© 2010 Macmillan Publishers Limited. All rights reserved.

18 nature nanotechnology | www.nature.com/naturenanotechnology
SUPPLEMENTARY INFORMATION doi: 10.1038/nnano.2010.235
S18
400 600 800 1000 1200 1400
Abs
orba
nce
/ a.u
.
Wavelength / nm
fresh solution stocked solution
0.4 0.6 0.8 1.0 1.2
0.2
0.3
0.4
0.5
0.6
0.7
0.8
Cur
rent
/(m
A/m
g)
Potential / V(RHE)
fresh solution stocked solution
1.035 V
(a)
(b)
Figure S11. Absorption spectra (a) and CO stripping voltammetric curves (b) of the
freshly prepared Pd nanosheets and the Pd nanosheets stocked in ethanol at 0°C for 2
months. The voltammograms were recorded at a scan rate of 2 mV/s without
introducing any external CO.
© 2010 Macmillan Publishers Limited. All rights reserved.

nature nanotechnology | www.nature.com/naturenanotechnology 19
SUPPLEMENTARY INFORMATIONdoi: 10.1038/nnano.2010.235
S19
400 600 800 1000 1200 1400 16000.0
0.5
1.0
1.5
2.0
Edge length, Thickness 21nm, 6nm 21nm, 4nm 21nm, 3nm 21nm, 2nm 25nm, 2nm
Extin
ctio
n Ef
ficie
ncy
(a.u
.)
Wavelength (nm)
Figure S12. Calculated extinction spectra of hexagonal Pd nanosheets with various
diameters. The orientation averaged extinction efficiency spectra of Pd nanosheets in
ethanol was numerically simulated by discrete-dipole approximation (DDA) method.
DDA is a flexible and powerful technique for computing scattering and absorption by
targets of arbitrary geometry. For the application of the DDA method, we thank Draine
and Flatau for their DDSCAT free source code (Draine, B. T.; Flatau, P. J. User guide
for the discrete dipole approximation code DDSCAT 6.1, 2004;
http://arxiv.org/abs/astro-ph/030969). In the calculations, the dielectric function data
were taken from Ref. (Johnson P B, Christy R W. Optical constants of transition metals:
Ti,V, Cr, Mn, Fe, Co, Ni, and Pd. Phys. Rev. B, 1974, 9, 5056–5070), and more than
20000 dipoles are used in the calculations.
© 2010 Macmillan Publishers Limited. All rights reserved.
20 nature nanotechnology | www.nature.com/naturenanotechnology
SUPPLEMENTARY INFORMATION doi: 10.1038/nnano.2010.235
S20
0.0 0.1 0.2 0.3 0.40.0
0.5
1.0
1.5 4.1 x 10⁹ M-1cm-1
(b)
Abs
orba
nce
(O.D
.)
Pd Nanosheet Concentration (nM)
(a)
400 600 800 1000 12000.0
0.4
0.8
1.2
1.6 0.076 nM 0.152 nM 0.228 nM 0.304 nM 0.380 nM
Abs
orba
nce
(O.D
.)
Wavelength (nm)
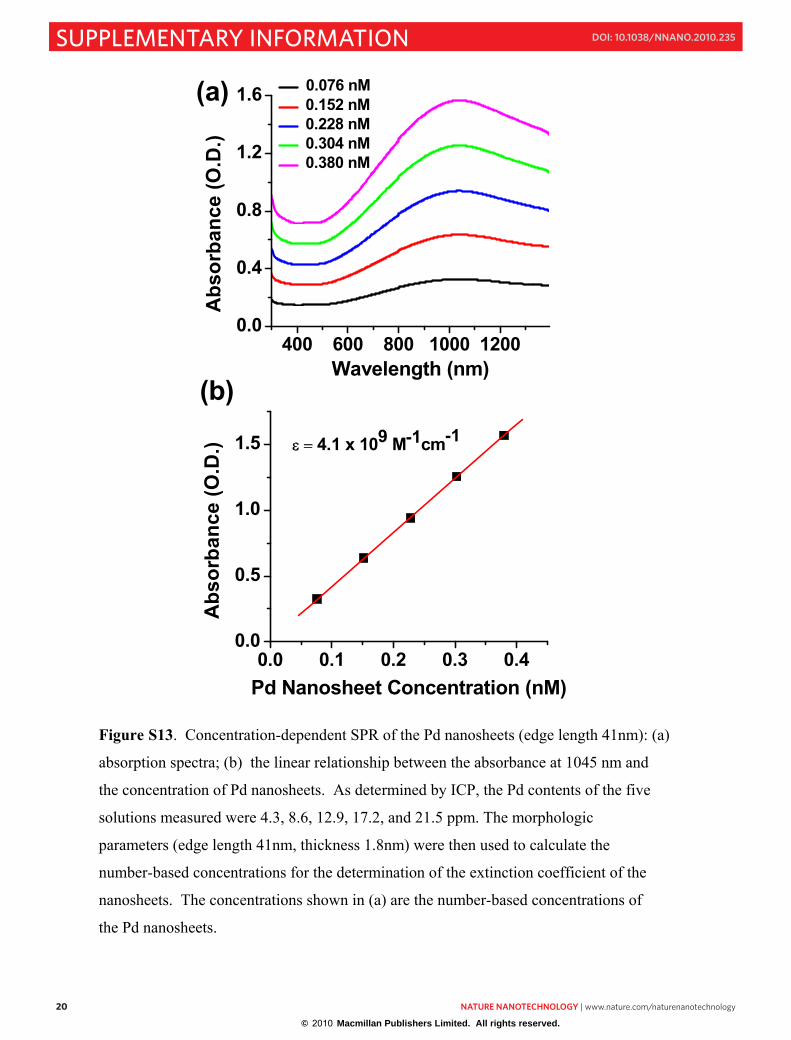
Figure S13. Concentration-dependent SPR of the Pd nanosheets (edge length 41nm): (a)
absorption spectra; (b) the linear relationship between the absorbance at 1045 nm and
the concentration of Pd nanosheets. As determined by ICP, the Pd contents of the five
solutions measured were 4.3, 8.6, 12.9, 17.2, and 21.5 ppm. The morphologic
parameters (edge length 41nm, thickness 1.8nm) were then used to calculate the
number-based concentrations for the determination of the extinction coefficient of the
nanosheets. The concentrations shown in (a) are the number-based concentrations of
the Pd nanosheets.
© 2010 Macmillan Publishers Limited. All rights reserved.

nature nanotechnology | www.nature.com/naturenanotechnology 21
SUPPLEMENTARY INFORMATIONdoi: 10.1038/nnano.2010.235
S21
Figure S14. Representative TEM images, and the distributions of the edge length and
thickness of the Pd nanosheets before (a-d) and after (e-h) 30-min irradition with a
2W 808nm laser. For their direct thickness measurments, the nanosheets were attached
on carbon nanotubes. Before irradiation, the nanosheets had an average edge length of
41 nm and a thickness of 1.8 nm. After irradiation, the edge length and thickness of the
Pd nanosheets changed into 30 nm and 2.3 nm, respectively.
© 2010 Macmillan Publishers Limited. All rights reserved.

22 nature nanotechnology | www.nature.com/naturenanotechnology
SUPPLEMENTARY INFORMATION doi: 10.1038/nnano.2010.235
S22
400 600 800 1000 1200 1400 1600
Before irradiation of laser After 30-min irradiation of a 2W 808nm laser
Abs
orba
nce
/ a.u
.
Wavelength / nm
Figure S15. SPR absorption of Pd nanosheets before and after 30-min irradition with a
2W 808nm laser. Although the total energy input on the Pd nanosheets is as high as 3.6
kJ, the irradiated Pd nanosheets still displayed a good SPR response in the near IR
region.
© 2010 Macmillan Publishers Limited. All rights reserved.
nature nanotechnology | www.nature.com/naturenanotechnology 23
SUPPLEMENTARY INFORMATIONdoi: 10.1038/nnano.2010.235
S23
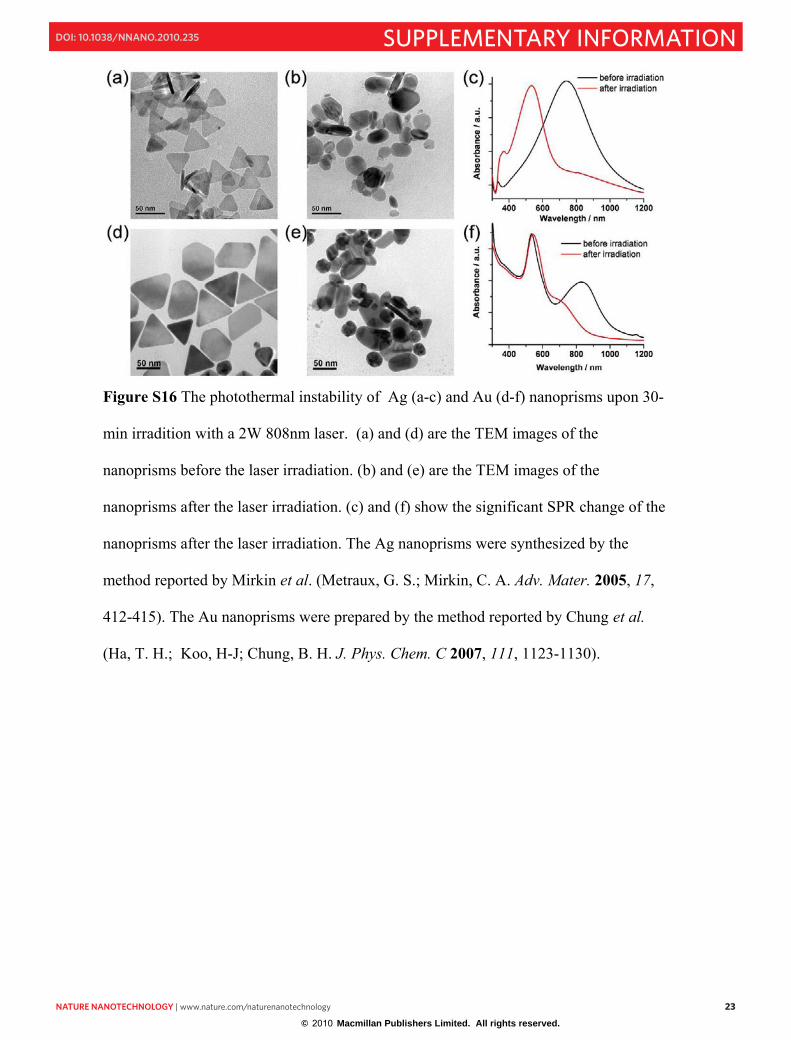
Figure S16 The photothermal instability of Ag (a-c) and Au (d-f) nanoprisms upon 30-
min irradition with a 2W 808nm laser. (a) and (d) are the TEM images of the
nanoprisms before the laser irradiation. (b) and (e) are the TEM images of the
nanoprisms after the laser irradiation. (c) and (f) show the significant SPR change of the
nanoprisms after the laser irradiation. The Ag nanoprisms were synthesized by the
method reported by Mirkin et al. (Metraux, G. S.; Mirkin, C. A. Adv. Mater. 2005, 17,
412-415). The Au nanoprisms were prepared by the method reported by Chung et al.
(Ha, T. H.; Koo, H-J; Chung, B. H. J. Phys. Chem. C 2007, 111, 1123-1130).
© 2010 Macmillan Publishers Limited. All rights reserved.

24 nature nanotechnology | www.nature.com/naturenanotechnology
SUPPLEMENTARY INFORMATION doi: 10.1038/nnano.2010.235
S24
-0.2 0.0 0.2 0.4 0.6 0.8 1.0
-0.4
-0.2
0.0
0.2
0.4
Cur
rent
/ m
A
Potential / V (SCE)
Figure S17 CV voltammetry of as-prepared Pd nanosheets in 0.5 M H2SO4 solution at
a scan rate of 50 mV/s. The electrochemically active surface area of the nanosheets was
calculated, from the hydrogen adsorption / desorption charge in the CV curve, between
-0.185V and 0.120 V (SCE) to be 67 m2/g after the correction of current background.
© 2010 Macmillan Publishers Limited. All rights reserved.
nature nanotechnology | www.nature.com/naturenanotechnology 25
SUPPLEMENTARY INFORMATIONdoi: 10.1038/nnano.2010.235
S25
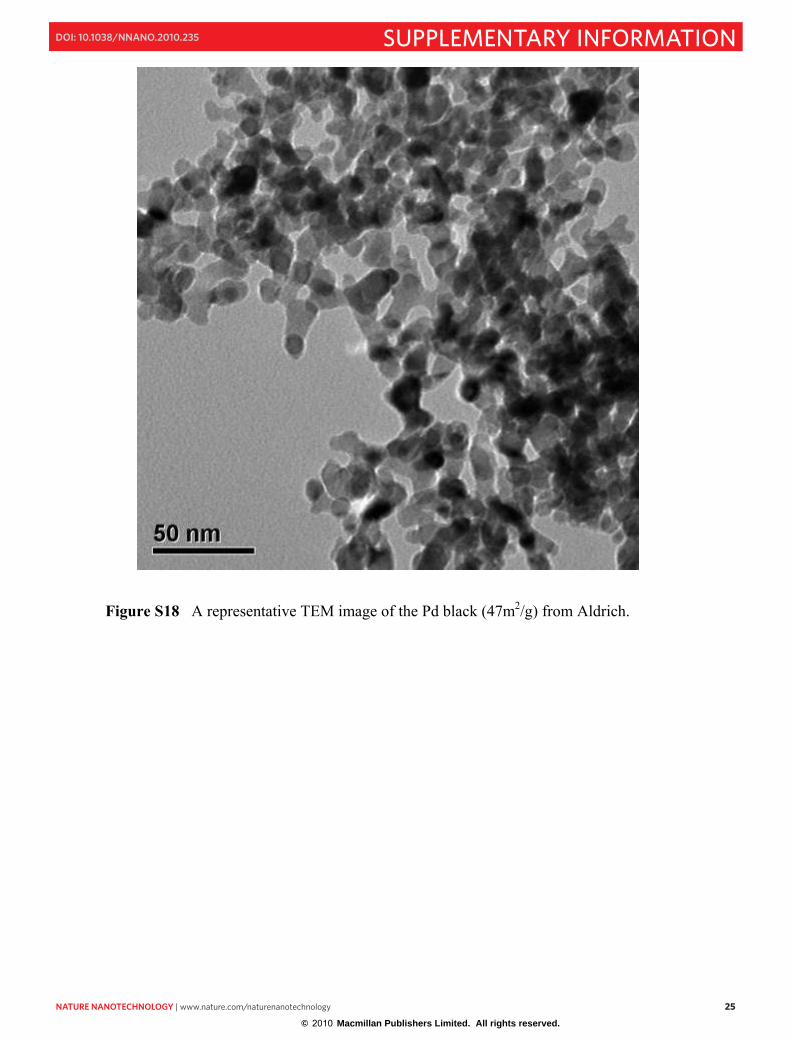
Figure S18 A representative TEM image of the Pd black (47m2/g) from Aldrich.
© 2010 Macmillan Publishers Limited. All rights reserved.

26 nature nanotechnology | www.nature.com/naturenanotechnology
SUPPLEMENTARY INFORMATION doi: 10.1038/nnano.2010.235
S26
Figure S19 Micrographs of liver cancer cells treated under different conditions: (a)
after 12-hr incubation with Pd nanosheets (20 μg/mL) but before any with a 2W 808-nm
laser (1.4 W / cm2). (b) after 12-hr incubation with Pd(II) (20 μg/mL) followed by 5-
min irradiation of 2W 808-nm laser (1.4 W / cm2). Trypan blue was used to stain the
dead cells before microscopic evaluations.
© 2010 Macmillan Publishers Limited. All rights reserved.

nature nanotechnology | www.nature.com/naturenanotechnology 27
SUPPLEMENTARY INFORMATIONdoi: 10.1038/nnano.2010.235
S27
Figure S20 Structure drawing of a hexagonal Pd nanosheet with CO molecules on the
(111) facets, Br- on the six side (100) facets and NBu4+ as the counter ions.
© 2010 Macmillan Publishers Limited. All rights reserved.