Freescale MPC551x/MPC56xx & ST SPC56 Nexus Trace … Probe MPC5xxx/MP… · Freescale...
19
_ V9.10.84 Technical Notes Freescale MPC551x/MPC56xx & ST SPC56 Nexus Trace iSYSTEM, April 2010 1/19 Contents Contents ................................................................................................................................................................... 1 1 Introduction ..................................................................................................................................................... 2 2 Nexus Trace..................................................................................................................................................... 4 2.1 e200z1 & e200z0 Nexus Trace Configuration .......................................................................................... 4 2.2 Nexus Trace Examples .............................................................................................................................. 6 2.3 Troubleshooting ...................................................................................................................................... 11 3 Profiler ........................................................................................................................................................... 12 3.1 Typical Use ............................................................................................................................................. 12 3.2 Troubleshooting ...................................................................................................................................... 16 4 Execution Coverage....................................................................................................................................... 17 4.1 Typical Use ............................................................................................................................................. 17
Transcript of Freescale MPC551x/MPC56xx & ST SPC56 Nexus Trace … Probe MPC5xxx/MP… · Freescale...

_ V9.10.84
Technical Notes
Freescale MPC551x/MPC56xx & ST SPC56 Nexus Trace
iSYSTEM, April 2010 1/19
Contents Contents................................................................................................................................................................... 1 1 Introduction ..................................................................................................................................................... 2 2 Nexus Trace..................................................................................................................................................... 4
2.1 e200z1 & e200z0 Nexus Trace Configuration .......................................................................................... 4 2.2 Nexus Trace Examples.............................................................................................................................. 6 2.3 Troubleshooting ...................................................................................................................................... 11
3 Profiler........................................................................................................................................................... 12 3.1 Typical Use ............................................................................................................................................. 12 3.2 Troubleshooting ...................................................................................................................................... 16
4 Execution Coverage....................................................................................................................................... 17 4.1 Typical Use ............................................................................................................................................. 17
iSYSTEM, April 2010 2/19
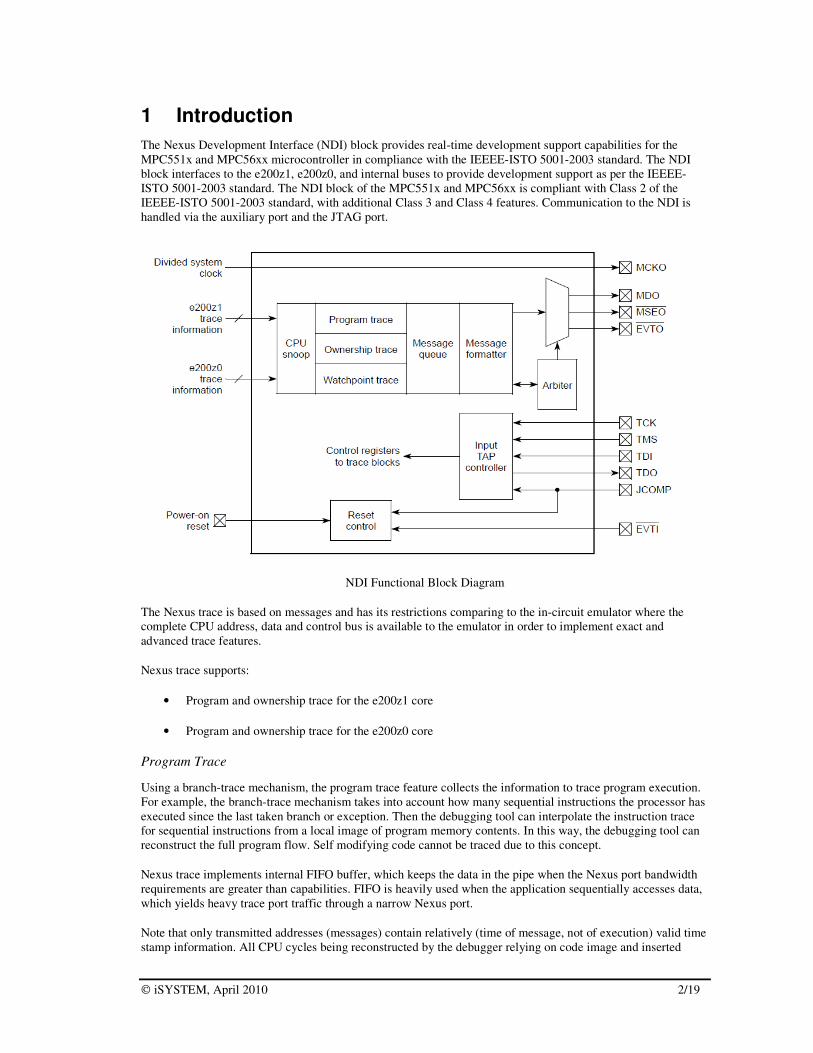
1 Introduction
The Nexus Development Interface (NDI) block provides real-time development support capabilities for the
MPC551x and MPC56xx microcontroller in compliance with the IEEEE-ISTO 5001-2003 standard. The NDI
block interfaces to the e200z1, e200z0, and internal buses to provide development support as per the IEEEE-
ISTO 5001-2003 standard. The NDI block of the MPC551x and MPC56xx is compliant with Class 2 of the
IEEEE-ISTO 5001-2003 standard, with additional Class 3 and Class 4 features. Communication to the NDI is
handled via the auxiliary port and the JTAG port.
NDI Functional Block Diagram
The Nexus trace is based on messages and has its restrictions comparing to the in-circuit emulator where the
complete CPU address, data and control bus is available to the emulator in order to implement exact and
advanced trace features.
Nexus trace supports:
• Program and ownership trace for the e200z1 core
• Program and ownership trace for the e200z0 core
Program Trace
Using a branch-trace mechanism, the program trace feature collects the information to trace program execution.
For example, the branch-trace mechanism takes into account how many sequential instructions the processor has
executed since the last taken branch or exception. Then the debugging tool can interpolate the instruction trace
for sequential instructions from a local image of program memory contents. In this way, the debugging tool can
reconstruct the full program flow. Self modifying code cannot be traced due to this concept.
Nexus trace implements internal FIFO buffer, which keeps the data in the pipe when the Nexus port bandwidth
requirements are greater than capabilities. FIFO is heavily used when the application sequentially accesses data,
which yields heavy trace port traffic through a narrow Nexus port.
Note that only transmitted addresses (messages) contain relatively (time of message, not of execution) valid time
stamp information. All CPU cycles being reconstructed by the debugger relying on code image and inserted

iSYSTEM, April 2010 3/19
between the recorded addresses, do not contain valid time information. Any interpolation with the recorded
addresses containing valid time stamp would be misleading for the user. Thereby, more frames displayed in the
trace window contain the same time stamp value.
Ownership Trace
Ownership trace is based on ownership trace messaging (OTM). OTM facilitates ownership trace by providing
visibility of which process ID or operating system task is activated. In practice, an operating system writes to the
process ID register (PID0), which yields an ownership trace message for every write. Then it’s up to the data
profiler to record these messages and display the task activities (task profiler).
MPC551x and MPC56xx Nexus Trace Features (iTRACE GT):
• External trace buffer
• Program and OTM Trace for e200z1 core
• Program and OTM Trace for e200z0 core
• AUX inputs
• Off-line Profiler
• Off-line Execution Coverage
iSYSTEM, April 2010 4/19
2 Nexus Trace
Default winIDEA instance allows debugging and tracing the main e200z1 core. A separate winIDEA instance is
open from the Debug/Core -> e200z0 (default winIDEA instance) in order to debug and trace the second e200z0
core.
Trace window is open from the View menu. Trace Trigger and Qualifier are set up in the Trace configuration
dialog which is open in the trace window through the Hardware Configuration toolbar.
2.1 e200z1 & e200z0 Nexus Trace Configuration
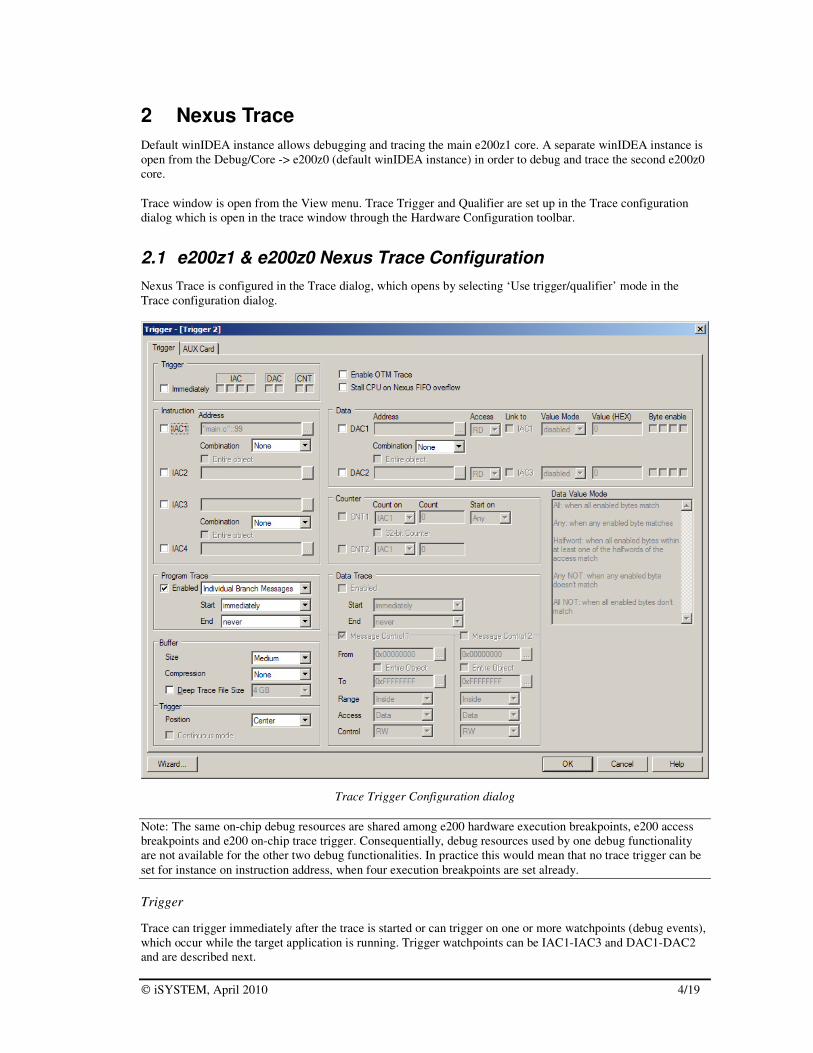
Nexus Trace is configured in the Trace dialog, which opens by selecting ‘Use trigger/qualifier’ mode in the
Trace configuration dialog.
Trace Trigger Configuration dialog
Note: The same on-chip debug resources are shared among e200 hardware execution breakpoints, e200 access
breakpoints and e200 on-chip trace trigger. Consequentially, debug resources used by one debug functionality
are not available for the other two debug functionalities. In practice this would mean that no trace trigger can be
set for instance on instruction address, when four execution breakpoints are set already.
Trigger
Trace can trigger immediately after the trace is started or can trigger on one or more watchpoints (debug events),
which occur while the target application is running. Trigger watchpoints can be IAC1-IAC3 and DAC1-DAC2
and are described next.

iSYSTEM, April 2010 5/19
Instruction
Four watchpoints (IAC1-IAC4) can be configured to trigger on executed instruction address (program counter
match). Four address matches, two address in/out range matches or two address matches where address can be
additionally masked, can be configured.
Data
Two watchpoints (DAC1, DAC2) can be configured to trigger on accessed data address. Besides the access type,
two address matches, one data address in/out range match or one address match where address can be
additionally masked, can be configured.
In case of MPC56xx derivatives, data address can be also combined with the data value while the data value
comparison is not available for the MPC551x devices.
When ‘Link to’ option is checked, configured data access is further conditional on instruction defined by
IAC1/IAC3 watchpoint. In practice, the user can restrict trigger on data access caused by an explicit instruction.
Note: Data accesses are not visible in the trace since data trace is not supported.
Program Trace
Program trace is enabled by default. Most often setting for the Start is ‘immediately’ and for the ‘End’ is
‘never’. However, user can select any of the previously described watchpoints to act as Start or End condition on
match.
There are two types of messages, which can be used for the Nexus program trace protocol. ‘Individual Branch
Messages’ yield more information about program execution than the ‘Branch History Messages’ setting. Major
advantage of the ‘Individual Branch Messages’ setting is more accurate time information but it requires more
Nexus port bandwidth, which means that the Nexus trace is more subject to the overflows, which are depicted in
the trace window when they occur. In case of overflows, program reconstruction in the trace window resumes
with next valid Nexus trace message.
OTM Trace
Enable OTM Trace, when writes to the process ID register should be recorded.
Buffer Size
Buffer Size determines the depth of the trace buffer. It’s recommended to use minimum buffer size which results
in faster trace upload time and smaller trace file.
Buffer Compression
By turning on the compression, longer recording times can be obtained with the trace but at the same time some
time information is lost. The higher the compression is selected, more messages from the Nexus trace stream get
the same time stamp information, which consequentially yields more instructions with the same time stamp
information in the trace window. Using the compression is a good option, as long as the time information is less
important than the amount of recorded program, which may help troubleshooting a specific problem. The higher
the compression is selected, less detail time information on program execution is displayed.

iSYSTEM, April 2010 6/19
Trigger Position
Depending on the needs, trigger can be located at the beginning, in the center or at the end of the trace buffer.
Note that the trigger position is not configurable for minimum buffer. If the user intends to analyze the trace
record after the trigger, it makes sense to use ‘Begin’ trigger position and ‘End’ trigger position when the trace
pre-history that is program behavior before trigger is required.
Continuous mode
Continuous mode keeps recording program execution until the CPU or trace is manually stopped. Normally, the
trace records only until the trace buffer is full. This option should be checked, when it’s required to analyze
program behavior just before the CPU is stopped Additionally, the Trigger should be set to ‘Immediately’ in
such configuration.
2.2 Nexus Trace Examples
Keep default ‘Nexus’ selected in the ‘Hardware/Analyzer Setup’ dialog.
Default trace configuration is used to record the continuous program flow either from the program start on or up
to the moment, when the program stops.
The trace can start recording on the initial program start from the reset or after resuming the program from the
breakpoint location. The trace records and displays program flow from the start until the trace buffer fulfills.
As an alternative, the trace can stop recording on a program stop. ‘Continuous mode’ allows roll over of the trace
buffer, which results in the trace recording up to the moment when the application stops. In practice, the trace
displays the program flow just before the program stops, for instance, due to a breakpoint hit or due to a stop
debug command issued by the user.
Example: The application behavior needs to be analyzed without any intrusion on the CPU execution. The trace
should display program execution just before the CPU is stopped by debug stop command.
• Select ‘Record everything’ operation type in the ‘Trace configuration’ dialog and make sure that
‘Continuous mode’ option is checked to ensure that the trace buffer rolls over while recording the
running program. The trace will stop as soon as the CPU is stopped. Note that this ‘Record everything’
operation type always apply for the e200 trace.
• Select minimum or maximum buffer size depending on the required depth of the trace record. Have in
mind that the minimum buffer uploads faster than the maximum.
iSYSTEM, April 2010 7/19
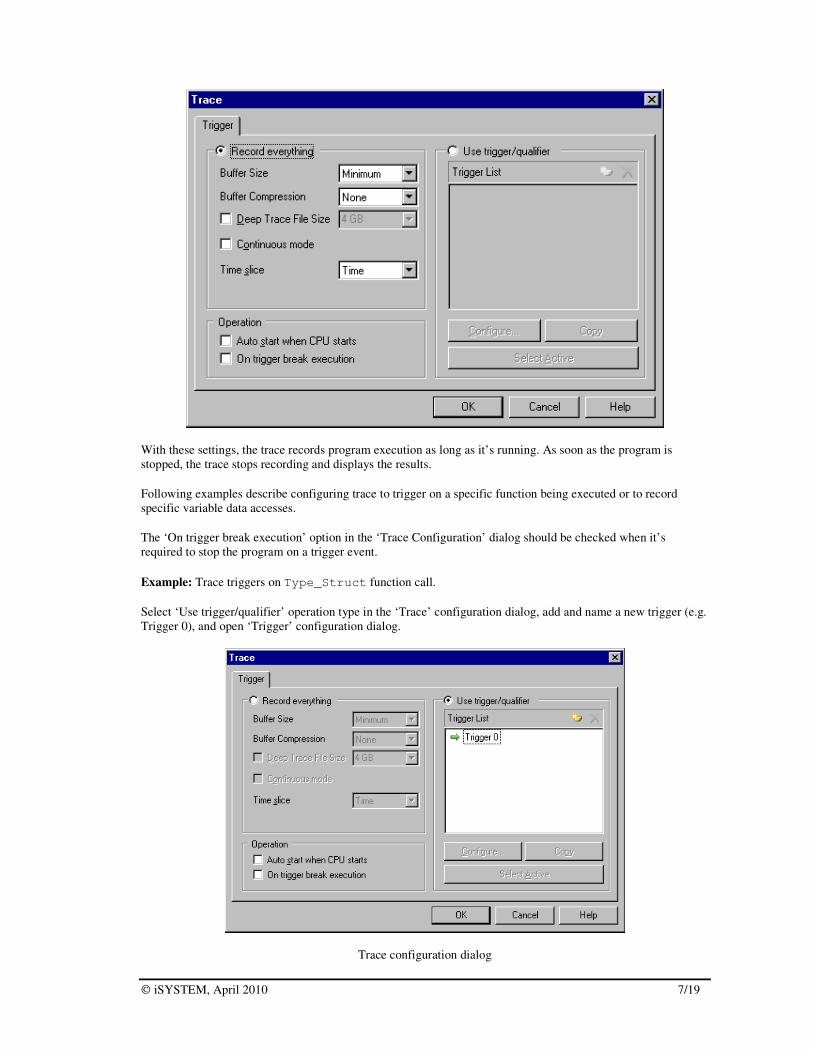
With these settings, the trace records program execution as long as it’s running. As soon as the program is
stopped, the trace stops recording and displays the results.
Following examples describe configuring trace to trigger on a specific function being executed or to record
specific variable data accesses.
The ‘On trigger break execution’ option in the ‘Trace Configuration’ dialog should be checked when it’s
required to stop the program on a trigger event.
Example: Trace triggers on Type_Struct function call.
Select ‘Use trigger/qualifier’ operation type in the ‘Trace’ configuration dialog, add and name a new trigger (e.g.
Trigger 0), and open ‘Trigger’ configuration dialog.
Trace configuration dialog

iSYSTEM, April 2010 8/19
Trigger configuration dialog
Due to the relatively complex Trigger configuration dialog, it is recommended to use the Wizard, which is open
by pressing the ‘Wizard…’ button in the left bottom corner.
In first step, select ‘Simple Event’ for the Select Trigger Scenario.

iSYSTEM, April 2010 9/19
In second step, select ‘Execution of Code’ for the Select Event.
In the third step, specify Code Address.

iSYSTEM, April 2010 10/19
In the next step, keep the default setting ‘All - Program Flow’.
In the final step press Finish.
The trace is configured. The user can also change the size of working trace buffer and the trigger position in the
Trigger configuration dialog. Run the application and start the trace. After the trace triggers, the results are
uploaded and displayed. Let’s inspect the results. Trigger point can be found around frame 0 and marked as
‘Watchpoint’ in the Content bus.
iSYSTEM, April 2010 11/19
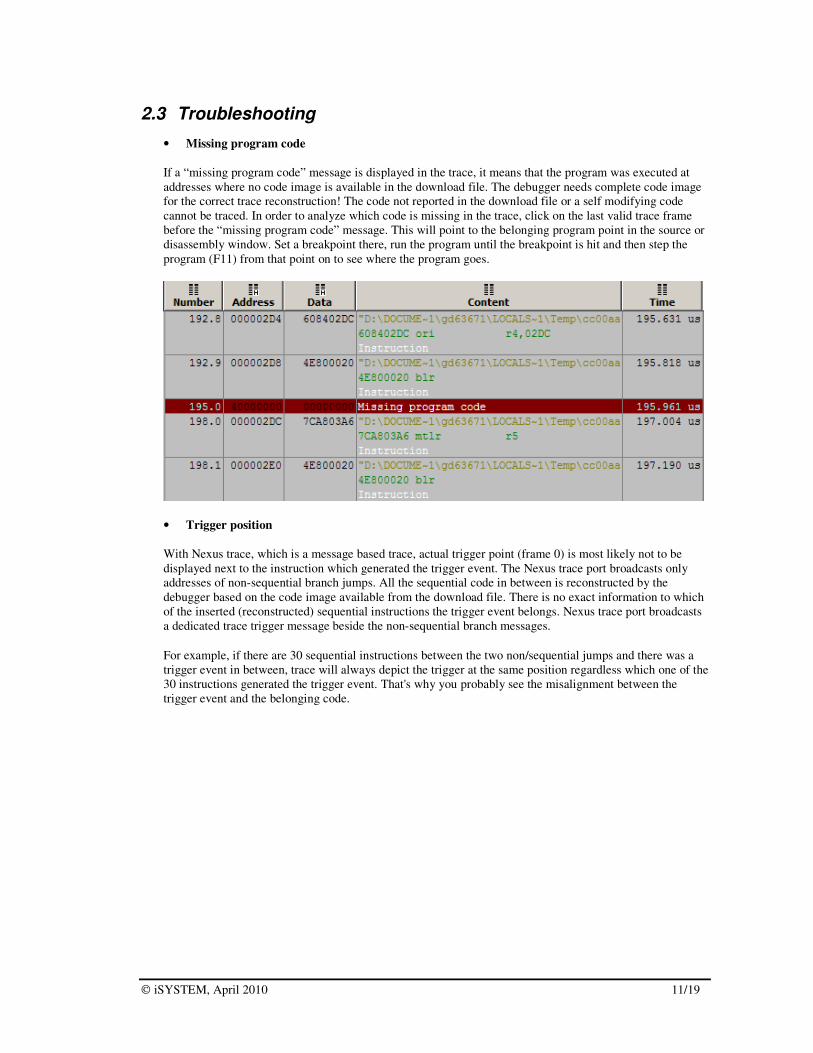
2.3 Troubleshooting
• Missing program code
If a “missing program code” message is displayed in the trace, it means that the program was executed at
addresses where no code image is available in the download file. The debugger needs complete code image
for the correct trace reconstruction! The code not reported in the download file or a self modifying code
cannot be traced. In order to analyze which code is missing in the trace, click on the last valid trace frame
before the “missing program code” message. This will point to the belonging program point in the source or
disassembly window. Set a breakpoint there, run the program until the breakpoint is hit and then step the
program (F11) from that point on to see where the program goes.
• Trigger position
With Nexus trace, which is a message based trace, actual trigger point (frame 0) is most likely not to be
displayed next to the instruction which generated the trigger event. The Nexus trace port broadcasts only
addresses of non-sequential branch jumps. All the sequential code in between is reconstructed by the
debugger based on the code image available from the download file. There is no exact information to which
of the inserted (reconstructed) sequential instructions the trigger event belongs. Nexus trace port broadcasts
a dedicated trace trigger message beside the non-sequential branch messages.
For example, if there are 30 sequential instructions between the two non/sequential jumps and there was a
trigger event in between, trace will always depict the trigger at the same position regardless which one of the
30 instructions generated the trigger event. That's why you probably see the misalignment between the
trigger event and the belonging code.

iSYSTEM, April 2010 12/19
3 Profiler
From the functional point of view, profiler can be used to profile functions and/or data.
• Functions Profiler
Functions profiler helps identifying performance bottlenecks. The user can find which functions are most
time consuming or time critical and need to be optimized.
Its functionality is based on the trace, recording entries and exits from profiled functions. A profiler area can
be any section of code with a single entry point and one or more exit points. Existing functions profiler
concept does not support exiting two or more functions through the same exit point. Exit point can belong to
one function only. In such cases, the application needs to be modified to comply with this rule or
alternatively data profiler with code arming can be used in order to obtain functions profiler results.
The nature of the functions profiler requires quality high-level debug information containing addresses of
function entry and exit points, or such areas must be setup manually. Profiler recordings are statistically
processed and for each function the following information is calculated:
- total execution time
- minimum, maximum and average execution time
- number of executions/calls
- minimum, maximum and average period between calls
• Data Profiler
While functions profiler is based on analyzing code execution, data profiler performs time statistics on the
profiled data objects, which are typically global variables. Typical use cases are task profiler and functions
profiler based on code instrumentation.
When an operating system is used in the application, task profiler can be used to analyze task switching.
When the task profiler is used in conjunction with the functions profiler, functions’ execution can be
analyzed for each task individually.
In respect to the Data Profiler, the MPC551x and MPC56xx development system features only a so called
OTM profiler since no data trace is available.
The MPC551x and MPC56xx development system features a so called off-line profiler. Off-line profiler is
entirely based on the trace record. It first uses trace to record a complete program flow and then off-line function
entry and exit points are extracted by means of software, the statistic is run over the collected information and
finally the results are displayed.
Refer to a separate document titled Profiler User's Guide for more details on profiler and its use.
Trace, Profiler and Execution Coverage functionalities cannot be used at the same time since they are all based
on the trace. Single functionality can be used at the time only.
3.1 Typical Use
To use off-line profiler, keep default ‘Nexus’ trace operation mode and select working profiler buffer size in the
‘Hardware/Analyzer Setup’ dialog. Any value between 1 and 100 (% of maximum buffer) can be entered for the
buffer size. Keep ‘Buffer Compression’ set to ‘None’ for the most time accurate results. If you want to capture
more execution time, use one of the available buffer compression factors. The higher the compression factor,
more execution time can be captured but at the same it’s more likely that the time measurements will be less
accurate.

iSYSTEM, April 2010 13/19
Next, select ‘Profiler’ window from the View menu and configure profiler settings. Select ‘Functions’ option in
the ‘Profile’ field when profiling functions.
When using functions profiler in the application with an operating system, the task switch (task ID) absolutely
and unconditionally must be profiled too! Task switch is then profiled via OTM profiler.
Operating system (OS) awareness is configured in the ‘Debug/Operating System’ dialog. In case of OSEK
operating system, debugger requires a so called orti file (.ort), which is generated by the OSEK and contains all
viable information for debugger’s OS awareness.

iSYSTEM, April 2010 14/19
Make sure that only ‘Tasks (RUNNING TASK)’ selection is checked in the ‘Profile these OS objects’ field.
Otherwise profiler will report the following profiler error: “2: Configuration error: Too many Data Areas
defined”.
Note: ORTI file must match with the download code. Any misalignment will yield wrong profiler results.
If the application doesn’t use any operating system, skip the OS awareness and OTM profiler configuration.
In case of MPC551x and MPC56xx, OS task switch can be profiled only by using the OTM profiler since a
standard data profiler is not supported due to the lack of the data trace. For that reason, if necessary the operating
system code needs to be adjusted.
Typically with the OSEK, there is a PreTaskHook function in which the operating system should write an 8-bit
value to the CPU PID (process ID) register whenever the new task is called. Every write to the PID register
generates an OTM message in the trace and therefore this type of data profiler is also called OTM profiler. If
also task Idle time is to be profiled separately from the task active time, OS can also write a special 'invalid ID'
to the PID register when the active task is exited - typically in the PostTaskHook function.
Note: Only lower 8-bits of a written value into the PID register can be traced via OTM.
Once OS writes to the PID register on every task switch, the OTM profiler can be configured and functions
profiler used properly.
The picture above shows the necessary profiler setting for the application featuring operating system. Refer also
to the Profiler User’s Guide for more details on profiler settings and use.
Note that in this particular case it is not obligatory to check the option left to the ‘OTM…’ button to use the
OTM profiler. OTM profiler is preconfigured for task profiling by the debugger as soon as the OS awareness is
configured in the Operating System dialog, accessible through the ‘Debug/Operating System’ menu or through
the ‘OS Setup…’ button within the Profiler configuration dialog.

iSYSTEM, April 2010 15/19
Check the ‘Keep history’ option if History view is going to be used during the results analysis. If the option is
unchecked, all recorded profiler data are discarded after the statistic information is calculated and history view
shows no results. Even when the option is checked, history view shows functions’ calls in respect to the time just
for some amount of time and from some point on this information is no longer displayed. It is so by the design,
otherwise the profiler capture time would be shortened due the slower trace buffer upload.
Finally, profiled functions are selected by pressing ‘New…’ button. It’s recommended that ‘All Functions’
option is selected for the beginning.
The debugger extracts all the necessary information from the debug info, which is included in the download file
and configure hardware accordingly.
Profiler configuration settings (no operating system)
Profiler is configured. Reset the application, start Profiler and run the application. The Profiler will stop
recording data on a user demand or after the profiler buffer becomes full. While the buffer is uploaded, the
recorded information is analyzed and profiler results displayed.
Statistics view
iSYSTEM, April 2010 16/19
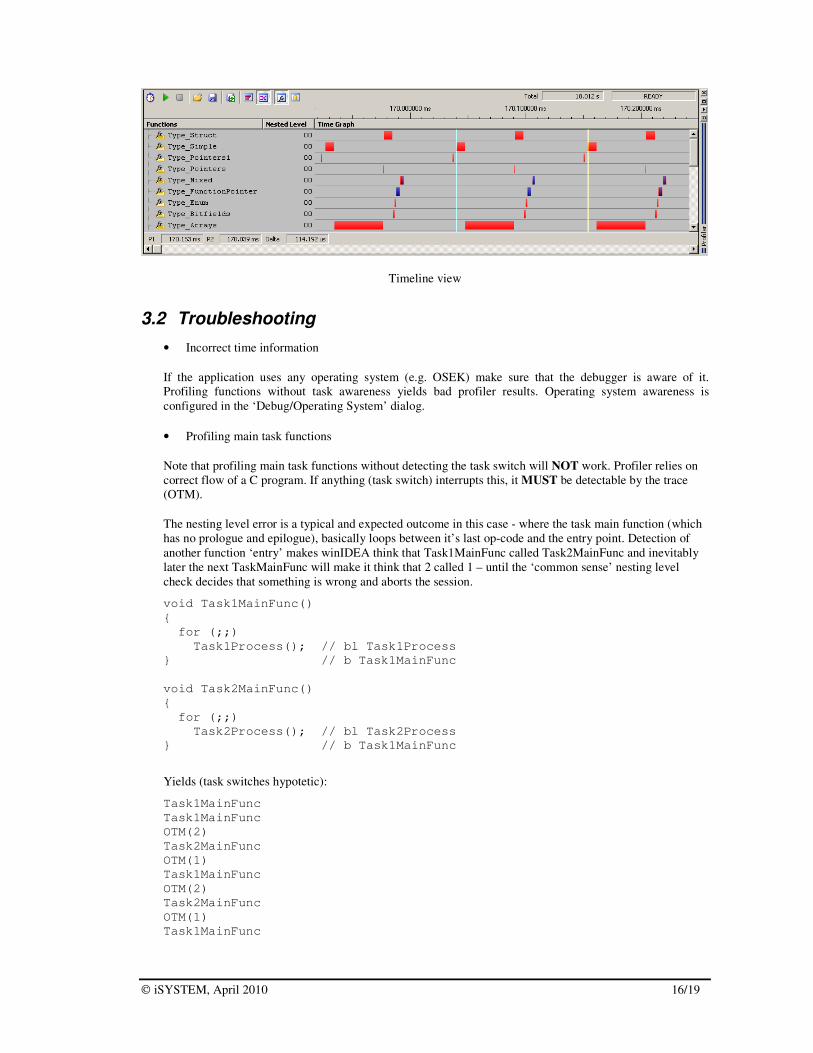
Timeline view
3.2 Troubleshooting
• Incorrect time information
If the application uses any operating system (e.g. OSEK) make sure that the debugger is aware of it.
Profiling functions without task awareness yields bad profiler results. Operating system awareness is
configured in the ‘Debug/Operating System’ dialog.
• Profiling main task functions
Note that profiling main task functions without detecting the task switch will NOT work. Profiler relies on
correct flow of a C program. If anything (task switch) interrupts this, it MUST be detectable by the trace
(OTM).
The nesting level error is a typical and expected outcome in this case - where the task main function (which
has no prologue and epilogue), basically loops between it’s last op-code and the entry point. Detection of
another function ‘entry’ makes winIDEA think that Task1MainFunc called Task2MainFunc and inevitably
later the next TaskMainFunc will make it think that 2 called 1 – until the ‘common sense’ nesting level
check decides that something is wrong and aborts the session.
void Task1MainFunc()
{
for (;;)
Task1Process(); // bl Task1Process
} // b Task1MainFunc
void Task2MainFunc()
{
for (;;)
Task2Process(); // bl Task2Process
} // b Task1MainFunc
Yields (task switches hypotetic):
Task1MainFunc
Task1MainFunc
OTM(2)
Task2MainFunc
OTM(1)
Task1MainFunc
OTM(2)
Task2MainFunc
OTM(1)
Task1MainFunc

iSYSTEM, April 2010 17/19
winIDEA knows (through code analysis) that Task1MainFunc jumps on its own entry point and does not
consider this a recursive call. But if the OTMs are not there, then winIDEA sees this sequence and suspects
that:
Task1MainFunc
Task1MainFunc
Task2MainFunc // Task1MainFunc called Task2MainFunc
Task1MainFunc // Task2MainFunc called Task1MainFunc
Task2MainFunc // Task1MainFunc called Task2MainFunc
Task1MainFunc // Task2MainFunc called Task1MainFunc
Once this nesting reaches 10 levels, winIDEA aborts the session.
4 Execution Coverage
Execution coverage records all addresses being executed, which allows the user to detect the code or memory
areas not executed. It can be used to detect the so called “dead code”, the code that was never executed. Such
code represents undesired overhead when assigning code memory resources.
The development system features a so called off-line execution coverage and real-time execution coverage.
Off-line execution coverage is entirely based on the trace record. It first uses trace to record the executed code
(capture time is limited by the trace depth) and then offline executed instructions and source lines are extracted
by means of software and finally the results displayed.
Off-line execution coverage tests the code for two metrics: statement coverage and decision coverage
Refer to a separate Execution Coverage User’s Guide for more details on execution coverage configuration and
use.
Trace, Profiler and Execution Coverage functionalities cannot be used at the same time since they are all based
on the trace. Single functionality can be used at the time only
4.1 Typical Use
To use off-line execution coverage, keep default ‘Nexus’ trace operation mode and set working execution
coverage buffer size in the ‘Hardware/Analyzer Setup’ dialog.

iSYSTEM, April 2010 18/19
Next, select ‘Execution Coverage’ window from the View menu and configure Execution Coverage settings.
Normally, ‘All Downloaded Code’ option has to be checked only. The debugger extracts all the necessary
information like addresses belonging to each C/C++ function from the debug info, which is included in the
download file and configure hardware accordingly.
Execution Coverage is configured. Reset the application, start Execution Coverage and then run the application.
The debugger uploads the results when the trace buffer becomes full or when requested by the user.

iSYSTEM, April 2010 19/19
Execution Coverage results
Disclaimer: iSYSTEM assumes no responsibility for any errors which may appear in this document, reserves the
right to change devices or specifications detailed herein at any time without notice, and does not make any
commitment to update the information herein.
iSYSTEM. All rights reserved.