FREE RESPONSE AND TRIM FORCE REQUIREMENTS FOR …
83
FREE RESPONSE AND TRIM FORCE REQUIREMENTS FOR AIRCRAFT CONFIGURATION CHANGES Marvin Toepfer Bachelor of Science Aerospace Engineering Florida Institute of Technology A thesis submitted to the College of Engineering and Sciences at Florida Institute of Technology in partial fulfillment of the requirements for the degree of Master of Science in Flight Test Engineering Melbourne, Florida December, 2018
Transcript of FREE RESPONSE AND TRIM FORCE REQUIREMENTS FOR …

FREE RESPONSE AND TRIM FORCE REQUIREMENTS FOR AIRCRAFT
CONFIGURATION CHANGES
Marvin Toepfer
Bachelor of Science Aerospace Engineering
Florida Institute of Technology
A thesis submitted to the College of Engineering and Sciences at
Florida Institute of Technology in partial fulfillment of the requirements
for the degree of
Master of Science in
Flight Test Engineering
Melbourne, Florida December, 2018

© Copyright 2018 Marvin Toepfer All Rights Reserved
The author grants permission to make single copies ___________________
We the undersigned committee hereby recommend that the attached document be accepted as fulfilling
in part of the requirements for the degree of Master of Science in Flight Test Engineering
Free Response and Trim Force Requirements for Aircraft Configuration Changes
A thesis by Marvin Toepfer
_______________________________________________ Brian A. Kish, Ph.D. Assistant Professor and Chair, Flight Test Engineering Aerospace, Physics, and Space Sciences _______________________________________________ Ralph D. Kimberlin, Dr.-Ing Professor Aerospace, Physics, and Space Sciences _______________________________________________ Stephen K. Cusick, J.D. Associate Professor College of Aeronautics _______________________________________________ Daniel Batcheldor, Ph.D. Professor and Department Head Aerospace, Physics, and Space Sciences

iv
Abstract
Free Response and Trim Force Requirements for Aircraft Configuration Changes
Marvin Toepfer, B.S.
Advisor: Brian A. Kish, Ph.D.
As an FAA Commercial Pilot and Flight Instructor, one comes in contact with
many different types of experiences and abnormal situations. A widely known
cause of fatal accidents in the general aviation industry, and also currently listed on
the National Transportation Safety Board Most Wanted List, is the loss of control
in the traffic pattern [1]. For many years now, different departments of the FAA
and Department of Transportation, such as the FAA Small Airplane Directorate,
have been trying to mitigate the risks and causes associated with the loss of control
in the traffic pattern. Due to technological advancements and an improving
knowledge in this area, it has become more and more clear what the issues are that
cause these fatal accidents. Using these experiences to rewrite the Part 23
Regulations will hopefully improve the statistics and prevent future loss of control
accidents from happening as frequent as they do. This thesis presents different
concepts and procedures used to compare trim force changes and the aircraft free
response after a change in flap configuration. In order to satisfactorily complete this
research, measurements in five different aircraft were taken, focusing on the control
forces required after extending the flaps, or while retracting the flaps and
completing a go-around procedure. Additionally, the free response of the aircraft
was recorded when extending the flaps, or retracting the flaps with the addition of
adding go-around power. Completing these tests will give a better idea of the
operation safety of the aircraft, and which areas might need to be redefined in the
Part 23 Regulations to enhance the safety of the General Aviation industry and their
pilots.
v
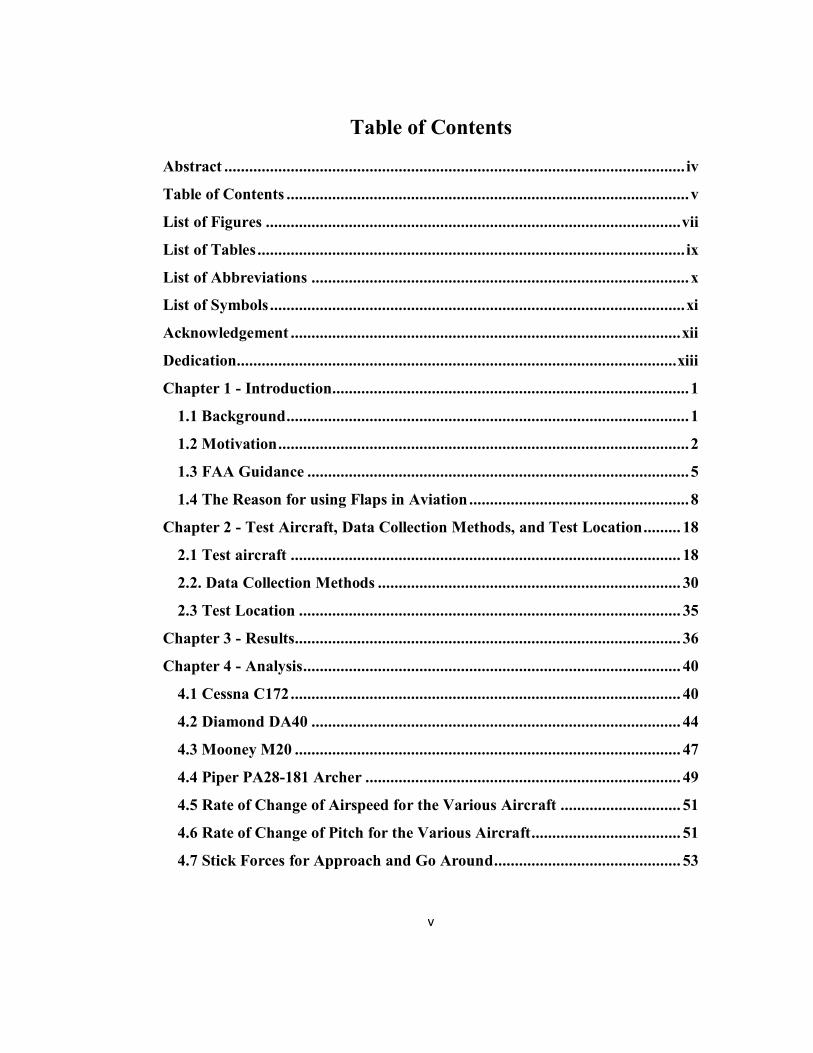
Table of Contents
Abstract ............................................................................................................... iv
Table of Contents ................................................................................................. v
List of Figures .................................................................................................... vii
List of Tables ....................................................................................................... ix
List of Abbreviations ........................................................................................... x
List of Symbols .................................................................................................... xi
Acknowledgement .............................................................................................. xii
Dedication.......................................................................................................... xiii
Chapter 1 - Introduction ...................................................................................... 1
1.1 Background ................................................................................................. 1
1.2 Motivation ................................................................................................... 2
1.3 FAA Guidance ............................................................................................ 5
1.4 The Reason for using Flaps in Aviation ..................................................... 8
Chapter 2 - Test Aircraft, Data Collection Methods, and Test Location ......... 18
2.1 Test aircraft .............................................................................................. 18
2.2. Data Collection Methods ......................................................................... 30
2.3 Test Location ............................................................................................ 35
Chapter 3 - Results ............................................................................................. 36
Chapter 4 - Analysis ........................................................................................... 40
4.1 Cessna C172 .............................................................................................. 40
4.2 Diamond DA40 ......................................................................................... 44
4.3 Mooney M20 ............................................................................................. 47
4.4 Piper PA28-181 Archer ............................................................................ 49
4.5 Rate of Change of Airspeed for the Various Aircraft ............................. 51
4.6 Rate of Change of Pitch for the Various Aircraft.................................... 51
4.7 Stick Forces for Approach and Go Around ............................................. 53

vi
4.8 Effects of Downwash on Aircraft Response ............................................. 55
Chapter 5 - Discussion on Loss of Control ........................................................ 57
Chapter 6 - Conclusion ...................................................................................... 61
References .......................................................................................................... 62
Appendix: Collected Data .................................................................................. 63
vii
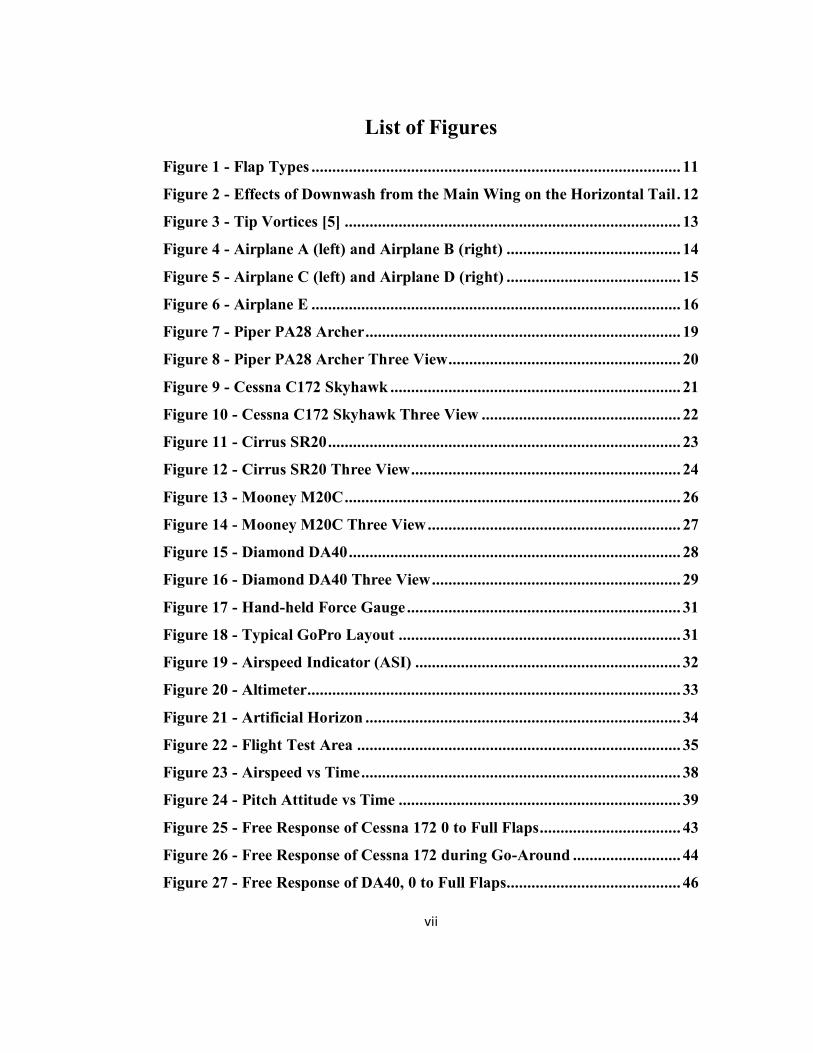
List of Figures
Figure 1 - Flap Types ......................................................................................... 11
Figure 2 - Effects of Downwash from the Main Wing on the Horizontal Tail . 12
Figure 3 - Tip Vortices [5] ................................................................................. 13
Figure 4 - Airplane A (left) and Airplane B (right) .......................................... 14
Figure 5 - Airplane C (left) and Airplane D (right) .......................................... 15
Figure 6 - Airplane E ......................................................................................... 16
Figure 7 - Piper PA28 Archer ............................................................................ 19
Figure 8 - Piper PA28 Archer Three View ........................................................ 20
Figure 9 - Cessna C172 Skyhawk ...................................................................... 21
Figure 10 - Cessna C172 Skyhawk Three View ................................................ 22
Figure 11 - Cirrus SR20 ..................................................................................... 23
Figure 12 - Cirrus SR20 Three View ................................................................. 24
Figure 13 - Mooney M20C ................................................................................. 26
Figure 14 - Mooney M20C Three View ............................................................. 27
Figure 15 - Diamond DA40 ................................................................................ 28
Figure 16 - Diamond DA40 Three View ............................................................ 29
Figure 17 - Hand-held Force Gauge .................................................................. 31
Figure 18 - Typical GoPro Layout .................................................................... 31
Figure 19 - Airspeed Indicator (ASI) ................................................................ 32
Figure 20 - Altimeter .......................................................................................... 33
Figure 21 - Artificial Horizon ............................................................................ 34
Figure 22 - Flight Test Area .............................................................................. 35
Figure 23 - Airspeed vs Time ............................................................................. 38
Figure 24 - Pitch Attitude vs Time .................................................................... 39
Figure 25 - Free Response of Cessna 172 0 to Full Flaps .................................. 43
Figure 26 - Free Response of Cessna 172 during Go-Around .......................... 44
Figure 27 - Free Response of DA40, 0 to Full Flaps.......................................... 46

viii
Figure 28 - Free Response of DA 40 during Go-Around .................................. 47
Figure 29 - Free Response of PA28 for 0 to Full Flaps ..................................... 50
Figure 30 - Free Response of PA28 in Go-Around ........................................... 50

ix
List of Tables
Table 1 - CFR §23.143(c) Control Force Requirements ..................................... 6
Table 2 - Required Stick Forces for Approach configuration .......................... 36
Table 3 - Required Stick Forces for Go-Around .............................................. 37
Table 4 - Free Response Slopes after Full Flap Extension ............................... 39
Table 5 - Flaps 0-40 for Cessna C172 ................................................................ 63
Table 6 - Flaps 0-Fully extended for Diamond DA40 ....................................... 64
Table 7 - Flaps 0-Fully extended for Mooney M20C ........................................ 65
Table 8 - Flaps 0-10 for Piper PA28 Archer ..................................................... 66
Table 9 - Flaps 10-25 for Piper PA28 Archer ................................................... 67
Table 10 - Flaps 25-40 for Piper PA28 Archer.................................................. 68
Table 11 - Flaps 0-40 for Piper PA28 Archer ................................................... 69

x
List of Abbreviations
A.C. Aerodynamic Center AHRS Attitude Heading Reference System ATIS Automatic Terminal Information Service C.G. Center of Gravity DAQ Data Acquisition FAA Federal Aviation Administration FAR Federal Aviation Regulation POH Pilot Operating Handbook PIM Pilot Information Manual FIT Florida Institute of Technology FTE Flight Test Engineer FTP Flight Test Pilot LOC Loss of Control KIAS Knots Indicated Airspeed NTSB National Transportation Safety Board NASA National Aeronautics and Space
Administration PIC Pilot in Command
RPM Engine Revolutions per Minute Lbs Weight in Pounds Min Time in Minutes

xi
List of Symbols
VS0 Stall speed in landing configuration VS1 Stall speed in clean configuration VFE Maximum speed for flaps extended
xii
Acknowledgement
I would like express a big thank you to my academic advisor and program chair of
the FTE department, Brian Kish, without whom I could have never made it through
my coursework and research. He has supported me throughout my endless
questions and provided me with insightful information throughout my grad school
career.
I would also like to thank Dr. Ralph Kimberlin, who has also been part of my
graduate thesis committee, and who has taught me many interesting things about
Flight Test throughout the courses that I have taken with him.
An additional big thank you to Dr. Stephen Cusick, who has also agreed to be part
of this thesis committee. Dr. Cusick has motivated me to not undersell myself in
my future career endeavors, and has been a person who has gotten me interested in
other areas of the Aviation Industry. I would also like to thank all the other
professors who have guided me throughout my undergraduate and graduate years
here at Florida Tech. I would have not come this far without you all.
xiii
Dedication
"Ich hätte es freilich zu nichts bringen können, wenn nicht vorausgegangen
wäre, was ich den Eltern zu verdanken habe: allein daraus folgt nicht, daß alles,
wozu ich es gebracht habe, geringer sei, als dasjenige, ohne welches ich nichts
hätte ausrichten können."
Lucius Annaeus Seneca (ca 4 v. Chr. - 65 n. Chr.)
I would like to dedicate this work to my parents, without who I would have never
been able to get to this point. The parents who have given me an understanding of
how important a lifelong learning is and how I am able to use my strengths to
succeed in what I love to do.
At this point in my life, I might be considered to be an adult, even though I do not
yet feel like one. As I have been growing up, I have realized more and more of just
how much they have done for me. And, for that, I truly need to thank them - which
I do not believe I have properly done till this day.
Dad, I would like to thank you for always telling me what I am capable of. For
giving me the support that was needed to follow my dream of becoming both an
engineer and a pilot, and also for believing in my talent to reach my goals.
Mom, I would like to thank you for putting up with me during my endless phone
calls, every day of every week. For always knowing what was best, and for always
being someone to talk to when school seemed to be too overwhelming.
Dad, thank you for always getting mad at me when I did not put in enough work for
school, for always making sure I did the best I possibly could, and for always
making sure I got my assignments done properly and on time.

xiv
Finally, mom, thank you for your personality, for always laughing, for sharing your
sense of humor, and your excitement for every experience.
Without any of you, I would have not made it this far. I am still working hard to
become as great of a person as you, and hope that if one day I will have kids, I will
be as great of a parent as you were to me.

1
Chapter 1
Introduction
1.1 Background
As a flight instructor, I have had many encounters with students, that have not
properly understood the concepts and effects that are associated with either
extending or retracting the flaps on the aircraft. This will often cause response
issues in critical phases of flight, such as take-off and landing phases.
In many cases, take-off and landing phases require the pilot to input a certain
amount of flaps. Whether or not it is to create an additional amount of lift for take-
off, or in order to create more drag, to increase descent rate without increasing the
aircraft speed for landing. In either of these two cases, it can be noticed that pilots
are not properly being trained, or do not have the sufficient amount of flight
experience to properly respond to flap inputs, often leading to sloppy take-off and
landing procedures, or in worse cases even to the loss of control resulting in fatal
aircraft accidents. Therefore, it is important that student pilots are properly trained
in the areas of operation for such flight phases, including the proper use of the trim
feature, which will assist the pilot in handling the aircraft during any phases of
flight.
The purpose of trimming is to free the pilot from having to exert a constant
pressure on the controls. This is often used to maintain straight and level flight.
However, trimming can also be used during any phase of flight - for example to
maintain a constant rate of climb or descent.
The most basic form, as found on most light aircraft, is elevator trim. Usually
operated by a wheel, it moves the elevator up or down by a small amount in the
same sense as the yoke (back to go up, forward to go down). This can be used to
2
settle the aircraft into straight and level flight, so that the pilot does not need to
constantly exert a force on the yoke to maintain the aircraft flight path.
Another form of trim is rudder trim, which in our case, will not be examined as
much in this thesis. Often found in larger light aircraft and twin-engine aircraft, it
can be used to adjust for a crosswind to keep the aircraft flying straight. On multi-
engine aircraft it can also be used to trim out the differential thrust caused by one
engine being inoperative.
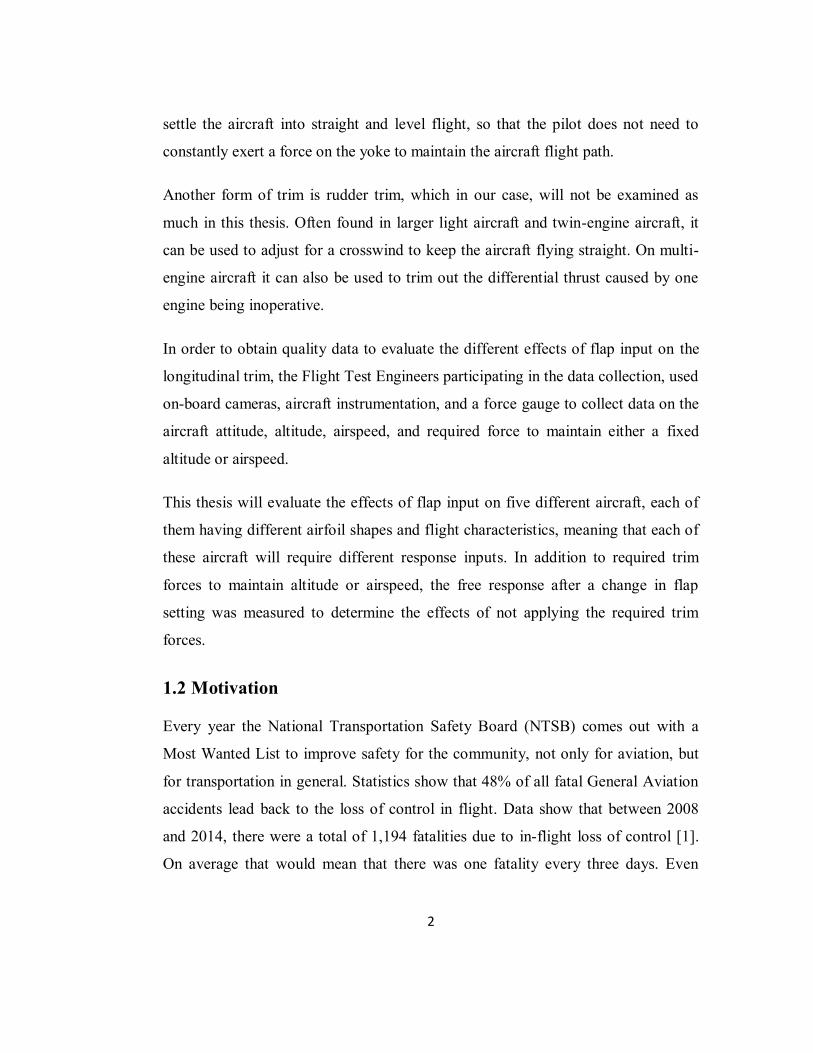
In order to obtain quality data to evaluate the different effects of flap input on the
longitudinal trim, the Flight Test Engineers participating in the data collection, used
on-board cameras, aircraft instrumentation, and a force gauge to collect data on the
aircraft attitude, altitude, airspeed, and required force to maintain either a fixed
altitude or airspeed.
This thesis will evaluate the effects of flap input on five different aircraft, each of
them having different airfoil shapes and flight characteristics, meaning that each of
these aircraft will require different response inputs. In addition to required trim
forces to maintain altitude or airspeed, the free response after a change in flap
setting was measured to determine the effects of not applying the required trim
forces.
1.2 Motivation
Every year the National Transportation Safety Board (NTSB) comes out with a
Most Wanted List to improve safety for the community, not only for aviation, but
for transportation in general. Statistics show that 48% of all fatal General Aviation
accidents lead back to the loss of control in flight. Data show that between 2008
and 2014, there were a total of 1,194 fatalities due to in-flight loss of control [1].
On average that would mean that there was one fatality every three days. Even
3
though aviation is considered to be one of the safest transportation methods to this
date, there are still many improvements that can be made, especially with the
technological capabilities of today's society. It is known one of the three main
causes of General Aviation accidents is due to loss of control. Most often it can be
noticed that these accidents occur during critical phases of flight, such as takeoff,
landing, climb and descent, and go-around procedures. It is of essence that
throughout these critical phases of flight, a pilot is aware of what is happening and
can respond appropriately to any changes that might lead to the loss of control.
Often these accidents lead all the way back to the beginning of pilots not being
trained properly. Inexperienced, or even experienced pilots, have often not been
properly trained to respond to distractions in the cockpit, and will lose focus of
flying the aircraft, while they slowly lose control of the aircraft and end in a
situation that cannot be recovered. It is often difficult to recover from a loss of
control in critical phases of flight, due to the aircraft being at low airspeeds and low
altitudes, resulting in only little room for error.
The purpose of this research, was to assess the changes associated with the
longitudinal control force and the free pitching response of the aircraft after the
pilot either extends or retracts the flaps at a specified traffic pattern airspeed.
Additionally, these forces were also noted during go-around phases. It was noticed
that some aircraft require larger forces and have a different, in some cases more
aggressive pitching moment. Any major force changes or abrupt motions in the free
response can be assumed to be additional factors adding to the loss of control of the
aircraft. Each aircraft will respond differently to flap input, especially since the
airfoil designs, tail geometry, and operating speeds are also different for each type
of aircraft. A PA-28-181 Archer for example, might be much more forgiving than
for example a Mooney or Cirrus. The different buildups of longitudinal trim forces
varying from aircraft to aircraft, might be a cause of stalls in the traffic pattern. Not
properly recovering at low altitudes might lead to accidents in these cases.
4
Previous research, which has also been conducted by the Flight Test Engineering
Dept. at Florida Tech, has shown that common General Aviation aircraft, such as a
Cessna 172M or the Piper PA-32-260 "Cherokee Six", exhibit longitudinal control
forces between 25 lbs and 36 lbs during flap extension, while showing a free pitch-
up response of 35° within 6seconds [2]. This would mean that the pitch rate of
these aircraft would be around 6° per second. Other aircraft such as a Piper PA-28-
180 were shown to have a longitudinal control force change of only 3 lbs with
almost no pitch-up response to flap extension, which is more favorable, especially
when it comes to the flight instruction aspect.
Stability and control also plays an important role when talking about longitudinal
trim. Designing the aircraft slightly different in aspects such as tail sizing or tail
location might have a positive effect on the controllability of the aircraft. Especially
for new flight students and flight training in general, one would prefer to have a
forgiving and easy to control aircraft. Novice pilots should not have to worry about
how an aircraft responds to flaps and whether or not the aircraft will stall in the
traffic pattern if a certain speed is not exactly held.Once students get more
experience and move into time-building stages, they have the chance to move to
more complex aircraft.
This thesis will present the testing procedures, experimental results, and discuss
and analyze the meaning of the collected data for the different longitudinal trim
forces that have been collected for five different aircraft. Additionally, any
recommendations that the flight test engineers have will be listed in the conclusion
of this report.
The chapters of this report are organized as follows: Chapter 1 of this thesis will
focus on the purpose of this research and talk about the reasons behind the testing
that is being completed. It is always good to have an understanding of why a
certain type of research is being conducted, and who is benefiting from it. In short,

5
by testing the different longitudinal trim forces, the flight test engineers are trying
to find different causes that might be contributing factors to the loss of control in
general aviation. The best case scenario would be to make the aviation industry
slightly safer for pilots. Chapter 2 will talk about the different test aircraft being
used, and how data were collected. Chapter 3 and 4 will focus on the data that has
been collected, and evaluate it appropriately. Chapter 5 will cover Loss of Control.
The last section will conclude the thesis and provide recommendations for areas
that can be improved.
1.3 FAA Guidance
According to CFR §23.143,
“(a) The airplane must be safely controllable and maneuverable during all
flight phases including
(1) takeoff;
(2) climb;
(3) level flight;
(4) descent;
(5) go-around; and
(6) landing (power on and power off) with the wing flaps extended
and retracted.
(b) It must be possible to make a smooth transition from one flight
condition to another (including turns and slips) without danger of exceeding
the limit load factor, under any probable operating condition (including, for
multiengine airplanes, those conditions normally encountered in the sudden
failure of any engine).

6
(c) If marginal conditions exist with regard to required pilot strength, the
control forces necessary must be determined by quantitative tests. In no
case may the control forces under the conditions specified in paragraphs (a)
and (b) of this section exceed those prescribed in the following table.” [3].
As seen on Table 1, the Federal Aviation Administration (FAA) requires no more
than 60 pounds of pitch stick force (or 50 pounds of pitch wheel force – one hand
on rim) to arrest any un-commanded airplane pitch response.
Table 1 - CFR §23.143(c) Control Force Requirements
Values in pounds force applied to the relevant control
Pitch
Roll
(a) For temporary application:
Stick 60 30
Wheel (Two hands on rim) 75 50
Wheel (One hand on rim) 50 25
(b) For prolonged application 10 5
The other applicable FAA guidance for this paper comes from CFR §23.145
Longitudinal Control:
“(a) With the airplane as nearly as possible in trim at 1.3 VS1, it must be
possible, at speeds below the trim speed, to pitch the nose downward so that
the rate of increase in airspeed allows prompt acceleration to the trim speed
with—
(1) Maximum continuous power on each engine;

7
(2) Power off; and
(3) Wing flap and landing gear—
(i) retracted, and
(ii) extended.
(b) Unless otherwise required, it must be possible to carry out the following
maneuvers without requiring the application of single-handed control forces
exceeding those specified in §23.143(c). The trimming controls must not be
adjusted during the maneuvers:
(1) With the landing gear extended, the flaps retracted, and the
airplanes as nearly as possible in trim at 1.4 VS1, extend the flaps as
rapidly as possible and allow the airspeed to transition from 1.4VS1
to 1.4 VSO:
(i) With power off; and
(ii) With the power necessary to maintain level flight in the
initial condition.
(2) With landing gear and flaps extended, power off, and the
airplane as nearly as possible in trim at 1.3 VSO: quickly apply
takeoff power and retract the flaps as rapidly as possible to the
recommended go around setting and allow the airspeed to transition
from 1.3 VSO to 1.3 VS1. Retract the gear when a positive rate of
climb is established.
(3) With landing gear and flaps extended, in level flight, power
necessary to attain level flight at 1.1 VSO, and the airplane as nearly
as possible in trim, it must be possible to maintain approximately
level flight while retracting the flaps as rapidly as possible with

8
simultaneous application of not more than maximum continuous
power. If gated flap positions are provided, the flap retraction may
be demonstrated in stages with power and trim reset for level flight
at 1.1 VS1, in the initial configuration for each stage—
(i) From the fully extended position to the most extended
gated position;
(ii) Between intermediate gated positions, if applicable; and
(iii) From the least extended gated position to the fully
retracted position.
(4) With power off, flaps and landing gear retracted and the airplane
as nearly as possible in trim at 1.4 VS1, apply takeoff power rapidly
while maintaining the same airspeed.
(5) With power off, landing gear and flaps extended, and the
airplane as nearly as possible in trim at VREF, obtain and maintain
airspeeds between 1.1 VSO, and either 1.7 VSO or VFE, whichever
is lower without requiring the application of two-handed control
forces exceeding those specified in §23.143(c).” [4].
1.4 The Reason for using Flaps in Aviation
In order to get a better understanding on the reason why pilots use flaps, one needs
to take a look at the simplified version of the lift equation:
𝐿 =1
2∗ 𝐶𝐿 ∗ 𝑉
2 ∗ 𝑆
Equation 1: Lift Equation

9
In this case 𝐶𝐿 is the coefficient of lift, which can be determined by wing
configuration, the shape of the wing, and the surface area (𝑆)of the wing. 𝑉 is the
variable being used to identify the velocity.
The reason this is being discussed, is because the flap setting changes the shape of
the wing, resulting in a change in the lift coefficient. Additionally, one needs to
understand that when using the flaps, not only are you creating lift but also creating
a large amount of drag, which is helpful during the landing phase. Pilots take
advantage of this due to the fact that a higher coefficient of lift means that the
aircraft is able to have a lower airspeed to create the same amount of lift as if it was
flying at higher airspeeds with no flaps. This fact gives us the advantage of flying
at lower approach speeds, with flaps extended, without stalling the aircraft.
Additionally, extending or retracting the flaps, will have an effect on the location of
the center of lift on the aircraft. There are two different cases that can occur: the
first one is the center of lift will move ahead of the center of gravity, resulting in a
pitch up motion of the aircraft. The second case would be the center of lift moves
aft of the center of gravity, creating a pitch down motion of the aircraft.
An additional aspect that needs to be taken into consideration, when trying to
predict the response of an aircraft after flap input, is "What will happen when the
downwash of the wing hits the tail? Will the downwash hit the tail or not?"
In order to get a better understanding of what is occurring during takeoff and
landing phases, and how flaps effect the aircraft flying characteristics, pilots need
to have a thorough understand of what phenomenon are associated with the flap
extension and retractions. This aerodynamic understanding will furthermore help
the pilots in responding to any changes that occur during critical phases of flight,
assisting in the prevention of loss of control in flight.

10
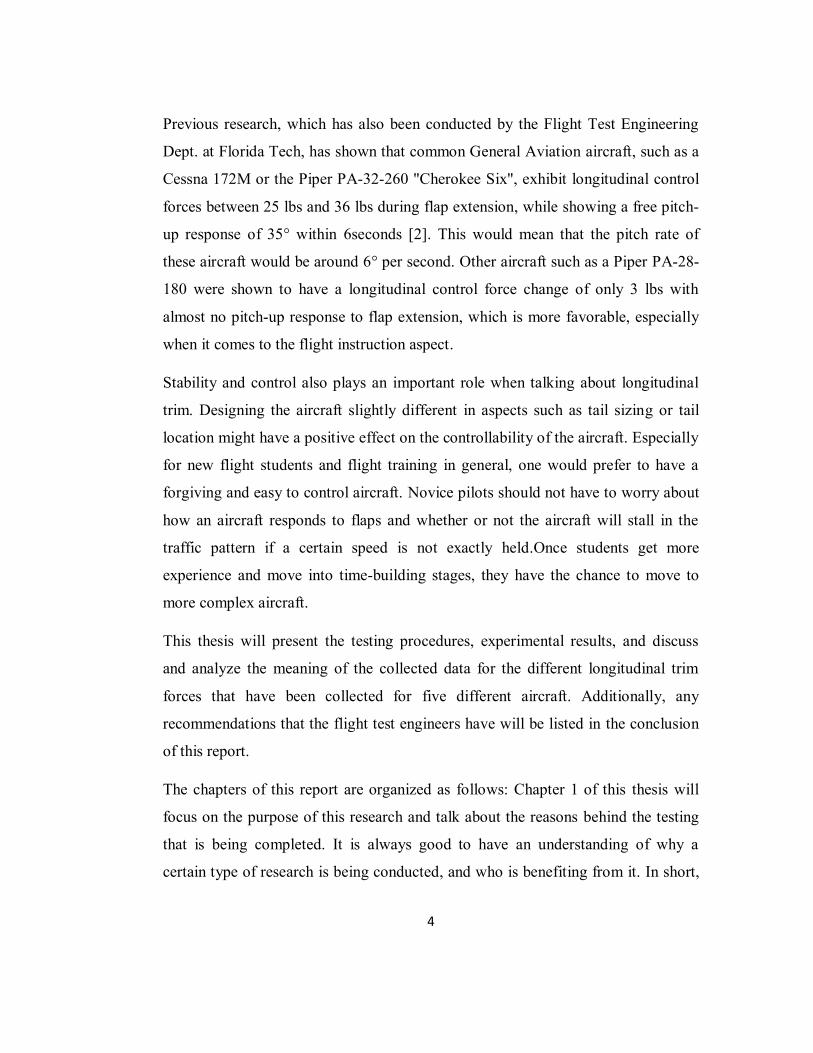
The types of flaps that are used on aircraft typically depend on the mission of the
aircraft. For example, the flaps on passenger aircraft need to be designed differently
than the flaps on a training aircraft such as a Cessna. Plain flaps on a Piper are
fairly simple to use and get you a good amount of drag during the landing phase.
While the first 10° of flaps get you more lift than drag, the first setting might be
more useful during takeoff. This might be handy for soft or short field take off
performance.
Fowler flaps on the Cessna on the other hand, create additional lift during the first
10° of the flaps due to the surface area of the wing getting increased, resulting in a
higher lift coefficient. On some models the flaps extend to a maximum of 40°,
which will create a high amount of drag, allowing the aircraft to have steeper
descent rates without increasing the airspeed.
Slotted flaps are usable when increasing the surface area of the wing for lower
airspeed performance. Due to them also changing the surface of the airfoil, they
change the value for the lift coefficient.
Split flaps are usable for slick aircraft and are more drag devices than anything. The
camber does not exactly change, however, the lift coefficient does change due to
the airflow changing in general. Figure 1 shows all the different flap types.
11
Figure 1 - Flap Types
Typically, each flight school teaches a certain takeoff or landing procedure. Each
associated with a different flap setting. Although each flight school has a different
procedure, most of the times, they are taught pretty similar. However, as already
discussed in previous sections, if the procedures are not taught properly, this can
lead to either the aircraft not being able to maintain altitude or airspeed, resulting in
a stall, or in worse cases to loss of control.
Aerodynamically, lowering the flaps increases camber of the main wing causing a
nose-down pitching moment. Why then do many aircraft pitch up? Downwash
from the main wing alters the effective angle of attack on the horizontal tail. As

12
shown in Figure 2, airspeed dictates how much downward tail load is necessary for
balanced flight (zero pitch rate). To achieve the required downward tail load, the
horizontal tail must adjust its angle of attack (stabilator) or camber (elevator) based
on the airflow it experiences from the downwash of the main wing. If the horizontal
tail is not in the downwash (e.g. T-tail), then the angle of attack it sees is based on
the freestream air.
Figure 2 - Effects of Downwash from the Main Wing on the Horizontal Tail [5]
When flaps are extended, the main wing camber (along the length of the flaps) is
increased. Aerodynamically, this increase in camber should result in a nose-down
pitching moment. This would increase the required downward tail load for
balanced flight. The increased camber of the main wing could also alter the
effective angle of attack experienced by the horizontal tail. That is, the downwash
angle could increase, thereby increasing the effective angle of attack on the
horizontal tail. This situation would assist the horizontal tail in providing some
additional downward tail load without having to change its position. However, it

13
would likely not be the exact amount required, and the horizontal tail would have to
change its position.
Vortices are another aerodynamic effect that can alter the airflow experienced at the
horizontal tail. Typically, vortices are thought of as a wingtip phenomenon as
shown in Figure 3. However, when flaps are extended, vortices are shed at the “flap
tips” just like a wingtip. The location of a flap tip dictates how much the vortices
impact the horizontal tail.
Figure 3 - Tip Vortices [5]
To visualize the possible impact flap-tip vortices can have on the horizontal tail,
consider the some typical geometries used in general aviation. Figure 4 shows two
low-wing airplanes with conventional tails. Airplane A has the inboard flap tip
flush with the fuselage. It is assumed the fuselage will nullify any vortices caused
by the inboard flap tip. The outboard flap tip, however, has nothing to impede the
vortex. If large enough, the vortex could impact the horizontal tail as shown. This
would result in an even larger angle of attack seen by the horizontal tail (in addition

14
to downwash) possibly resulting in a substantial downward tail load. The overall
effect could be a nose-up pitching moment. Airplane B in Figure 4 has the inboard
flap tip displaced from the fuselage. The vortex generated by the inboard flap tip
would circulate in the opposite direction as the outboard flap tip. Since the fuselage
is nearby, the strength of the vortex for the inboard flap tip should be lower than
outboard flap tip. The side views in Figure 4 show how downwash may impact the
horizontal tail.
Figure 4 - Airplane A (left) and Airplane B (right)
Figure 5 shows how flap-tip vortices and downwash impact the horizontal tail for a
high-wing airplane with a conventional tail (Airplane C). For Airplane D in
Figure 5, the flap tip is far enough outboard that the vortex doesn’t impact the
horizontal tail. Airplane D’s horizontal tail is also mounted higher on the fuselage
(just on the edge of the downwash). This would change at higher main-wing angle
of attack.

15
Figure 5 - Airplane C (left) and Airplane D (right)
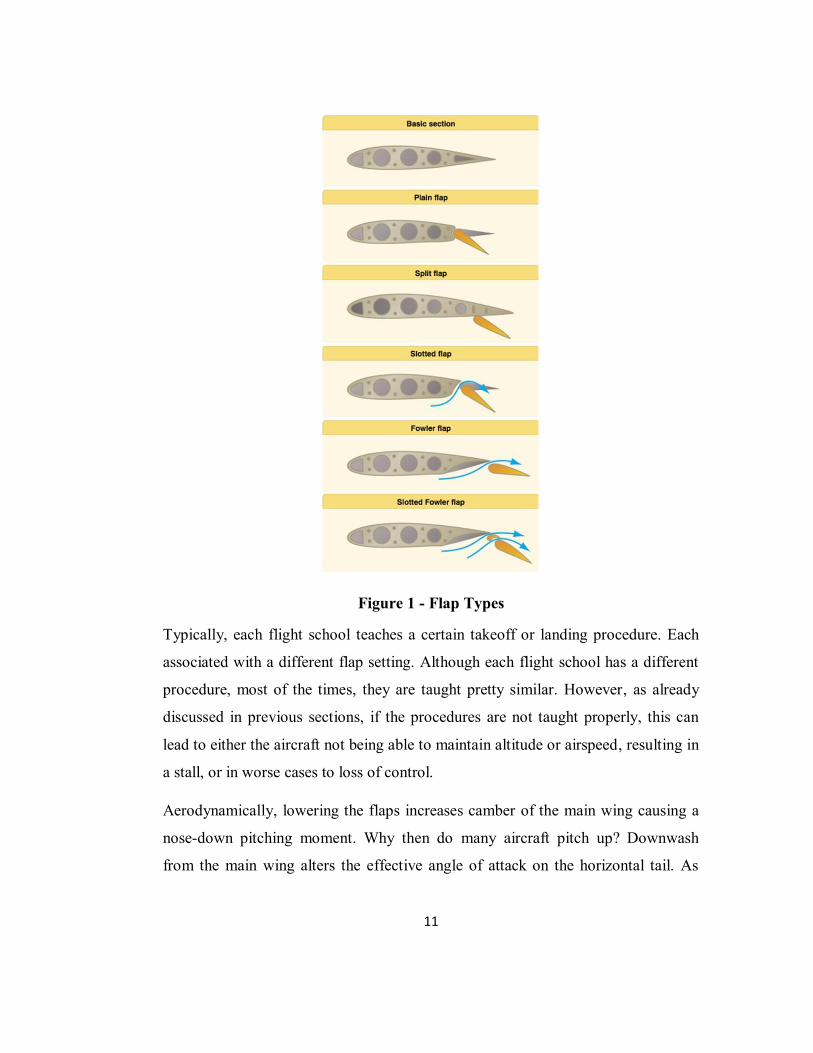
Figure 6 shows a low-wing airplane with a T-tail (Airplane E). Like Airplane D,
the vortex from the outboard flap tip doesn’t impact the horizontal tail. Neither
does the vortex from the inboard flap tip, since the horizontal tail is higher up in the
air flow. In fact, the main wing downwash doesn’t really impact the horizontal tail
either (at least at low main-wing angle of attack).
16
Figure 6 - Airplane E
These artist concepts are designed to provide qualitative explanations for why an
airplane either pitches nose up or nose down after extending the flaps. Obviously,
airspeed, power setting, and main-wing angle of attack are factors that could either
enhance or diminish these effects.Ideally, a pilot should be able to extend the flaps
and have the airplane remain in balance (zero pitch rate). If the effects of
downwash and flap-tip vortices is quantified and repeatable for a given airplane
geometry (e.g. Airplane A), then a flap-elevator interconnect or flap-trim tab
interconnect could be added to nullify the effects. The effects of downwash and
flap-tip vortices discussed thus far have been for flap extension. The opposite
effects should occur if retracting flaps from a balanced flight condition. In both
cases (extension and retraction), consideration for power effects must also be done.

17
The go-around scenario (typically within feet of the ground) involves adding full
power and retracting flaps.
18
Chapter 2
Test Aircraft, Data Collection Methods, and Test Location
2.1 Test aircraft
In order to test the effects of flap configuration on the longitudinal trim, the Florida
Tech flight test engineers tested five different aircraft. Different configurations of
flap settings and their required forces to maintain either airspeed or altitude were
tested. The five aircraft that were tested were owned either privately, by Florida
Tech, or they were chartered from a different flight school, such as the Cirrus
SR20.
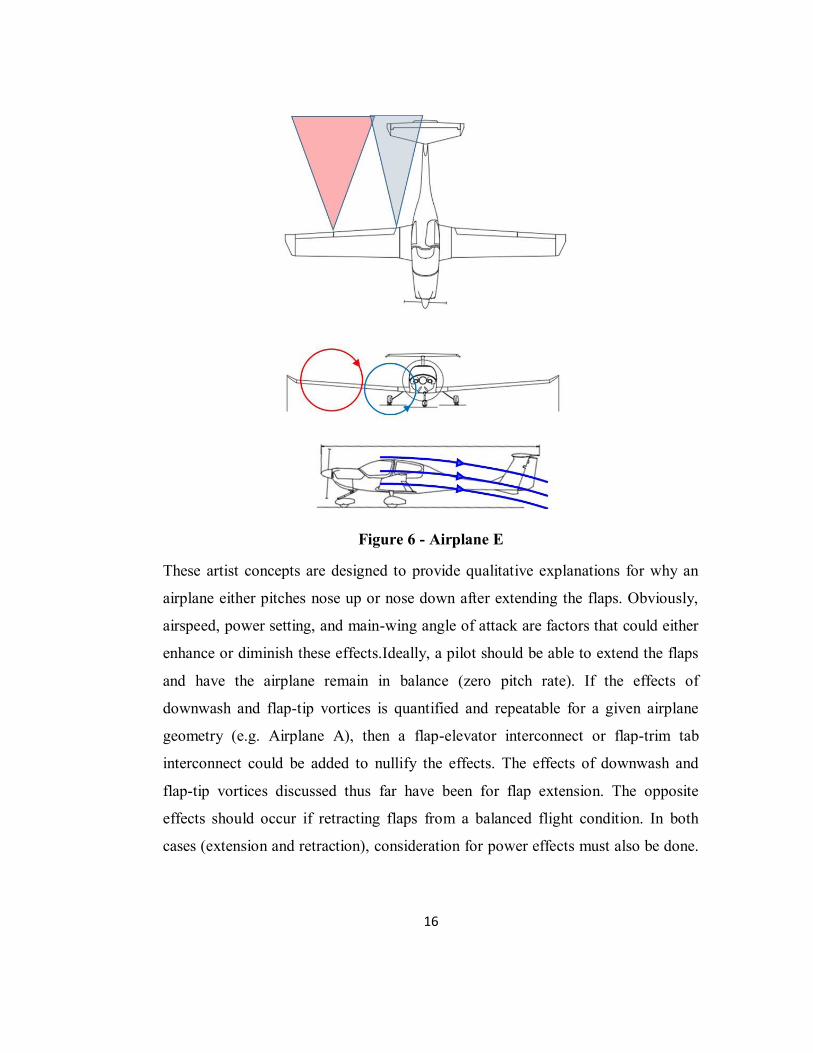
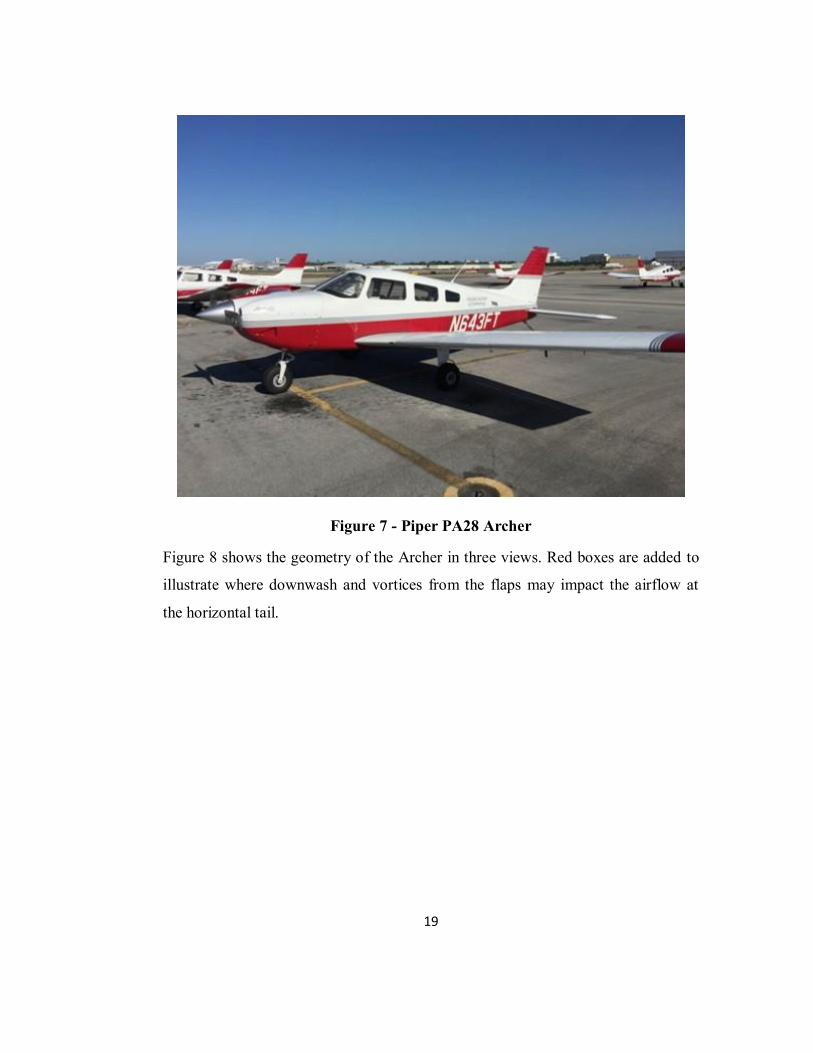
2.1.1 Piper Archer (PA-28-181)
The Piper Archer (PA-28-181) in Figure 7 is currently used by Florida Tech
Aviation to train student pilots for private, commercial, and flight instructor ratings.
The Archer is a four-seat, single-engine passenger aircraft, which is powered by a
four-cylinder Lycoming 180hp engine. The aircraft is equipped with plain flaps that
are capable of being placed into four different settings: 0°, 10°,25°, and 40°. There
are two different ways that flaps can typically be extended on an aircraft, either
electrically or manually. Small single-engine Piper aircraft, such as the Warrior,
Archer, or Arrow use a manual flap lever located in between the two front seats.
The stall speed in landing configuration (VS0) is at 45 knots [6].
19
Figure 7 - Piper PA28 Archer
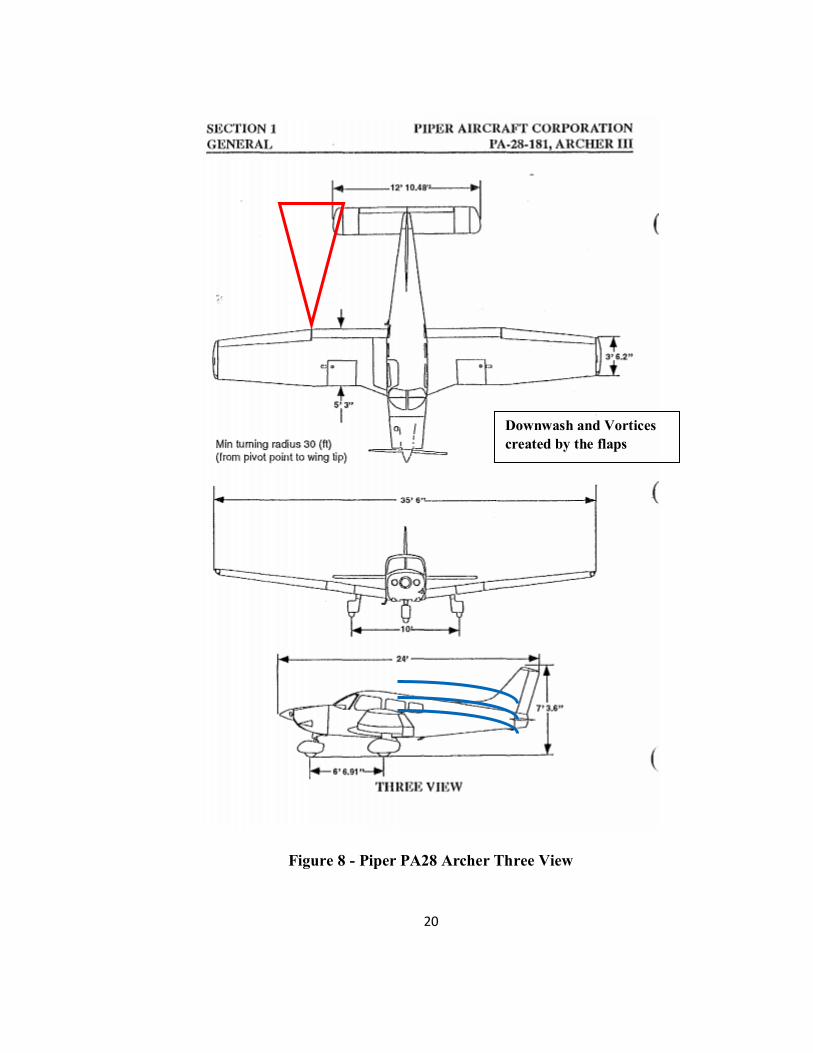
Figure 8 shows the geometry of the Archer in three views. Red boxes are added to
illustrate where downwash and vortices from the flaps may impact the airflow at
the horizontal tail.
20
Figure 8 - Piper PA28 Archer Three View
Downwash and Vortices created by the flaps
21
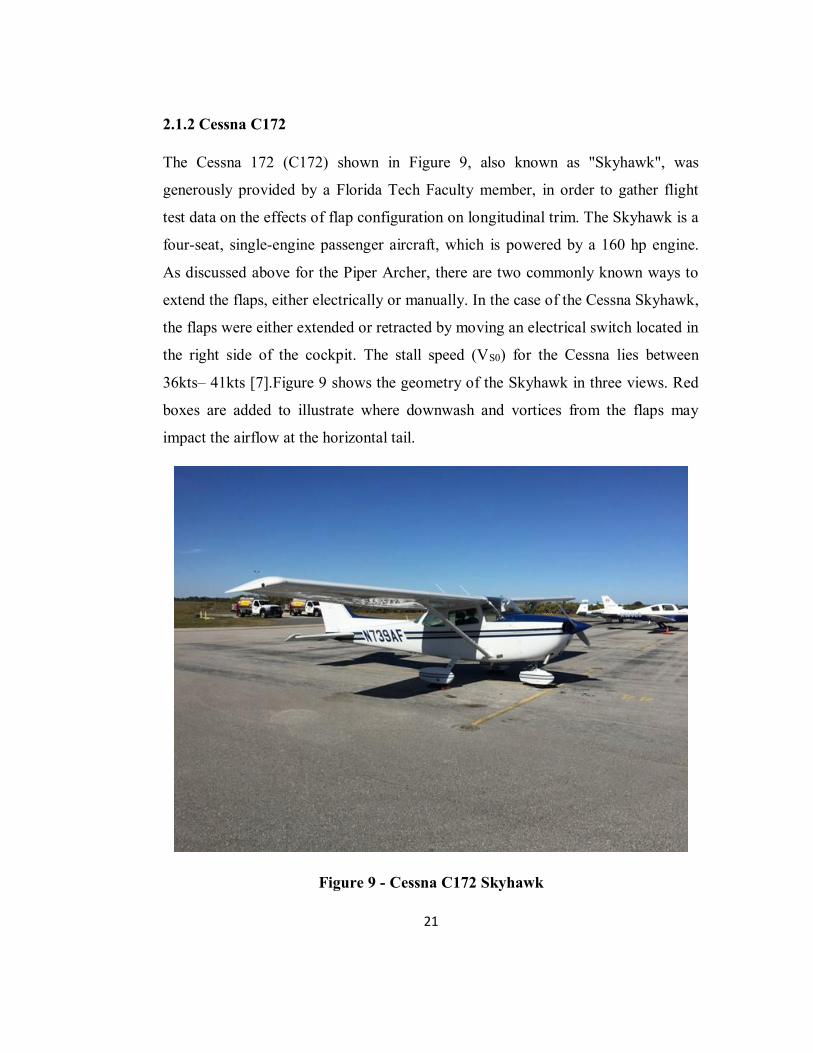
2.1.2 Cessna C172
The Cessna 172 (C172) shown in Figure 9, also known as "Skyhawk", was
generously provided by a Florida Tech Faculty member, in order to gather flight
test data on the effects of flap configuration on longitudinal trim. The Skyhawk is a
four-seat, single-engine passenger aircraft, which is powered by a 160 hp engine.
As discussed above for the Piper Archer, there are two commonly known ways to
extend the flaps, either electrically or manually. In the case of the Cessna Skyhawk,
the flaps were either extended or retracted by moving an electrical switch located in
the right side of the cockpit. The stall speed (VS0) for the Cessna lies between
36kts– 41kts [7].Figure 9 shows the geometry of the Skyhawk in three views. Red
boxes are added to illustrate where downwash and vortices from the flaps may
impact the airflow at the horizontal tail.
Figure 9 - Cessna C172 Skyhawk

22
Figure 10 - Cessna C172 Skyhawk Three View
Downwash and Vortices created by the flaps
23
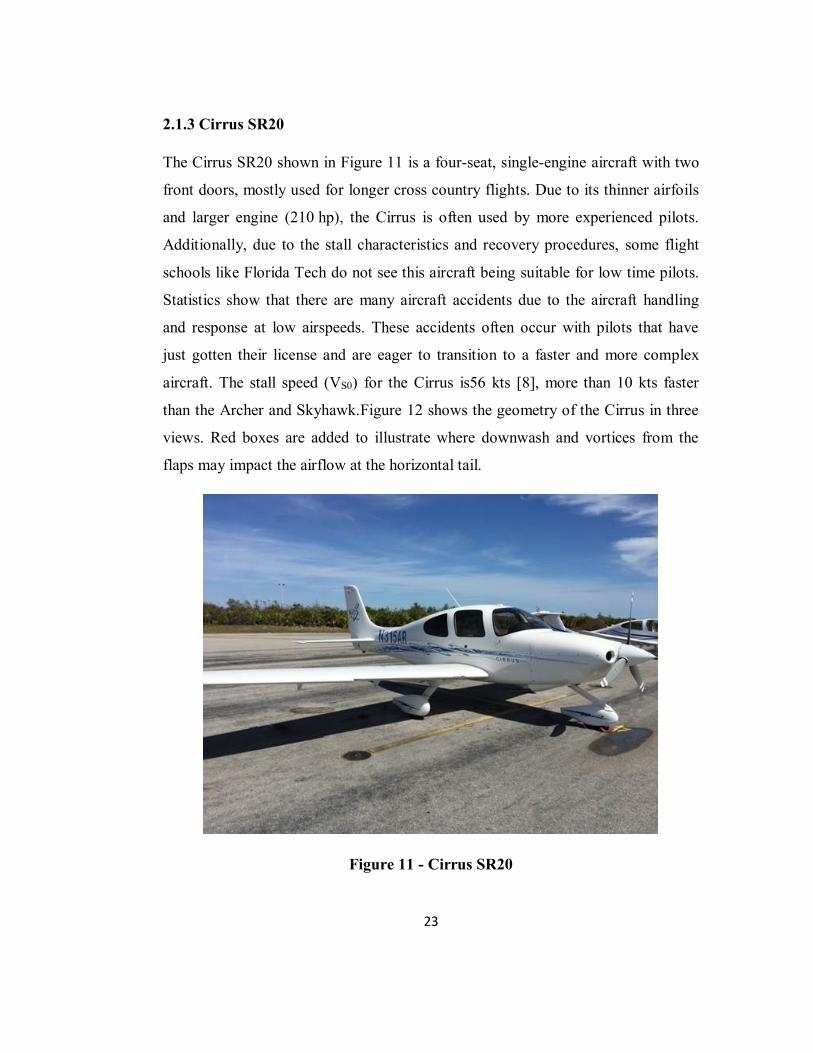
2.1.3 Cirrus SR20
The Cirrus SR20 shown in Figure 11 is a four-seat, single-engine aircraft with two
front doors, mostly used for longer cross country flights. Due to its thinner airfoils
and larger engine (210 hp), the Cirrus is often used by more experienced pilots.
Additionally, due to the stall characteristics and recovery procedures, some flight
schools like Florida Tech do not see this aircraft being suitable for low time pilots.
Statistics show that there are many aircraft accidents due to the aircraft handling
and response at low airspeeds. These accidents often occur with pilots that have
just gotten their license and are eager to transition to a faster and more complex
aircraft. The stall speed (VS0) for the Cirrus is56 kts [8], more than 10 kts faster
than the Archer and Skyhawk.Figure 12 shows the geometry of the Cirrus in three
views. Red boxes are added to illustrate where downwash and vortices from the
flaps may impact the airflow at the horizontal tail.
Figure 11 - Cirrus SR20

24
Figure 12 - Cirrus SR20 Three View
Downwash and Vortices created by the flaps

25
2.1.4 Mooney M20C
Similar to the Cirrus, the Mooney shown in Figure 13 is known for its great cruise
performance and comfort in the General Aviation industry. It is also mostly used by
private owners for longer cross countries. It is less known to be used for training
purposes unless it's for Commercial Pilot training or Certified Flight Instructor
training. Handling qualities and stall characteristics of the Mooney can be an issue
for a low time pilot. Speaking from experience, the Mooney is a great aircraft to
fly. However, there are a couple of small things that need to be taken into
consideration when it comes to flying this aircraft, due to it being slightly different
than the Piper or Cessna. Specifically, low airspeed operations and stall
characteristics are different from the Archer or Skyhawk. The Mooney
characteristics are more comparable to the Cirrus. The stall speed (VS0) for the
Mooney is50 kts [9]. Figure 14 shows the geometry of the Mooney in three views.
Red boxes are added to illustrate where downwash and vortices from the flaps may
impact the airflow at the horizontal tail.

26
Figure 13 - Mooney M20C

27
Figure 14 - Mooney M20C Three View
Downwash and Vortices created by the flaps
28
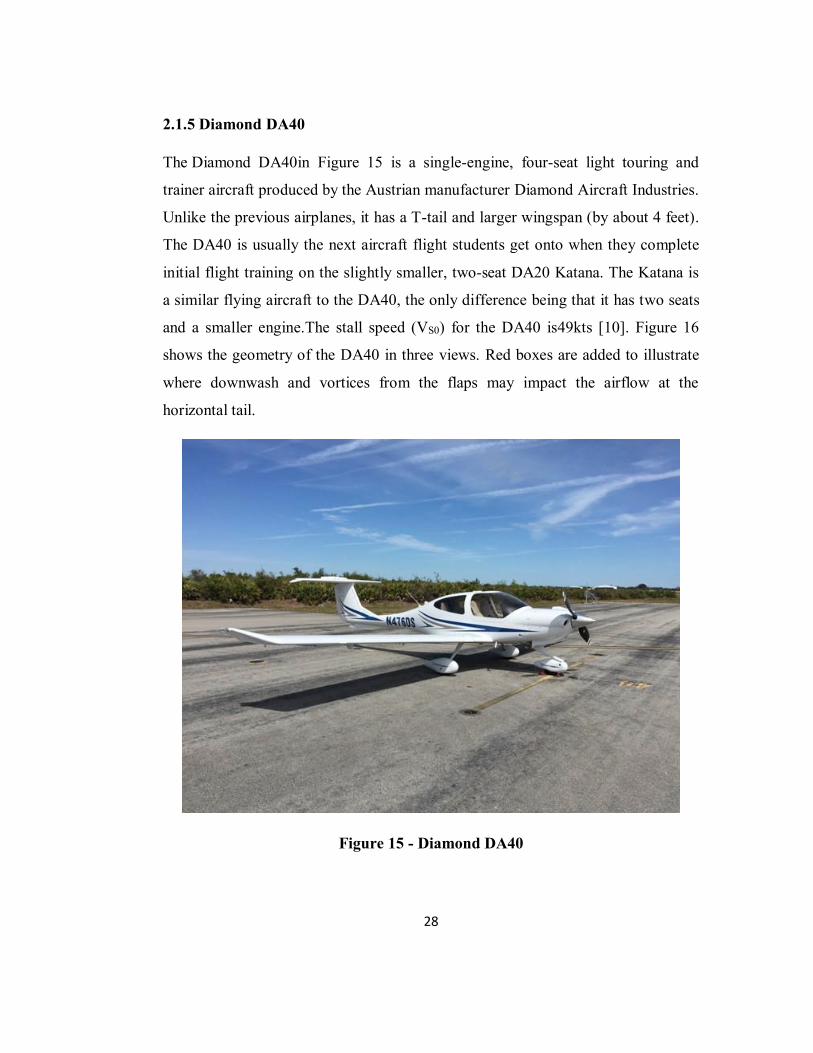
2.1.5 Diamond DA40
The Diamond DA40in Figure 15 is a single-engine, four-seat light touring and
trainer aircraft produced by the Austrian manufacturer Diamond Aircraft Industries.
Unlike the previous airplanes, it has a T-tail and larger wingspan (by about 4 feet).
The DA40 is usually the next aircraft flight students get onto when they complete
initial flight training on the slightly smaller, two-seat DA20 Katana. The Katana is
a similar flying aircraft to the DA40, the only difference being that it has two seats
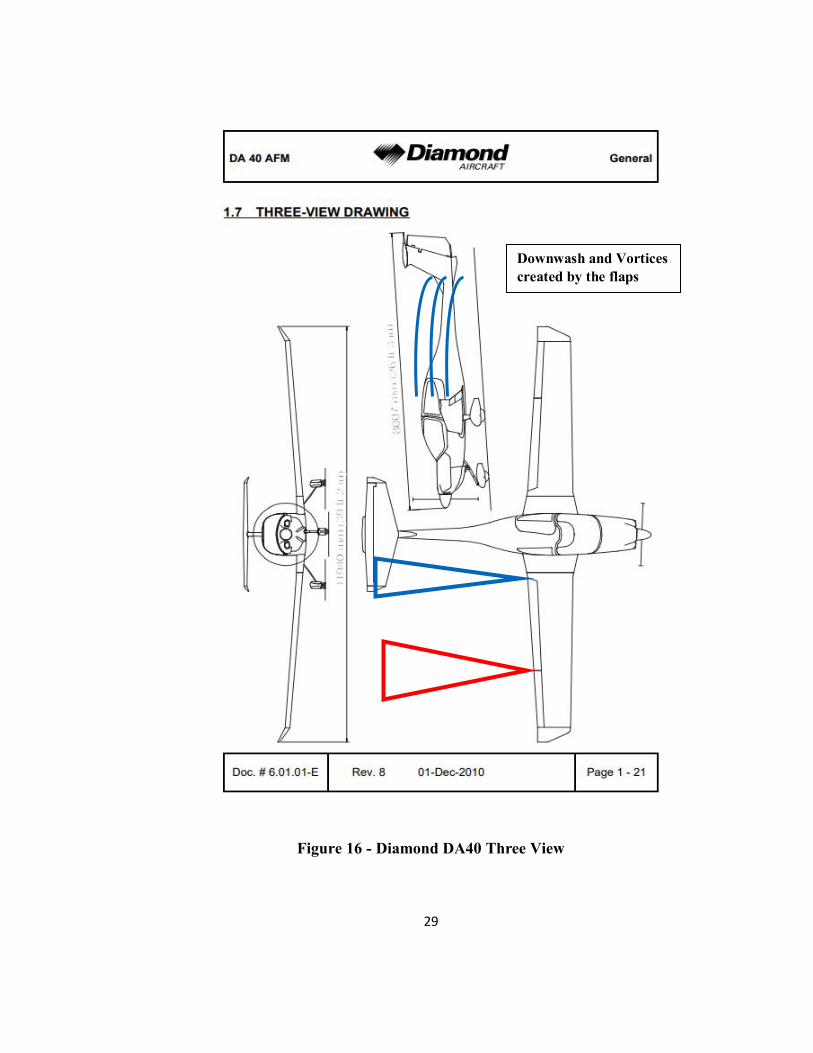
and a smaller engine.The stall speed (VS0) for the DA40 is49kts [10]. Figure 16
shows the geometry of the DA40 in three views. Red boxes are added to illustrate
where downwash and vortices from the flaps may impact the airflow at the
horizontal tail.
Figure 15 - Diamond DA40
29
Figure 16 - Diamond DA40 Three View
Downwash and Vortices created by the flaps
30
2.2. Data Collection Methods
In order to successfully collect all the required data needed for this thesis, the flight
test engineers used easily accessible instruments such as an airspeed indicator,
altimeter, artificial horizon to read pitch attitude, stick force gauge to determine the
required force to maintain altitude or airspeed, and GoPro Cameras in order to
record what happened on the test flights without necessarily completing additional
flights. Data were recorded by the flight test engineers on flight cards. The flight
cards had columns for different flap settings and their resulting airspeed change,
altitude change, attitude change, and stick force. After recording all the data, the
results were placed into an Excel sheet and evaluated and analyzed. From these
interpretations, conclusions and future recommendations were made.
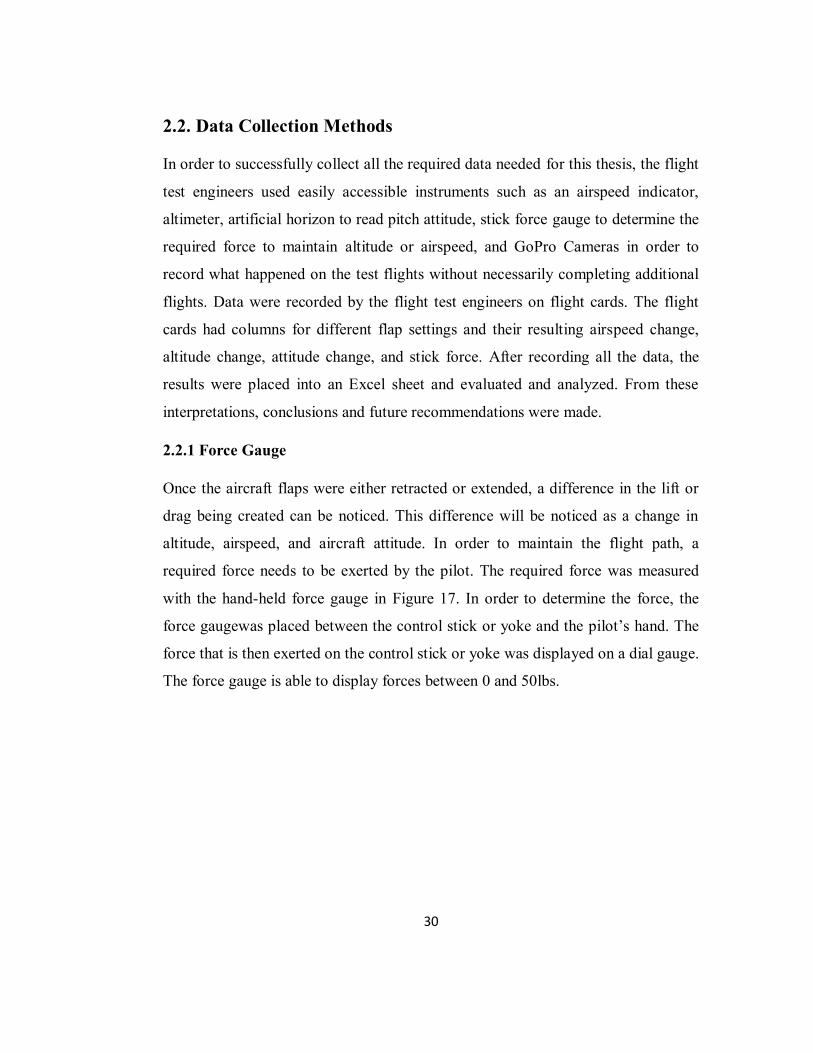
2.2.1 Force Gauge
Once the aircraft flaps were either retracted or extended, a difference in the lift or
drag being created can be noticed. This difference will be noticed as a change in
altitude, airspeed, and aircraft attitude. In order to maintain the flight path, a
required force needs to be exerted by the pilot. The required force was measured
with the hand-held force gauge in Figure 17. In order to determine the force, the
force gaugewas placed between the control stick or yoke and the pilot’s hand. The
force that is then exerted on the control stick or yoke was displayed on a dial gauge.
The force gauge is able to display forces between 0 and 50lbs.

31
Figure 17 - Hand-held Force Gauge
2.2.2 GoPro Cameras
Each aircraft that was tested, was supplied with either two or three GoPro Cameras.
These GoPro Cameras were placed in such an arrangement that they were facing
either out towards the wing or facing the instrumentation panel of the aircraft as
shown in Figure 18. Additionally, if there were enough GoPros, the test engineers
also placed a GoPro in such an arrangement that one was capable of viewing the
pilot’s inputs on the aircraft controls.
Figure 18 - Typical GoPro Layout

32
2.2.3 Airspeed Indicator
The airspeed indicator (ASI) is a sensitive, differential pressure gauge that
measures and promptly indicates the difference between pitot (impact/dynamic
pressure) and static pressure. These two pressures are equal when the aircraft is
parked on the ground in calm air. When the aircraft moves through the air, the
pressure on the pitot line becomes greater than the pressure in the static lines. This
difference in pressure is registered by the airspeed pointer on the face of the
instrument, which is calibrated in miles per hour, knots (nautical miles per hour), or
both.
The ASI is the one instrument that utilizes both the pitot, as well as the static
system. The ASI shown in Figure 19introduces the static pressure into the airspeed
case while the pitot pressure (dynamic) is introduced into the diaphragm. The
dynamic pressure expands or contracts one side of the diaphragm, which is attached
to an indicating system. The system drives the mechanical linkage and the airspeed
needle. In the case of glass cockpits, pressure transducers are used rather than
mechanical diaphragms.
Figure 19 - Airspeed Indicator (ASI)
33
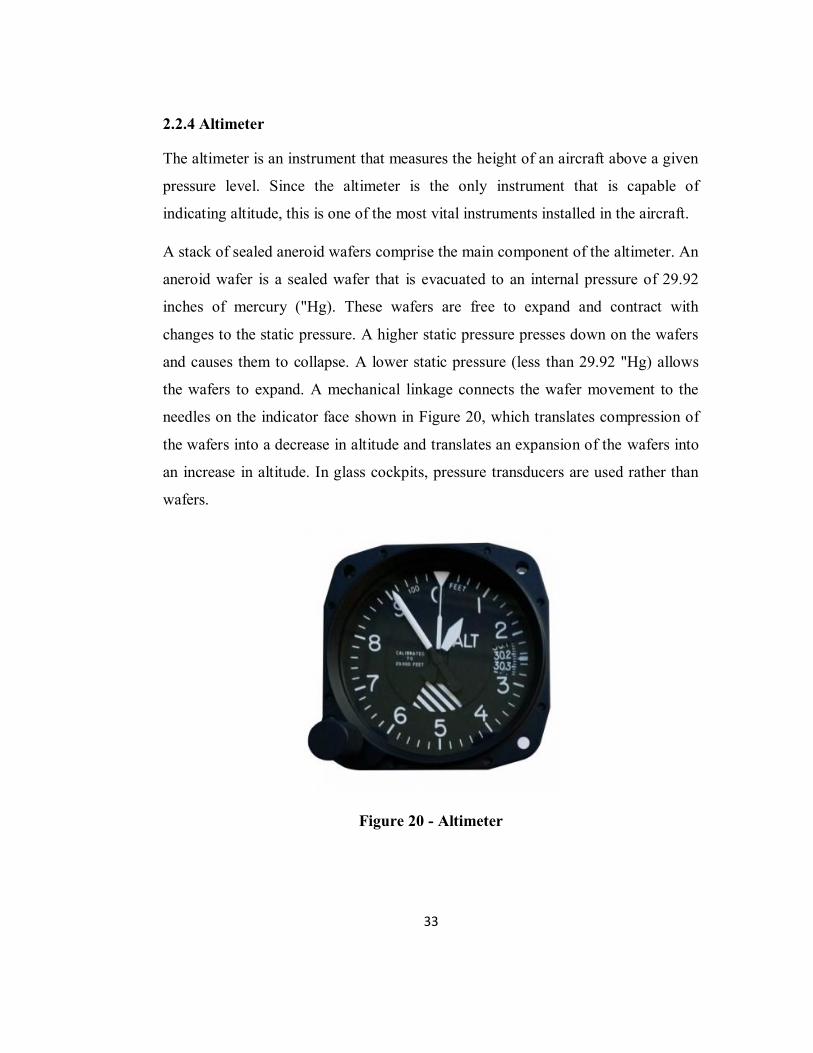
2.2.4 Altimeter
The altimeter is an instrument that measures the height of an aircraft above a given
pressure level. Since the altimeter is the only instrument that is capable of
indicating altitude, this is one of the most vital instruments installed in the aircraft.
A stack of sealed aneroid wafers comprise the main component of the altimeter. An
aneroid wafer is a sealed wafer that is evacuated to an internal pressure of 29.92
inches of mercury ("Hg). These wafers are free to expand and contract with
changes to the static pressure. A higher static pressure presses down on the wafers
and causes them to collapse. A lower static pressure (less than 29.92 "Hg) allows
the wafers to expand. A mechanical linkage connects the wafer movement to the
needles on the indicator face shown in Figure 20, which translates compression of
the wafers into a decrease in altitude and translates an expansion of the wafers into
an increase in altitude. In glass cockpits, pressure transducers are used rather than
wafers.
Figure 20 - Altimeter

34
2.2.5 Artificial Horizon or Attitude Indicator
The attitude indicator shown in Figure 21, with its miniature aircraft and horizon
bar, displays a picture of the attitude of the aircraft. The relationship of the
miniature aircraft to the horizon bar is the same as the relationship of the real
aircraft to the actual horizon. The instrument gives an instantaneous indication of
even the smallest changes in attitude. The gyro in the attitude indicator is mounted
in a horizontal plane and depends upon rigidity in space for its operation. The
horizon bar represents the true horizon. This bar is fixed to the gyro and remains in
a horizontal plane as the aircraft is pitched or banked about its lateral or
longitudinal axis, indicating the attitude of the aircraft relative to the true horizon.
Figure 21 - Artificial Horizon
35
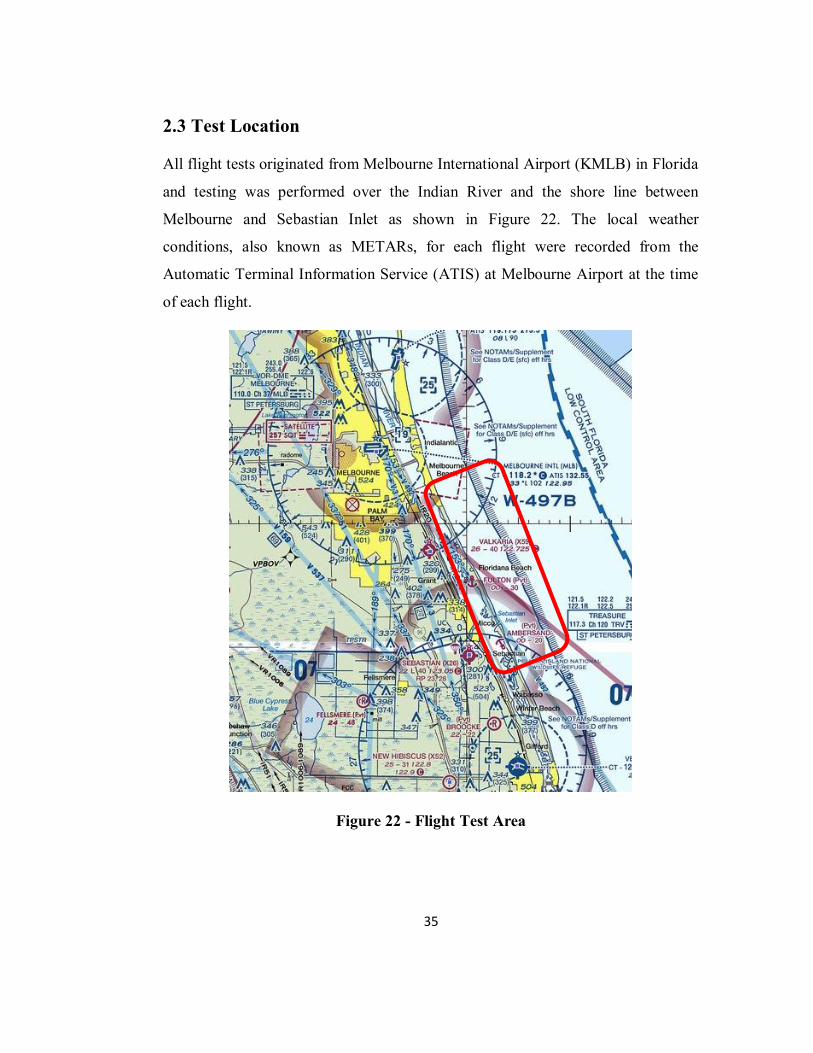
2.3 Test Location
All flight tests originated from Melbourne International Airport (KMLB) in Florida
and testing was performed over the Indian River and the shore line between
Melbourne and Sebastian Inlet as shown in Figure 22. The local weather
conditions, also known as METARs, for each flight were recorded from the
Automatic Terminal Information Service (ATIS) at Melbourne Airport at the time
of each flight.
Figure 22 - Flight Test Area

36
Chapter 3
Results
Aircraft were trimmed to simulate the downwind leg a of a traffic pattern. The
guidance in CFR §23.143 and CFR §23.145 was followed. That is, we measured
single-hand pitch control force to re-establish trim airspeed as flaps were extended
to various positions. In the case of a simulated go-around, flaps were full with
power required for a normal glide slope. Then power was set to full, followed by
retracting the flaps to 0°. The pilot stopped descending then transitioned to a
shallow climb. The approach and go-around maneuvers were repeated with no pilot
correction to re-establish trim airspeed or stop descending. In other words, we let
the airplane respond freely to a change in flap setting or power. This data can be
used to show what happens if the pilot is distracted and doesn’t apply any
corrections.
Table 2 shows the required stick force to maintain trim airspeed after flaps were
extended from 0° to full during simulated downwind legs.Pull forces are positive,
and push forces are negative. All the aircraft are within the FAA required 50 lb
limit. The Archer and Skyhawk have highest magnitude at 35 lbs. The Cirrus has
the next highest magnitude at 22 lbs. The Mooney M20C is the only aircraft
requiring a pull force. The DA40 (with its T-tail) has the lowest magnitude at 4 lbs.
Table 2 - Required Stick Forces for Approach configuration
Aircraft Max Stick Force (lbs) PA28 -35 C172 -35 SR20 -22 DA40 -4 M20C 5
37
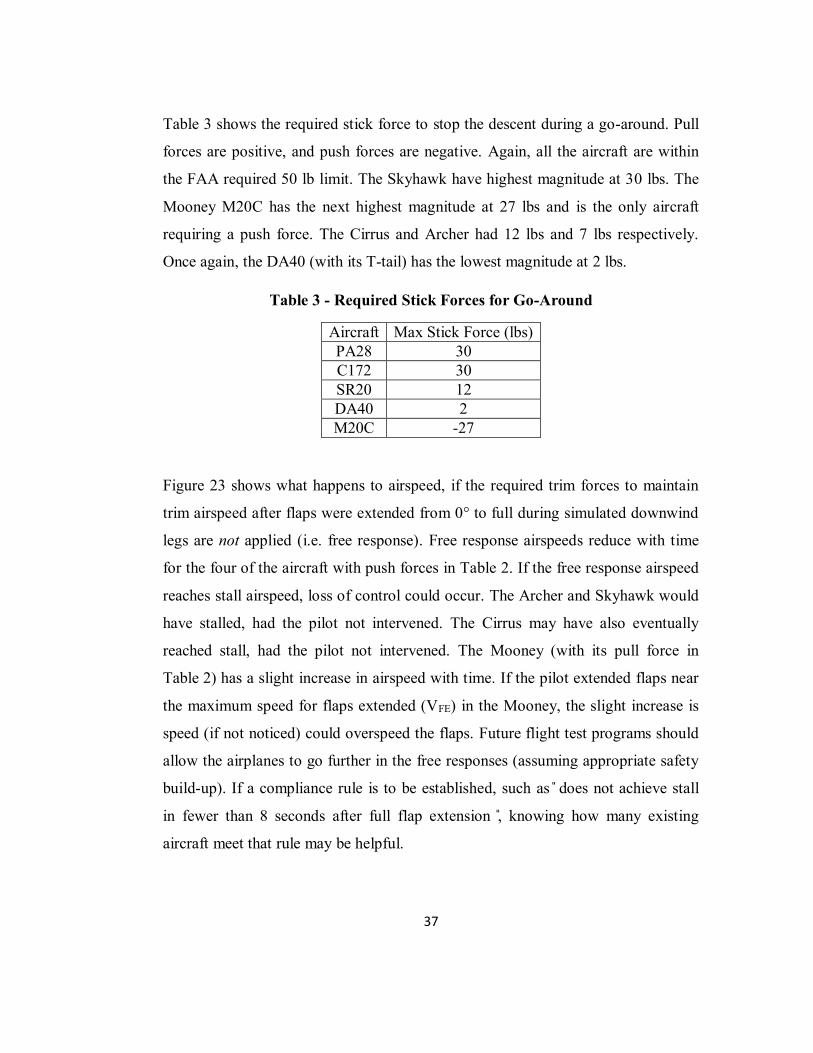
Table 3 shows the required stick force to stop the descent during a go-around. Pull
forces are positive, and push forces are negative. Again, all the aircraft are within
the FAA required 50 lb limit. The Skyhawk have highest magnitude at 30 lbs. The
Mooney M20C has the next highest magnitude at 27 lbs and is the only aircraft
requiring a push force. The Cirrus and Archer had 12 lbs and 7 lbs respectively.
Once again, the DA40 (with its T-tail) has the lowest magnitude at 2 lbs.
Table 3 - Required Stick Forces for Go-Around
Aircraft Max Stick Force (lbs) PA28 30 C172 30 SR20 12 DA40 2 M20C -27
Figure 23 shows what happens to airspeed, if the required trim forces to maintain
trim airspeed after flaps were extended from 0° to full during simulated downwind
legs are not applied (i.e. free response). Free response airspeeds reduce with time
for the four of the aircraft with push forces in Table 2. If the free response airspeed
reaches stall airspeed, loss of control could occur. The Archer and Skyhawk would
have stalled, had the pilot not intervened. The Cirrus may have also eventually
reached stall, had the pilot not intervened. The Mooney (with its pull force in
Table 2) has a slight increase in airspeed with time. If the pilot extended flaps near
the maximum speed for flaps extended (VFE) in the Mooney, the slight increase is
speed (if not noticed) could overspeed the flaps. Future flight test programs should
allow the airplanes to go further in the free responses (assuming appropriate safety
build-up). If a compliance rule is to be established, such as ̎ does not achieve stall
in fewer than 8 seconds after full flap extension ̎, knowing how many existing
aircraft meet that rule may be helpful.

38
Figure 23 - Airspeed vs Time
Figure 24 shows what happens to pitch attitude, if the required trim forces to
maintain trim airspeed after flaps were extended from 0° to full during simulated
downwind legs are not applied (i.e. free response). Free response pitch attitudes
increase with time for four of the aircraft with push forces in Table 2. It should be
noted that nose high pitch attitudes above 30° are considered aerobatic flying. The
Archer and Skyhawk achieved 30° in less than 5 seconds. The Mooney (with its
pull force in Table 2) has a manageable decrease in pitch attitude with time.
0
20
40
60
80
100
120
140
0 1 2 3 4 5 6
Airs
peed
(kno
ts)
Time (seconds)
PA28
C172
SR20
DA40
M20C

39
Figure 24 - Pitch Attitude vs Time
Table 4 shows the free response slopes in the linear regions of Figure 24. The four
of the aircraft with push forces in Table 2 have positive slopes. The Mooney (with
its pull force in Table 2) has a negative slope. A possible compliance rule could
be ̎slope must be within ±5° after full flap extension ̎.
Table 4 - Free Response Slopes after Full Flap Extension
Aircraft Free response seen from graphs PA28 +10.6°/s C172 +6.5°/s SR20 +4.2°/s DA40 +2.0°/s M20C -1.5°/s
-10
-5
0
5
10
15
20
25
30
35
0 1 2 3 4 5 6
Pitc
h A
ttitu
de (d
egre
es)
Time (seconds)
PA28
C172
SR20
DA40
M20C

40
Chapter 4
Analysis
4.1 Cessna C172
The Cessna 172 (or also known as the Skyhawk) is the industry standard for
professional flight training. With more than 43000 Skyhawks delivered, the Cessna
172 is one of the bestselling, most-flown airplanes in history. The aircraft has a
proven record, forgiving flight characteristics, and a reputation of being one of the
safest general aviation aircraft that has been built. Most flight schools today use
either the Cessna 172 or the Piper PA28, due to the fact that both these aircraft have
such forgiving flight characteristics.
However, even though both the Piper and the Cessna are known to be great trainers
and have forgiving flight characteristics, there are still more than 40% of accidents
that are caused due to loss of control and are associated with GA aircraft. Why is it
that, even though the Piper and the Cessna, the most frequently flown aircraft in the
general aviation industry, still affiliated with such accidents, when they are known
to be "easy-to-fly" aircraft.
A research team at Florida Institute of Technology conducted research on
longitudinal trim forces and aircraft responses after extending the flaps to landing
configuration, simulating the approach phase to landing. After conducting several
tests and evaluating the data, the flight test engineer came to an interesting
conclusion. [2]
From a flight instructor perspective, and many hours of experience, it is easy to say
that taking off and landing a Cessna is not that difficult. However, from a student's
perspective the situation needs to be looked at differently. When breaking down
each approach leg and looking at the different phases that one goes through, it can
41
quickly be determined where most of the accidents are likely to occur. When
coming in for landing on the downwind leg, Florida Tech teaches "Abeam the
numbers, set 10° of flaps." While doing this, the students will slowly bring back the
power and lower the flaps by 10°. As a flight instructor in Pipers, I would expect
the aircraft nose to balloon up and automatically apply a forward force to initiate a
gradual descent, while additionally bleeding of airspeed for landing. A student or
pilot who has barely flown cannot be expected to respond like a flight instructor
who flies every week and collects multiple hours of experience. Therefore, this
sudden change of attitude and airspeed might come as a surprise and cause the
aircraft to reach too high of a nose attitude, possibly leading up to a stall. At such
low altitudes, stalls can end up being dangerous, due to the student not being
experienced enough to recover quickly, while losing as little altitude as possible.
Even though these scenarios are practiced before sending students solo, it can still
be expected that in such a situation the amount of experience needed will just not
be present. Of course, other effects go into this scenario as well, such as the
emotional aspects that go into a low time student who is flying solo for the first
couple of times. Or a pilot, who already obtained his license and has not flown in a
while, will not be used to the aircraft as much as someone who flies multiple times
a week.
After being part of this research project and analyzing different effects that might
cause loss of control, I have closely looked at other pilots’ behaviors and tried to
figure out what exactly is causing these people to fly themselves into the ground. A
great example that I have recently seen was when four elderly people jumped into a
Cessna 172 with all their luggage for a weekend vacation. The first thing that I
realized was that the aircraft must have been completely out of C.G. and weight
limits. The amount of weight they placed into the baggage compartment in addition
to their own weight, just did not make sense to me. At that moment, I knew that
flight was going to be something out of the ordinary. Additionally, it also came to

42
my mind that the pilot flying the aircraft, was not a very experienced pilot. He was
overusing the starter while also flooding the engine. With all four people on board,
this was not the safest departing from the airport that day.
Wrapping up this little story, it becomes more and more clear, that there are many
more pilots like these out there. One might not directly experience this at Florida
Tech due to the high standards and procedures that are present, however, outside of
Florida Tech, there are pilots that come from all types of back grounds and might
not be as experienced as one might imagine.
When looking at both Figures 23 and 24 for airspeed and pitch attitude changes
over time when extending the flaps from 0° to maximum deflection, one can notice
that the Cessna 172 reaches a maximum pitch attitude of 25° within the first 5
seconds. Associated with the sudden pitch up of the nose, is a sudden airspeed
decrease, leading up to a stall. The stall will be reached within 6 seconds of the
pilot setting flaps to landing configuration if no further action is taken. The
dangerous part here, is that if the aircraft is stalled and uncoordinated, a spin can
occur, unless the pilot responds quickly enough and recovers. At low altitudes in
the traffic pattern, a spin will not be very forgiving and will most likely lead to a
crash.
The maximum force that was measured while setting the flaps to landing
configuration was 35 lbs, which out of all test aircraft is one of the highest values
that has been noted.
After completing the test, the pilot assisting the flight testing pilot (Dr. Silver)
demonstrated a maneuver that was known to get students into a bad attitude when
not properly handled. A dangerous thing that can be noticed, is when young pilots
or student pilots set up for landing and then end up adding full power, such as in a
go around maneuver. The aircraft will exert an aggressive pitch up motion,
requiring the pilot to put a large amount of forward force on the yoke. If this is not

43
done, the aircraft will most likely end in a stalling attitude and fall out of the sky.
Although the Cessna Company says that, when entering a go around maneuver,
flaps are supposed to be retracted to the second notch, a lot of student pilots will
forget this vigilant step and end up killing themselves, unless properly handled.
The control forces that were required to maintain control of the aircraft in this case
was 35lbs, which is a sizable number, and can become difficult for the pilot to
handle, if the pilot has not been trained properly or is not familiar with the aircraft.
This can often lead to loss of control of the aircraft if the pilot is in a scenario
where there is a large amount of workload and a high amount of stress, such as in
the case of a deer running on to the runway and the pilot having to go around.
Figure 25 shows images that show the aircraft response for the Cessna 172 after
extending the flaps into landing configuration. It can be noticed that within 8
seconds, the aircraft pitches up to around 25 degrees pitch up. After around 14 to
20 seconds, the aircraft has experienced a stall and lowers the nose.
T = 0s T = 4s
T = 8s T = 12s
Figure 25 - Free Response of Cessna 172 0 to Full Flaps

44
Figure 26 shows images for the go-around procedure.One can notice that after applying full power, the aircraft also has a tendency or aggressively pitching upwards. This occurs within 2 seconds.
T = 0s T = 2s
T = 0s T = 2s
Figure 26 - Free Response of Cessna 172 during Go-Around
4.2 Diamond DA40
Similar to the Cessna and the other aircraft, the Diamond DA40 has an up pitching
moment after the flaps are inputted. The nice thing about this aircraft however is,
that it responds very slowly and smoothly to the inputs. The free response of the
DA40 has a maximum of 12° pitch up and a maximum of 18° nose down within 19
seconds. Throughout the free response the pilots flying the aircraft did not have to
intervene with the controls to prevent the aircraft from getting out of control. The
aircraft simply enters a Phugoid motion and then settled back in level flight at an
airspeed of around 75KIAS. This speaks very well of the aircraft, meaning that
45
students who learn how to fly on this aircraft are less likely to get into an unusual
attitude after a flap input. When comparing the Diamond to the Cessna 172 and
Piper Archer, it can be noticed that the aircraft has the lowest pitch rate out of these
aircraft. The PA28 and the C172 have a much more aggressive up pitching motion,
requiring new student pilots, or the general pilot community to act much faster in
maintaining control of the aircraft.
Looking at the airspeed changes for the DA40, it can be noticed, that the aircraft
did not reach stall speed throughout flap input. The aircraft maintained a Phugoid
motion without reaching stall speed. Unlike the Cessna and Piper, this aircraft
continued to hold a positive margin above stall airspeed. The Piper and the Cessna
both reached a much higher pitch attitude and ended up stalling at the critical angle
of attack, creating the hazard of entering a spin when getting uncoordinated,
especially when a new student pilot is not familiar with the aircrafts up pitching
motion. The control force that was needed in order to maintain control of the
aircraft was measured to be around 4lbs, which is barely anything, and can easily
be handled by the average human being.
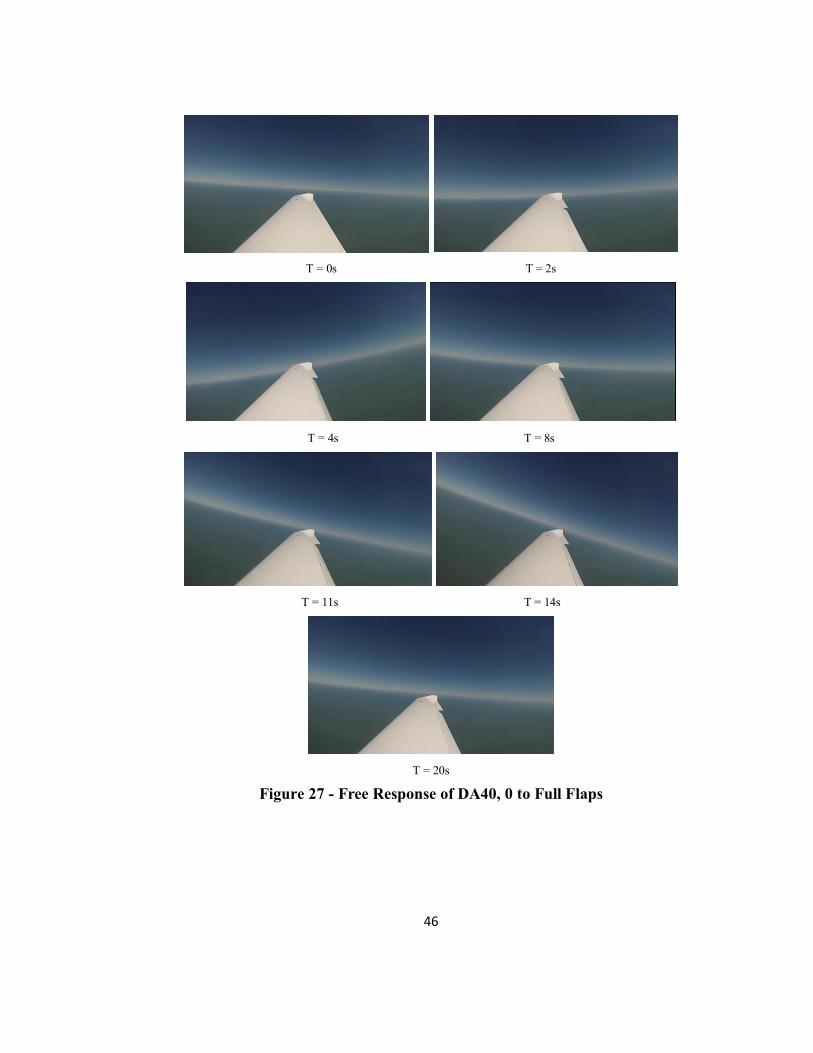
Figure 27 shows images of the Diamond DA40 after extending the flaps into
landing configuration. It can be noticed that within 4 seconds, the aircraft pitches
up to around 12 degrees pitch up. The aircraft then enters a Phugoid motion till
around 20 seconds. After 20 seconds, the aircraft has stabilized into straight and
level flight.
46
T = 0s T = 2s
T = 4s T = 8s
T = 11s T = 14s
T = 20s
Figure 27 - Free Response of DA40, 0 to Full Flaps

47
Figure 28 shows images for the go-around procedure. One can notice that after
applying full power, the aircraft has a slight nose high attitude at 4 seconds.
T = 0s
T = 4s
Figure 28 - Free Response of DA 40 during Go-Around
4.3 Mooney M20
Comparing the free response of the Mooney to the free response of the other
aircraft, one can notice an interesting aspect. As seen with most of the aircraft that
have been tested in this project, the free response of the planes after flap input is an
initial upwards pitching motion, associated with a decrease in airspeed. However,
when inputting flaps in the Mooney, it can be noticed that the aircraft pitches down,
and increases its airspeed. The question here is, why does the Mooney respond
differently to flap inputs than the other aircraft?

48
Many pilots say that there is a secret myth to flying the Mooney, that there are
small hidden challenges that are different to other aircraft, and might make a
transition to this aircraft slightly more difficult, such as the down pitching moment
of the aircraft once flaps are inputted. A lot of people try to stress these little
changes on the aircraft, and somewhat end up scaring pilots that like to switch to
this great aircraft. With 100hours of flight time in the Mooney, I can assure you
that once the little things are taken into consideration and fully understood, the
aircraft flies perfectly fine.
The simple reason why the aircraft has a down pitching moment, rather than an up
pitching moment after flap extension is mostly due to the aircraft design. In
general, deploying flaps should result in a down moment, and when looking at
aircraft in general, it does in most designs. But in some cases, such as with the
Cessna, an aircraft which has a high wing rather than a low wing, the downwash
interacts with the tail. And with certain airfoils and flap designs, the coefficient of
lift can shift forward, resulting in a nose up attitude change.
What exactly happens to the aircraft when the flaps are being deployed? As
mentioned above, aircraft typically have a down moment. However, how do we
explain this up pitching motion of aircraft, such as a Cessna or a Piper. Once flaps
are retracted, the aircraft center of lift shifts ahead of the center of gravity of the
aircraft, creating an up pitching motion of the aircraft. In other cases, when the
center of lift moves aft of the center of gravity, the aircraft would experience a
down pitching moment.
In most planes you get an increase in lift, so one might end up getting a positive
altitude deviation, however, one will most likely not get a large nose up pitch
change.
Very light planes with slow speed airfoils and flap systems that are designed more
towards the simplicity aspect, rather than performance, are more likely to have a

49
non-standard response.
4.4 Piper PA28-181 Archer
The Piper PA28 Archer is known to be one of the most used training aircraft, aside
from the Cessna C172, in the Aviation Industry, and is very comparable to the
Cessna with respect to flap input. In the case of the PA28, different cases of flap
inputs were tested. The first case, was how the aircraft would respond when setting
the flaps from 0° to 10, then from 10° to 25°, and lastly from 25°-40°. After
completing the free response for each flap increment, the flight test engineers also
tested what would happen to the aircraft, when the flaps were extended from 0° to
40°.
When inputting the flaps in increments, the pitch attitudes were fairly reasonable
and varied between 20° and 27° pitch up motion. In all these cases, the pilot was
able to respond quickly enough to get the aircraft back under control and into level
flight.
However, when one looks at the free response when inputting flaps from 0° to 40°
all in one, the aircraft responds similar to the Cessna. The maximum measured
pitch up attitude was 32° pitch up within 3-4 seconds. At that point, the pilot had to
intervene, or else the aircraft would have gotten out of control. The control forces
that were measured to maintain control of the aircraft were 35lbs. Which is also the
same as what was measured in the Cessna.
This can provide a hazard and a reason for the LOC of the aircraft, since a pilot that
is not familiar with the aircraft, or has not flown in a while will not expect the
aircraft to pitch up as aggressively as it did in the test. A pilot who already has
more than 600hours on Pipers and is familiar with this phenomenon will be less
likely to fall prey to this and most likely have a great time flying this aircraft. The
thing in the General Aviation industry is, that are many hobby pilots, meaning they
50
fly here and there just for fun, maybe to grab a burger, or a snack, and are not as
familiar with the aircraft as for example a flight instructor who flies this aircraft
every day. Therefore, they are more likely to be the statistic of the LOC accidents
that the NTSB is trying so hard to mitigate.
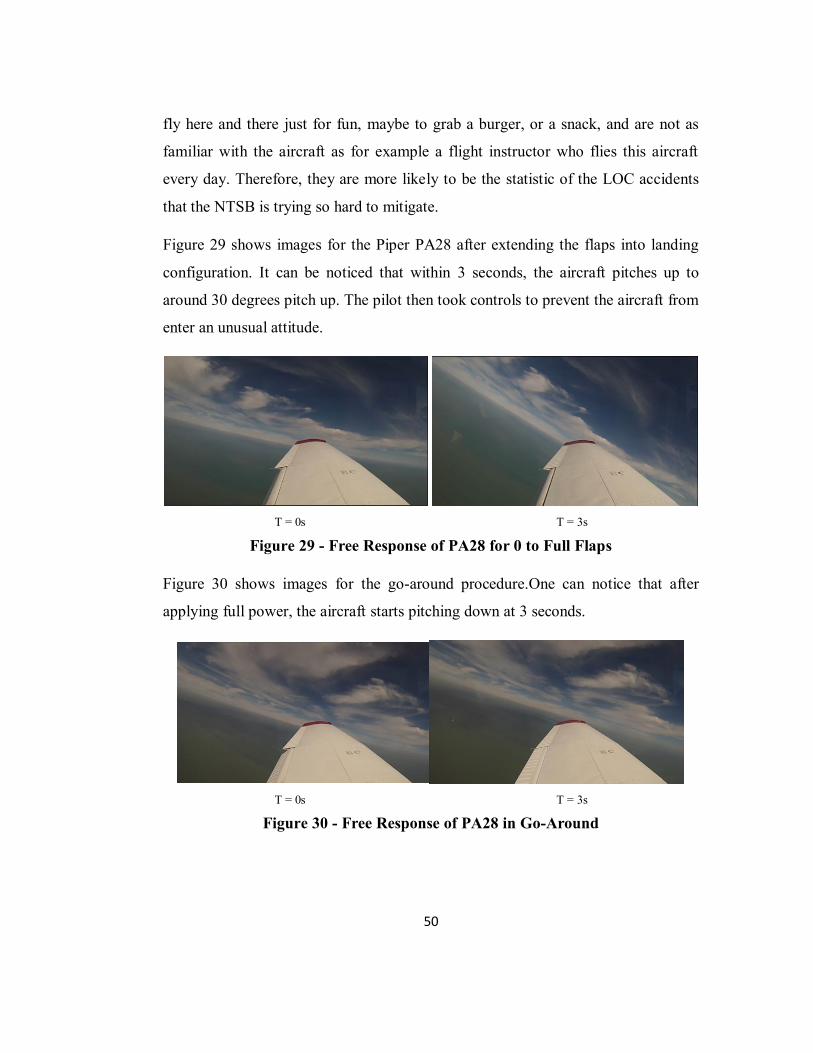
Figure 29 shows images for the Piper PA28 after extending the flaps into landing
configuration. It can be noticed that within 3 seconds, the aircraft pitches up to
around 30 degrees pitch up. The pilot then took controls to prevent the aircraft from
enter an unusual attitude.
T = 0s T = 3s
Figure 29 - Free Response of PA28 for 0 to Full Flaps
Figure 30 shows images for the go-around procedure.One can notice that after
applying full power, the aircraft starts pitching down at 3 seconds.
T = 0s T = 3s
Figure 30 - Free Response of PA28 in Go-Around

51
4.5 Rate of Change of Airspeed for the Various Aircraft
The aircraft that responds the smoothest according to the data and the plot, is the
Mooney M20. After inputting the flaps on the Mooney, the nose pitches down
slightly, increasing the airspeed by a little bit. Since the aircraft was close to
reaching the maximum flap extension speed, the flight test pilot took control of the
aircraft and recovered. The rate of change of the airspeed for the Mooney can
almost be considered as negligible. However, this might be due to the aircraft only
pitching down slightly and the test only being 5 seconds long. There is a chance
that the aircraft would have accelerated even more if the pilot would have not
intervened.
A more noticeable change can be seen with the PA28 and the C172. In both case,
the aircraft entered a nose high attitude, causing the aircraft to experience a
decrease in airspeed. According to the data, the Piper experienced a slightly quicker
decrease in airspeed than the Cessna. Overall, the PA28 and the C172 had a very
similar rate of change in airspeed. The airspeed decreased from around 90KIAS to
50 KIAS within 6 seconds.
4.6 Rate of Change of Pitch for the Various Aircraft
The graph created for the different pitch rates, makes it very clear which aircraft
has a more aggressive response than the other. It becomes clear very quickly that
the Piper PA28 is an aircraft that has a very strong upwards pitching motion when
inputting the flaps from 0° to 40°. This requires the pilot to be quick in response,
and make sure that the aircraft does not get out of control. The Pitch in this case
changes from 0° to 32° within 3 seconds, meaning that the pitch changes with 10°
per second which is a very fast rate of upward pitch. The Cessna C172 is also
known to pitch up fairly quickly, however it is much easier to recover from this
upward motion than from what can be seen by the PA28. The pitch rate is 6.5° per
52
second. This is a little more than half the pitch rate that is experienced by the Piper
PA28.
The DA40 has an even better pitch response. The aircraft reaches its maximum
upward pitching attitude of 12° after 6 seconds, making the pitch rate to be 2° per
seconds. This is such a small pitch rate, that a new student is easily able to realize
that the aircraft will pitch up when flaps are being inputted, and can properly
respond to this feature.
As already discussed in previous sections, the Mooney is slightly different when it
comes to the free response after flap input. In this case, the Mooney will have a
pitch down motion after the flaps are inputted from 0° to the maximum flap setting.
The maximum pitch down motion that was measured was 7° pitch down, which
was reached after 5 seconds. This means, that the pitch rate was 1.4° per second
pitch down. Which is also comparable to the Diamond, however in the Mooney
case, the nose pitches down rather than up, which is what we want. The reason for
this is due to the change in camber created by the flaps. Since there is a higher
amount of lift created at the trailing edge of the wing now, the aircraft experiences
a down pitching moment. Additionally, the vortices created by the flap edges or the
downwash created by the wing do not interfere with the tail, meaning that they do
not have an effect on the pitching motion of the aircraft.
When looking at the plot and seeing such a large difference in pitch rates between
the Cessna, Piper, and the other test aircraft, one might ask why the Cessna and
Piper have such an aggressive nose up pitching moment. Starting off with the
explanation for the Cessna, one can notice that the downwash created by the wing
from the Cessna, is hitting the tail, additionally pushing the tail down even more
than what would happen without the downwash, adding to an even higher pitch
rate. Looking at the effects of the downwash for the Piper, one can notice that the
tail is also affected by the downwash. Therefore also experiencing an additional
53
force pushing down on the horizontal stabilizer. With the Diamond on the other
hand, one can notice that the downwash of the Diamond wing does not hit the tail
since the aircraft has a T-Tail. This means, that the tail is staying above the
downwash created by the wing, and therefore does not get affected. Now the
question that one might ask themselves is why the Piper has almost twice the pitch
rate as the Cessna. This can be answered by looking at the flap extension
mechanisms that were discussed in Chapter 2. The Piper Archer flap extension is
done manually with a lever in between the two front seats. Flaps in this case can be
extended instantaneously without a delay. Therefore, the aircraft will respond
within seconds of the flap extension. With the Cessna on the other hand, the flap
extension is done electrically with a lever in the cockpit. After moving the lever,
the flaps are then extended by a servo located in the wing. In this case, the flaps
with take a few seconds to reach their maximum flap extension, therefore delaying
the aircrafts response. This would be the most obvious reason on why the Piper has
a much quicker response in pitch attitude, due to the flaps not having any delay in
them when being extended.
4.7 Stick Forces for Approach and Go Around
As already discussed a bit in previous sections, each of the aircraft being tested,
had different required stick forces to maintain control of the aircraft. It can be
noticed that both the Piper and the Cessna are aircraft that require the most amount
of force to maintain control of the aircraft. Although both of these planes are used
widely for flight training in the Aviation Industry, both these aircraft are designed
in such a way, that they require such a high amount of stick force to maintain
control after inputting the flaps, which can be a questionable aspect for LOC, since
one might want to have the stick force as low as possible. The stick force required
for both of these aircraft was 35lbs.

54
The lowest measured stick force in the approach configuration was for the DA40,
and was measured to be as low as 4lbs, which is very good for new students, since
in this case, they will not be shocked with an aggressive up pitching motion after
flap input. Even if the student would have not responded to the up pitching motion,
the aircraft would have entered a Phugoid motion and then settled out in straight
and level flight at around 75KIAS, making the aircraft a very "easy-to-fly" aircraft
when it comes to new students or more inexperienced pilots.
The Cirrus SR20 was measured to have a required stick force of around 22lbs to
maintain control of the aircraft, placing the aircraft in more of a Cessna and Piper
category. The aircraft is also known to have an up pitching motion after flap input.
The Cirrus can be considered to be one of the more aggressive and more dangerous
aircraft, since if the Cirrus does stall and get into an uncoordinated flight condition,
it might enter a spin, which is very difficult to recover from. Therefore, the aircraft
is also equipped with a parachute in the back part of the fuselage.
When looking at the go around cases for the all the test aircraft, it can be noticed
that the Cessna requires the most amount of stick force. Stick forces required in this
case reached a maximum of 35lbs. The go around case in the Cessna is known to be
a case that can cause a lot of accidents, especially to new students or pilots that do
not have much experience with the C172. The reason for this is exactly the high
amount of force that is required for the go around after full power is added. Cessna
recommends pilots to retract flaps from the maximum setting to 25°, however,
when it comes to the go around procedure, a lot of pilots forget that step, creating
such big stick forces which are going to be difficult to control.
Another aircraft, that has a high load when it comes to the go around procedure, is
the Mooney. The Mooney will have a stick force of around 27 lbs. Which is not as
high as with the Cessna, however still needs to be evaluated closely and taken into
consideration when conducting a go around.
55
The other test aircraft, such as the SR20, DA40, and PA28 have fairly reasonable
stick forces when it comes to the go around procedure. The SR20 requires a 12lbs
stick force, the PA28 requires a stick force of around 7lbs, and the DA40 requires a
stick force no more than 2lbs, which is a negligible force.
4.8 Effects of Downwash on Aircraft Response
As already briefly mentioned in Chapter 1, there are different aerodynamic
phenomena that effect the response of the aircraft response after flap input, such as
the location of the aerodynamic center with respect to the center of gravity. In this
subsection, one will be taking a closer look at the effects of downwash on the flight
characteristics of the aircraft. Additionally, when flaps are being deployed for
either takeoff or landing, they create flap vortices. This subsection will evaluate and
analyze each of these different cases.
When taking a look at the downwash that is being created by the aircraft wing,
there are many different performance losses that can be noted, such as a reduced
amount of lift and an increase in drag. When it comes to understanding the different
free responses of the test aircraft, it is important to have a thorough understanding
on what effects the downwash can have on the aircraft free responses. For example,
in the case of the Cessna Skyhawk or the Piper Archer, the downwash from the
wing will hit the tail of the aircraft. With the Diamond on the other hand, one will
not have this issues. Now, what happens when the downwash hits the tail of the
Cessna? The downwash of the wing in this case will change the effective angle of
attack of the tail. The new flow direction that is created by the downwash of the
main wing, will change the aerodynamics that are associated with the tail part of
the aircraft. An increased effective angle of attack in this case, will also be
associated with an increased lift coefficient, and as seen in the Lift equation that is
given in Chapter 1, an increased lift coefficient is also associated with an increased
amount of lift being created.

56
An additional feature that can be noted when looking at the downwash of the wing,
is the creation of induced drag. The lift vector always acts perpendicular to the
direction of the relative wind. Therefore, when the wing is at an angle of attack, the
lift vector will not be pointing in a straight up direction, it will be pointing slightly
backward, in the direction of the tail. A simple understanding of vectors will
quickly make it clear, that the lift vector can be split up into two components, the
horizontal component, and the vertical component. The horizontal component in
this case will be acting in the drag direction, and the vertical component of lift will
be acting upward. Therefore, we can say that the downwash will also create
negative features, such as induced drag for example.
As already mentioned above, the effectiveness of the tail will increase when it
comes to the downwash hitting the horizontal stabilizer, or tail. The reason for this
is that the free stream dynamic pressure experienced by the tail will decrease,
causing a more effective tail response.
Other aircraft that in this research would experience such a phenomena, would be
the Piper Archer, the Cirrus, and the Cessna C172. In the case of the Cessna C172
this would be due to the high wing downwash moving downward and then hitting
the horizontal stabilizer of the aircraft.
57
Chapter 5
Discussion on Loss of Control
Loss of control in flight has been one of the most significant causes of fatal aircraft
accidents for many years. Loss of control usually occurs because the aircraft enters
a flight regime which is outside its normal envelope, usually, but not always at a
high rate, thereby introducing an element of surprise for the flight crew involved.
The causes of in-flight Loss of Control, whether transitory or terminal, are many
and include:
Loss of Situational Awareness (especially due to distractions, or
complacency)
Low level wind shear or higher level Clear Air Turbulence,
Structural or multiple power plant damage caused by, for example, by a Bird
Strike, exposure to severe Turbulence, or collision with another aircraft.
Intended or unintended mishandling of the aircraft,
Attempted flight with total load or distribution outside of safe limits
An attempt to take off without ensuring that critical parts of the airframe are
(or will be at rotation) free of both frozen deposits and previously applied
ground de/anti-icing fluids
The effects of high levels of airframe ice accumulation or a significant loss of
power on all engines attributable to engine icing,
Attempting to maneuver an aircraft outside its capabilities to resolve a prior
problem (including miss-navigation).
Wake turbulence, especially if recommended spacing is not maintained

58
Pilot Induced Oscillation
Malicious interference
Aircraft being wrongly trimmed for take-off
In-Flight Loss of Control is the biggest single cause of transport aircraft fatal
accidents and hull losses. More attention to attitudes for larger aircraft operating
without a visual horizon reference is also needed, since a significant proportion of
airborne loss of control accidents still occur when, if recognition of an abnormal
aircraft attitude had been followed promptly by the optimum recovery action, a
fatal outcome could still have been avoided.
The ‘Loss of Control’ issue for light aircraft in the General Aviation industry is
much more focused on marginal VFR weather and associated with ‘press-on-itis’
and 'get-home-itis’ and on the consequences of operating aircraft which are not
certificated for flight in icing conditions, both intentionally and unintentionally.
Light aircraft pilots not adequately trained in instrument flight who end up in
conditions which require it, may also end up unable to retain aircraft control until a
visual horizon can be re-acquired.
Contributing factors associated with Loss of Control include:
Distraction
Adverse weather
Complacency
Insufficient height above terrain for recovery
Lack of awareness of or competence in procedures for recovery from unusual
aircraft attitudes
59
Inappropriate flight control inputs in response to a sudden awareness of an
abnormal bank angle
The FAA has tried to implement many new different regulations to aircraft
accidents that have been associated with Loss of Control in Flight, however, the
real question is, how effective these new regulations really have been so far.
A big regulation that was implemented after the Colgan accident, was the new
minimum require amount of 1500hours of flight time in order to obtain an ATP.
Now, many pilots trying to become professional pilots question on whether or
not this "new" regulation is effective or whether or not it just looks good on
paper.
There are many different solutions that can be implemented in order for the pilot
to gain more experience in the Loss of Control areas, rather than "punishing"
aspiring professional pilots with the duty of obtaining more hours.
Solutions for GA and light transport category aircraft include:
Aircraft Unusual Attitude Recovery Training in all Full Flight Simulator
Type Conversion and Recurrent Training programs
Angle of Attack indicators in GA aircraft to prevent from stalling at slow
airspeeds
Better pre-departure access for GA pilots from small aerodromes or private
strips to the latest en route weather information - increase use of online
methods
A mandate to fit bank angle alerting systems which can also be introduced to
multi engine aircraft
Better training techniques for students

60
Minimum required hours flown per month to remain current, rather than just
saying "In order to carry passenger, the pilot in command has to have
completed 3 take off and landings in the past 90 days".
Putting student pilots into different scenarios which have been determined as
critical scenarios, in order to ensure that they are familiar with abnormal
situations.
Incorporate different stall warning systems into the aircraft, or systems that
warn the crew of an approaching stall in order for them to be able to quickly
recover.
Incorporating a flap-elevator interconnect, which will automatically respond
to any additional forces required to maintain control of the aircraft once flaps
are retracted or extended.
61
Chapter 6
Conclusion
This thesis examined airplane response to flap extension. The Flight Test Engineers
looked at five aircraft. The test program had two objectives. The first was to
measure the pitch control forces required to maintain altitude after flap extension.
The second was to measure airplane response with no pitch control inputs after flap
extension. Control forces to maintain altitude for the Piper and the Cessna were
substantial. The corresponding free airplane responses showed the impact of these
larger control forces. Pitch attitude for those airplanes went to over 30° degrees in
only 5 seconds. The Mooney M20C, and the Diamond DA40 had negligible pitch
attitude changes along with minor airspeed changes. I recommend setting the
maximum single-hand force in CFR §23.143 to be 20 pounds, instead of 50
pounds. That would force airplane developers to address the issue on future
designs. Existing airplanes could use a smaller horizontal tail, change a
conventional tail to a T-tail, or interconnect the flaps with the elevator. Regardless
of the solution, the airplane would need to be re-certified by the FAA.
More flight test on General Aviation aircraft is recommended. The free responses
should go further in time. Other makes and models should be examined. Twin-
engine aircraft should also be tested.
62
References
[1] National Transportation Safety Board, "NTSB 2017 - 2018 Most Wanted,"
2018. [Online].https://www.ntsb.gov/safety/mwl/Pages/default.aspx
[Accessed 22 August 2018]
[2] B.A. Kish, T. Bernard, R. Kimberlin, "A Limited Investigation of Airplane
Response to Flap Extension", IEEE Aerospace Conference, 2016
[3] Electronic Code of Federal Regulations, Title 14, Chapter I, Subchapter C, Part
23, Subpart B, §23.143.
[4] Electronic Code of Federal Regulations, Title 14, Chapter I, Subchapter C, Part
23, Subpart B, §23.145.
[5] Pilot Handbook of Aeronautical Knowledge [Online]
https://www.faa.gov/regulations_policies/handbooks_manuals/aviation/phak/
[6] Piper PA28 Archer Pilot Operating Handbook (POH)
[Online]. http://www.sfcaero.com.au/pdf/PA-28-181%20Archer%20III.pdf
[Accessed 22 August 2018]
[7] Cessna C172N Pilot Operating Handbook (POH)
[8] Cirrus SR20 Pilot Operating Handbook (POH)
[Online]. http://www.flymaa.org/assets/cirrus-sr20-poh.pdf
[Accessed 22 August 2018]
[9] Mooney M20C Pilot Operating Handbook (POH)
[Online]. http://www.deltaaviation.com/Nav%20Page/
POH/M20J%20POH1233A.pdf[Accessed 22 August 2018]
[10] Diamond DA40 Pilot Operating Handbook (POH)
[Online]. Available:http://support.diamond-air.at/DA40-
180_afm_bas+M52087573ab0.html[Accessed 22 August 2018]
[11] Kimberlin, Ralph D., Flight Testing of Fixed-Wing Aircraft, AIAA Education
Series, 2003

63
Appendix: Collected Data
Table 5Flaps 0-40 for Cessna C172
Time (s) Pitch (deg) Airspeed (KTS)
1 0 90
2 5 90
3 10 85
4 15 80
5 20 75
6 25 70
7 25 70
8 25 65
9 25 60
10 25 50
11 25 45
12 15 40
13 10 40
14 0 40
15 -5 45
16 -7 50
17 -7 50
18 -4 55
19 -3 55
20 0 60
21 0 60
22 0 60
23 0 60
24 0 60

64
Table 6Flaps 0-Fully extended for Diamond DA40
Time (s) Pitch (deg) Airspeed (KTS)
1 0 90
2 2 90
3 4 90
4 5 85
5 8 80
6 10 75
7 12 70
8 10 60
9 5 60
10 0 60
11 -3 62
12 -5 63
13 -8 65
14 -10 70
15 -12 70
16 -16 75
17 -18 80
18 -15 85
19 -10 87
20 -5 90
21 -3 90
22 -2 90
23 0 90
24 1 90
25 3 87
26 5 86
27 3 85
28 2 85
29 2 80
30 1 75
31 0 75

65
Table 7 - Flaps 0-Fully extended for Mooney M20C
Time Pitch Airspeed
1 -1 118
2 -3 119
3 -4 120
4 -5 121
5 -7 122
6 - -
7 - -
8 - -
9 - -
10 - -
11 - -
12 - -
13 - -
14 - -
15 - -
16 - -
17 - -
18 - -
19 - -
20 - -
21 - -
22 - -
23 - -
24 - -
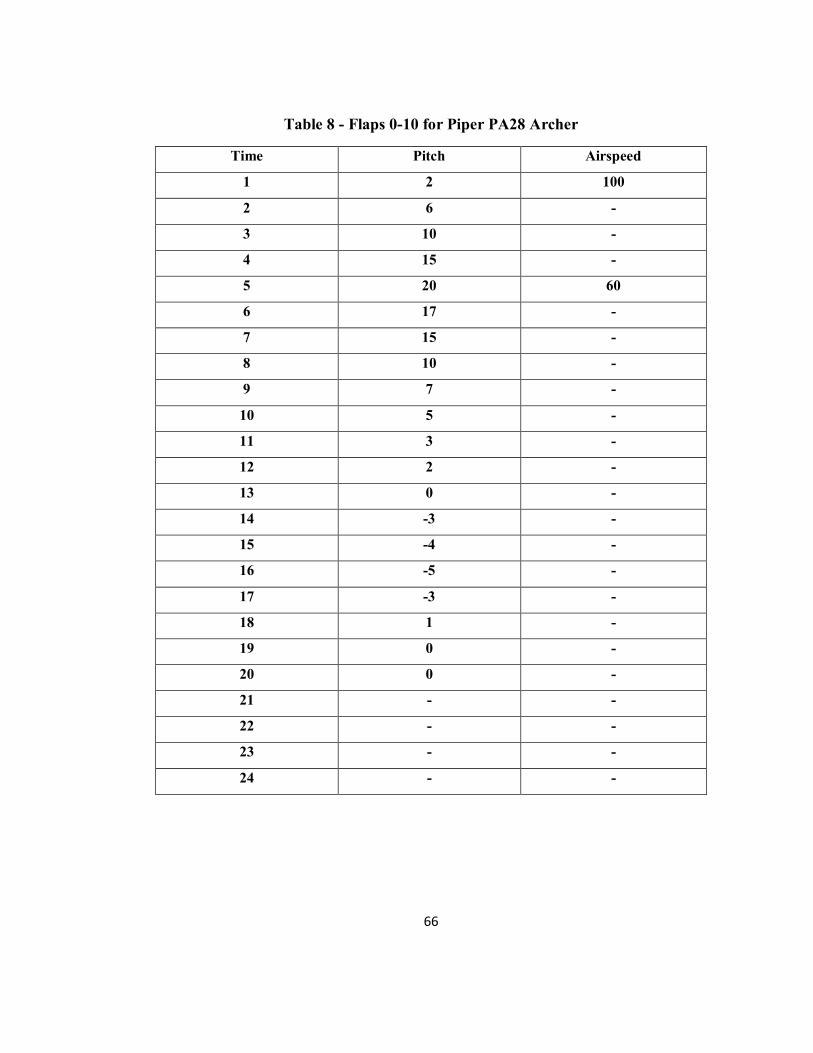
66
Table 8 - Flaps 0-10 for Piper PA28 Archer
Time Pitch Airspeed
1 2 100
2 6 -
3 10 -
4 15 -
5 20 60
6 17 -
7 15 -
8 10 -
9 7 -
10 5 -
11 3 -
12 2 -
13 0 -
14 -3 -
15 -4 -
16 -5 -
17 -3 -
18 1 -
19 0 -
20 0 -
21 - -
22 - -
23 - -
24 - -
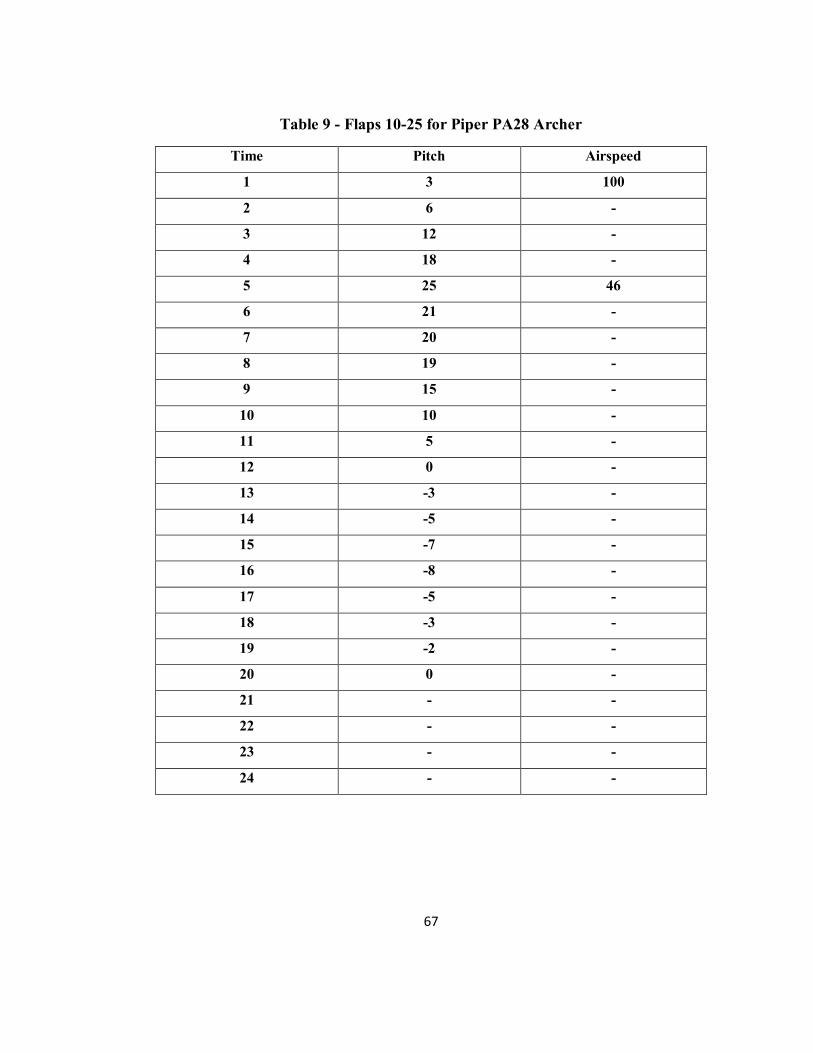
67
Table 9 - Flaps 10-25 for Piper PA28 Archer
Time Pitch Airspeed
1 3 100
2 6 -
3 12 -
4 18 -
5 25 46
6 21 -
7 20 -
8 19 -
9 15 -
10 10 -
11 5 -
12 0 -
13 -3 -
14 -5 -
15 -7 -
16 -8 -
17 -5 -
18 -3 -
19 -2 -
20 0 -
21 - -
22 - -
23 - -
24 - -

68
Table 10 - Flaps 25-40 for Piper PA28 Archer
Time Pitch Airspeed
1 5 100
2 12 -
3 14 -
4 15 -
5 20 -
6 23 -
7 27 39
8 25 -
9 20 -
10 15 -
11 8 -
12 0 -
13 -3 -
14 -5 -
15 -2 -
16 0 -
17 0 -
18 0 -
19 0 -
20 0 -
21 - -
22 - -
23 - -
24 - -

69
Table 11 - Flaps 0-40 for Piper PA28 Archer
Time Pitch Airspeed
1 10 100
2 20 -
3 32 -
4 32 -
5 32 -
6 30 -
7 25 -
8 15 -
9 10 -
10 0 -
11 -3 -
12 -5 -
13 -7 -
14 - -
15 - -
16 - -
17 - -
18 - -
19 - -
20 - -
21 - -
22 - -
23 - -
24 - -