Free energy of formation of zircon based on solubility ...manning/pdfs/n10.pdf · NEWTON ET AL.:...
7
American Mineralogist, Volume 95, pages 52–58, 2010 0003-004X/10/0001–052$05.00/DOI: 10.2138/am.2010.3213 52 Free energy of formation of zircon based on solubility measurements at high temperature and pressure ROBERT C. NEWTON, 1 CRAIG E. MANNING, 1, * JOHN M. HANCHAR , 2 AND CLINTON V. COLASANTI 1 1 Department of Earth and Space Sciences, University of California at Los Angeles, Los Angeles, California 90095, U.S.A. 2 Department of Earth Sciences, Memorial University, St. Johns, Newfoundland A1B 3X5, Canada ABSTRACT The standard Gibbs energy of formation of zircon was constrained by measuring the solubility of silica in H 2 O in equilibrium with zircon and baddeleyite at 800 °C, 12 kbar, by a sensitive weight- change method. Dissolution occurs incongruently according to the reaction: ZrSiO 4 = ZrO 2 + SiO 2(t) zircon baddeleyite where SiO 2(t) is total dissolved silica. Blank runs demonstrated that the effects of ZrO 2 solubility and/or capsule-Pt transfer were near the weighing detection limit, so weight losses or gains could be ascribed quantitatively to SiO 2 solubility. Precise SiO 2(t) concentrations were ensured by use of three types of starting material, by approaching equilibrium from zircon-undersaturation and oversaturation, and by demonstrating time-independence of the measurements. The results yielded a SiO 2 concentration of 0.069 ± 0.002 (1 se) moles per kg H 2 O (m s ), or a mole fraction (X s ) of 1.23 × 10 –3 ± 3.3 × 10 –5 . Two runs on zircon solubility in NaCl-H 2 O solutions at 800 °C and 10 kbar showed silica solubility to decrease by nearly 1% per mol% NaCl. The standard molar Gibbs free energy of formation of zircon from the oxides at a constant P and T is given by: G RT X X f ox zr s ZB s ZB s Q s Q , , ln where ZB and Q refer, respectively, to equilibrium with zircon-baddeleyite and quartz, L s is the activity coefficient of total silica, and the relationship between L s and X s accounts for aqueous silica activity. Our results yield )G° f,ox,zr = –18.5 ± 0.7 kJ/mol at 800 °C, 12 kbar (95% confidence), or a standard apparent Gibbs free energy of formation from the elements of –1918.3 ± 0.7 kJ/mol at 25 °C, 1 bar. Our value is consistent with determinations based on phase equilibrium studies, within reported error limits, but is more precise than most previous values. However, it is less negative than high-temperature determina- tions by calorimetry and electrochemistry. Our results indicate that solubility measurements at high T and P may be a superior method of free energy determination of other refractory silicate minerals. Keywords: Experimental petrology, phase equilibria, thermodynamics, zircon INTRODUCTION Zircon, ZrSiO 4 , is one of the most important minerals for geochronology (Davis et al. 2003) and for tracing geologic processes (e.g., Hoskin and Schaltegger 2003; Hanchar and Watson 2003). In addition to its ability to incorporate U and Th and exclude non-radiogenic Pb, it possesses great thermo- dynamic stability. This stability is manifest in its low solubility in aqueous fluids and magmas, and in its compatibility with most common rock-forming mineral assemblages over large ranges of pressure (P) and temperature (T). Zircon saturation in H 2 O-bearing granite melts near liquidus temperatures occurs at Zr contents of only about 100 ppm (Harrison and Watson 1983), which virtually guarantees that it is a common liqui- dus mineral. In addition, low diffusion rates in zircon enable retention of radioactive and daughter isotopes as well as other constituent elements (Cherniak and Watson 2003), which lead to zircon’s utility in geothermometry (e.g., Watson and Harrison 2005; Watson et al. 2006; Ferry and Watson 2007). Finally, the refractory character of zircon promotes survival through dyna- mothermal events subsequent to crystallization. These factors conspire to make zircon a common phase in many igneous, metamorphic, and sedimentary lithologies. The great stability of zircon has hampered attempts to define its fundamental thermodynamic properties. Insolubility in acids * E-mail: [email protected]
Transcript of Free energy of formation of zircon based on solubility ...manning/pdfs/n10.pdf · NEWTON ET AL.:...

American Mineralogist, Volume 95, pages 52–58, 2010
0003-004X/10/0001–052$05.00/DOI: 10.2138/am.2010.3213 52
Free energy of formation of zircon based on solubility measurements at high temperature and pressure
ROBERT C. NEWTON,1 CRAIG E. MANNING,1,* JOHN M. HANCHAR,2 AND CLINTON V. COLASANTI1
1Department of Earth and Space Sciences, University of California at Los Angeles, Los Angeles, California 90095, U.S.A.2Department of Earth Sciences, Memorial University, St. Johns, Newfoundland A1B 3X5, Canada
ABSTRACT
The standard Gibbs energy of formation of zircon was constrained by measuring the solubility of silica in H2O in equilibrium with zircon and baddeleyite at 800 °C, 12 kbar, by a sensitive weight-change method. Dissolution occurs incongruently according to the reaction:
ZrSiO4 = ZrO2 + SiO2(t) zircon baddeleyite
where SiO2(t) is total dissolved silica. Blank runs demonstrated that the effects of ZrO2 solubility and/or capsule-Pt transfer were near the weighing detection limit, so weight losses or gains could be ascribed quantitatively to SiO2 solubility. Precise SiO2(t) concentrations were ensured by use of three types of starting material, by approaching equilibrium from zircon-undersaturation and oversaturation, and by demonstrating time-independence of the measurements. The results yielded a SiO2 concentration of 0.069 ± 0.002 (1 se) moles per kg H2O (ms), or a mole fraction (Xs) of 1.23 × 10⁻³ ± 3.3 × 10⁻⁵. Two runs on zircon solubility in NaCl-H2O solutions at 800 °C and 10 kbar showed silica solubility to decrease by nearly 1% per mol% NaCl.
The standard molar Gibbs free energy of formation of zircon from the oxides at a constant P and T is given by:
G RTXXf ox zr
sZB
sZB
sQ
sQ, , ln
where ZB and Q refer, respectively, to equilibrium with zircon-baddeleyite and quartz, s is the activity coefficient of total silica, and the relationship between s and Xs accounts for aqueous silica activity. Our results yield G°f,ox,zr = –18.5 ± 0.7 kJ/mol at 800 °C, 12 kbar (95% confidence), or a standard apparent Gibbs free energy of formation from the elements of –1918.3 ± 0.7 kJ/mol at 25 °C, 1 bar. Our value is consistent with determinations based on phase equilibrium studies, within reported error limits, but is more precise than most previous values. However, it is less negative than high-temperature determina-tions by calorimetry and electrochemistry. Our results indicate that solubility measurements at high T and P may be a superior method of free energy determination of other refractory silicate minerals.
Keywords: Experimental petrology, phase equilibria, thermodynamics, zircon
INTRODUCTION
Zircon, ZrSiO4, is one of the most important minerals for geochronology (Davis et al. 2003) and for tracing geologic processes (e.g., Hoskin and Schaltegger 2003; Hanchar and Watson 2003). In addition to its ability to incorporate U and Th and exclude non-radiogenic Pb, it possesses great thermo-dynamic stability. This stability is manifest in its low solubility in aqueous fluids and magmas, and in its compatibility with most common rock-forming mineral assemblages over large ranges of pressure (P) and temperature (T). Zircon saturation in H2O-bearing granite melts near liquidus temperatures occurs
at Zr contents of only about 100 ppm (Harrison and Watson 1983), which virtually guarantees that it is a common liqui-dus mineral. In addition, low diffusion rates in zircon enable retention of radioactive and daughter isotopes as well as other constituent elements (Cherniak and Watson 2003), which lead to zircon’s utility in geothermometry (e.g., Watson and Harrison 2005; Watson et al. 2006; Ferry and Watson 2007). Finally, the refractory character of zircon promotes survival through dyna-mothermal events subsequent to crystallization. These factors conspire to make zircon a common phase in many igneous, metamorphic, and sedimentary lithologies.
The great stability of zircon has hampered attempts to define its fundamental thermodynamic properties. Insolubility in acids * E-mail: [email protected]

NEWTON ET AL.: FREE ENERGY OF FORMATION OF ZIRCON 53
TABLE 1. Summary of data for zircon !G°f at 1 bar!G°f,elements at !G°f,oxides at Uncertainty Source298 K (kJ/mol) 1073 K (kJ/mol) type –1919.3 ± 2.3 –12.9 ± 2.3 1 Rosén and Muan (1965)*–1923.3 ± 3.9 –17.0 ± 3.9 1 Schuiling et al. (1976)–1917.4 –11.1 0 Berman (1988)–1922.9 ± 3.7 –16.5 ± 3.7 2 Ellison and Navrotsky (1992)–1919.7 –13.4 0 Robie and Hemingway (1995)–1917.3 ± 3.4 –11.0 ± 3.4 2 Holland and Powell (1998)–1918.5 ± 1.5 –12.2± 1.5 1 Ferry et al. (2002), consistent with Holland and Powell (1998)–1917.5 ± 1.3 –11.2 ± 1.3 1 Ferry et al. (2002), consistent with Berman (1988)–1918.5 ± 1.2 –12.1 ± 1.2 2 Newton et al. (2005)–1920.9 ± 0.4 –14.5 ± 0.4 2 O’Neill (2006)–1918.3 ± 0.7 –11.9 ± 0.7 2 Present studyNote: High-T experimental values from listed sources were combined with Robie and Hemingway (1995) heat capacities and oxide data to calculate 298 and 1073 K values, and high-P data recalculated at 1 bar using compressibilities in Holland and Powell (1998) (errors in these data are neglected as they are shared); values may therefore differ from those reported in original source. Uncertainty types: 0, no error reported; 1, one half the range between minimum and maximum constraints; 2, 95% confidence interval. * Average of values between 1453–1639 K.
or other aqueous fluids at low P and T renders conventional solution calorimetry ineffective. A paucity of reversible reac-tions with other refractory substances at elevated P-T conditions accounts for exclusion of zircon from earlier self-consistent data sets of thermodynamic properties based primarily on experimental phase equilibrium.
The first experimental determination of the Gibbs free energy of formation of zircon from its oxides, G°f,ox,zr, was performed by Rosén and Muan (1965). They measured the CO/CO2 ratios of gases equilibrated with zircon, ZrO2, CoSiO4, Co metal, and SiO2 at 1 bar and 1180–1366 °C. Solid-vapor equilibrium was established for two reactions:
ZrO2 + Co2SiO4 + 2 CO = ZrSiO4 + 2 Co + 2 CO2 (1)Co2SiO4 + 2 CO = 2 Co + SiO2 + 2 CO2. (2)
The actual ZrO2 and SiO2 phases encountered in this study were the high-T tetragonal form and cristobalite, respectively. When reactions 1 and 2 are combined, and allowance is made for phase changes in ZrO2 and SiO2, the data yield zircon formation from its oxides:
ZrO2 + SiO2 = ZrSiO4. (3)baddeleyite quartz zircon
The equilibrium constant of the zircon-forming reaction involves only the CO/CO2 ratios of the two redox reactions. Though the ratios were measured precisely, the limited temperature range of the Rosén and Muan (1965) observations yields unreliable extrapolation to lower temperatures, as the T dependence of the equilibrium constant is inconsistent with that derived from calorimetric study (Ellison and Navrotsky 1992).
Schuiling et al. (1976) constrained G°f,ox,zr by investigating monotropic reactions of zircon with other minerals in SiO2-undersaturated systems at 1000 K and 1 kbar. They bracketed the SiO2 activity buffered by zircon + baddeleyite based on the SiO2 activities defined by several equilibria involving zircon and minerals whose free energies of formation were reasonably well known. Their derived G°f,ox,zr was only constrained broadly within a range of 7.8 kJ/mol, exclusive of uncertainties in G°f of the other minerals in the reactions.
Ellison and Navrotsky (1992) measured the enthalpies of solution of zircon, baddeleyite, and quartz at 977 K in Pb2B2O5 melt; this was the first successful enthalpy of formation measure-ment on zircon. This measurement, in conjunction with exist-ing low-temperature heat capacity and high-temperature heat content data for the phases, provided G°f,ox,zr values over a large T range. Though Ellison and Navrotsky (1992) identified the general range of zircon enthalpy and free energy, the relatively low precision of the high-T solution calorimetry method yields large uncertainties (Table 1).
Thermodynamic properties for zircon tabulated in the major data sets draw from the above sources and are subject to the largest uncertainties for any orthosilicate in the tables. Holland and Powell (1998) cite the zircon free energy data given in the compendium of Robie et al. (1979), which, in turn, cites Schuil-ing et al. (1976), though the values given in these sources are greatly disparate. The Berman (1988) value is close to that of
Holland and Powell (1998), but suffers from the same limitations in source data, though uncertainties are not reported. The tables of Robie and Hemingway (1995) give yet a different value for zircon free energy of formation (Table 1).
Ferry et al. (2002) determined three reversed brackets of the univariant equilibrium:
ZrSiO4 + 2 MgCO3 = Mg2SiO4 + ZrO2 + 2 CO2 (4)zircon magnesite forsterite baddeleyite
at 800–900 °C, 7–12 kbar. These are the only existing reversed phase equilibrium data of sufficient precision to define the free energy of zircon relative to other substances with measured thermodynamic properties. However, the tabulated free energy data of the minerals of reaction 4 differ substantially between the major data sets. Moreover, the free energy data for CO2 given by Mäder and Berman (1991) and Holland and Powell (1998) data sets differ by about 2 kJ/mol in this P-T range. For these reasons, the derived free energy of formation in Table 1 differs by 1 kJ depending on the data set used to supply thermodynamic data for participating phases.
Newton et al. (2005) showed that the concentration of silica in H2O in equilibrium with the zircon + baddeleyite buffer:
ZrSiO4 = ZrO2 + SiO2(t) (5)zircon baddeleyite
at high P and T could be used to constrain thermodynamic prop-erties of zircon. Synthetic zircon single crystals were altered to baddeleyite in tightly adhering surface coatings after 2–4 days at 800 °C, 12 kbar. Weight losses gave apparent SiO2(t) molality of about 0.07 under the interpretation of reaction 5. These data, in conjunction with an activity-concentration model for aqueous silica (Newton and Manning 2003), yielded a value for zircon free energy of formation that is independent of previous assess-ments and more precise than most (Table 1). However, this study lacked rigorous blank testing and used a limited set of materials to measure solubility.
The most precise determination of the free energy of forma-

NEWTON ET AL.: FREE ENERGY OF FORMATION OF ZIRCON54
TABLE 2. Experimental results, 800 °C, 12 kbarExpt. no. Starting Time (h) wt Qtz wt inner wt inner wt H2O (mg) mSiO2† 103XSiO2† Reaction material* in (mg) capsule in (mg) capsule out (mg) (mol/kg ±0.002) (±0.04) direction‡ZR-2 F-ZB 110 65.723 65.609 32.282 0.057 1.02 ZR-3 F-ZBQ 115 0.187 71.992 72.058 32.118 0.061 1.09 ZR-4 S-Z 109 70.303 70.185 32.967 0.058 1.04 ZR-6 F-ZBQ 92 0.229 74.819 74.887 32.546 0.080 1.44 ZR-8 F-ZBQ 116 0.131 73.749 73.744 33.154 0.066 1.19 ZR-9 P-BQ 100 0.311 83.709 83.874 33.183 0.071 1.28 ZR-10 F-ZBQ 116 0.208 74.020 74.078 33.166 0.073 1.32 ZR-11 S-(ZB)Q 110 0.172 66.027 66.065 32.676 0.066 1.19 ZR-12 S-Z 112 68.030 67.899 32.877 0.064 1.16 ZR-13 P-BQ 112 0.264 79.934 80.035 33.465 0.079 1.42 ZR-14 S-(ZB)Q 112 0.188 69.154 69.196 33.157 0.071 1.28 ZR-16 P-BQ 96 0.339 67.490 67.683 31.539 0.075 1.35 ZR-17 S-ZQ 88 0.085 66.533 66.483 32.775 0.067 1.20 ZR-18 S-Z 70 66.432 66.289 34.056 0.068 1.22 ZR-20 S-ZQ 72 0.042 2.605§ 2.500§ 32.768 0.073 1.31 ZR-21 P-BQ 61 0.403 75.704 75.900 34.540 0.098 1.76 ZRS-3 S-Z 5 74.448 74.283 37.913 0.071 1.27 ZRS-1|| S-Z 24 80.069 79.948 33.537 0.058 1.04 ZRS-2|| S-Z 20 74.195 74.108 26.553 0.052 0.94 * Abbreviations: S = single crystal; F = fine-grained synthetic crystals; P = sintered pellet; B = baddeleyite; Q = quartz (single crystal, in outer capsule); Z = zircon; ZB = zircon crystal coated with fine-grained baddeleyite† mSiO2
and XSiO2corrected for 0.004 mg ZrO2 solubility and/or Pt loss (Table 3, see text). Uncertainty is 1", from propagated 1" = 2 µg error in all weights.
‡ Downward-pointing and upward-pointing arrows denote equilibrium approached from high and low concentration, respectively.§ Weight of zircon crystal; no inner capsule used.|| Experiments with added NaCl. NaCl mole fraction was 0.103 in ZRS-1 and 0.198 in ZRS-2.
tion of zircon is that of O’Neill (2006), in an electrochemical cell using the zirconia solid electrolyte at 1100–1300 K. Oxygen potentials of two assemblages—fayalite-iron-quartz and fayalite-iron-baddeleyite-zircon—were measured; their difference, at a given temperature, gives a free energy change of reaction 3 that is more negative than most phase-equilibrium determinations (Table 1). In spite of the high precision of the determination of O’Neill (2006) (±0.4 kJ, 2 ), the results cannot be considered definitive for several reasons, including the fact that the tem-perature coefficient of the free energy of formation of fayalite differs considerably from the previous determination of O’Neill (1987), which was used to calculate the zircon free energy. Also, the thermophysical properties and monoclinic-to-tetragonal in-version temperature of baddeleyite preferred by O’Neill (2006) differ substantially from those recently reported by Moriya and Navrotsky (2006).
In view of the continuing disagreement in the thermodynamic properties of zircon, the present study built on Newton et al. (2005) in an attempt to improve accuracy and precision of the silica concentration in equilibrium with zircon, baddeleyite, and H2O (reaction 5) at 800 °C and 12 kbar, which would then yield an improved value for G°f,ox,zr (reaction 3). A variety of starting materials in different states of aggregation were used, and emphasis was placed on demonstration of reversibility and time-independence of measurements, as well as narrowly defined brackets. Several solubility measurements were also made on ZrO2 (baddeleyite) in H2O, and on zircon and baddeleyite in moderately concentrated NaCl solutions, to explore the possible effects of any solute species other than silica.
EXPERIMENTAL METHODSThree kinds of starting materials were used (Table 2). Ten experiments, seven
of which are from Newton et al. (2005), employed euhedral, synthetic, flux-grown zircon crystals (~0.5 mm; Hanchar et al. 2001). The crystals were optically flawless and contained no visible flux inclusions. A second type of starting material, used in five runs (Table 2), was a fine-grained polycrystalline mixture of zircon and
baddeleyite of subequal mass, synthesized hydrothermally at 900 °C and 12 kbar for 48 h from a baked (900 °C, 20 min) mixture of ZrO2 reagent (Matheson) plus ultrapure SiO2 (Aesar). The ZrO2 contained a maximum of 2 wt% Hf as the only significant impurity. The synthesis yielded equant crystals of zircon up to 80 m diameter. The baddeleyite was recrystallized but finer-grained (~5 m). Tetragonal unit-cell constants of the zircon were determined by powder X-ray diffraction scans (CuK 1, 1 °2 /min), using the baddeleyite peaks (ASTM file 36-420) as an internal standard. The values of ao = 6.600(1) and co = 5.975(2) (1 ) are in exact agreement with those given in ASTM file 6-0266. The third kind of starting material was a sintered pellet of the Matheson ZrO2 (four experiments; Table 2). Reagent ZrO2 was pelletized under pressure and heated in air at 1100 °C for 2 h—close to, but below the upper stability limit of baddeleyite relative to high-T, tetragonal ZrO2. Chips of the pellet weighing 2 to 7 mg were rounded into small ellipsoids with a file and smoothed with 600-mesh Al2O3 paper prior to use.
In each experiment, the starting material was encased in an inner capsule formed from a 3 mm long, 1.5 mm O.D. Pt tube that was lightly crimped at the ends and perforated with small pinholes to allow access of fluids. Inner capsules were necessary to confine granular starting materials and reaction products. Tubes and solid materials were heated in air at 400 °C for 10–15 min prior to weighing in, to purge any volatiles. The inner capsule was then placed in a ~1.6 cm long, 3 mm O.D. Pt capsule with 0.02 mm wall thickness, with ~33 mg distilled and deionized H2O. In most runs, a small natural quartz chip (Newton and Manning 2000) was also weighed into the outer capsule. Because the quartz dissolves very rapidly at high P and T, it is assumed that this approach set the initial silica concentration above or below the final value prior to significant zircon reaction, permitting approach to equilibrium from over- or undersaturation.
Experiments were conducted in a ¾ inch diameter piston-cylinder apparatus with NaCl pressure medium and graphite heater sleeve. Temperatures were measured and controlled with W3%Rh-W25%Rh thermocouples. Pressure and temperature uncertainties are ±300 bars and ±3 °C.
Runs were terminated by quenching to below 200 °C in <12 s. Retrieved and cleaned capsules weighed within 0.03% of starting values. H2O contents were checked by puncturing and drying the capsules at 115 °C for 15 min followed by 320 °C for 15 min, taking care to retain all of the solid residue. The H2O determined this way was within 0.6% of the initial values. The outer capsules were cut open with a razor blade, taking care not to score the inner capsule. Interiors of the outer capsules were examined for vapor-transport or escaped crystals (Caciagli and Man-ning 2003; Tropper and Manning 2005). Two experiments in which they were found were discarded. In all of the other experiments, only a dried residue was present in the outer capsules. This thin coating of translucent siliceous gel was interpreted as quench from the fluid phase. Contents of the inner capsules were retrieved after weighing and examined in immersion oils with the optical microscope, by scan-ning electron microscopy, and in some cases by X-ray diffraction, to confirm the

NEWTON ET AL.: FREE ENERGY OF FORMATION OF ZIRCON 55
reaction direction as indicated by the weight changes.Several experiments were made to determine weight losses from ZrO2 and/or
Pt dissolution (Table 3). Most of these experiments were made with the sintered pellet material without quartz. Two experiments with quartz, but undersaturated with respect to zircon, were made to calibrate the effect of the small amount of quenched and dried siliceous vapor precipitate in the inner capsule.
Two experiments on zircon and one on baddeleyite were conducted with added NaCl (Tables 2 and 3). NaCl was first loaded into the outer capsule a solid reagent, and then H2O was added so as to achieve a desired NaCl mole fraction. These runs tested for possible ZrO2 or ZrSiO4 solubility enhancements similar to that found in Al2O3 (Newton and Manning 2006, 2008).
Weights were determined with a Mettler M3 microbalance (1 = 2 g). Several blank experiments utilized a higher precision ultramicrobalance, for which 1 = 0.2 g. Concentration uncertainties in Table 2 are solely due to propagated weighing errors.
RESULTS
Experimental data are given in Tables 2 and 3. Weight losses of the inner capsules were interpreted as SiO2 loss via baddeleyite growth during incongruent dissolution of zircon; these runs ap-proached equilibrium SiO2 fluid concentration from the under-saturated direction. Nucleation and growth of baddeleyite was confirmed for the single-crystal experiments by SEM images, which showed tightly adhering fine-grained baddeleyite coating the zircons, with preservation of the zircon crystal morphology (Newton et al. 2005). Nucleation and growth of zircon in the reversal experiments, indicated by weight gains of the inner Pt capsules, was confirmed by SEM images of the sintered ZrO2 pellets. Figure 1 shows large, flat zircon crystals that nucleated and grew on the surface of a sintered ZrO2 pellet in one experi-ment (ZR-9) in which the initial SiO2 content of the fluid (0.16 m) substantially exceeded the final concentration (0.07 m), as indicated by the weight gain. Minor coarsening of baddeleyite grains of the substrate is also evident.
Blank runs (Table 3) indicate an average weight loss of 0.004 mg, from ZrO2 solubility and/or Pt transfer from the in-ner capsule. These marginally significant effects could not be separated; they may be merely the result of “steam cleaning” of the Pt. In any case, the small amount of ZrO2 in the fluid phase from zircon dissolution does not contribute significantly to the total weight change, which can therefore be ascribed to SiO2. Thus, after incorporation of a blank correction of –0.004 mg into results, the remaining weight change was used to compute the final SiO2 concentrations of Table 2.
TABLE 3. Blank experiments on ZrO2 and empty capsules, 800 °C, 12 kbar
Expt. Starting Time wt inner wt inner wt quartz wt H2O !ic no. no. material (h) capsule capsule (mg) (mg) (mg) in (mg) out (mg) 2 none 5 78.390 78.386 0 33.069 –0.0043 none 24 72.137 72.134 0 32.956 –0.003ZrO2-6 P-B 24 76.198 76.190 0 33.337 –0.008ZrO2-2 P-B 69 76.685 79.681 0 36.256 –0.004ZR-19 P-B 70 60.945 60.942 0 32.366 –0.003ZR-15 P-B 72 65.311 65.307 0 32.452 –0.004ZrO2-1* P-B 48 48.958 48.958 0 23.704* –0.000ZR-24 P-BQ 20 65.9866 65.9848 0.0701 37.599 –0.0018ZR-25 P-BQ 20 68.8402 68.8390 0.1542 38.554 –0.0012Notes: See Table 2 for abbreviations. Weights reported to three decimal places were determined on a Mettler M3 microbalance (1" = 2 µg), whereas those reported to four places were determined on a Mettler UMX2 ultramicrobalance (1" = 0.2 µg). * NaCl mole fraction was 0.214.
FIGURE 1. (a) Backscattered electron image of sintered ZrO2 pellet from experiment ZR-9 (Table 2), showing spontaneously nucleated large zircon crystals grown from small initial SiO2 oversaturation at 800 °C and 12 kbar. Region in white box enlarged in b.
Results of experiments show no systematic differences between the three kinds of starting material. Figure 2a indicates that runs approaching equilibrium from undersaturation yield a similar solubility independent of run duration, even in the case of the 5 h experiment (ZRS-3). By contrast, runs in which Si concentration was initially supersaturated appear to take longer to equilibrate: run ZR-21 (61 h) appears to be underequilibrated relative to longer experiments, although its initial SiO2 concen-tration was also furthest from the final value (Table 2). Slight crossovers of the mean SiO2 concentration occurred from op-posite directions, in experiments ZR-20 (flux-grown crystals) and ZR-3 (fine-grained crystal mixture).
Figure 2a thus demonstrates that the experiments yielded a constant solution concentration that is independent of starting
Figure 2b demonstrates that the inferred equilibrium SiO2 con-centration is independent of the initial SiO2 fluid concentration

NEWTON ET AL.: FREE ENERGY OF FORMATION OF ZIRCON56
because no systematic departures from a linear regression of
duration are therefore interpreted to be equilibrated. The aver-age solubility obtained from the 15 equilibrated experiments is 0.0686 ± 0.0071 m (1 ), corresponding to a SiO2 mole fraction of 0.00123 ± 0.00013. Standard errors in mean molality and mole fraction are 0.0018 and 0.000033, respectively.
The data on zircon solubility in H2O-NaCl solutions (Table 2) indicate that a 20% reduction in H2O mole fraction at 800 °C and 12 kbar results in nearly a 20% reduction in silica molality. The solubility of ZrO2 was not enhanced by NaCl or SiO2 (Table 3).
DISCUSSION
The new determination of aqueous SiO2 concentration in equilibrium with zircon + baddeleyite may be used with our measurements of quartz solubility (Newton and Manning 2003) to derive an accurate value of G°f,ox,zr (e.g., Hemley et al. 1977). In this derivation, it is necessary to know precisely the activity coefficient of aqueous silica at zircon saturation and at quartz
saturation, because aqueous SiO2 undergoes changes in polym-erization extent that depend on P, T, and composition (Zotov and Keppler 2000, 2002; Zhang and Frantz 2000; Newton and Manning 2002, 2003, 2008). At 800 °C and 12 kbar, aqueous SiO2 consists almost entirely of monomers and dimers, for which homogeneous equilibrium can be written as
2 SiO2(m) = Si2O4(d). (6)monomer dimer
Assuming ideal mixing, the equilibrium constant for this reaction is Kmd = Xd/X 2
m, where Xd and Xm are mole fractions of dimers and monomers. Mass balance requires that Xs = Xm + 2Xd, where Xs is the mole fraction of total SiO2. Taking the standard state of solute silica to be unit activity in the hypothetical solution of pure SiO2 monomers at fixed P and T, the equilibrium constant for Equation 6 is
KXmd
s
s s
1
2 2
(7)
where s is the activity coefficient of solute silica.Newton and Manning (2003) determined the activity coef-
ficient of aqueous silica at 800 °C and 12 kbar from low con-centration to quartz saturation from the SiO2 solubilities of four silica-buffering mineral assemblages:
Q: SiO2 = SiO2(t) (8) quartzKC: Al2SiO5 = Al2O3 + SiO2(t) (9) kyanite corundumEF: MgSiO3 = Mg2SiO4 + SiO2(t) (10) enstatite forsteriteFRG: 2 TiO2 + Mg2SiO4 = 2 MgTiO3 + SiO2(t) (11) rutile forsterite geikielite
Combination of the quartz buffer (Q, reaction 8) with any of the other silica buffers generates the relationship
G RTXXB Q
sB
sB
sQ
sQln (12)
where B represents a silica buffer [reactants = products + SiO2(t)], and G°B–Q is the difference in standard molal Gibbs free energy changes of reactions B and Q at a fixed P and T. Standard states for minerals and H2O are unit activity of the pure phase at any P and T. Given reliable G°B–Q values, the experimental solubility data for reactions 8–11 can be fitted to give s = f(Xs) (Newton and Manning 2003).
Newton and Manning (2003) found that their solubil-ity measurements corresponding to reactions 8–11 calibrate a monomer-dimer activity model with high fidelity, resulting in Kmd of 116–180 at 800 °C and 12 kbar, using mineral data of Holland and Powell (1998). Because there is equal probability of any value between the upper and lower bounds, we here adopt Kmd = 148 with = (Km
mdax
– Kmmin
d)/ 12 = 18.5. With this value, the activity coefficient for a concentration of Xs = 0.00123 ± 0.000033 (1 se), corresponding to zircon saturation, is 0.779 ± 0.018 (1 ). Thus, the solute silica at 800 °C and 12 kbar is
FIGURE 2. (a) SiO2 molality at zircon + baddeleyite at 800 °C and 12 kbar, as a function of experiment duration. Symbols show results from three different kinds of starting materials (see text). Triangle apices point in the direction of approach to equilibrium, both from undersaturated and oversaturated directions. (b) Capsule weight change vs. SiO2 added to experiment (as powdered quartz crystals) per milligram of H2O. Experiments ZR-21 and ZRS-3 omitted (see text). Regression of weight-change data constrains the best value of SiO2 solubility of zircon. The SiO2/H2O value at the null point of the ordinate gives, when multiplied by 1000/60.084, the equilibrium SiO2 molality.
NEWTON ET AL.: FREE ENERGY OF FORMATION OF ZIRCON 57
substantially polymerized (22%) even at the dilute concentration of zircon saturation. At quartz saturation, Xs = 0.0248 ± 0.00028 (Newton and Manning 2003), s = 0.307 ± 0.016, and the solution is ~70% polymerized.
The free energy of formation of zircon from the oxides at 800 °C and 12 kbar can be calculated from a version of Equation 12 written explicitly for the zircon-baddeleyite silica buffer:
G G RTXXf ox zr ZB Q
sZB
sZB
sQ
sQ, , ln (13)
which yields –18.5 kJ/mol. Uncertainties were estimated nu-merically (10 000 trials) using the following errors: Kmd = 18.5; Xs
ZB = 3.3 × 10⁻⁵; and XsQ = 2.8 × 10⁻⁴. This gave 1 = 0.33 kJ/
mol, or a 95% confidence interval of 0.65 kJ/mol. Our value for G°f,ox,zr at 800 °C and 12 kbar was referred to 1 bar and 800 °C
using the compressibility coefficients for zircon, baddeleyite, and quartz of Holland and Powell (1998) to obtain G°f,ox,zr at 1073 K of –11.9 ± 0.7 kJ/mol (errors in compressibilities ne-glected). This in turn leads to the free energy of formation of zircon from the elements, G°f,el,zr, at 25 °C, 1 bar, of –1918.3 ± 0.7 kJ/mol, using heat capacity and oxide data from Robie and Hemingway (1995).
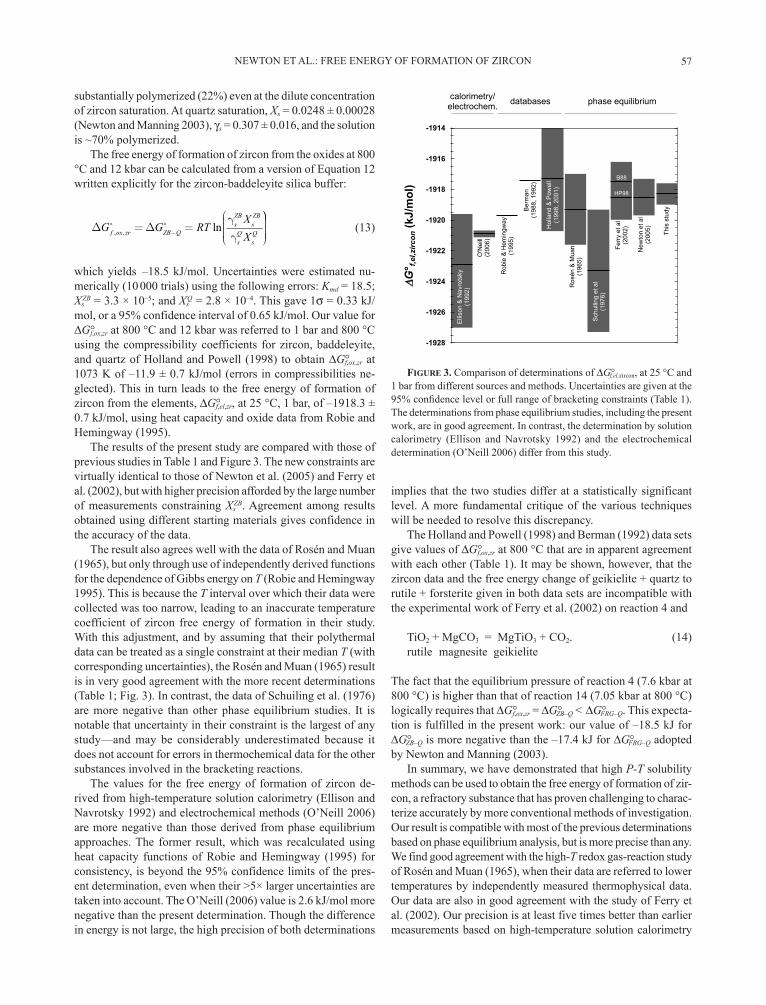
The results of the present study are compared with those of previous studies in Table 1 and Figure 3. The new constraints are virtually identical to those of Newton et al. (2005) and Ferry et al. (2002), but with higher precision afforded by the large number of measurements constraining Xs
ZB. Agreement among results obtained using different starting materials gives confidence in the accuracy of the data.
The result also agrees well with the data of Rosén and Muan (1965), but only through use of independently derived functions for the dependence of Gibbs energy on T (Robie and Hemingway 1995). This is because the T interval over which their data were collected was too narrow, leading to an inaccurate temperature coefficient of zircon free energy of formation in their study. With this adjustment, and by assuming that their polythermal data can be treated as a single constraint at their median T (with corresponding uncertainties), the Rosén and Muan (1965) result is in very good agreement with the more recent determinations (Table 1; Fig. 3). In contrast, the data of Schuiling et al. (1976) are more negative than other phase equilibrium studies. It is notable that uncertainty in their constraint is the largest of any study—and may be considerably underestimated because it does not account for errors in thermochemical data for the other substances involved in the bracketing reactions.
The values for the free energy of formation of zircon de-rived from high-temperature solution calorimetry (Ellison and Navrotsky 1992) and electrochemical methods (O’Neill 2006) are more negative than those derived from phase equilibrium approaches. The former result, which was recalculated using heat capacity functions of Robie and Hemingway (1995) for consistency, is beyond the 95% confidence limits of the pres-ent determination, even when their >5× larger uncertainties are taken into account. The O’Neill (2006) value is 2.6 kJ/mol more negative than the present determination. Though the difference in energy is not large, the high precision of both determinations
implies that the two studies differ at a statistically significant level. A more fundamental critique of the various techniques will be needed to resolve this discrepancy.
The Holland and Powell (1998) and Berman (1992) data sets give values of G°f,ox,zr at 800 °C that are in apparent agreement with each other (Table 1). It may be shown, however, that the zircon data and the free energy change of geikielite + quartz to rutile + forsterite given in both data sets are incompatible with the experimental work of Ferry et al. (2002) on reaction 4 and
TiO2 + MgCO3 = MgTiO3 + CO2. (14)rutile magnesite geikielite
The fact that the equilibrium pressure of reaction 4 (7.6 kbar at 800 °C) is higher than that of reaction 14 (7.05 kbar at 800 °C) logically requires that G°f,ox,zr = G°ZB–Q <
G°FRG–Q. This expecta-
tion is fulfilled in the present work: our value of –18.5 kJ for G°ZB–Q is more negative than the –17.4 kJ for G°FRG–Q adopted
by Newton and Manning (2003).In summary, we have demonstrated that high P-T solubility
methods can be used to obtain the free energy of formation of zir-con, a refractory substance that has proven challenging to charac-terize accurately by more conventional methods of investigation. Our result is compatible with most of the previous determinations based on phase equilibrium analysis, but is more precise than any. We find good agreement with the high-T redox gas-reaction study of Rosén and Muan (1965), when their data are referred to lower temperatures by independently measured thermophysical data. Our data are also in good agreement with the study of Ferry et al. (2002). Our precision is at least five times better than earlier measurements based on high-temperature solution calorimetry
Sch
uilin
g et
al
(197
6)
Ros
én &
Mua
n(1
965)
-1928
-1926
-1924
-1922
-1920
-1918
-1916
-1914
G° f,el,zircon
(kJ/
mol
)
calorimetry/electrochem. databases phase equilibrium
Elli
son
& N
avro
tsky
(199
2)
Rob
ie &
Hem
ingw
ay(1
995)
Hol
land
& P
owel
l(1
998,
200
1)
Ber
man
(198
8, 1
992)
Ferr
y et
al
(200
2) This
stu
dy
O'N
eill
(200
6)
New
ton
et a
l(2
005)
Newton et al., Fig. 3
HP98
B88
FIGURE 3. Comparison of determinations of G°f,el,zircon, at 25 °C and 1 bar from different sources and methods. Uncertainties are given at the
The determinations from phase equilibrium studies, including the present work, are in good agreement. In contrast, the determination by solution calorimetry (Ellison and Navrotsky 1992) and the electrochemical determination (O’Neill 2006) differ from this study.
NEWTON ET AL.: FREE ENERGY OF FORMATION OF ZIRCON58
and free energy bracketing by monotropic reactions.The present methods may be of value in defining the ther-
modynamic properties of other refractory silicates where SiO2 is the dominant solute. These may include aluminum silicates, cordierite, titanite, sapphirine, and Mg-Al and Ca-Al garnets. The precision obtainable by our methods suggests that studies of the free energy of Si-Al order-disorder and solid solution may be feasible in some mineral systems. It may be also pos-sible to characterize the energetics of radioactivity damage in metamict zircons, which would have applications to radiometric age-dating methods.
ACKNOWLEDGMENTSSupported by National Science Foundation grants EAR-0337170, EAR-
0538107, and EAR-0711521. We thank J. Schott and an anonymous reviewer for helpful comments.
REFERENCES CITED Berman, R.G. (1988) Internally-consistent thermodynamic data for minerals in the
system Na2O-K2O-CaO-MgO-FeO-Fe2O3-Al2O3-SiO2-TiO2-H2O-CO2. Journal of Petrology, 29, 445–522.
Caciagli, N.C. and Manning, C.E. (2003) The solubility of calcite in water at 5–16 kbar and 500–800 °C. Contributions to Mineralogy and Petrology, 146, 275–285.
Cherniak, D.J. and Watson, E.B. (2003) Diffusion in zircon. In J.M. Hanchar and P.W.O. Hoskin, Eds., Zircon, 53, p. 113–143. Reviews in Mineralogy and Geochemistry, Mineralogical Society of America, Chantilly, Virginia..
Davis, D.W., Williams, I.S., and Krogh, T.E. (2003) Historical development of zircon geochronology. In J.M. Hanchar and P.W.O. Hoskin, Eds., Zircon, 53, p. 145–181. Reviews in Mineralogy and Geochemistry, Mineralogical Society of America, Chantilly, Virginia.
Ellison, A.J.G. and Navrotsky, A. (1992) Enthalpy of formation of zircon. Journal of the American Ceramic Society, 75, 1430–1433.
Ferry, J.M. and Watson, E.B. (2007) New thermodynamic models and revised calibrations for the Ti-in-zircon and Zr-in-rutile thermometers. Contributions to Mineralogy and Petrology, 154, 429–437.
Ferry, J.M., Newton, R.C., and Manning, C.E. (2002) Experimental determination of the equilibria: rutile + magnesite = geikielite + CO2 and zircon + 2 magnesite = baddeleyite + 2 CO2. American Mineralogist, 87, 1342–1350.
Hanchar, J.M. and Watson, E.B. (2003) Zircon saturation thermometry. In J.M. Hanchar and P.W.O. Hoskin, Eds., Zircon, 53, p. 89–112. Reviews in Min-eralogy and Geochemistry, Mineralogical Society of America, Chantilly, Virginia.
Hanchar, J.M., Finch, R.J., Hoskin, P.W.O., Watson, E.B., Cherniak, D.J., and Mariano, A.N. (2001) Rare earth elements in synthetic zircon. 1. Synthesis and rare earth element and phosphorus doping. American Mineralogist, 86, 667–680.
Harrison T.M. and Watson, E.B. (1983) Kinetics of zircon dissolution and zirco-nium diffusion in granitic melts of variable water content. Contributions to Mineralogy and Petrology, 84, 66–72.
Hemley, J.J., Montoya, J.W., Shaw, D.R., and Luce, R.W. (1977) Mineral equi-libria in the MgO-SiO2-H2O system: II Talc-antigorite-anthophyllite-enstatite stability relations and some geological implications in the system. American Journal of Science, 277, 322–351.
Holland, T.J.B. and Powell, R. (1998) An internally consistent data set for phases of petrologic interest. Journal of Metamorphic Geology, 16, 309–343.
Hoskin, P.W.O. and Schaltegger, U. (2003) The composition of zircon and igneous
and metamorphic petrogenesis. In J.M. Hanchar and P.W.O. Hoskin, Eds., Zircon, 53, p. 27–62. Reviews in Mineralogy and Geochemistry, Mineralogical Society of America, Chantilly, Virginia.
Mäder, U.K. and Berman, R.G. (1991) An equation of state for carbon dioxide to high pressure and temperature. American Mineralogist, 76, 1547–1559.
Moriya, Y. and Navrotsky, A. (2006) High-temperature calorimetry of zirconia: heat capacity and thermodynamics of the monoclinic-tetragonal phase transition. Journal of Chemical Thermodynamics, 38, 211–223.
Newton, R.C. and Manning, C.E. (2000) Quartz solubility in H2O-NaCl and H2O-CO2 at deep crust-upper mantle pressures and temperatures: 2–15 kbar and 500–900 °C. Geochimica et Cosmochimica Acta, 64, 2993–3005.
——— (2002) Solubility of enstatite + forsterite in H2O at deep crust/upper mantle conditions: 4–15 kbar and 700–900 °C. Geochimica et Cosmochimica Acta, 66, 4165–4176.
——— (2003) Activity coefficient and polymerization of aqueous silica at 800 °C, 12 kbar, from solubility measurements on SiO2-buffering mineral assemblages. Contributions to Mineralogy and Petrology, 146, 135–143.
——— (2006) Solubilities of corundum, wollastonite and quartz in H2O-NaCl solutions at 800 °C and 10 kbar: Interactions of simple minerals with brines at high pressure and temperature. Geochimica et Cosmochimica Acta, 70, 5571–5582.
——— (2008) Solubility of corundum in the system Al2O3-SiO2-H2O-NaCl at deep-crustal metamorphic conditions: 800 °C and 10 kbar. Chemical Geol-ogy, 249, 250–261.
Newton, R.C., Manning, C.E., Hanchar, J.M., and Finch, R.J. (2005) Gibbs free energy of formation of zircon from measurements of solubility in H2O. Journal of the American Ceramic Society, 88, 1854–1858.
O’Neill, H.St.C. (1987) Quartz-fayalite-iron and quartz-fayalite-magnetite equi-libria and the free energy of formation of fayalite (Fe2SiO4) and magnetite (Fe3O4). American Mineralogist, 72, 67–75.
——— (2006) Free energy of formation of zircon and hafnon. American Miner-alogist, 91, 1134–1141.
Robie, R.A. and Hemingway, B.S. (1995) Thermodynamic properties of minerals and related substances at 298.15 K and 1 bar (105 pascals) pressure and at higher temperatures. U.S. Geological Survey Bulletin, 2131, 461 p.
Robie, R.A., Hemingway, B.S., and Fisher, I.R. (1979) Thermodynamic properties of minerals and related substances at 298.15 K and 1 bar (105 pascals) pressure and at higher temperatures. U.S. Geological Survey Bulletin, 1452, 456 p.
Rosén, E. and Muan, A. (1965) Stability of zircon in the temperature range 1180 to 1366 °C. Journal of the American Ceramic Society, 48, 603–604.
Schuiling, R.D., Vergouwen, L., and Van der Rijst, H. (1976) Gibbs energies of formation of zircon (ZrSiO4), thorite (ThSiO4), and phenacite (Be2SiO4). American Mineralogist, 61, 166–168.
Tropper, P. and Manning, C.E. (2005) Very low solubility of rutile in H2O at high pressure and temperature, and its implications for Ti mobility in subduction zones. American Mineralogist, 90, 502–505.
Watson, E.B. and Harrison, T.M. (2005) Zircon thermometer reveals minimum melting conditions on earliest Earth. Science, 308, 841–844.
Watson, E.B., Wark, D.A., and Thomas, J.B. (2006) Crystallization thermom-eters for zircon and rutile. Contributions to Mineralogy and Petrology, 151, 413–433.
Zhang, Y.G. and Frantz, J.D. (2000) Enstatite-forsterite-water equilibria at elevated temperatures and pressures. American Mineralogist, 85, 918–925.
Zotov, N. and Keppler, H. (2000) In-situ Raman spectra of dissolved silica species in aqueous fluids to 900 °C and 14 kbar. American Mineralogist, 85, 600–603.
——— (2002) Silica speciation in aqueous fluids at high pressures and high temperatures. Chemical Geology, 184, 71–82.
MANUSCRIPT RECEIVED FEBRUARY 6, 2009MANUSCRIPT ACCEPTED AUGUST 14, 2009MANUSCRIPT HANDLED BY MATTHIAS GOTTSCHALK


![monazite/zircon and futile]zircon (multiple passes - downloads](https://static.fdocuments.in/doc/165x107/6231ccd013e4e240230def43/monazitezircon-and-futilezircon-multiple-passes-downloads.jpg)